57
Introduction to the Varian ICP- MS
| Date post: | 22-Dec-2015 |
| Category: |
Documents |
| Upload: | ambrose-newman |
| View: | 240 times |
| Download: | 1 times |

Introduction to the Varian ICP-MS

What is a mass spectrometer?
The Inductively Coupled Plasma Mass Spectrometer (ICP-MS) is a fast, precise and extremely sensitive multielement analytical technique for the determination of trace elements.

What is a mass spectrometer?
The system measures elemental concentrations by, ionising the sample, then filtering each isotope by its individual atomic mass to charge ratio.

Forming the ion…
All elements are different because they have a unique atomic structure consisting of protons, electrons and neutrons.
What is an isotope?
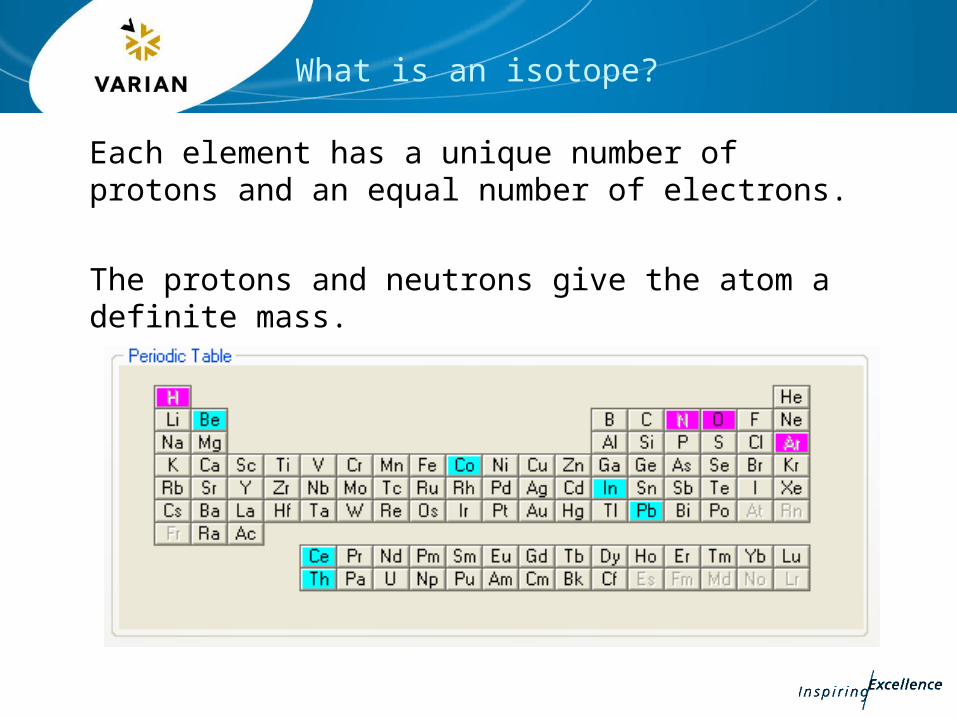
Each element has a unique number of protons and an equal number of electrons.
The protons and neutrons give the atom a definite mass.
Elemental Analysis by Mass Spectrometry
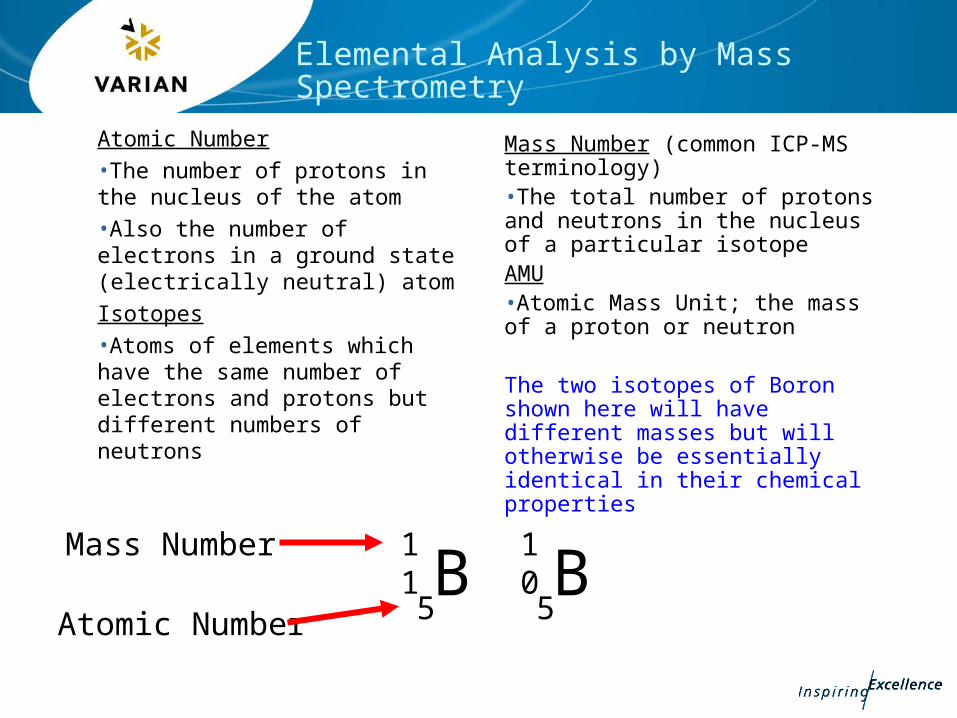
Atomic Number
•The number of protons in the nucleus of the atom
•Also the number of electrons in a ground state (electrically neutral) atom
Isotopes
•Atoms of elements which have the same number of electrons and protons but different numbers of neutrons
Mass Number (common ICP-MS terminology)•The total number of protons and neutrons in the nucleus of a particular isotopeAMU•Atomic Mass Unit; the mass of a proton or neutron
The two isotopes of Boron shown here will have different masses but will otherwise be essentially identical in their chemical properties
Mass Number
Atomic NumberB
11
5B
10
5
What is an isotope?
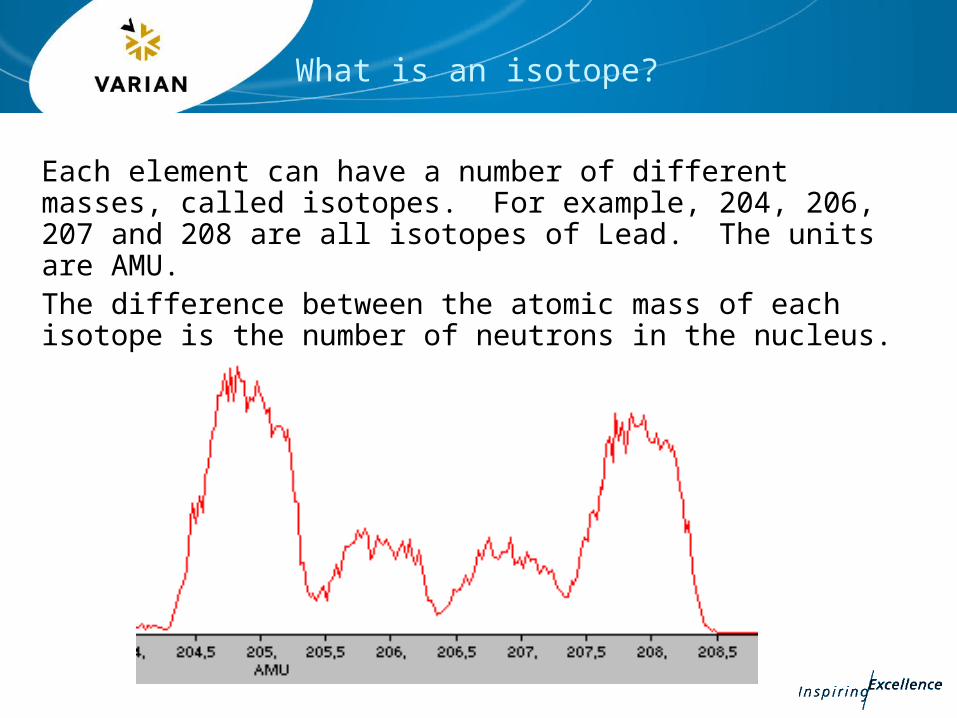
Each element can have a number of different masses, called isotopes. For example, 204, 206, 207 and 208 are all isotopes of Lead. The units are AMU.The difference between the atomic mass of each isotope is the number of neutrons in the nucleus.
What is an isotope?
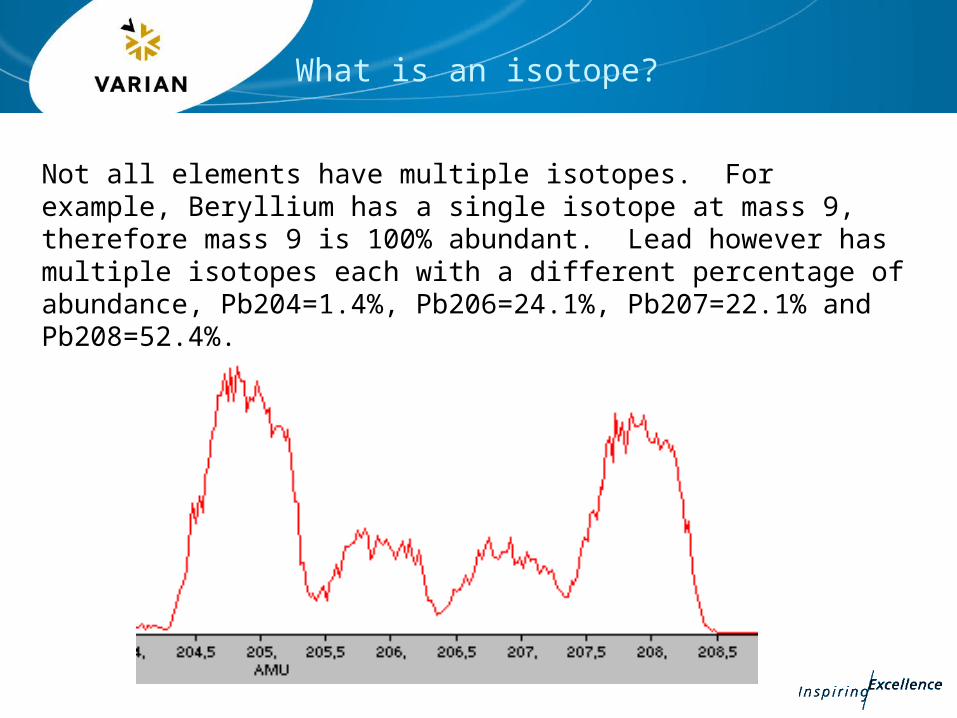
Not all elements have multiple isotopes. For example, Beryllium has a single isotope at mass 9, therefore mass 9 is 100% abundant. Lead however has multiple isotopes each with a different percentage of abundance, Pb204=1.4%, Pb206=24.1%, Pb207=22.1% and Pb208=52.4%.

Ionized State Atom
Ionization Occurs When the Energy is High Enough to Cause an Atom to Lose One or More Electrons (Electron is moved to Infinity)
B (5n, 5p, 4e)+ + e-
Neutrons
Protons
Electrons
Orbitals
Why use ions?
Ions all have the same positive charge, therefore they can be controlled using electrostatic fields.
And, as each ionised element has a unique mass it can be identified.
Basically, mass spectrometer ion optics forms the ion beam from the plasma and the quadrupole separates the ions by their individual mass to charge ratio.
Extent of Ionization
H0.1
Li100
Na100
Ru96
K100
Rb100
Cs100
Fr
Sr96(4)
Ca99(1)
Mg98
Be75
Tl100
Ra
Ba91(9)
Ac
Sc100
Y98
La90(10)
Ti99
Zr99
Hf98
Cr98
Mo98
W94
Ta95
Nb98
V99
Th100
Fe96
Re93
Tc
Mn95
Ni91
Au51
Ir
Co93
Rh94
Os78
Ag93
Cu90
Pd93
Pt62
Nd99
Ar0.04
B58
Hg38
Zn75
Cd85
C5
Si85
In99
Ga98
Al96
F9e-4
N0.1
Pb97
Sn96
Ge90
O0.1
Ne6e-6
Cl0.9
S14
Bi92
As52
Sb78
P33
Ce98(2)
Eu100
Tm91(9)
U100
Pa
Pr90(10)
Sm97(3)
Gd93(7)
Xe8.5
Kr0.6
AtPo
Te65
Se33
Br5
I29
Rn
Tb99
Dy100
Yb92(8)
Er99
Pm Ho
Np Pu Am Cm Bk Cf Es Fm Md LwNo
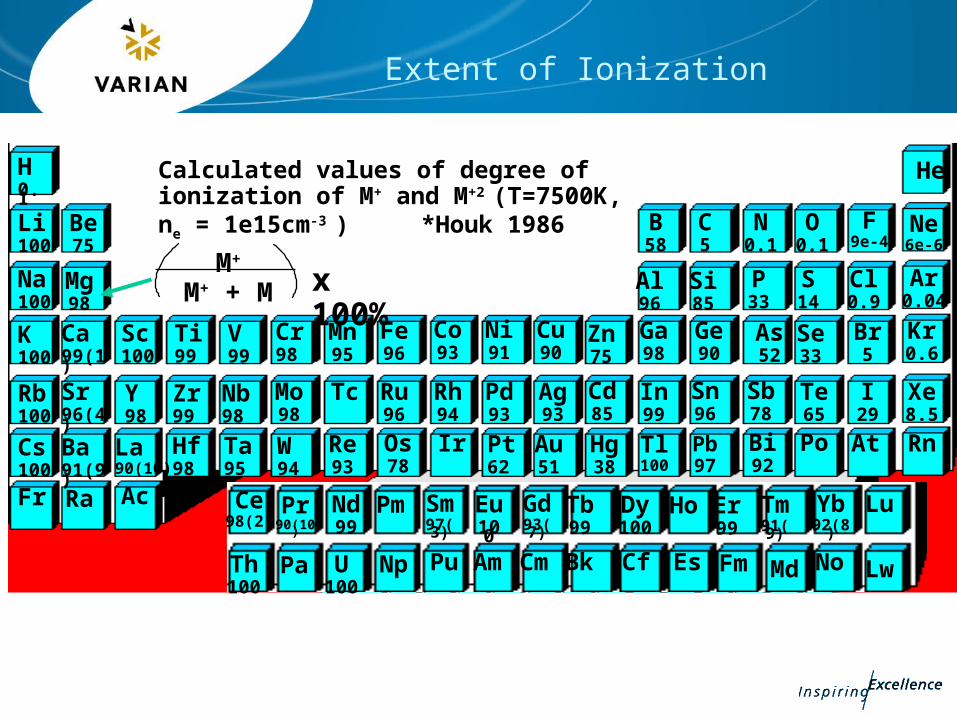
HeCalculated values of degree of ionization of M+ and M+2 (T=7500K, ne = 1e15cm-3 ) *Houk 1986
Lu
M+
M+ + M x 100%

Different elements in the periodic table are ionised with different amounts of efficiency in the argon plasma. Some elements are ionised to the +1 state almost completely, some others only have about 50% ionisation, and some even less so.

As you can see from the table, most elements are very efficiently ionised to M+ and M++ states, but a few do not ionise well at all, and these will have much lower sensitivity by the ICPMS technique.
Two of the most common examples of these poor performers are As and Se.
Some elements have almost no ionisation potential whatsoever in an argon plasma and these are essentially impossible to measure by ICPMS.
What is the plasma…
What is the plasma?
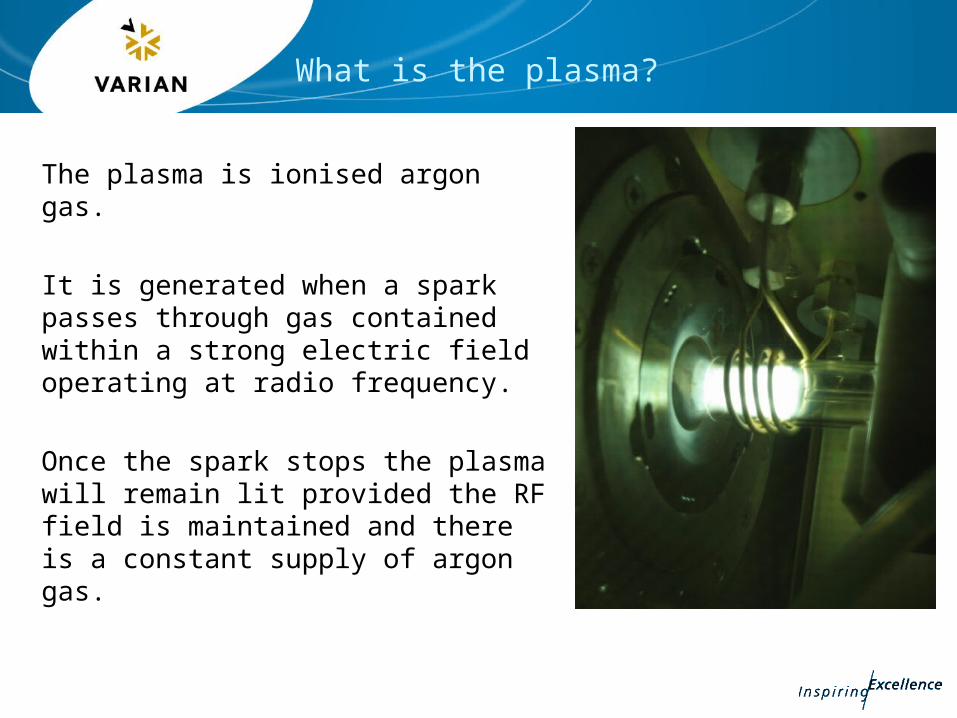
The plasma is ionised argon gas.
It is generated when a spark passes through gas contained within a strong electric field operating at radio frequency.
Once the spark stops the plasma will remain lit provided the RF field is maintained and there is a constant supply of argon gas.
Why use a plasma for MS?
The plasma is a very aggressive ion source because it is capable of operating at high temperatures of up to approximately 10,000 degrees Kelvin.
Virtually all molecules presented to the plasma are ionised making it ideal for mass spectrometry.

Any disadvantages with plasma?
Analyte ions from the sample are typically in the M+ state however some M++ are also formed. They are known as doubly charged ions.
Atomic recombinations also occur within the plasma, resulting in the formation of stable and meta-stable species.
ICP-MS is a destructive sampling technique therefore all samples presented to the plasma cannot be reused.
Any disadvantages with plasma?
Many of these species are positively charged and will therefore join the ion beam and be delivered into the mass analyser. This is a non-ideal situation because it misrepresents what is contained within the sample.
One measure of a mass spectrometer performance is its ability to provide an accurate indication of the sample whilst minimising the generation of doubly charged and oxide interferences.
Why use argon for the plasma?
ICP’s always use argon as the gas for the plasma because the ionization energy of argon gas is higher than the first ionization potential for almost all elements in the periodic table, but lower than the second ionisation potential.
Why use argon for the plasma?
This essentially means that any sample delivered into an argon plasma will have one electron removed from each atom, but the plasma does not have enough energy to remove two electrons in most cases. The result is a stream of singly-charged M+ ions being ejected from the plasma (and into the mass spectrometer).
Multi-isotope elements that are not subject to radioactive decay will have a constant, fixed ratio of their different isotopes.
This characteristic is useful to double-check the accuracy of an elemental concentration as more than one isotope should give the same answer and also to quantify an unknown signal or interference.

Peaks can be checked against “fingerprints” of known isotopic patterns to see which one they most closely match.
Some elements that are active in geological, biological or environmental processes may show slight discrepancies from the ideal isotopic ratios for that element. This data can be used to more closely investigate these processes.

Element Isotopes in ICP-MS
Example: Nickel
58Ni 60Ni 61Ni 62Ni 64Ni
No. of protons (p+) 28 28 28 28 28
No. of electrons (e-) 28 28 28 28 28
No. of neutrons (n) 30 32 33 34 36
Atomic mass (p+ + n) 58 60 61 62 63
Atomic number (p+) 28 28 28 28 28
Natural abundance 68.1% 26.2% 1.14% 3.63% 0.93%
Atomic weight 58.69

ICP-OES Spectrum for Ni
Many emission lines for Ni

The previous diagram shows the optical emission spectrum for Nickel. There are many emission lines present, some of which are fairly close together. This has two important effects.
The optical spectrometer must be well-designed to be able to separate the Ni peaks as well as any interferences from any other elements – a much more challenging problem).

Also, the energy in the plasma used to ionise the nickel atoms is dispersed amongst all these different ionic and atomic transitions – if there were fewer lines the signal would be more concentrated amongst them. Compare this with the Ni mass spectrum on the next page…

ICP-MS Spectrum for Ni
This is the mass spectrum for the five isotopes of Ni. There are far fewer lines (peaks) in this case, which makes the spectrum much simpler to interpret, and the signal to noise ratio is also better. Simpler spectra and greater sensitivity are the two key advantages of ICP-MS over ICP-OES.

The ion optics…

The ion optics system.
There are 11 lenses in the Varian ICP-MS ion optics system. Each lens operates at a DC voltage.

Ion Mirror Optics for ICP-MS
Focuses all analyte ions into the mass analyzer, irrespective of the energy spread unwanted particles
electrostatic field
Focuses all analyte ions into the mass analyzer, irrespective of the energy spread

Why have ion optics?
The DC voltages on the lenses produce a series of electric fields. They create an environment suitable for accelerating ions of all masses into the mass analyser.
The geometry of the lenses and the resultant electric fields also serve to reject photons, neutrals and solids from the sample beam.
This minimises interferences and the generation of new molecules within the system.

How are the isotopes separated?
Isotopes are separated according to their mass to charge ratio (m/z) by the quadrupole mass analyser.
At any given moment the RF and DC voltages applied to the quadrupole will create an environment suitable only for ions of a specific mass to charge ratio.

How are ions detected?
Ions are detected when they exit the quadrupole by a pulse counting ion detector.
Each ion generates electrons within the detector. The electrons are multiplied and the resultant current pulse is amplified and finally counted.
The detector also forms an integral part of the signal attenuation system. This allows the instrument to measure samples over a wide range of concentrations.
How is the spectrum formed?
The spectrometer is capable of detecting ions from mass 4 AMU to 256 AMU.
The quadrupole scans the spectrum sequentially from low mass to high mass.
The spectrometer is calibrated via the software by aspirating a solution containing known isotopes.
How is the spectrum calibrated?
Initially, mass calibration is a manual process. The operator scans two segments of the spectrum, a low mass and a high mass.
The locations of two specific peaks are found then corrected using a software algorithm to the theoretical positions.
This is followed by a similar process for several isotopes throughout the complete mass spectrum.
How is the data collected?
Data is collected in increments defined via the software by the instrument operator.
Data is collected by setting the RF and DC voltages applied to the quadrupole to suit an ion of a specific mass to charge ratio then maintaining that condition for a set time.
The amount of time spent scanning a specific mass is called the Dwell time.
How is the data collected?
The spectrum is divided into channels by the software. Each mass is divided into 40 channels.
The more data points that are selected the longer each scan will take.
The user can opt to scan segments or just single peaks, these are called segmented scans or peak hopping.

How is the data collected?
Segmented scanning methods take longer but will provide you with a peak profile.
Peak hopping methods are faster and can provide you with better scanning statistics because longer time can be spent scanning each mass.
The instrument performance test uses peak hopping mode. But to calibrate the instrument segmented scanning must be used.

All ICPMS instruments, no matter who the manufacturer is or what kinds of technology they use for the various components, all operate on the same principles and use the same general hardware (They all must have RF generators, vacuum pumps, etc etc).

ICP-MS -Overview
Sample nebulized in spraychamber Argon transports sample and sustains plasma RF generator supplies energy to induction coil Sample atomized and ionized in the plasma Ions are transmitted through the interface, most of
the gas removed Quadrupole filters the ions by mass Detector counts the ions

Atomic spectroscopy techniques
Atomic Spectroscopy Techniques
•A brief comparison of three common techniques for
the analysis of metals…
– Atomic Absorption (Flame and Furnace)
– ICP-AES
– ICP-MS
Advantages of ICP-MS
•Routine trace element analysis (ppb and below)•Fast (~simultaneous) multi element analysis•Wide range of elements (>75)•Analysis of a wide variety of sample types •A wide variety of sample introduction methods
•High sensitivity with DL’s of <1ppt for some elements in solution
•Simple spectra produced
•Isotopic analysis capability
Disadvantages of ICP-MS
•Relatively high capital cost (~2x ICPOES)
•More operator experience needed
•TDS < 0.2%
•Matrix interferences
•Isobaric interferences
•Drift
•Relatively high running costs
•Can be “too sensitive” for higher concentrations

Comparison of Techniques
ICP-MS ICP-ES GFAAS FAAS
Detection Limits Excellent Good Excellent Good
Productivity Excellent Excellent Low Good
Linear Dynamic Range 108 105 102 103
Precision 1-3% 0.3 – 2 % 1 – 5 % 0.1 – 1 %
Spectral Interferences Few Common Very Few Almost None
Chemical Interferences Moderate Few Many Many
Ionization Minimal Minimal Minimal Some
Mass Effects High on low mass
None None None
Dissolved solids 0.1 – 0.4 % 2 – 25 % Up to 20 % 0.5 – 3 %
# Elements 75 73 50 68
Sample Usage Low Medium Very Low High
Semi-Quantitative Yes Yes No No
Isotope Analysis Yes No No No
Method Development Skill required Skill required Skill required Easy
Running Costs High High Medium Low
Capital Costs Very high High Medium Low
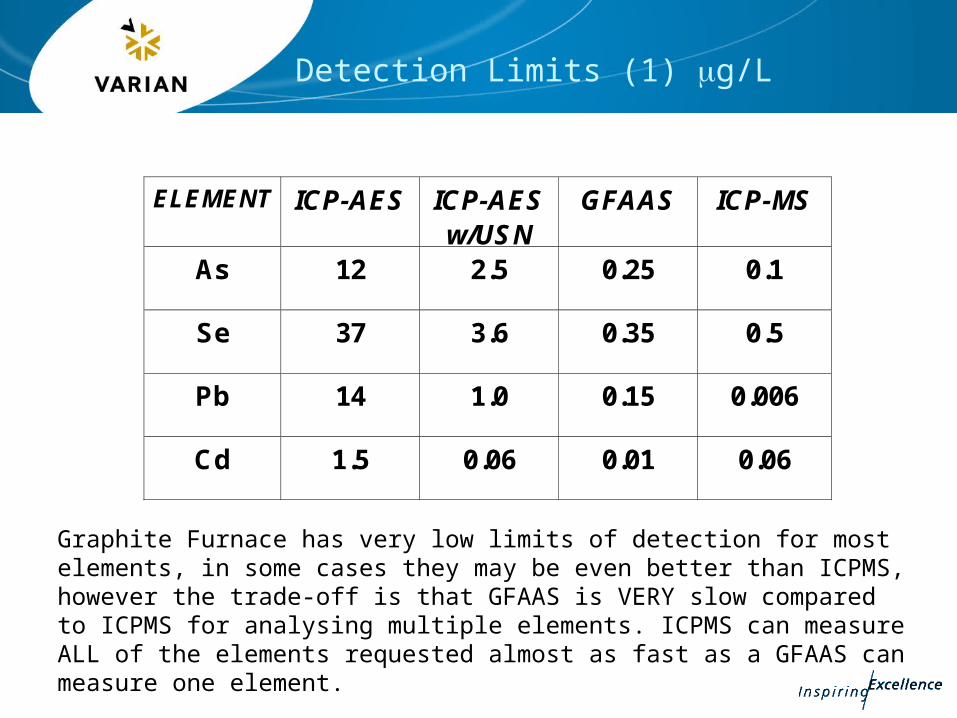
Detection Limits (1) g/L
ELEMENT ICP-AES ICP-AES w/USN
GFAAS ICP-MS
As 12 2.5 0.25 0.1
Se 37 3.6 0.35 0.5
Pb 14 1.0 0.15 0.006
Cd 1.5 0.06 0.01 0.06
Graphite Furnace has very low limits of detection for most elements, in some cases they may be even better than ICPMS, however the trade-off is that GFAAS is VERY slow compared to ICPMS for analysing multiple elements. ICPMS can measure ALL of the elements requested almost as fast as a GFAAS can measure one element.
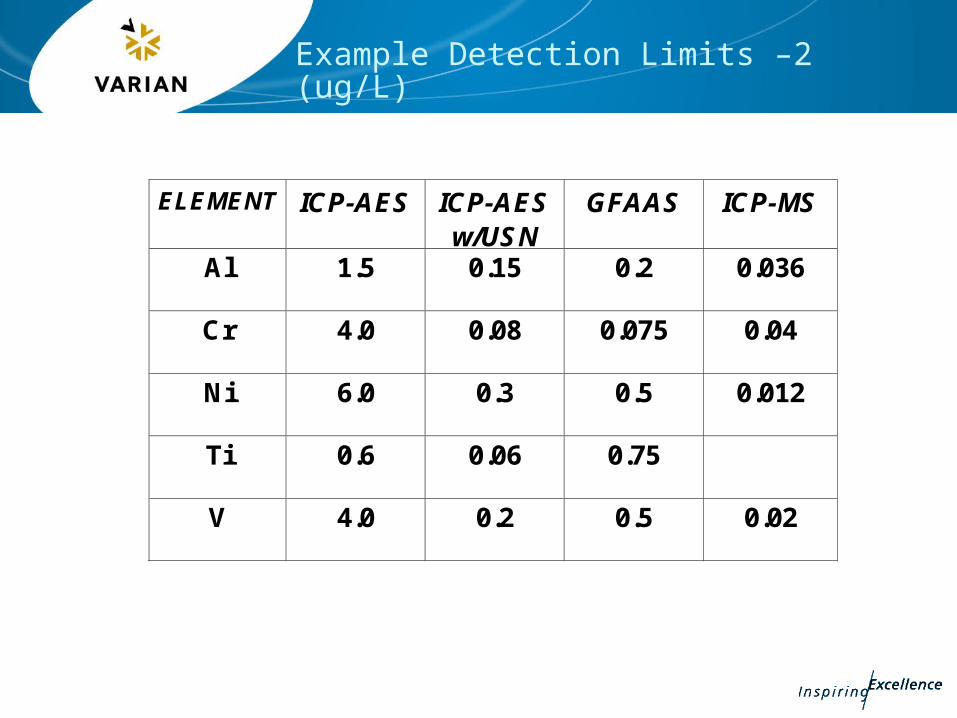
Example Detection Limits –2 (ug/L)
ELEMENT ICP-AES ICP-AES w/USN
GFAAS ICP-MS
Al 1.5 0.15 0.2 0.036
Cr 4.0 0.08 0.075 0.04
Ni 6.0 0.3 0.5 0.012
Ti 0.6 0.06 0.75
V 4.0 0.2 0.5 0.02

Location of ICP-MS components
A schematic overview of a quadrupole ICPMS (not to scale). The sample introduction,
torch, RF system, interface, vacuum system, mass spectrometer and detector can all
be see from right to left.

Why does the MS need a vacuum?
The mass spectrometer system operates within a vacuum because:
• low pressures reduce the chance that analyte ions will collide with air molecules and
• vacuum allows the system to operate with high voltages between components with small mechanical tolerances.

Tips regarding the vacuum system…
Components within the vacuum system should be kept clean and free from dust, oil and fingerprints.
Tips regarding the vacuum system…
A few pairs of gloves are provided with each instrument but you will have to include a supply in your service kit.
Source lint free nylon gloves and some powder free latex gloves. Be aware that if the gloves have been treated with some chemicals you may see these in the spectrum after you have handled the mass analyser components.
Optimisation
The instrument must be optimised in order to achieve the best results possible for analysis.
Essentially optimisation maximises the signal sensitivity whilst minimising the background counts and the formation of interferences and doubly charged ions.
Optimisation
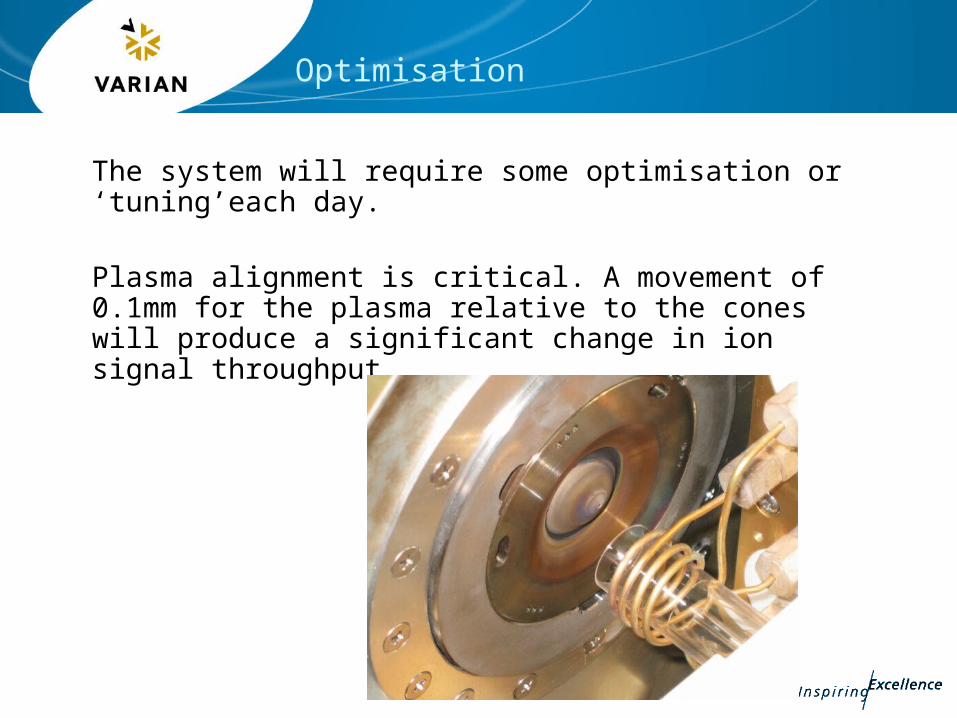
The system will require some optimisation or ‘tuning’each day.
Plasma alignment is critical. A movement of 0.1mm for the plasma relative to the cones will produce a significant change in ion signal throughput.
Optimisation
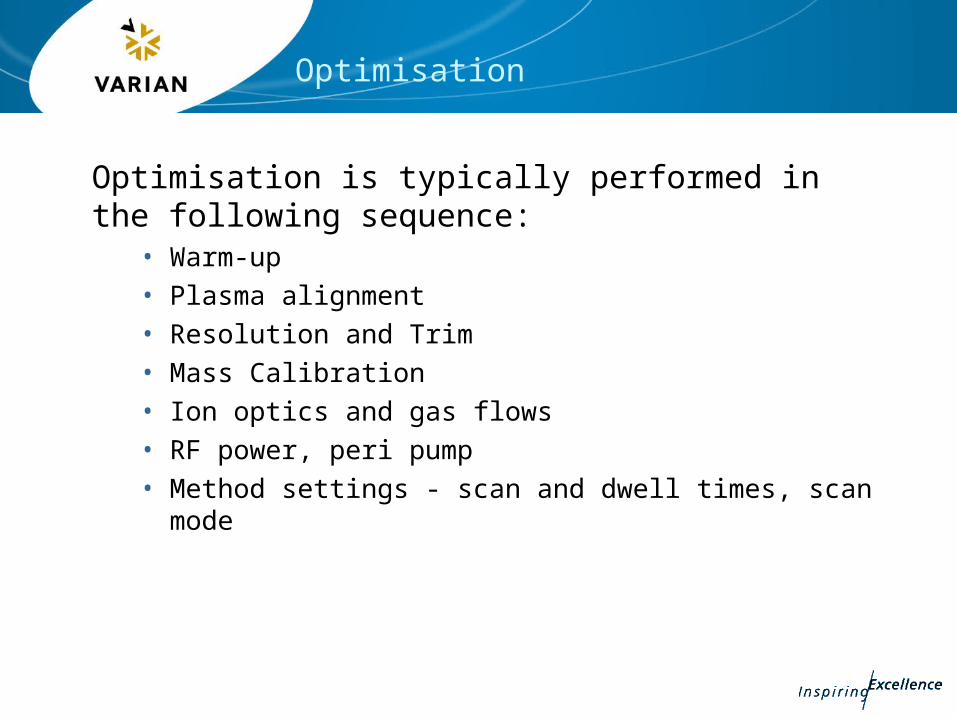
Optimisation is typically performed in the following sequence:
• Warm-up• Plasma alignment• Resolution and Trim• Mass Calibration• Ion optics and gas flows • RF power, peri pump• Method settings - scan and dwell times, scan mode

Optimisation
The system can be optimised for high and normal sensitivity modes and for hot and cold plasma.
The difference between the two modes is in the ion optics voltages, gas flows, RF power and peri pump rate. The torch position and mass calibration are the same between sensitivity modes.
Optimisation is always performed using a segmented scanning method. These are referred to as System Setup methods in the Expert software.

Cool plasma conditions• provide ultimate Detection Limit’s for elements
such as: Na, K, Ca, Fe• are tuned using similar ion optics conditions to
hot plasma high sensitivity mode, typically generating moderate sensitivity
• extends concentration range into 100’s ppm• maintains robust conditions for high matrix
samples• operates with low oxide interference's of <1%
Optimisation

Performance testing
Once the system has been optimised running a System Test worksheet will provide an indication of the instrument’s analytical performance.
A different worksheet is used for each sensitivity mode.
Review:
What is a System Setup worksheet used for?
What is a System Test worksheet used for?


