17
Introduction to Tisch Instruments John Tisch Tisch Environmental
| Date post: | 31-Dec-2015 |
| Category: |
Documents |
| Upload: | cameron-glenn |
| View: | 112 times |
| Download: | 11 times |

Introduction to Tisch Instruments
John Tisch
Tisch Environmental

2
TheβAttenuation methodTheβAttenuation methodPM2.5 Automated Dichotomous MonitorPM2.5 Automated Dichotomous Monitor
Model SPM-612DSPM-612D
■Continuous PM analyzer developed by joint patent with Japan Science and Technology Corporation■Black Carbon feature originated from work of DRI/EPA and measurement of OC/EC

3
FeaturesFeatures
Ambient PM2.5 fraction is emphasis of medical, epidemiological researchers Ambient PM10 or PM2.5 and optical black carbon can be measured simultaneously on a continuous basis. PM Coarse is calculated and reported as PM10 - PM2.5 = PMCUse of virtual impactor uses two measurements of fine and coarse particles simultaneouslyMonitor’s fluorocarbon membrane filter reduces gas, moisture effect to minimum, assures high sensitivitySample spots on fluorocarbon membrane filter are useful for analyzing ion components and metal components after mass and Carbon direct measurements

4
StructureStructure

5
Virtual ImpactorVirtual Impactor PM PM1010 and PM and PM2.52.5 Simultaneously Simultaneously

6
Validation and Calibration Device Validation and Calibration Device for Particle Size-Cut Testingfor Particle Size-Cut Testing
Particle generator and chamber test separators for size-cut and penetration curves
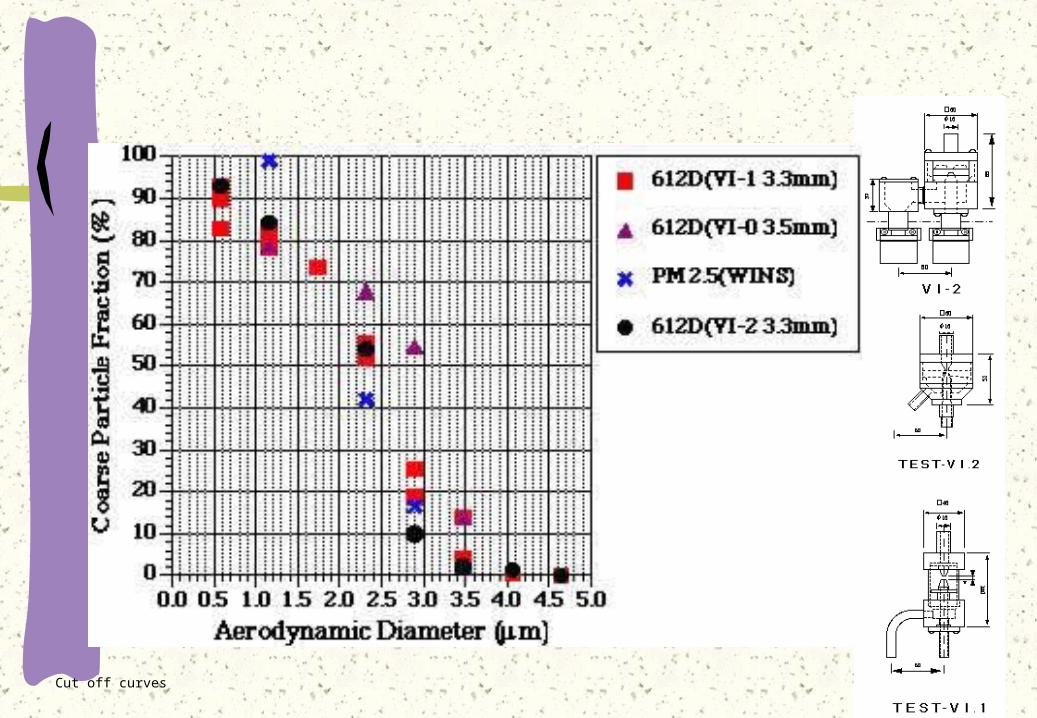
7Cut off curves

8
Fig. 1 Comparison of Virtual Impactor vs WINS Impactor. (1-hour value)
Fig. 2. Comparison of SPM-612D vs FRM sampler. (24-hour average)
WINS vs. VI and FRM vs. Continuous

9
Fig. 3. Comparison of GRIMM, TEOM (at 50 ℃ controlled) vs SPM-612D (1 hour value)
Fig. 4. Comparison of EC by carbon monitor vs OBC by SPM-612D (1 hour value)

10
Fig.5.
Plot of continuous ambient PM measurements

11Element analysis

12Time series Chemical Compositon

13Gas and Particles

14N & S

15Winter Time Series/Chemical composition

16Summer Time series/Chemical compositoin

17Sampling time comparisons


![Untitled-3 [tisch-env.com] · Copyright © 2014 Tisch International All Rights Reserved Tisch Environmental 145 S. Miami Ave Cleves, OH 45002 513-467-9000 sales@tisch-env.com www](https://static.documents.pub/doc/80x56/5ec53f1c320cc925d949c768/untitled-3-tisch-envcom-copyright-2014-tisch-international-all-rights-reserved.jpg)


