91
Toward whole-cell models for science and engineering Jonathan Karr March 9, 2015 Positions available research.mssm.edu/karr [email protected]
| Date post: | 17-Jul-2015 |
| Category: |
Science |
| Upload: | jonathan-karr |
| View: | 123 times |
| Download: | 0 times |
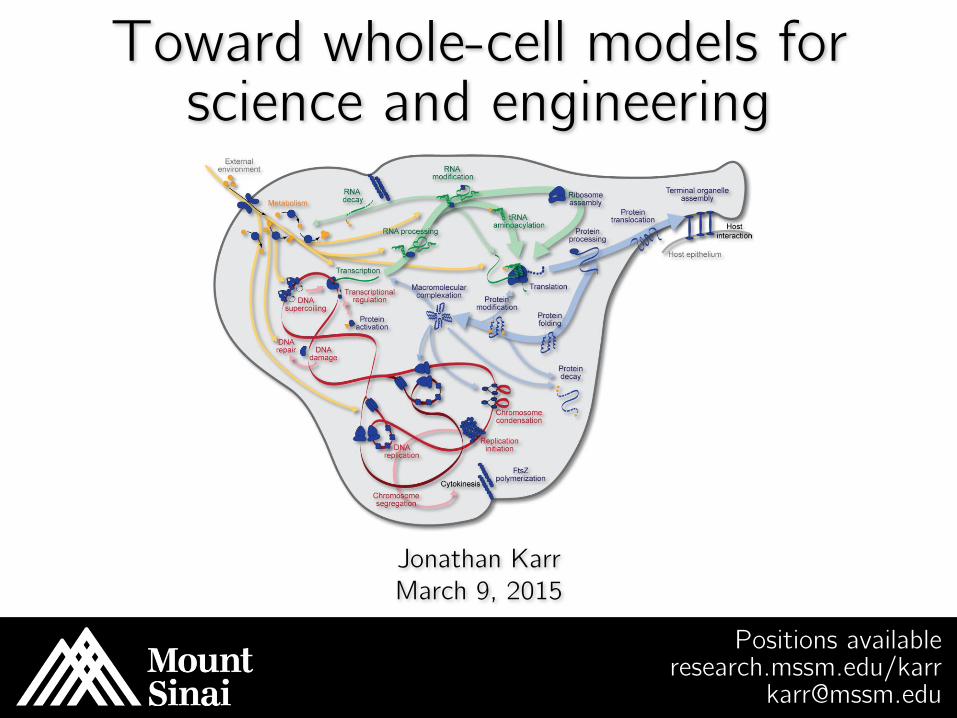
Toward whole-cell models for science and engineering
Jonathan Karr March 9, 2015
Positions available research.mssm.edu/karr
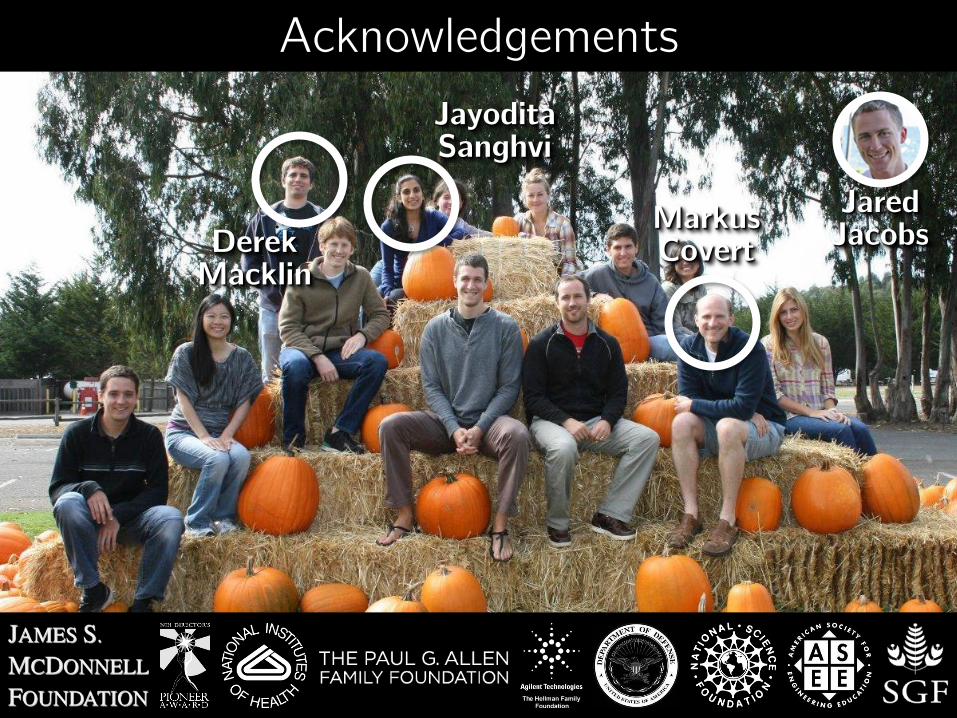
Jayodita Sanghvi
Markus Covert
Jared Jacobs Derek
Macklin
Acknowledgements

Chemicals & fuels
Optimize yield Minimize cost
Food
Optimize yield Resist drought
Prevent infection
Medicine
Predict prognoses Optimize therapy
Maximize quality of life
Central challenge: predict phenotype from genotype

Example: drug biosynthesis

Example: drug biosynthesis
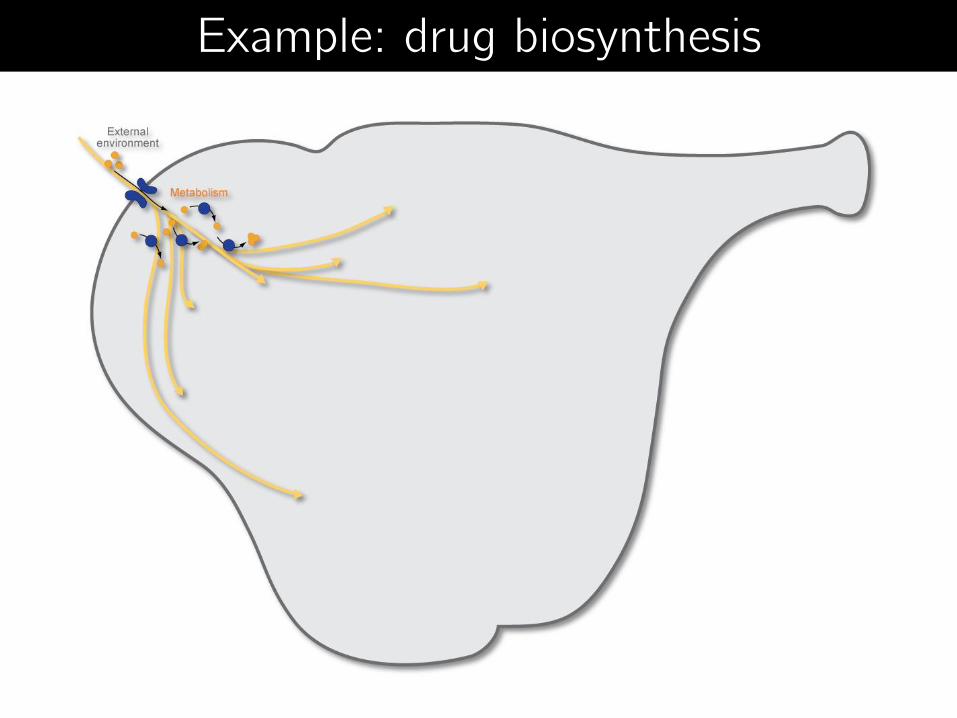
Example: drug biosynthesis
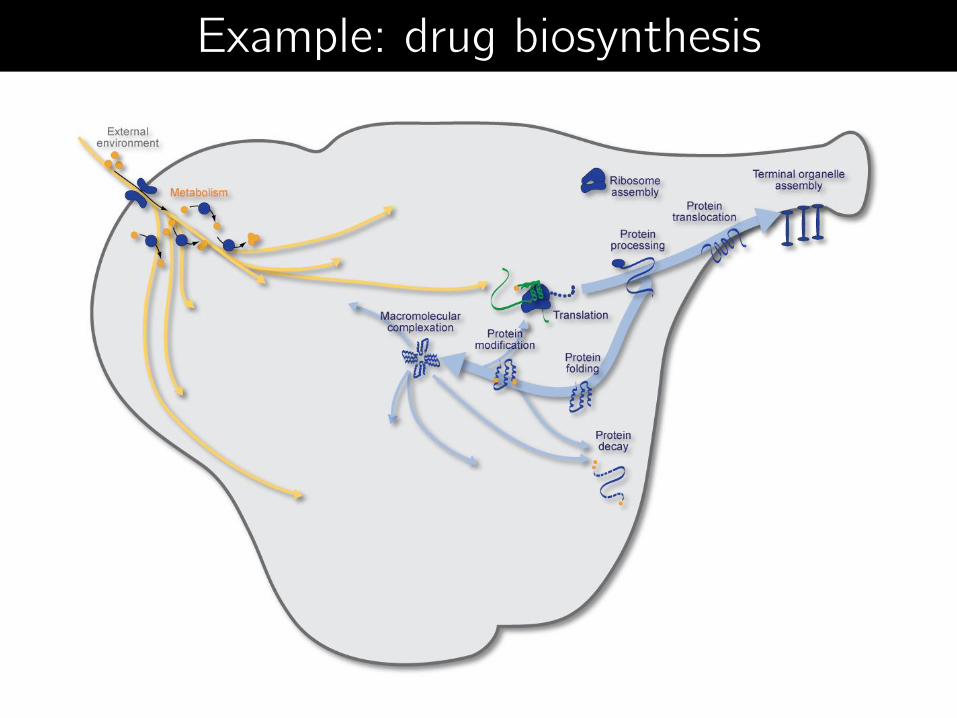
Example: drug biosynthesis
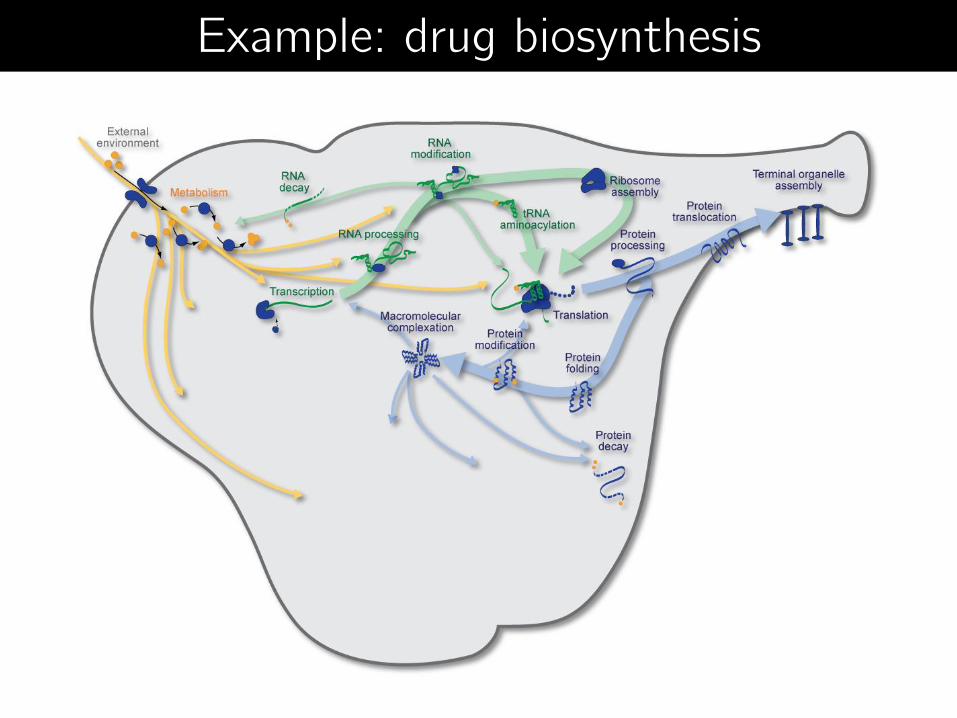
Example: drug biosynthesis

Example: drug biosynthesis
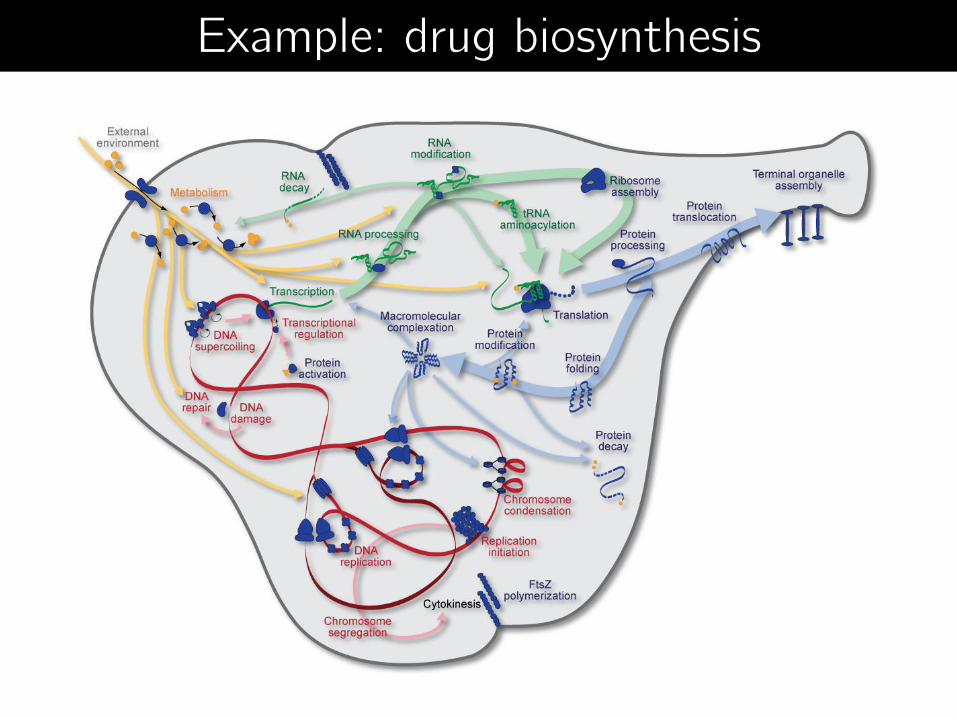
Example: drug biosynthesis

Example: drug biosynthesis
Predicting phenotype from genotype requires “whole-cell” models

Integrated
Comprehensive Dynamic
Gene-complete
Whole-cell modeling principles
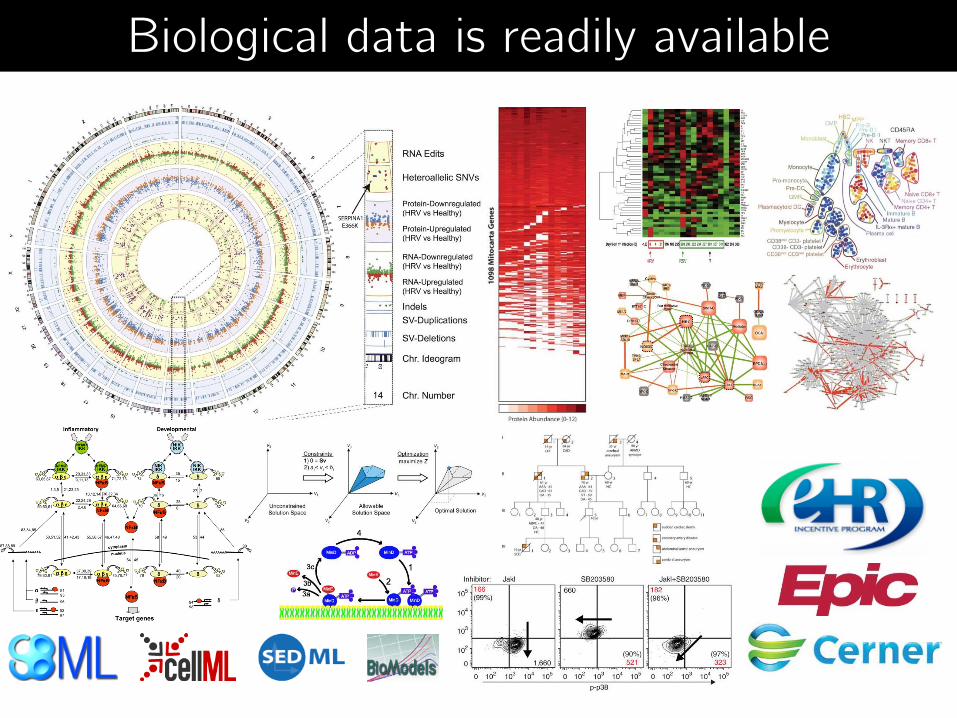
Biological data is readily available
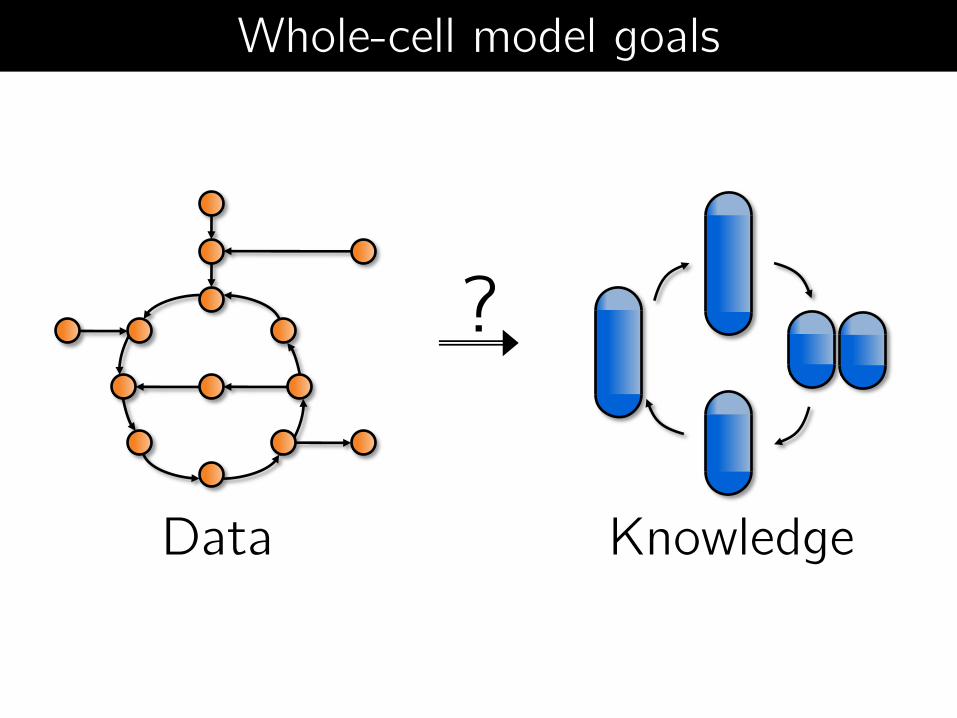
?
Data Knowledge
Whole-cell model goals
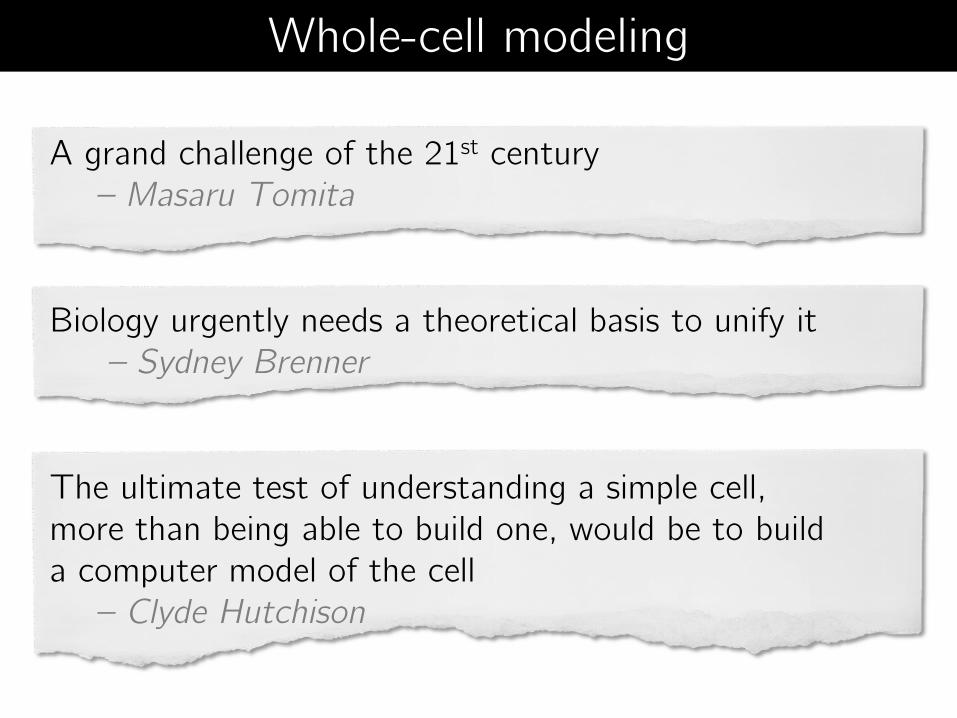
Whole-cell modeling
A grand challenge of the 21st century – Masaru Tomita
Biology urgently needs a theoretical basis to unify it – Sydney Brenner
The ultimate test of understanding a simple cell, more than being able to build one, would be to build a computer model of the cell – Clyde Hutchison
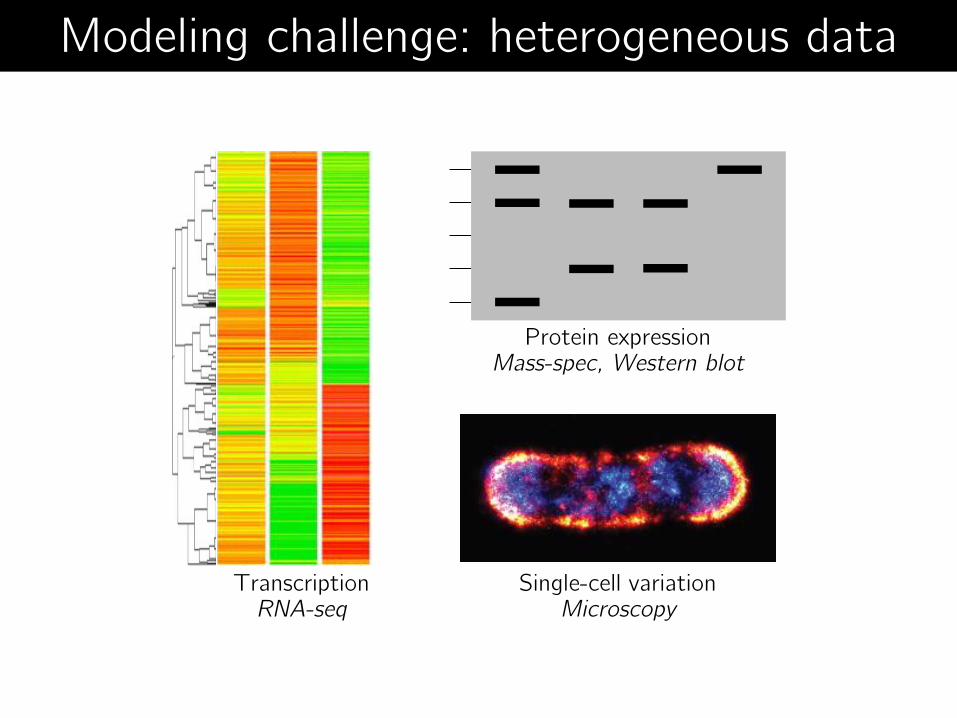
Single-cell variation Microscopy
Transcription RNA-seq
Protein expression Mass-spec, Western blot
Modeling challenge: heterogeneous data
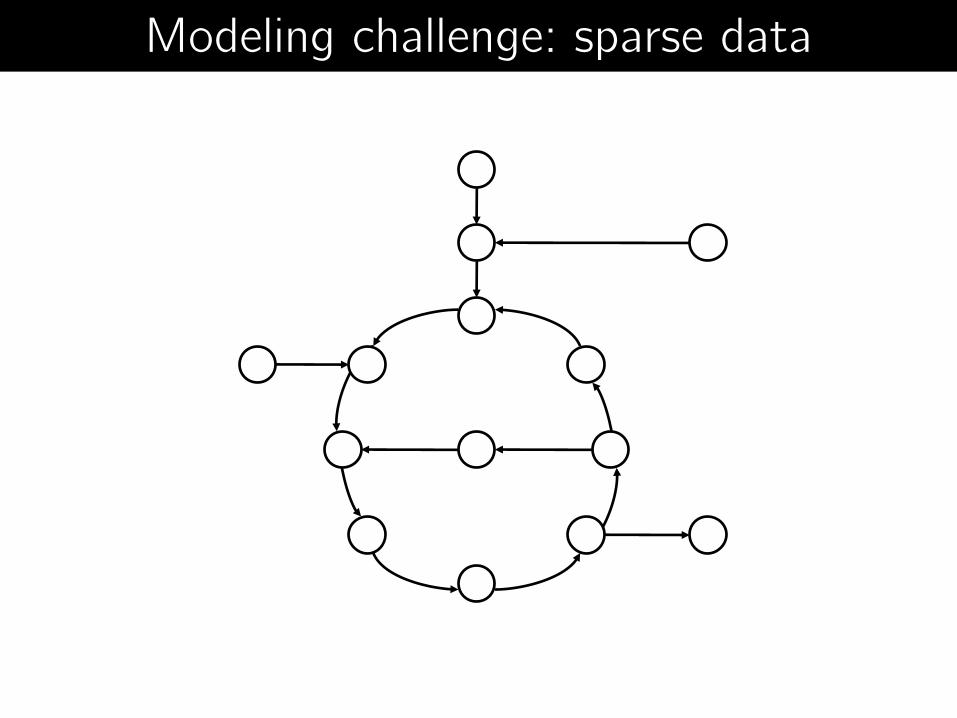
Modeling challenge: sparse data
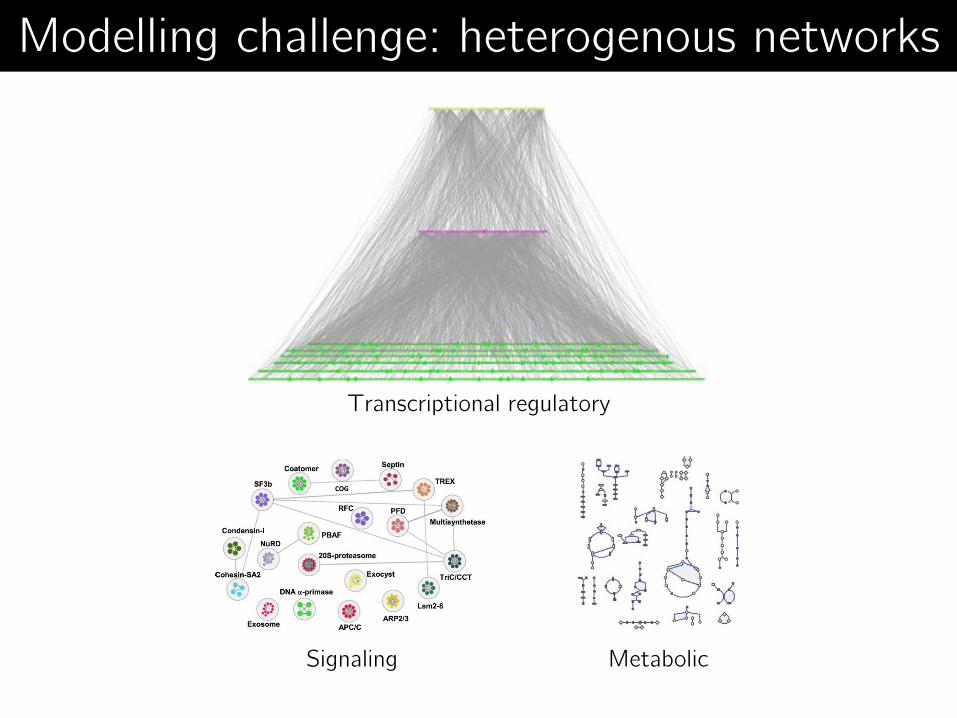
Metabolic Signaling
Transcriptional regulatory
Modelling challenge: heterogenous networks
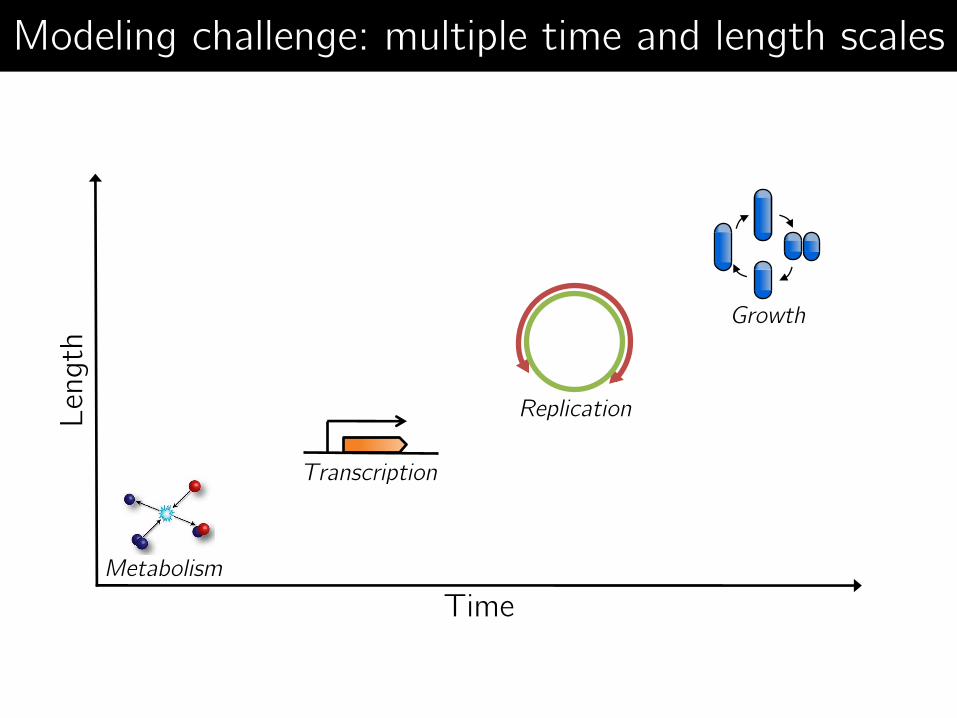
Time
Len
gth
Replication
Growth
Transcription
Metabolism
Modeling challenge: multiple time and length scales
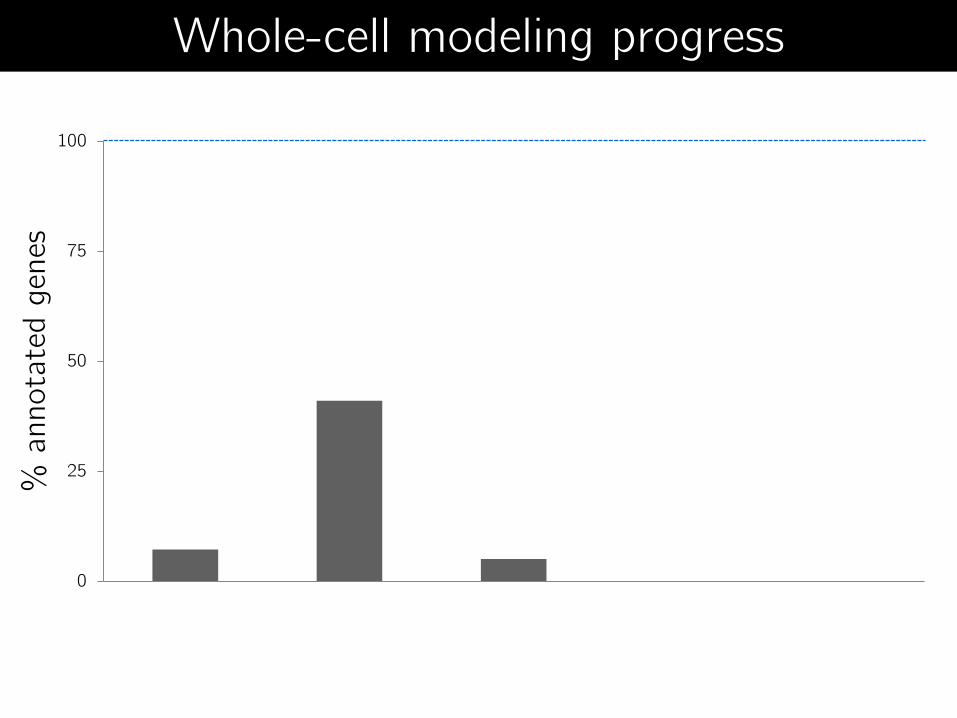
0
25
50
75
100
1970's
Coarse-grained
ODEs
1990's
FBA
2000's
Boolean
models
2008
iFBA
2012
Whole-cell
model
% a
nnota
ted g
enes
Whole-cell modeling progress
v v v v v

Predictive modeling methodologies
Granularity
Sco
pe
ODE
SDE
FBA
Boolean
Bayesian
Gillespie
PDE
Whole-cell model
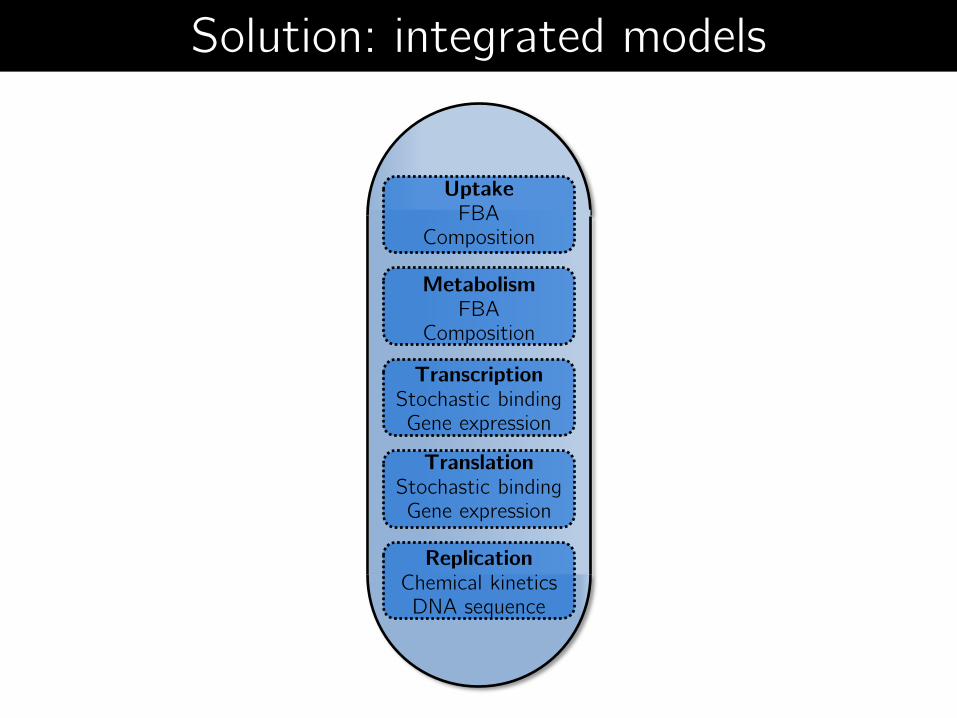
Uptake FBA
Composition
Metabolism FBA
Composition
Transcription Stochastic binding Gene expression
Translation Stochastic binding Gene expression
Replication Chemical kinetics DNA sequence
Solution: integrated models

0
25
50
75
100
1970's
Coarse-grained
ODEs
1990's
FBA
2000's
Boolean
models
2008
iFBA
2012
Whole-cell
model
% a
nnota
ted g
enes
Whole-cell modeling progress
v v
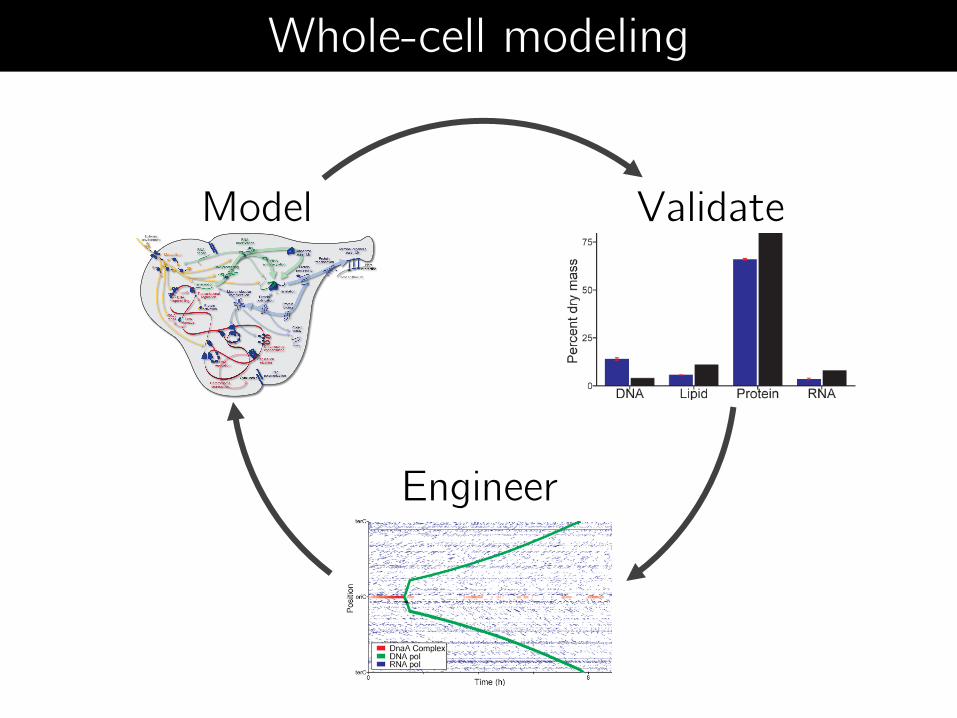
Model Validate
Engineer
Whole-cell modeling

Validate
Engineer
Model
Whole-cell modeling
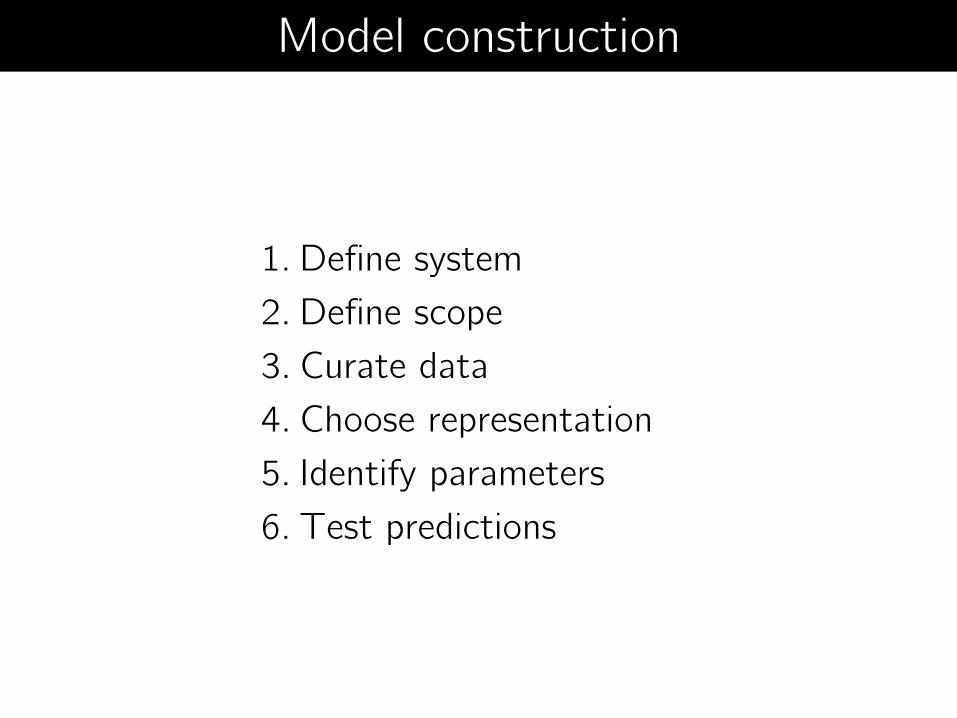
Model construction
1. Define system
2. Define scope
3. Curate data
4. Choose representation
5. Identify parameters
6. Test predictions

E. coli M. genitalium
Genome 4700 kb 580 kb
Genes 4461 525
Size 2 μm × 0.5 μm 0.2-0.3 μm
1. Select a tractable model organism

Comparative genomics Fraiser et. al, 1995
Genome-wide essentiality Glass et. al, 1999
M. genitalium is well-characterized
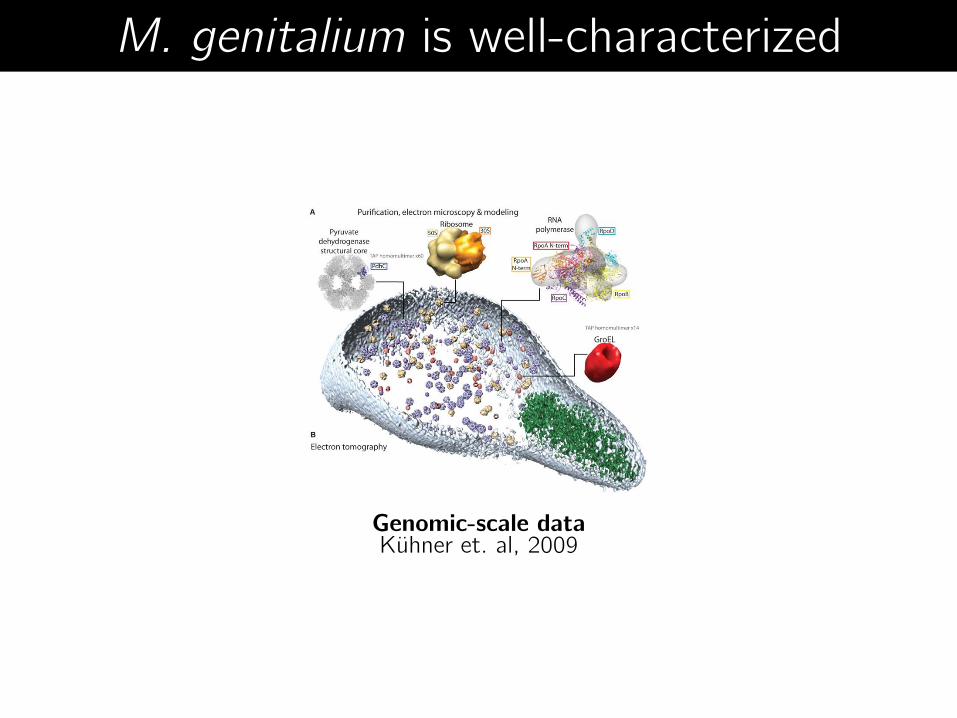
Genomic-scale data Kühner et. al, 2009
M. genitalium is well-characterized
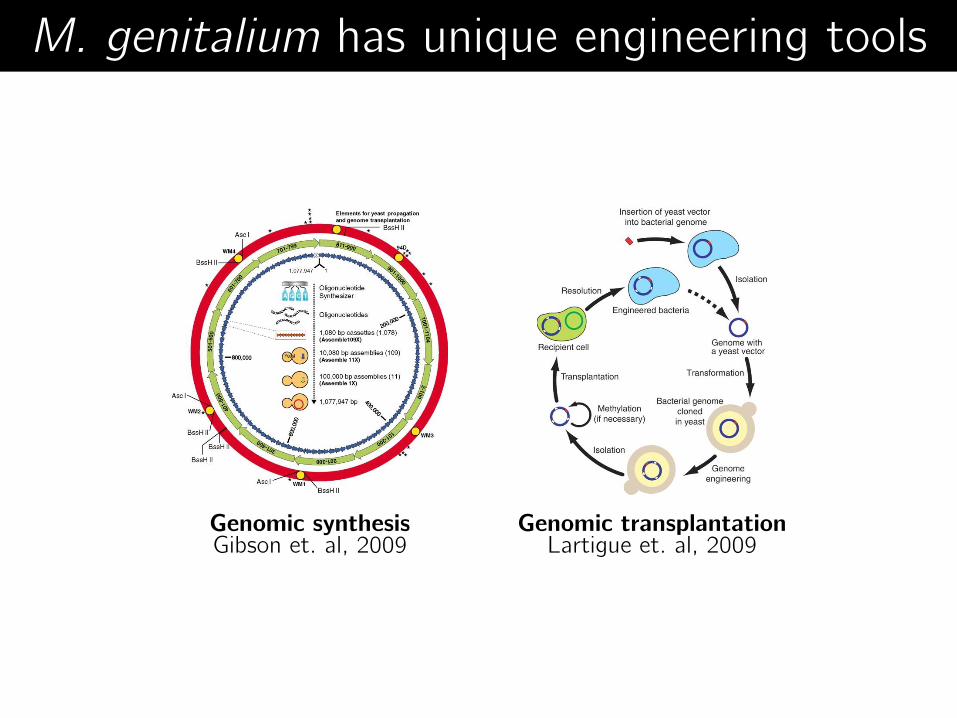
Genomic transplantation Lartigue et. al, 2009
Genomic synthesis Gibson et. al, 2009
M. genitalium has unique engineering tools

2. Choose model scope
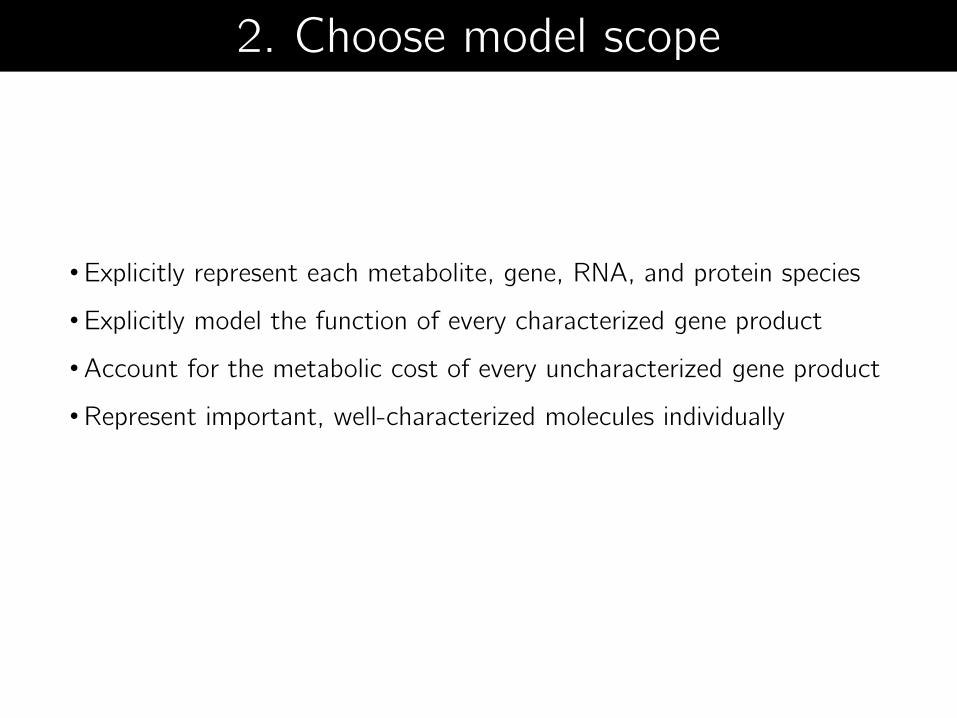
2. Choose model scope
• Explicitly represent each metabolite, gene, RNA, and protein species
• Explicitly model the function of every characterized gene product
•Account for the metabolic cost of every uncharacterized gene product
•Represent important, well-characterized molecules individually

3. Broadly curate experimental data
Karr et al., 2013
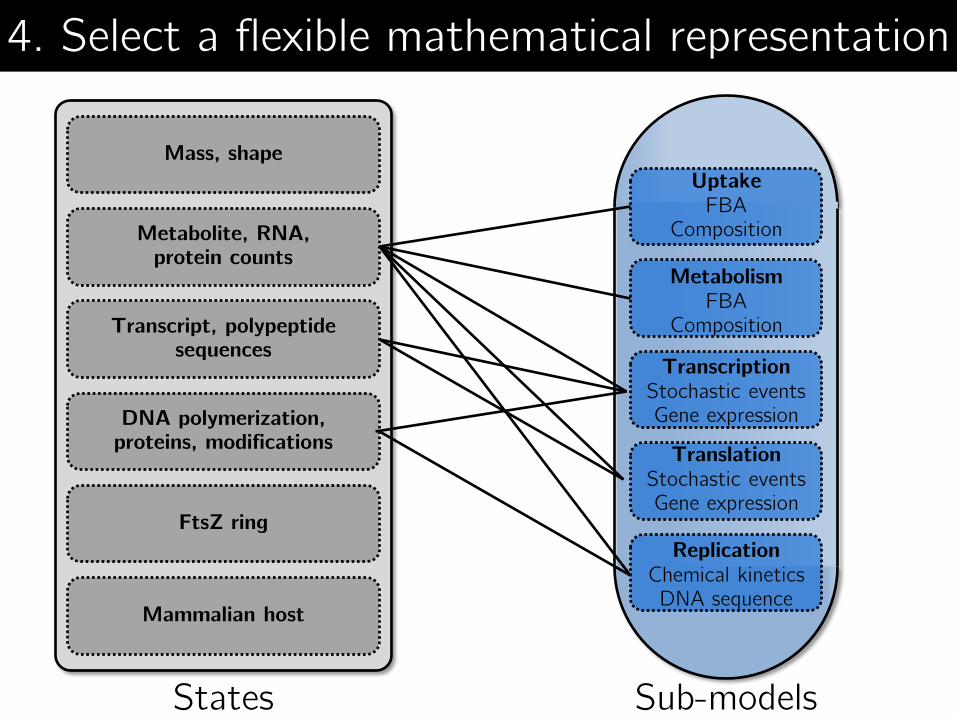
Uptake FBA
Composition
Metabolism FBA
Composition
Transcription Stochastic events Gene expression
Translation Stochastic events Gene expression
Replication Chemical kinetics DNA sequence
Sub-models States
4. Select a flexible mathematical representation
Mass, shape
Metabolite, RNA, protein counts
Mammalian host
Transcript, polypeptide sequences
DNA polymerization, proteins, modifications
FtsZ ring

1 s
Simulation algorithm
Uptake
Metabolism
Transcription
Translation
Replication
Cel
l st
ates
Cel
l st
ates
Uptake
Metabolism
Transcription
Translation
Replication
Cel
l st
ates
Uptake
Metabolism
Transcription
Translation
Replication

DNA RNA Protein Other
Rep
licat
ion
Rep
Initia
tion
Super
coiling
Conden
sation
Seg
regat
ion
Dam
age
Rep
air
Tra
ns
Reg
T
ransc
ription
Pro
cess
ing
Modific
atio
n
Am
inoac
ylat
ion
Deg
radat
ion
Tra
nslat
ion
Pro
cess
ing I
Tra
nsloca
tion
Pro
cess
ing II
Fold
ing
Modific
atio
n
Com
ple
xation
Rib
oso
me
Ter
m O
rg
Act
ivat
ion
Deg
radat
ion
Met
abolis
m
Shap
e
Fts
Z
Cyt
oki
nes
is
DN
A
Replication
Rep Initiation Supercoiling
Condensation Segregation
Damage Repair
Trans Reg
RN
A Transcription
Processing
Modification
Aminoacylation Degradation l,
Pro
tein
Translation
Processing I Translocation Processing II
Folding
Modification Complexation
Ribosome
Term Org # Activation
Degradation l, #
Oth
er Metabolism
Shape FtsZ
Cytokinesis
Many resources are shared

Many resources are shared

1 s
Uptake
Metabolism
Transcription
Translation
Replication
Cel
l st
ates
Cel
l st
ates
Uptake
Metabolism
Transcription
Translation
Replication
Cel
l st
ates
Uptake
Metabolism
Transcription
Translation
Replication
Div
ide
stat
e
Div
ide
stat
e
Div
ide
stat
e
Simulation algorithm
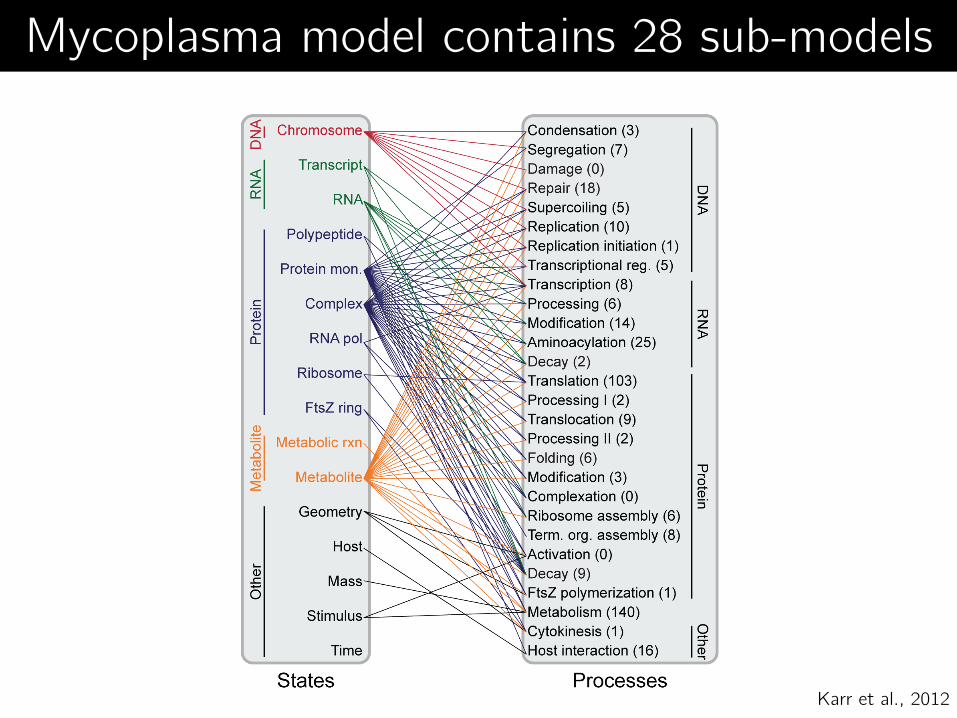
Mycoplasma model contains 28 sub-models
Karr et al., 2012
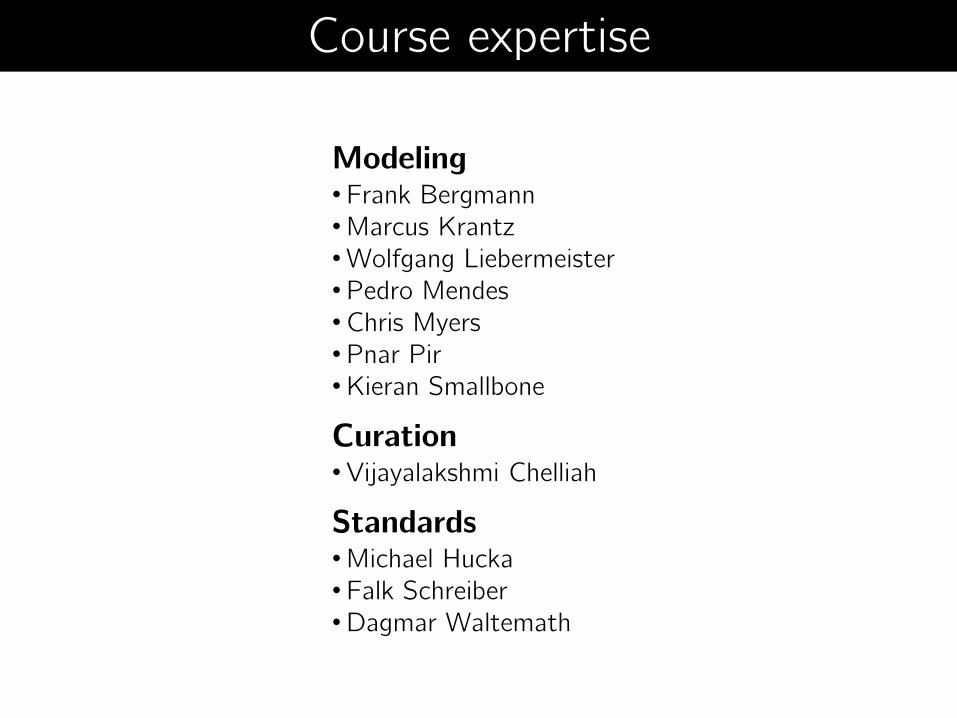
Course expertise
Modeling • Frank Bergmann •Marcus Krantz •Wolfgang Liebermeister •Pedro Mendes •Chris Myers •Pnar Pir •Kieran Smallbone
Curation •Vijayalakshmi Chelliah
Standards •Michael Hucka • Falk Schreiber •Dagmar Waltemath
Karr et al., 2012
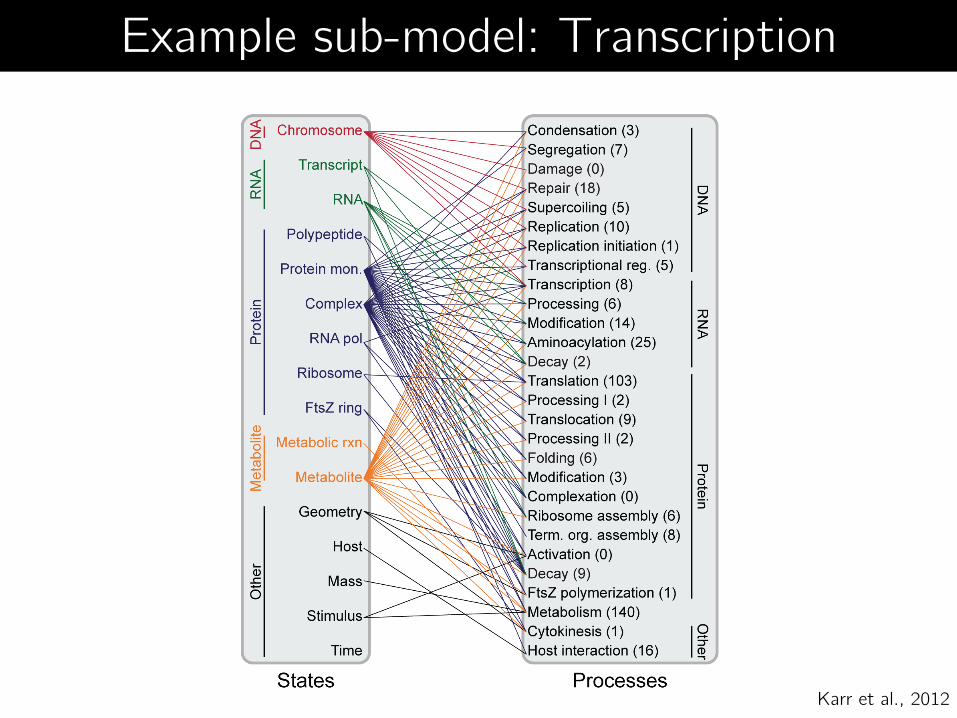
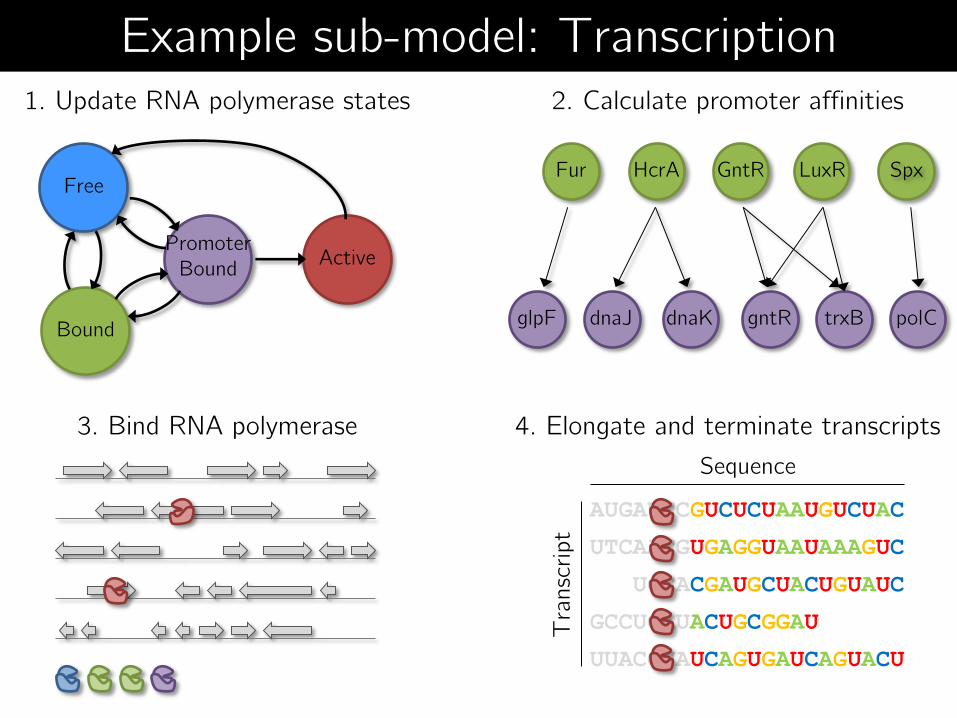
Example sub-model: Transcription

Example sub-model: Transcription
Karr et al., 2012
Free
Bound
Promoter Bound
Active
1. Update RNA polymerase states
3. Bind RNA polymerase
2. Calculate promoter affinities
4. Elongate and terminate transcripts
AUGAUCCGUCUCUAAUGUCUAC
UTCAACGUGAGGUAAUAAAGUC
UCCACGAUGCUACUGUAUC
GCCUCAUACUGCGGAU
UUACGUAUCAGUGAUCAGUACU
Sequence
Tra
nsc
ript
HcrA Spx Fur GntR LuxR
glpF dnaJ dnaK gntR trxB polC
Example sub-model: Transcription
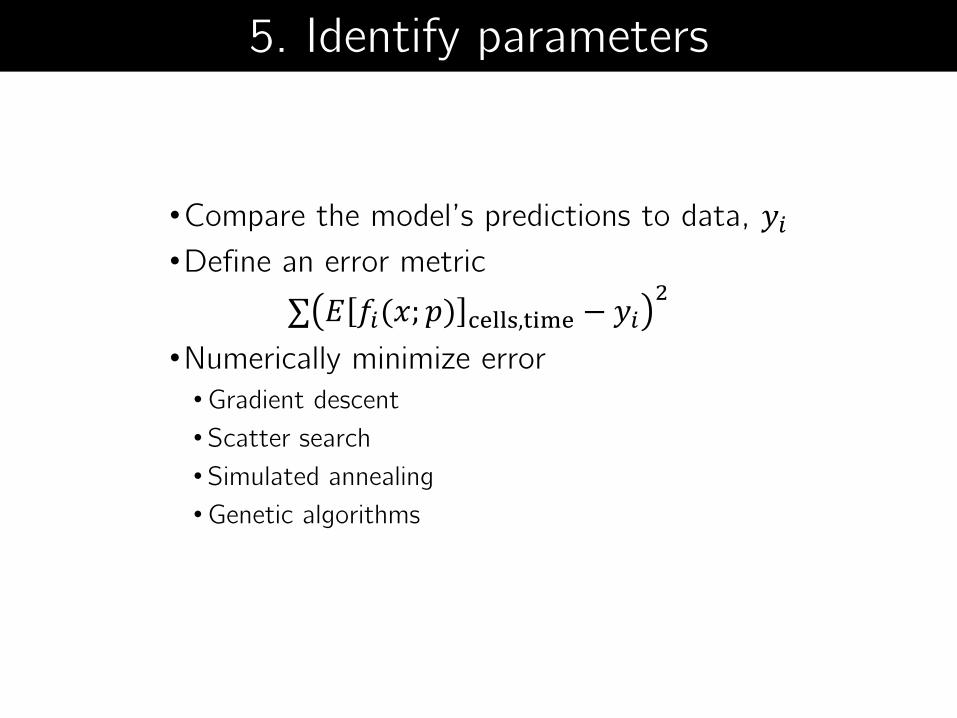
•Compare the model’s predictions to data, 𝑦𝑖
•Define an error metric
∑ 𝐸 𝑓𝑖(𝑥; 𝑝) cells,time − 𝑦𝑖2
•Numerically minimize error •Gradient descent
• Scatter search
• Simulated annealing
•Genetic algorithms
5. Identify parameters
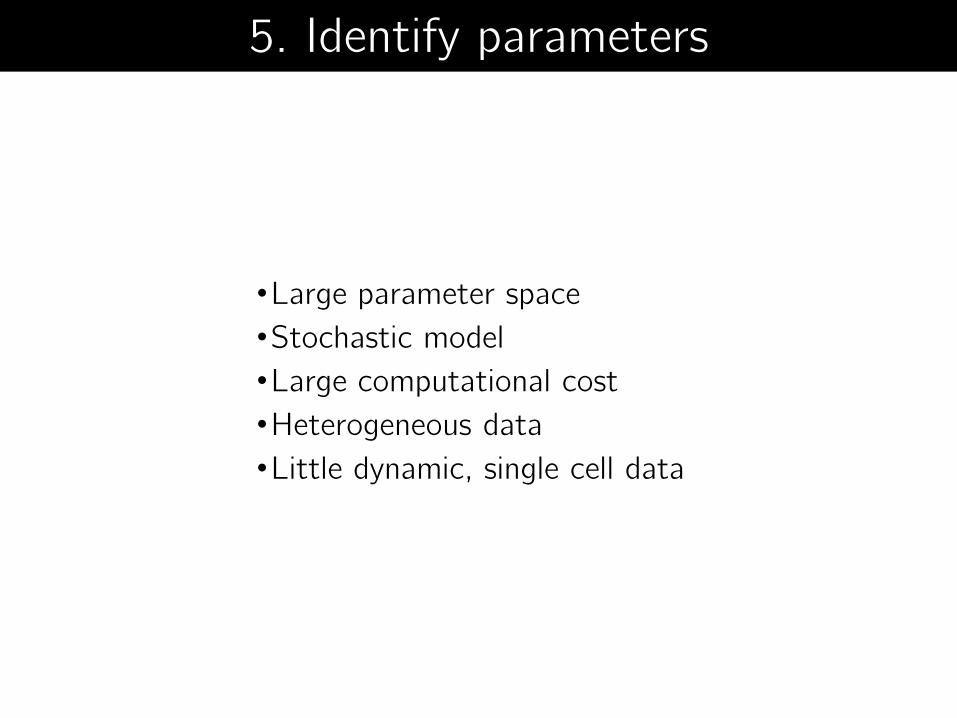
•Large parameter space
•Stochastic model
•Large computational cost
•Heterogeneous data
•Little dynamic, single cell data
5. Identify parameters
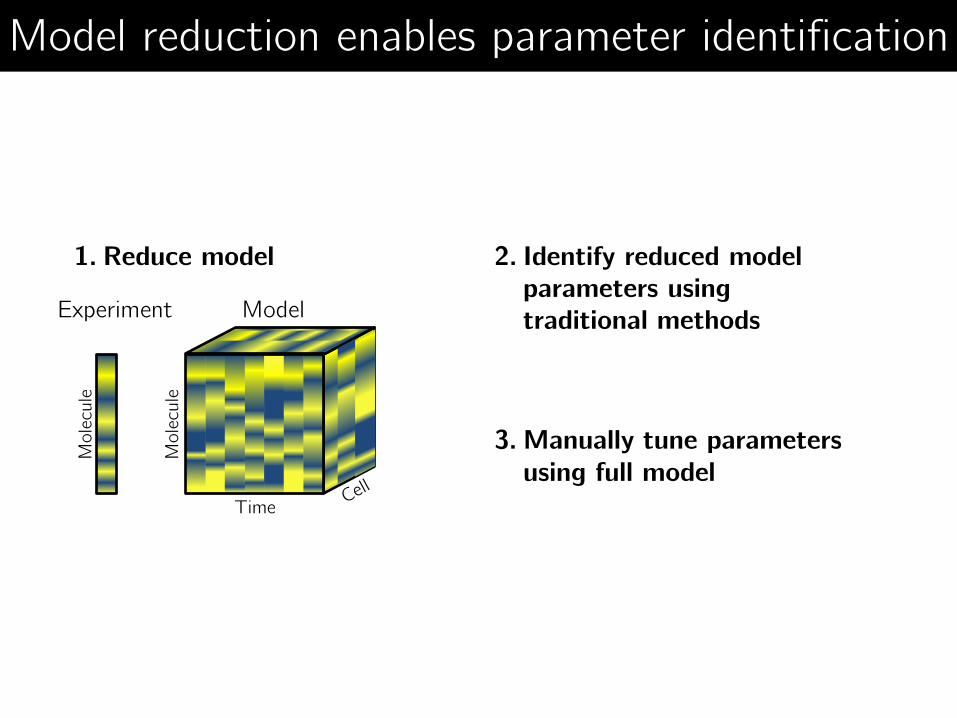
Model reduction enables parameter identification
3. Manually tune parameters using full model
1. Reduce model
Time
Model Experiment
Mole
cule
Mole
cule
2. Identify reduced model parameters using traditional methods
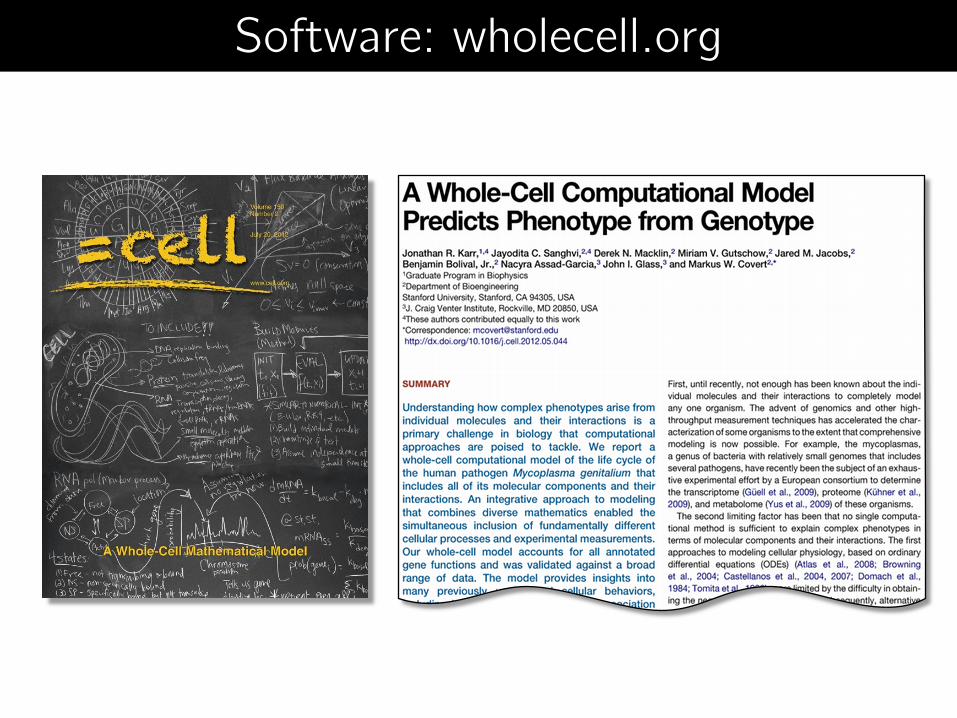
Software: wholecell.org

•ODE models • COPASI: copasi.org
• V-Cell: nrcam.uchc.edu
• Systems biology toolbox
•Boolean models • CellNOpt
• Flux-balance analysis • openCOBRA: opencobra.sourceforge.net
• RAVEN
• Integrative models • E-Cell: e-cell.org
• Whole-cell: wholecell.org
• Standards • SBML: sbml.org
• CellML: cellml.org
Software
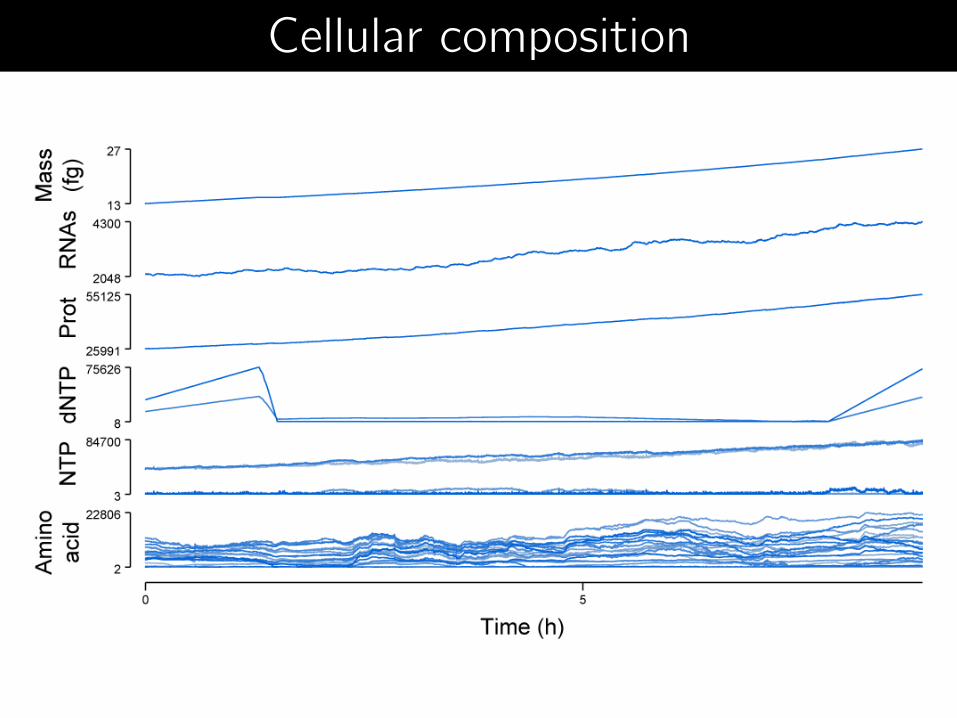
Cellular composition

Metabolite concentrations

mRNA, protein copy numbers
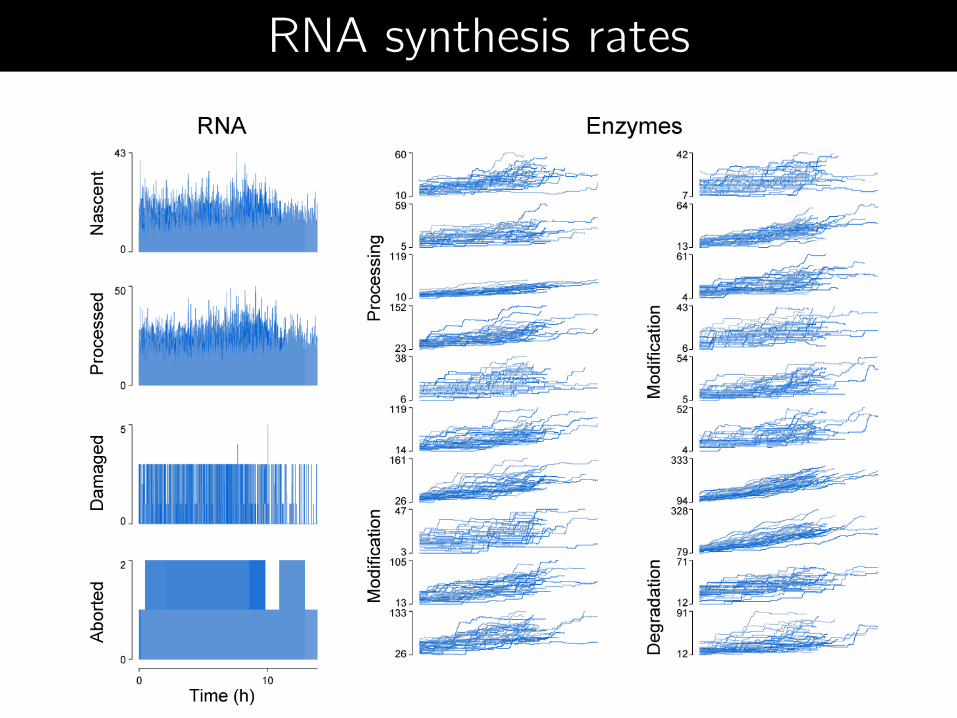
RNA synthesis rates
Karr et al., 2012
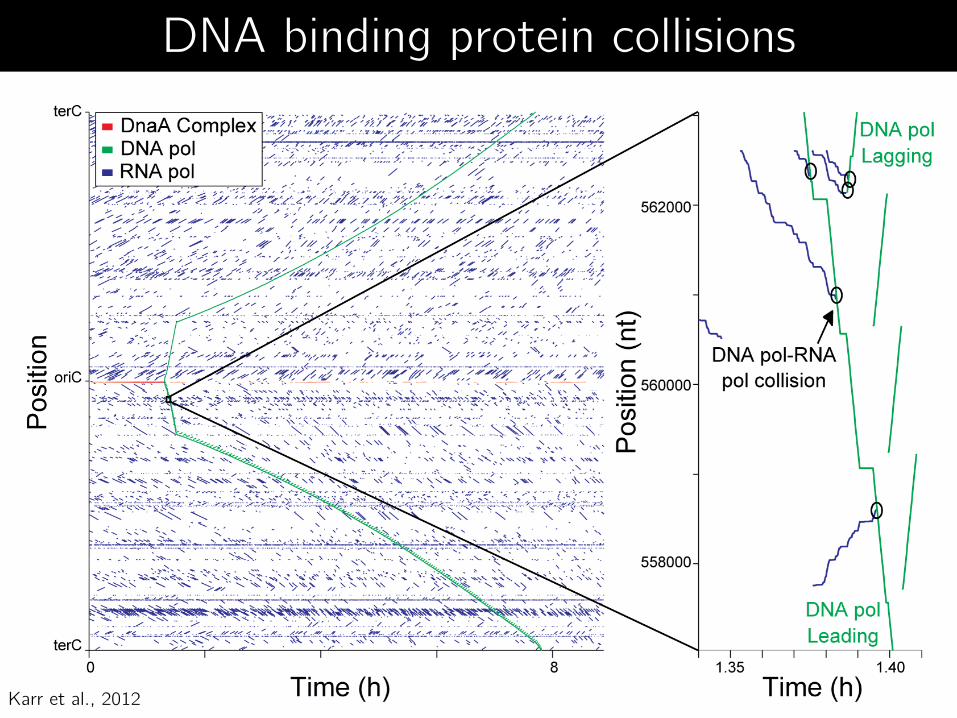
DNA binding protein collisions

Karr et al., 2012
DNA binding
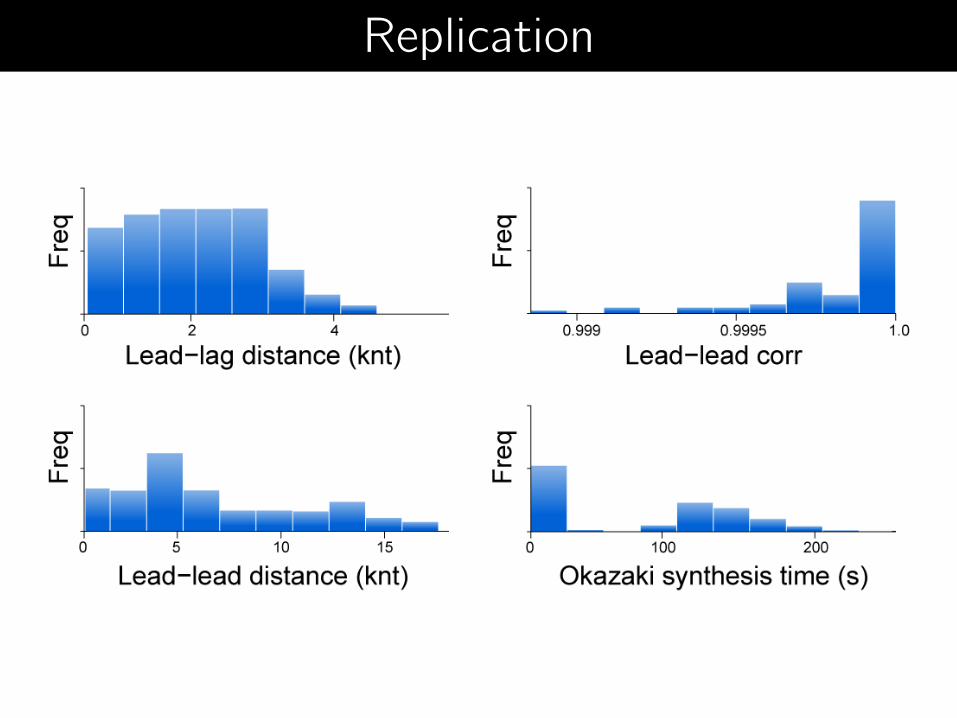
Replication

Translation

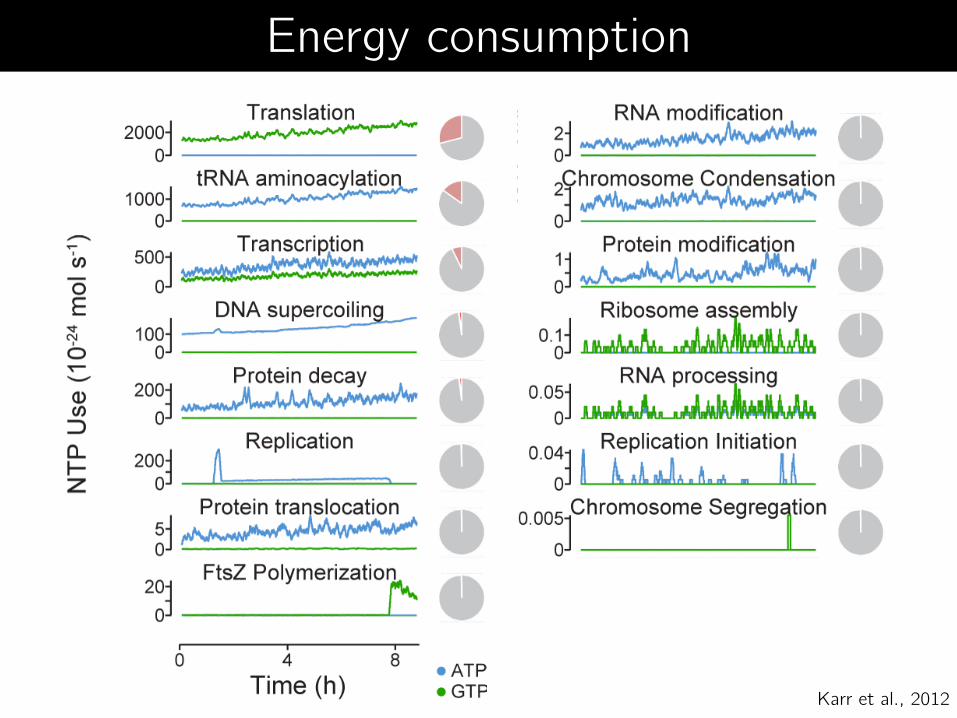
60 m mol ATP / gDCW 80 a mol ATP / cell
Energy consumption
v
v
Karr et al., 2012
Energy consumption
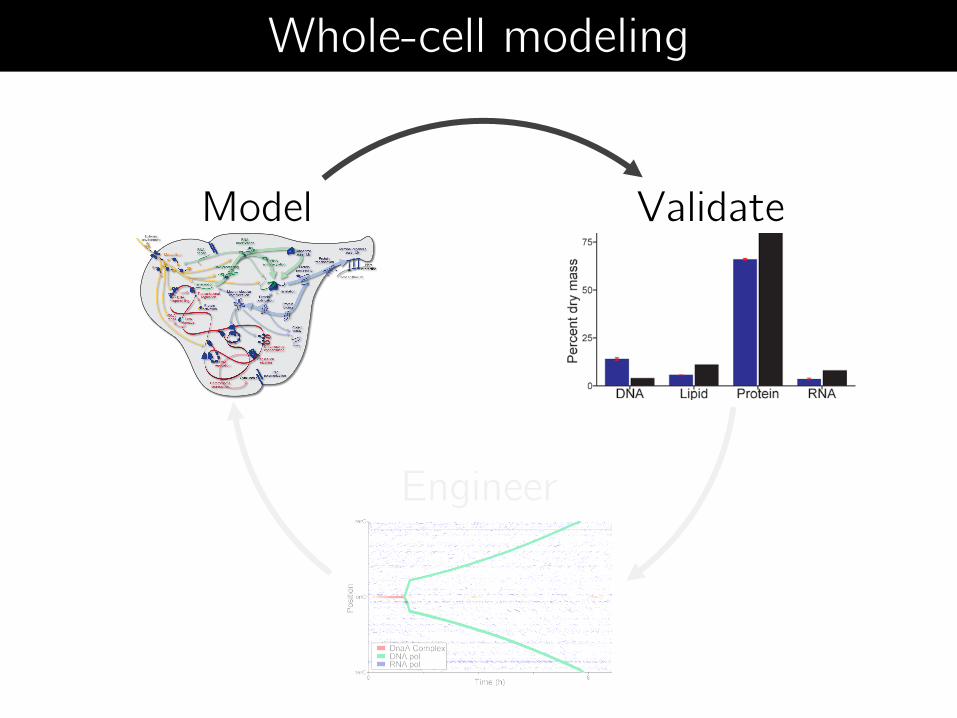
Model Validate
Engineer
Whole-cell modeling
Validate
Matches training data Cell mass, volume
Biomass composition
RNA, protein expression, half-lives
Superhelicity
Matches published data Metabolite concentrations
DNA-bound protein density
Gene essentiality
Matches new data Wild-type growth rate
Disruption strain growth rates
Matches theory Mass conservation
Central dogma
Cell theory
Evolution
No obvious errors Plot model predictions
Manually inspect data
Compare to known biology
Software stable Simulation code is stable
Tests passing
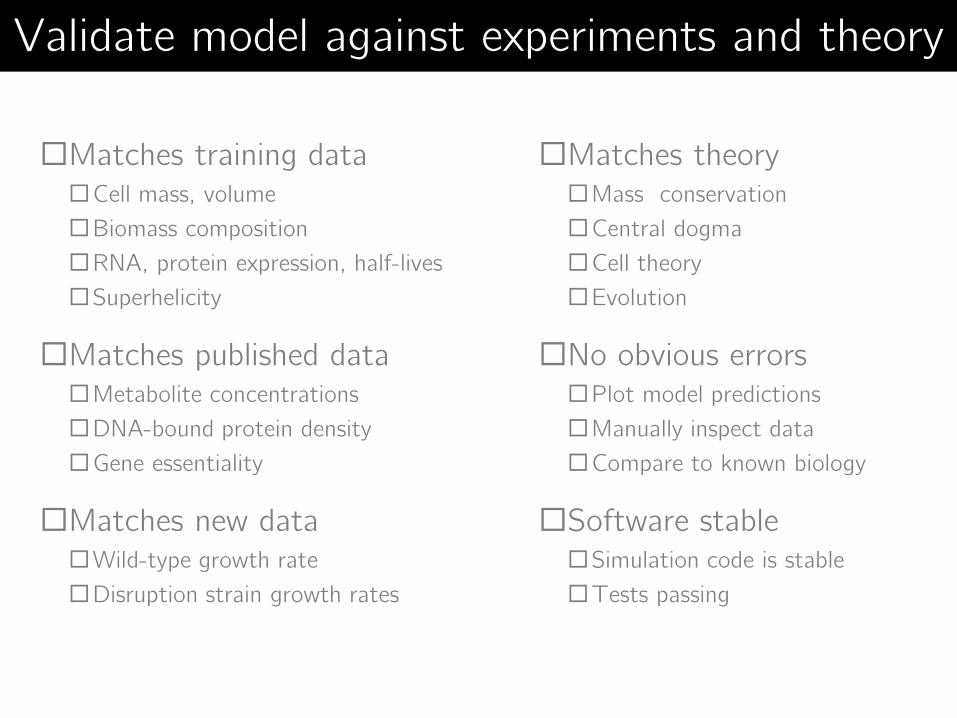
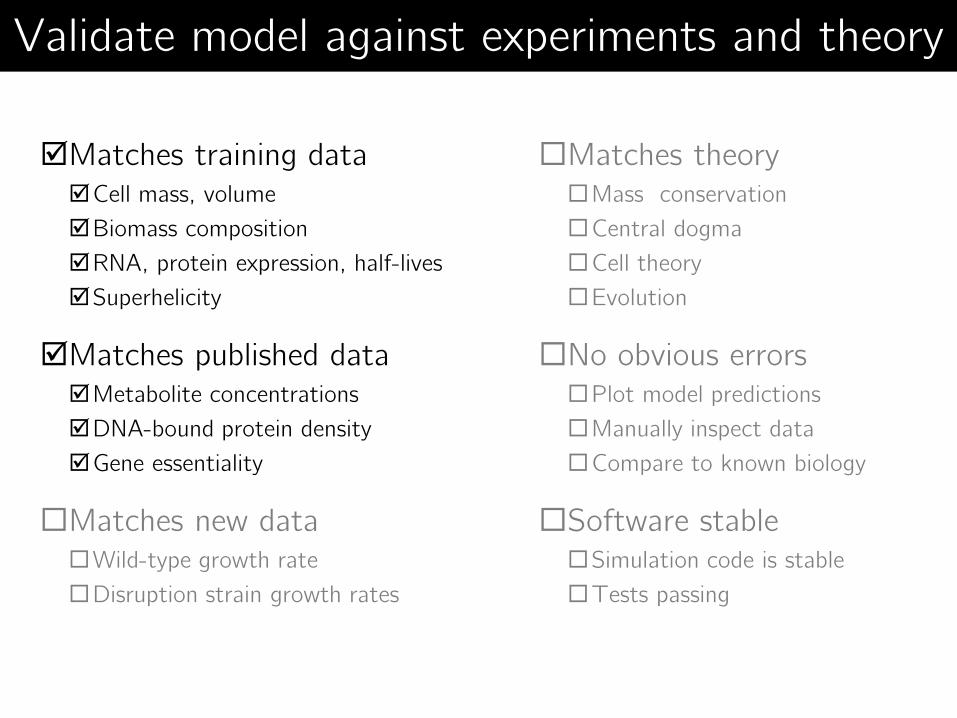
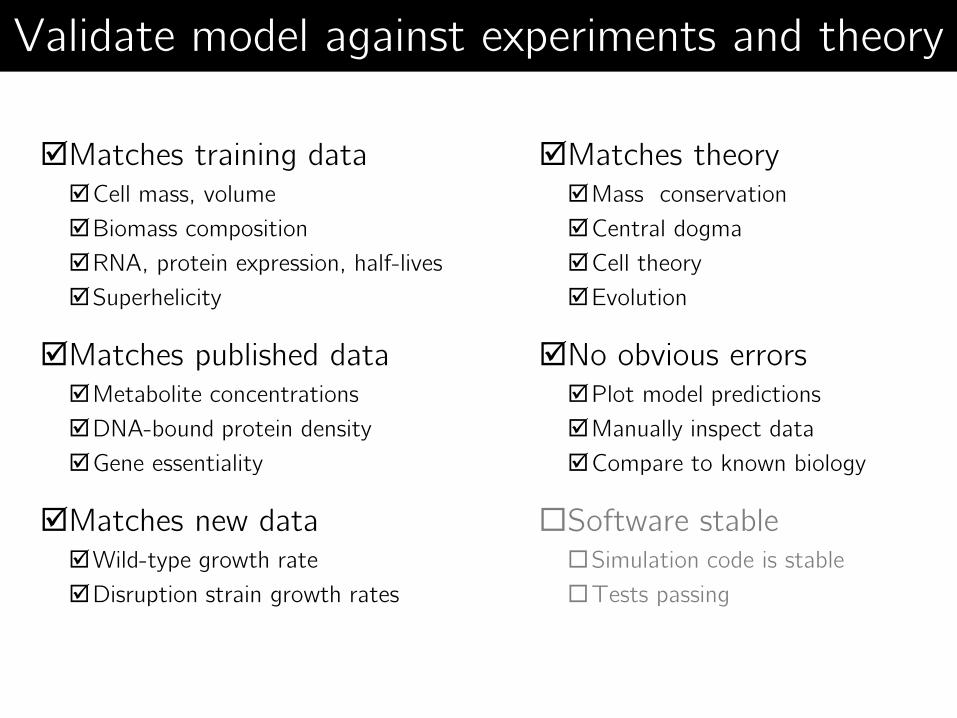
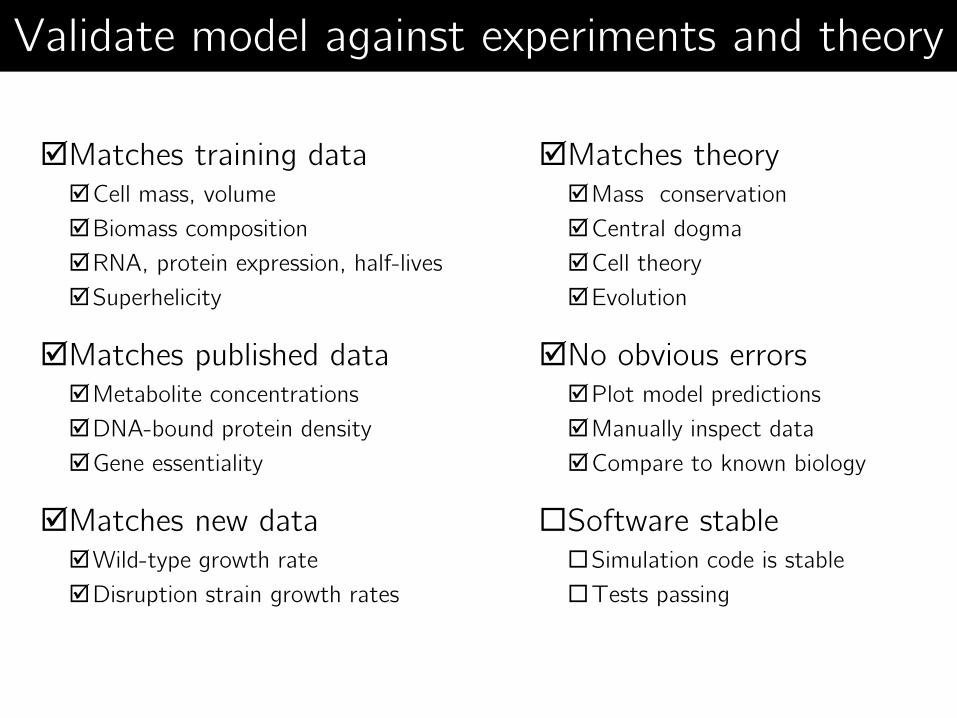
Validate model against experiments and theory

Matches training data Cell mass, volume
Biomass composition
RNA, protein expression, half-lives
Superhelicity
Matches published data Metabolite concentrations
DNA-bound protein density
Gene essentiality
Matches new data Wild-type growth rate
Disruption strain growth rates
Matches theory Mass conservation
Central dogma
Cell theory
Evolution
No obvious errors Plot model predictions
Manually inspect data
Compare to known biology
Software stable Simulation code is stable
Tests passing
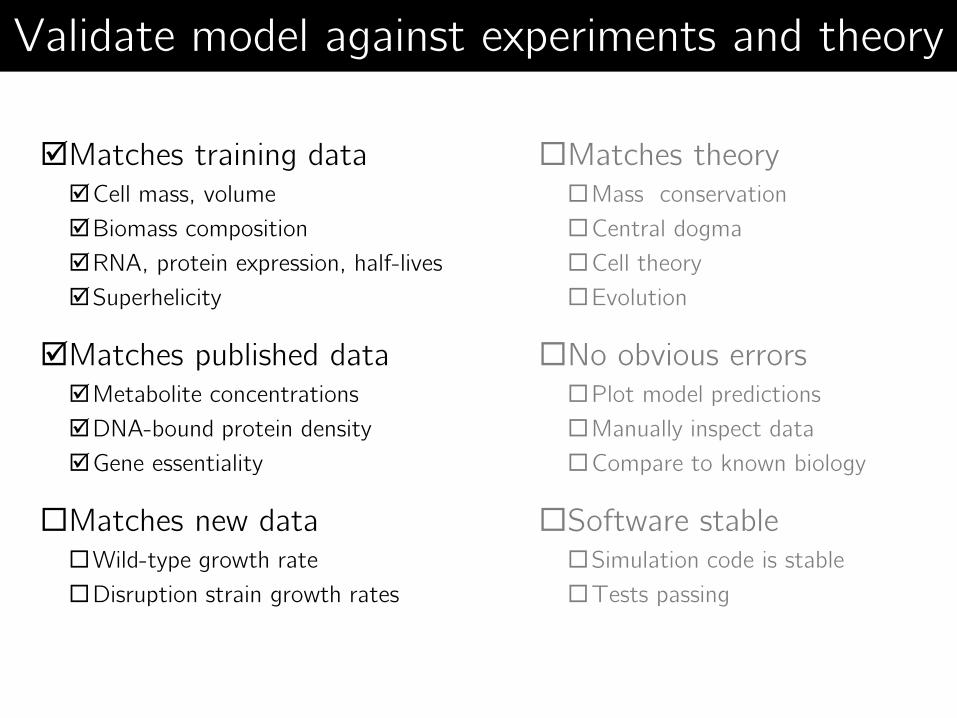
Validate model against experiments and theory
Matches training data Cell mass, volume
Biomass composition
RNA, protein expression, half-lives
Superhelicity
Matches published data Metabolite concentrations
DNA-bound protein density
Gene essentiality
Matches new data Wild-type growth rate
Disruption strain growth rates
Matches theory Mass conservation
Central dogma
Cell theory
Evolution
No obvious errors Plot model predictions
Manually inspect data
Compare to known biology
Software stable Simulation code is stable
Tests passing
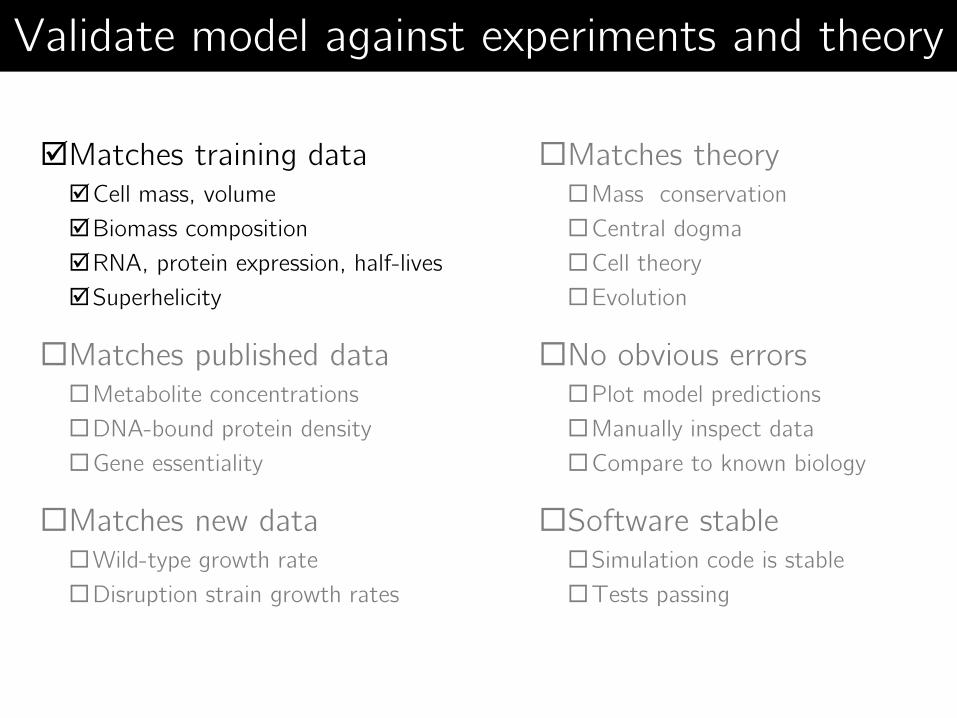
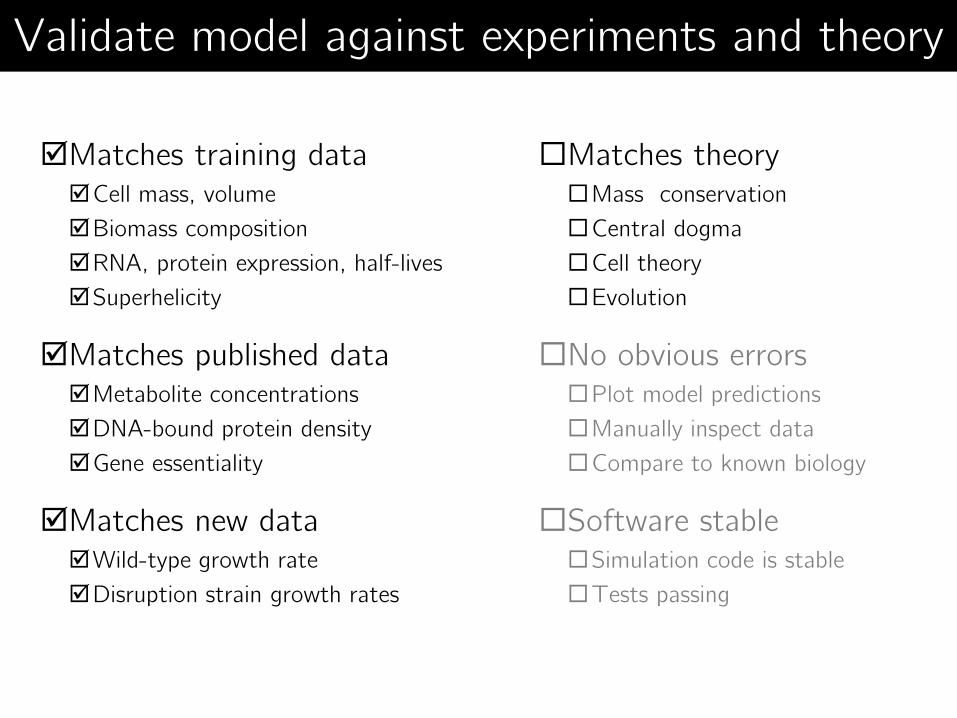
Validate model against experiments and theory

Matches training data Cell mass, volume
Biomass composition
RNA, protein expression, half-lives
Superhelicity
Matches published data Metabolite concentrations
DNA-bound protein density
Gene essentiality
Matches new data Wild-type growth rate
Disruption strain growth rates
Matches theory Mass conservation
Central dogma
Cell theory
Evolution
No obvious errors Plot model predictions
Manually inspect data
Compare to known biology
Software stable Simulation code is stable
Tests passing
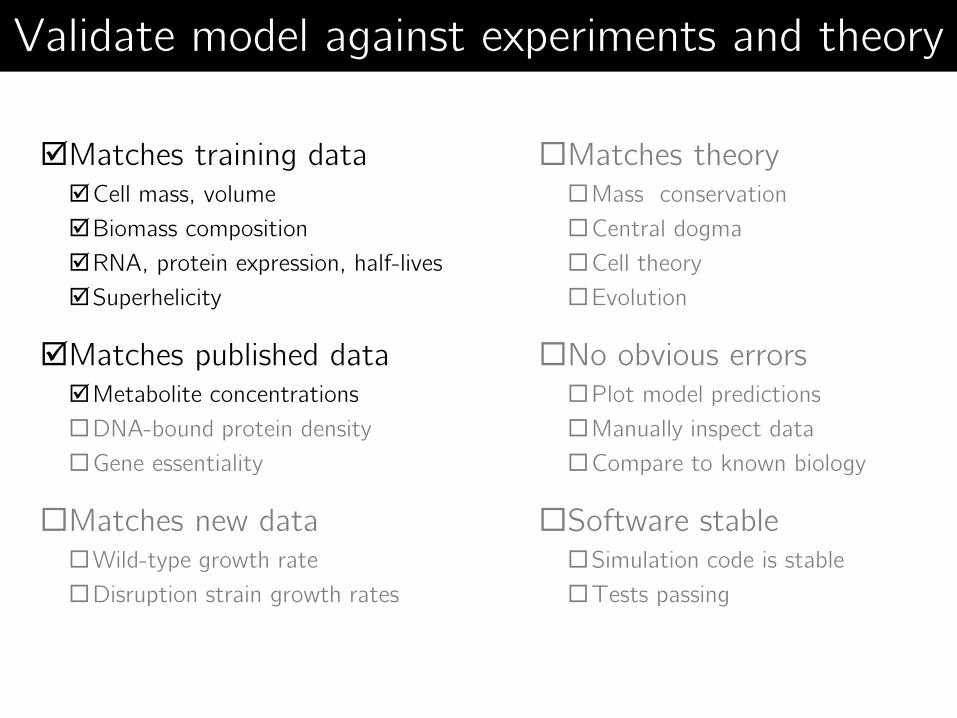
Validate model against experiments and theory
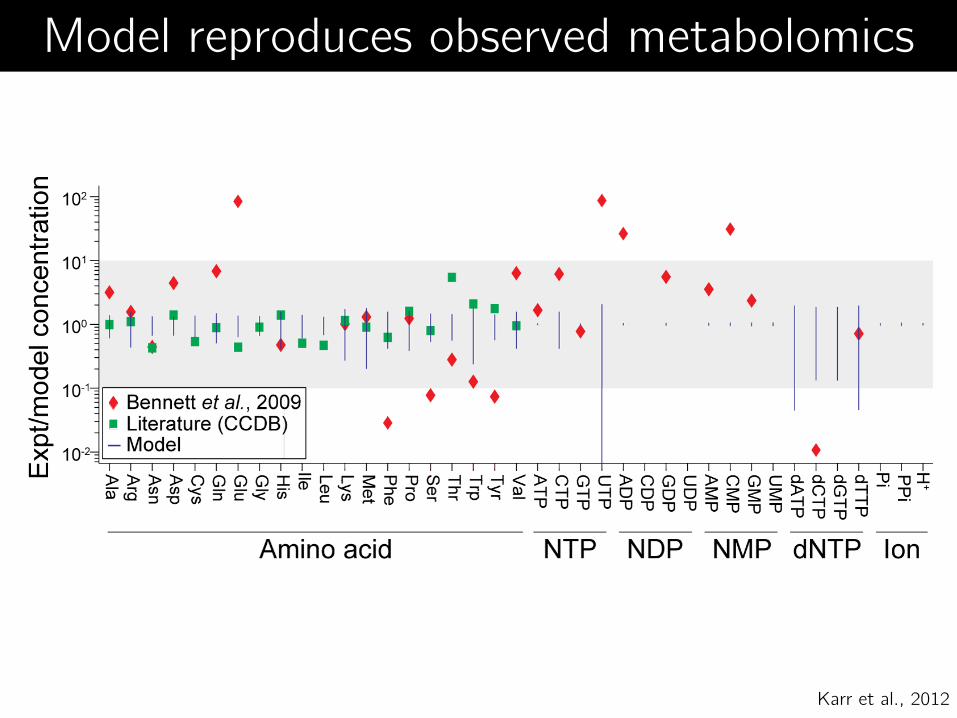
Model reproduces observed metabolomics
Karr et al., 2012

Matches training data Cell mass, volume
Biomass composition
RNA, protein expression, half-lives
Superhelicity
Matches published data Metabolite concentrations
DNA-bound protein density
Gene essentiality
Matches new data Wild-type growth rate
Disruption strain growth rates
Matches theory Mass conservation
Central dogma
Cell theory
Evolution
No obvious errors Plot model predictions
Manually inspect data
Compare to known biology
Software stable Simulation code is stable
Tests passing
Validate model against experiments and theory
Matches training data Cell mass, volume
Biomass composition
RNA, protein expression, half-lives
Superhelicity
Matches published data Metabolite concentrations
DNA-bound protein density
Gene essentiality
Matches new data Wild-type growth rate
Disruption strain growth rates
Matches theory Mass conservation
Central dogma
Cell theory
Evolution
No obvious errors Plot model predictions
Manually inspect data
Compare to known biology
Software stable Simulation code is stable
Tests passing
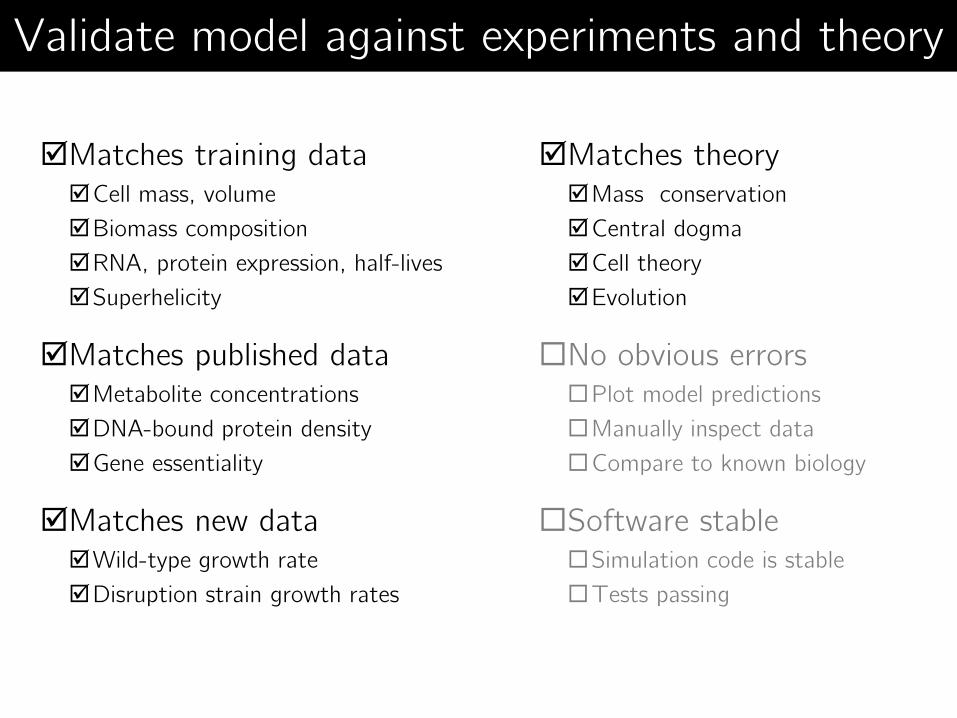
Model validated by experiments and theory Validate model against experiments and theory
Matches training data Cell mass, volume
Biomass composition
RNA, protein expression, half-lives
Superhelicity
Matches published data Metabolite concentrations
DNA-bound protein density
Gene essentiality
Matches new data Wild-type growth rate
Disruption strain growth rates
Matches theory Mass conservation
Central dogma
Cell theory
Evolution
No obvious errors Plot model predictions
Manually inspect data
Compare to known biology
Software stable Simulation code is stable
Tests passing
Validate model against experiments and theory

Colorimetric growth assay Model predictions
Model reproduces measured growth rate
Karr et al., 2012

Matches training data Cell mass, volume
Biomass composition
RNA, protein expression, half-lives
Superhelicity
Matches published data Metabolite concentrations
DNA-bound protein density
Gene essentiality
Matches new data Wild-type growth rate
Disruption strain growth rates
Matches theory Mass conservation
Central dogma
Cell theory
Evolution
No obvious errors Plot model predictions
Manually inspect data
Compare to known biology
Software stable Simulation code is stable
Tests passing
Model validated by experiments and theory Validate model against experiments and theory

Matches training data Cell mass, volume
Biomass composition
RNA, protein expression, half-lives
Superhelicity
Matches published data Metabolite concentrations
DNA-bound protein density
Gene essentiality
Matches new data Wild-type growth rate
Disruption strain growth rates
Matches theory Mass conservation
Central dogma
Cell theory
Evolution
No obvious errors Plot model predictions
Manually inspect data
Compare to known biology
Software stable Simulation code is stable
Tests passing
Validate model against experiments and theory

Model
Engineer
Whole-cell modeling
Validate
Engineer

What genomic modifications maximize growth?
Time M
ass
Example: growth optimization

M. genitalium
M. mycoides
M. pneumoniae
Optimal gene expression
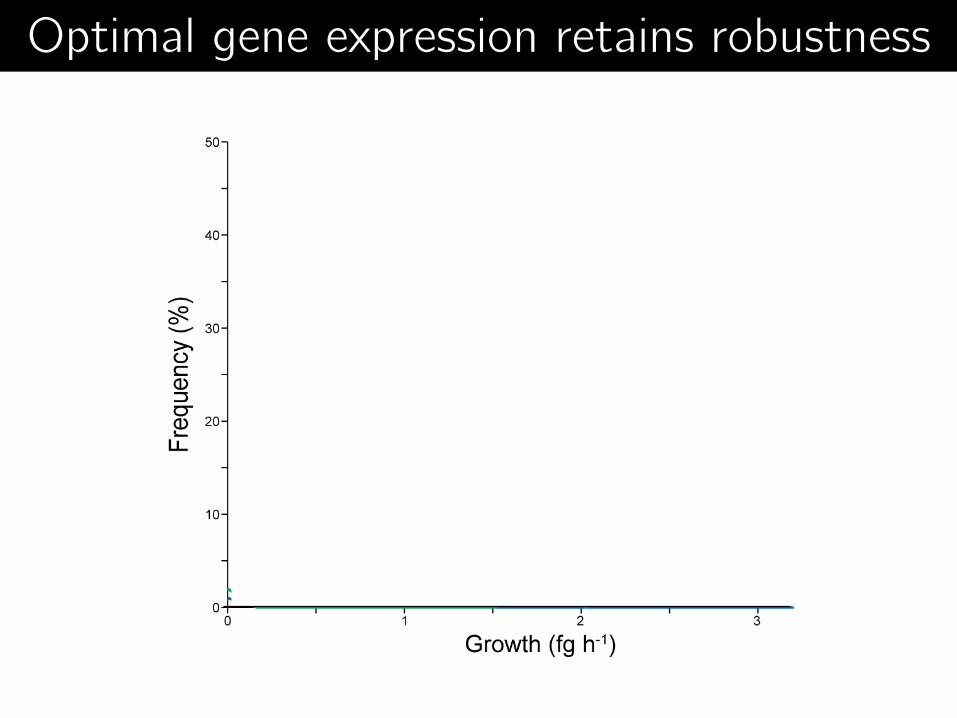
Optimal architecture retains robustness Optimal gene expression retains robustness

Graphical design tool Clotho, TinkerCell, GenoCAD
High-level language BioCompiler
Biophysical model Whole-cell models, SCHEMA, MD
Physical implementation Gibson assembly, TALENs, ZFNs, CRISPR
Transplantation Transplantation
(if (nutrients) (grow) (sporulate))
Directed evolution
Mutate Select
Synthetic design landscape
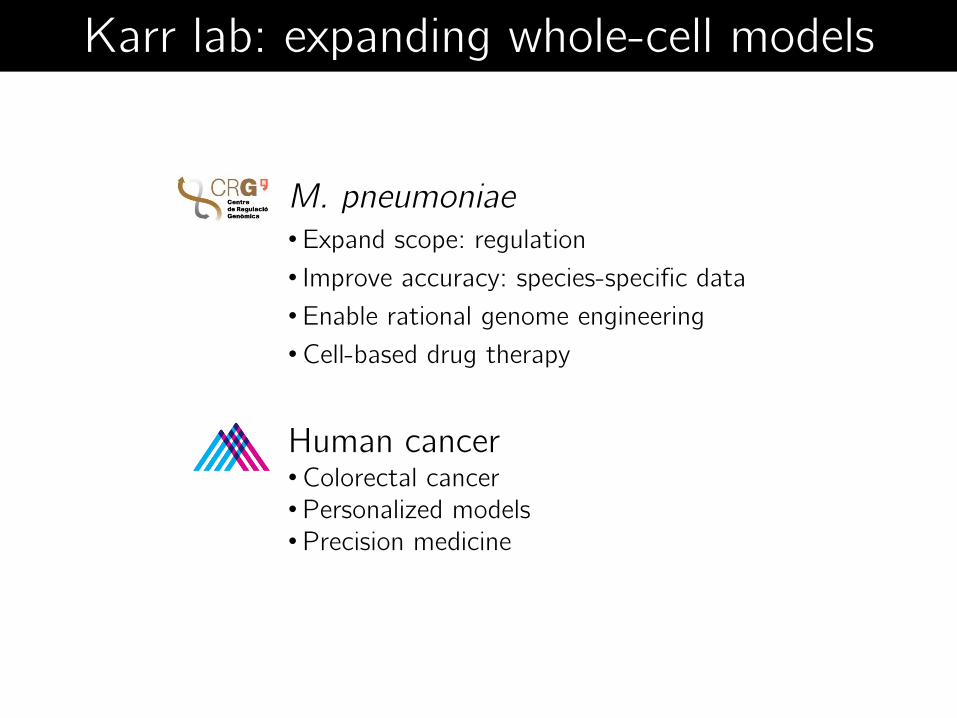
Karr lab: expanding whole-cell models
M. pneumoniae • Expand scope: regulation
• Improve accuracy: species-specific data
• Enable rational genome engineering
•Cell-based drug therapy
Human cancer •Colorectal cancer •Personalized models •Precision medicine

Karr lab: solving important problems
Biological discovery
Synthetic networks
Biological design
Drug repositioning
Drug toxicity

Karr lab: developing modeling tools
Reconstruction: WholeCellKB
Parallelized simulator
Parameter estimation
Simulation storage: WholeCellSimDB
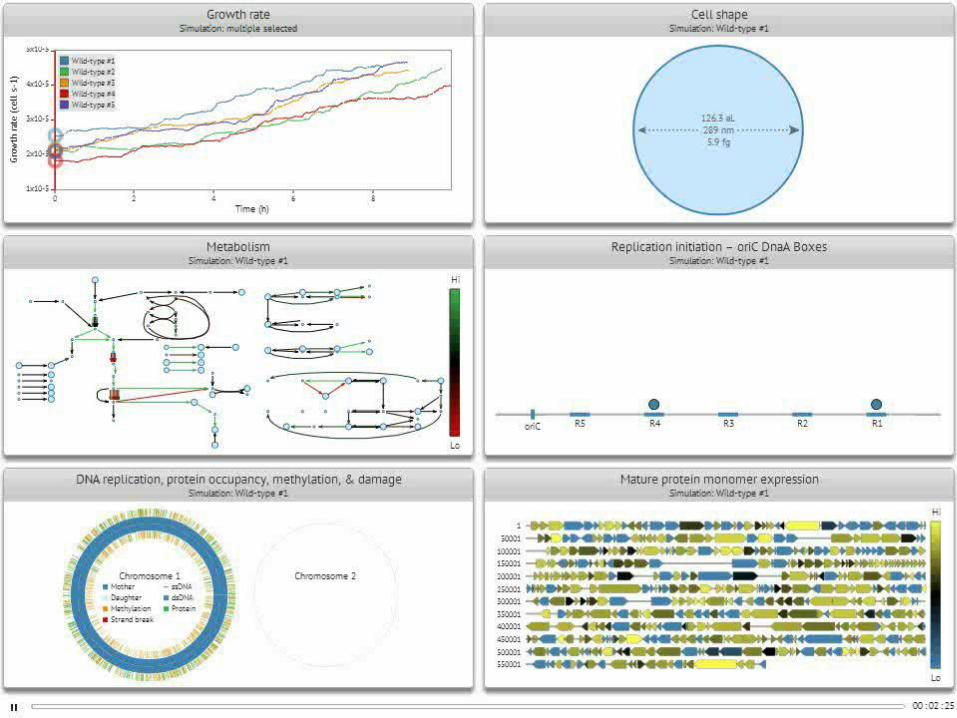
Visualization: WholeCellViz
wholecell.org
??

•How can we model more complex physiology? • Transcriptional regulation • Translational regulation • Stochastic death, failure modes • Higher-order meta-stable states • Resource distribution • Aging • Evolution • Populations
•How can we model more complex organisms? • Larger bacteria • Eukaryotes •Multicellularity • Humans
•How can we use models to direct engineering?
Open challenges
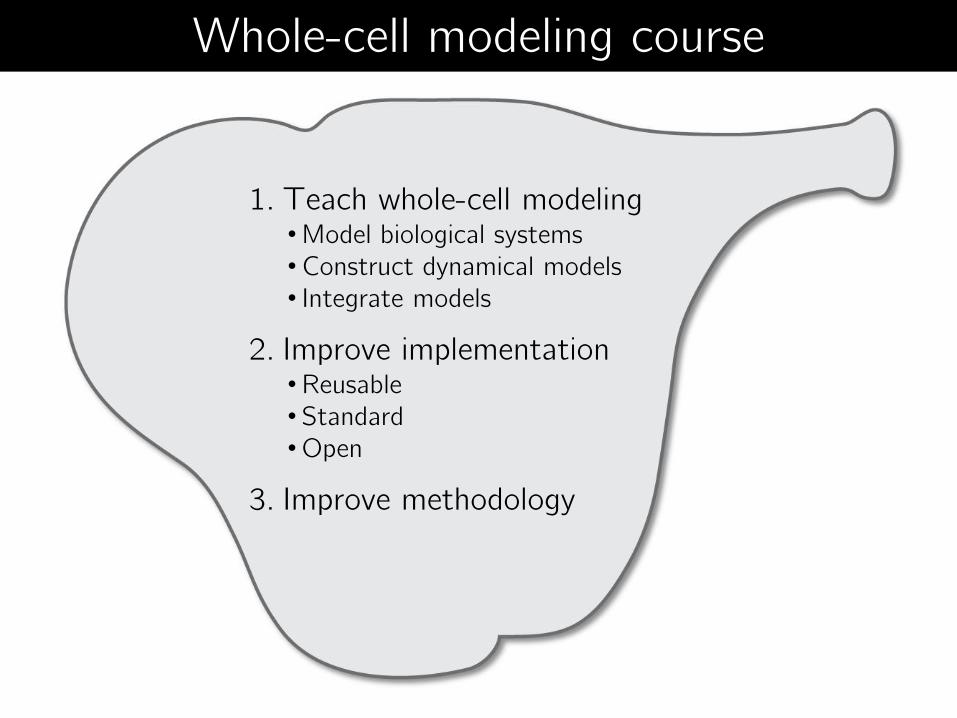
Whole-cell modeling course
1. Teach whole-cell modeling •Model biological systems •Construct dynamical models • Integrate models
2. Improve implementation •Reusable • Standard •Open
3. Improve methodology
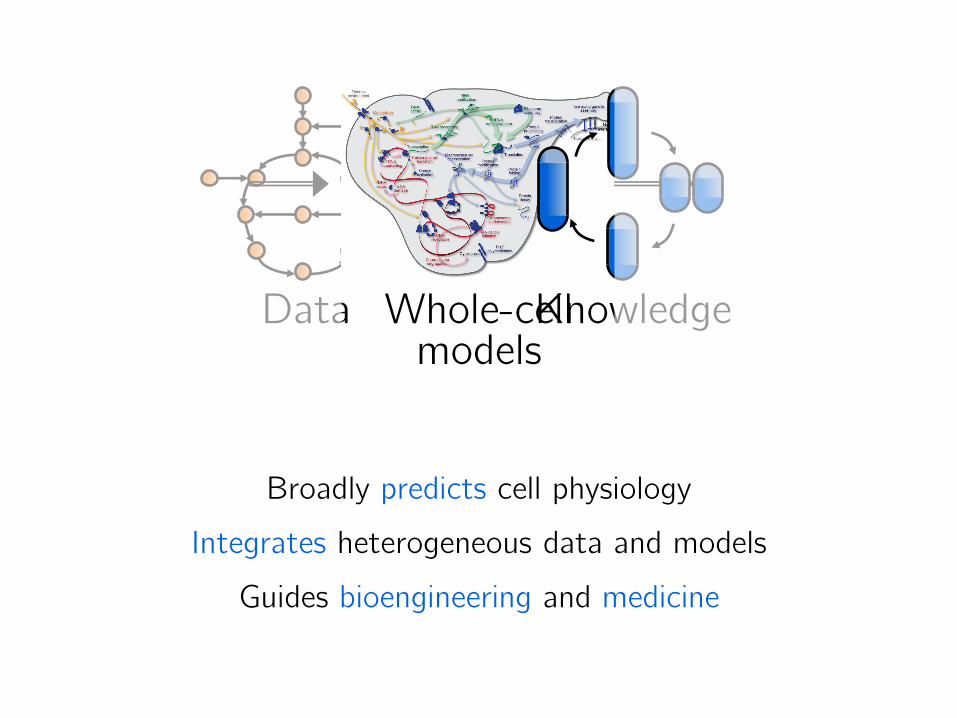
Data
?
Whole-cell models
Broadly predicts cell physiology
Integrates heterogeneous data and models
Guides bioengineering and medicine
Knowledge
• Karr JR et al. (2012) A Whole-Cell Computational Model Predicts Phenotype from Genotype. Cell, 150, 389-401.
• Macklin DN, Ruggero NA, Covert MW (2014) The future of whole-cell modeling. Curr Opin Biotechnol, 28C, 111-115.
• Shuler ML, Foley P, Atlas J (2012). Modeling a minimal cell. Methods Mol Biol, 881, 573-610.
• Joyce AR, Palsson BØ (2007). Toward whole cell modeling and simulation: comprehensive functional genomics through the constraint-based approach. Prog Drug Res 64, 267-309.
• Tomita M (2001). Whole-cell simulation: a grand challenge of the 21st century. Trends Biotechnol 6, 205-10.
• Surovtsev IV et al. (2009) Mathematical modeling of a minimal protocell with coordinated growth and division. J Theor Biol, 260, 422-9.
Recommended reading

• Thiele I et al. (2009). Genome-scale reconstruction of Escherichia coli's transcriptional and translational machinery: a knowledge base, its mathematical formulation, and its functional characterization. PLoS Comput Biol. 5, e1000312.
• Orth JD, Thiele I, Palsson BØ (2010). What is flux balance analysis? Nat Biotechnol, 28, 245-8.
• Covert MW et al (2008). Integrated Flux Balance Analysis Model of Escherichia coli. Bioinformatics 24, 2044–50.
• Covert MW et al (2004). Integrating high-throughput and computational data elucidates bacterial networks. Nature, 429, 92-6.
Recommended reading: FBA


