98
KENT AND MEDWAY ENERGY AND LOW EMISSIONS STRATEGY

KENT AND MEDWAY ENERGY AND LOW EMISSIONS STRATEGY
EVIDENCE BASEA summary of national, regional and local energy, emissions and air quality data and evidence

2 KENT AND MEDWAY ENERGY AND LOW EMISSIONS STRATEGY EVIDENCE BASE
CONTENTS1. Introduction 4
2. The Growth Challenge in Kent and Medway 5
3. Energy in Kent and Medway 83.1 Energy consumption 83.2 Future energy scenarios 143.3 Greenhouse gas emissions from energy demand 153.4 Fuel Poverty 173.5 Renewable and low carbon energy in Kent and Medway 19
4. Transport and Travel 224.1 Transition to Ultra Low Emission Vehicles (ULEV) 224.2 Active Travel 234.3 Emissions from Aviation and Maritime traffic 26
5. Air Quality 275.1 An introduction to air quality 275.2 Health impacts of poor air quality 275.3 Assessing air quality 285.4 Air Quality in Kent and Medway 335.5 Acting on poor air quality 575.6 Published Air Quality Information 65
6. References 43Appendix 1: National Policy Context 47
Appendix 2: Regional Policy context 51
Appendix 3: Kent and Medway Policy Context 52

3 KENT AND MEDWAY ENERGY AND LOW EMISSIONS STRATEGY EVIDENCE BASE
1. IntroductionThis document brings together an evidence base to support the 2019 Kent and Medway Energy and Low Emissions Strategy (ELES).
It summarises evidence and data related to energy and air quality in Kent and Medway, drawing on national, regional and local sources of data. It also includes appendices which provide the national, regional and local policy context.
This evidence base has informed the Strategy and supporting actions and is a snapshot in time (based on available data up to end March 2019). Delivery of the ELES action plan includes the maintenance of key datasets that will enable progress to be monitored and support future decision making.

4 KENT AND MEDWAY ENERGY AND LOW EMISSIONS STRATEGY EVIDENCE BASE
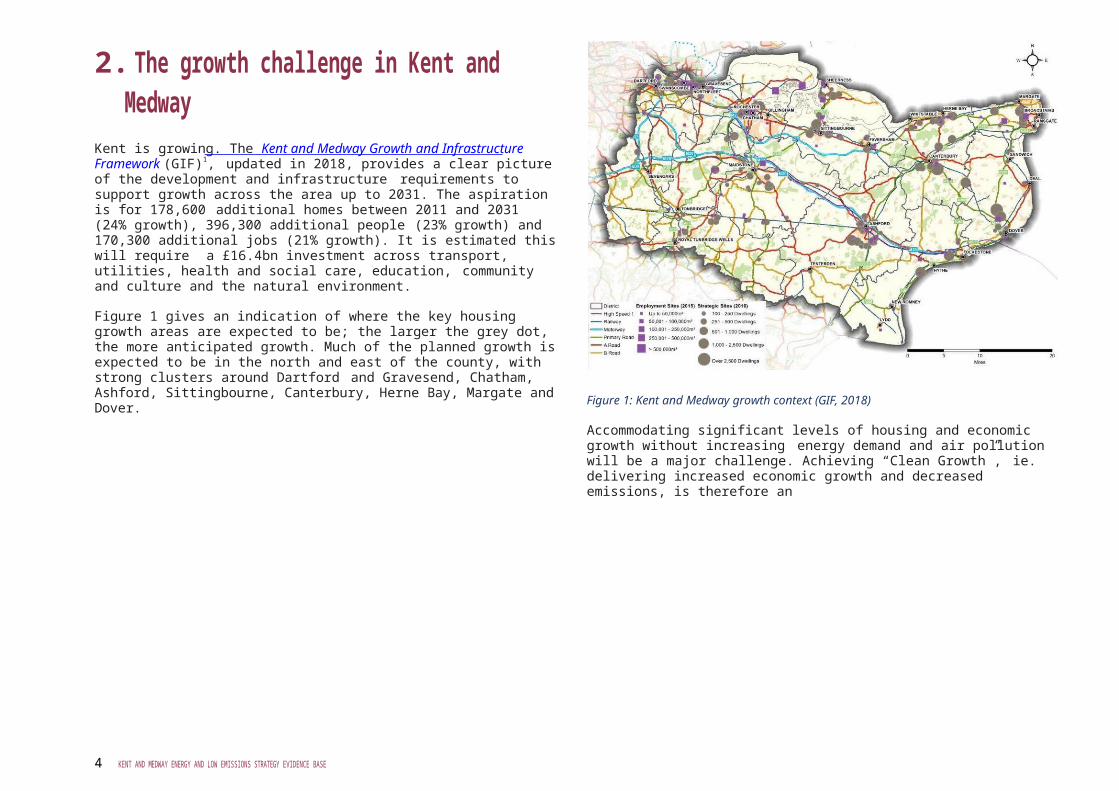
2. The growth challenge in Kent and MedwayKent is growing. The Kent and Medway Growth and Infrastructure Framework (GIF)1, updated in 2018, provides a clear picture of the development and infrastructure requirements to support growth across the area up to 2031. The aspiration is for 178,600 additional homes between 2011 and 2031 (24% growth), 396,300 additional people (23% growth) and 170,300 additional jobs (21% growth). It is estimated this will require a £16.4bn investment across transport, utilities, health and social care, education, community and culture and the natural environment.
Figure 1 gives an indication of where the key housing growth areas are expected to be; the larger the grey dot, the more anticipated growth. Much of the planned growth is expected to be in the north and east of the county, with strong clusters around Dartford and Gravesend, Chatham, Ashford, Sittingbourne, Canterbury, Herne Bay, Margate and Dover.
Figure 1: Kent and Medway growth context (GIF, 2018)
Accommodating significant levels of housing and economic growth without increasing energy demand and air pollution will be a major challenge. Achieving “Clean Growth”, ie. delivering increased economic growth and decreased emissions, is therefore an
imperative. To do this, new homes and buildings need to be built to sustainable design standards. A sustainable approach to development will bring benefits including healthier living and working environments; improved efficiency and productivity in use; and the reduction of fuel costs and the costs of vehicle ownership2. Local plans have a key role in defining how this will work at a local level.
The GIF explores four future scenarios to 2050 to examine how the area can ensure it is adaptable, resilient and connected in planning for a sustainable future. The most favourable scenario is the high economic growth, moderate climate change impactsscenario, named ‘Fertile Ground’ (Figure 2). Amongst other things, within this scenario the GIF envisions:
• new housing via high-quality new green towns and urban extensions, redevelopment and infill
• shared autonomous vehicles / autonomous shuttles• focus on walkability with new paved routes and spaces• increased rail capacity in London.
Figure 2: The ‘Fertile Ground Scenario’ (GIF, 2018)
Regardless of the scenario, the GIF recognises the critical necessity for more sustainable energy production and delivery: ‘With an imminent influx in the adoption of electric vehicles, there will be significant implications for the way in which energy is delivered to support this new infrastructure. In addition, growth pressures, whether in
5 KENT AND MEDWAY ENERGY AND LOW EMISSIONS STRATEGY EVIDENCE BASE
a high- or low-

6 KENT AND MEDWAY ENERGY AND LOW EMISSIONS STRATEGY EVIDENCE BASE
growth scenario, will mean that pressures on the grid are exacerbated further. There will be a need to strategically plan the way in which electricity is generated and delivered.’
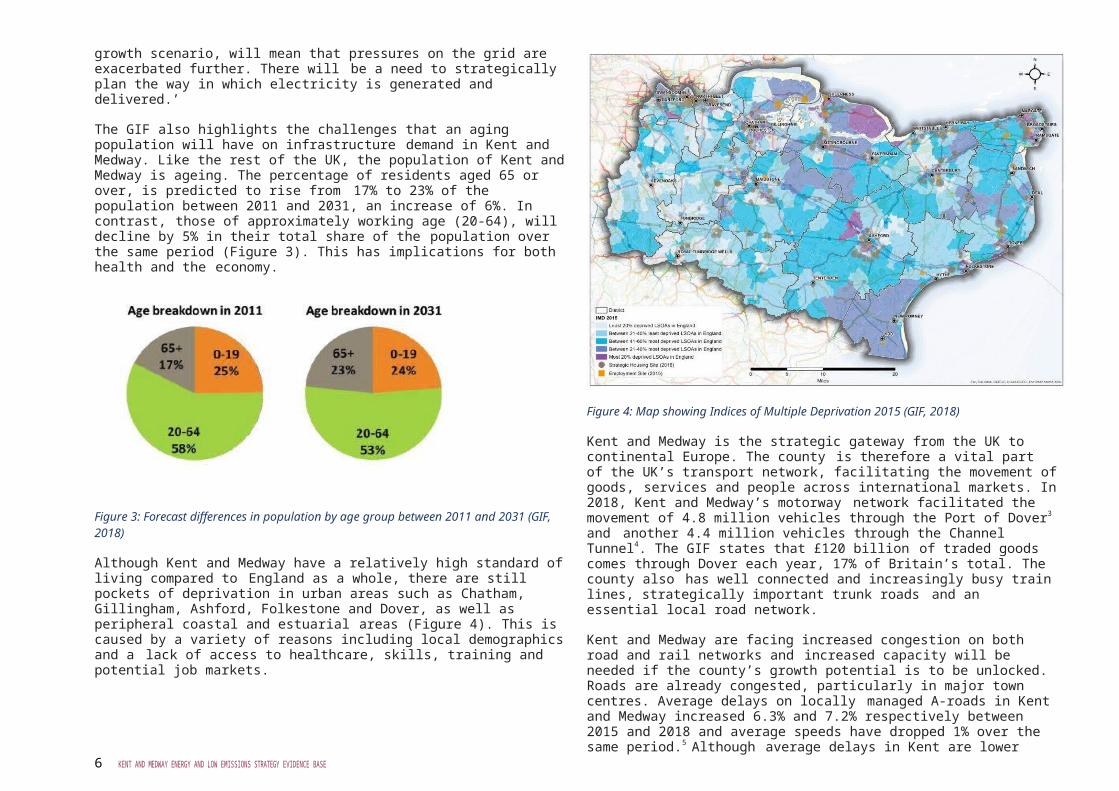
The GIF also highlights the challenges that an aging population will have on infrastructure demand in Kent and Medway. Like the rest of the UK, the population of Kent andMedway is ageing. The percentage of residents aged 65 or over, is predicted to rise from 17% to 23% of the population between 2011 and 2031, an increase of 6%. In contrast, those of approximately working age (20-64), will decline by 5% in their total share of the population over the same period (Figure 3). This has implications for both health and the economy.
Figure 3: Forecast differences in population by age group between 2011 and 2031 (GIF, 2018)
Although Kent and Medway have a relatively high standard of living compared to England as a whole, there are still pockets of deprivation in urban areas such as Chatham, Gillingham, Ashford, Folkestone and Dover, as well as peripheral coastal and estuarial areas (Figure 4). This is caused by a variety of reasons including local demographics and a lack of access to healthcare, skills, training and potential job markets.
Figure 4: Map showing Indices of Multiple Deprivation 2015 (GIF, 2018)
Kent and Medway is the strategic gateway from the UK to continental Europe. The county is therefore a vital part of the UK’s transport network, facilitating the movement of goods, services and people across international markets. In 2018, Kent and Medway’s motorway network facilitated the movement of 4.8 million vehicles through the Port of Dover3 and another 4.4 million vehicles through the Channel Tunnel4. The GIF states that £120 billion of traded goods comes through Dover each year, 17% of Britain’s total. The county also has well connected and increasingly busy train lines, strategically important trunk roads and an essential local road network.
Kent and Medway are facing increased congestion on both road and rail networks and increased capacity will be needed if the county’s growth potential is to be unlocked. Roads are already congested, particularly in major town centres. Average delays on locally managed A-roads in Kent and Medway increased 6.3% and 7.2% respectively between 2015 and 2018 and average speeds have dropped 1% over the same period.5
Although average delays in Kent are lower than the South East average, delays in Medway are considerably higher (Figure 5).
7 KENT AND MEDWAY ENERGY AND LOW EMISSIONS STRATEGY EVIDENCE BASE
Figure 5: Average delay on locally managed ‘A’ roads in 2018 (Department for Transport, 2019)
The local road network in Kent and Medway can also be heavily impacted by Operation Brock and Operation Stack, which are brought into force in the event of disruption to services across the English Channel, such as bad weather or industrial action. Operation Stack is a procedure that uses part of the M20 to queue lorries travelling towards the continent, to prevent queuing on local roads in and around the Port of Dover. Operation Brock, an alternative to the older Operation Stack, is a set of measures designed tokeep the M20 open in both directions by using different lorry holding areas across Kent.6 The use of these interventions can cause significant congestion and delays on local communities in south east Kent, particularly when used for consecutive days,7
exacerbating existing congestion and air quality issues.
Road transport is one of the key sources of poor air quality. Further growth in housing, commercial space and cross-Channel traffic is likely to increase vehicle numbers and congestion; offsetting and potentially reversing any air quality improvements from the uptake of cleaner vehicles.
The development of a county-wide traffic model will help to identify problem areas and develop solutions. However, without investment and innovation, the county could be severely gridlocked in the medium-long term. Kent County Council’s Local Tr anspor t Plan 4: Gr owth W ithout Gridlock 2016-2031 (LTP4) sets out the county’s transport priorities8. It aims to deliver “safe and effective transport, ensuring that all of Kent’s communities and businesses benefit, the environment is enhanced, and economic growth supported”.
To achieve Clean Growth and the LTP4’s ambition, there must be a multi-pronged approach to investment and innovation that focuses on:
• clean road transport, such as electric and alternatively fuelled vehicles• smarter driving and traffic management• integration of alternative forms of transport such as walking and cycling• ensuring smooth connections to clean public transport• supporting new transport models such as car clubs, car sharing and
automated vehicles using smart technology.
At the same time, we need to support smarter working practices. The GIF forecasts an additional 70,300 jobs by 2031, a 21% increase from 2011 levels. Better broadband services and enhanced access to digital services and technology will help transformworking practices; enabling more people to work or access services flexibly from home, or any location, reducing the need to travel at all.

8 KENT AND MEDWAY ENERGY AND LOW EMISSIONS STRATEGY EVIDENCE BASE
3. Energy in Kent and Medway3.1 Energy consumptionIn 2016, 34,420 GWh of energy was consumed in Kent and Medway: 39% in the transport sector, 36% in the domestic sector and 25% in the industry and commercial sector, which also includes the public sector (Figure 6).9
Figure 6: Kent and Medway energy consumption by sector in 2016 (BEIS, 2019)
The carbon emissions of these sectors are slightly different due to the carbon intensity of the energy sources used: transport is responsible for 41% of emissions, industry and commercial for 30% and the domestic sector for 29%. See section 3.5 for further details.
As a country we spend £32 billion a year on heat10 and almost three-quarters of industrial energy use is to produce heat, often at very high temperatures11. The Ener gy South2East Local Ener gy Str ategy 12 states that much of the heat produced in the South East is wasted through discharges into the atmosphere, despite the fact it could be reused in a number of ways. Uses for waste heat include:
• reuse within the same facility for heating or cooling• reuse by another end-user via a heat network• converting waste heat to power.
This presents a huge opportunity to utilise more efficient technologies and achieve cost savings for the county’s businesses and residents alike. In the domestic sector, high heat consumption is due to the poor energy efficiency of our housing stock; which also contributes to poor housing conditions and fuel poverty (see section 3.6).
3.1.1 Energy consumption in the non-domestic sector
Energy use in the non-domestic sector includes all the energy used in commercial, industrial and public sector buildings and processes.
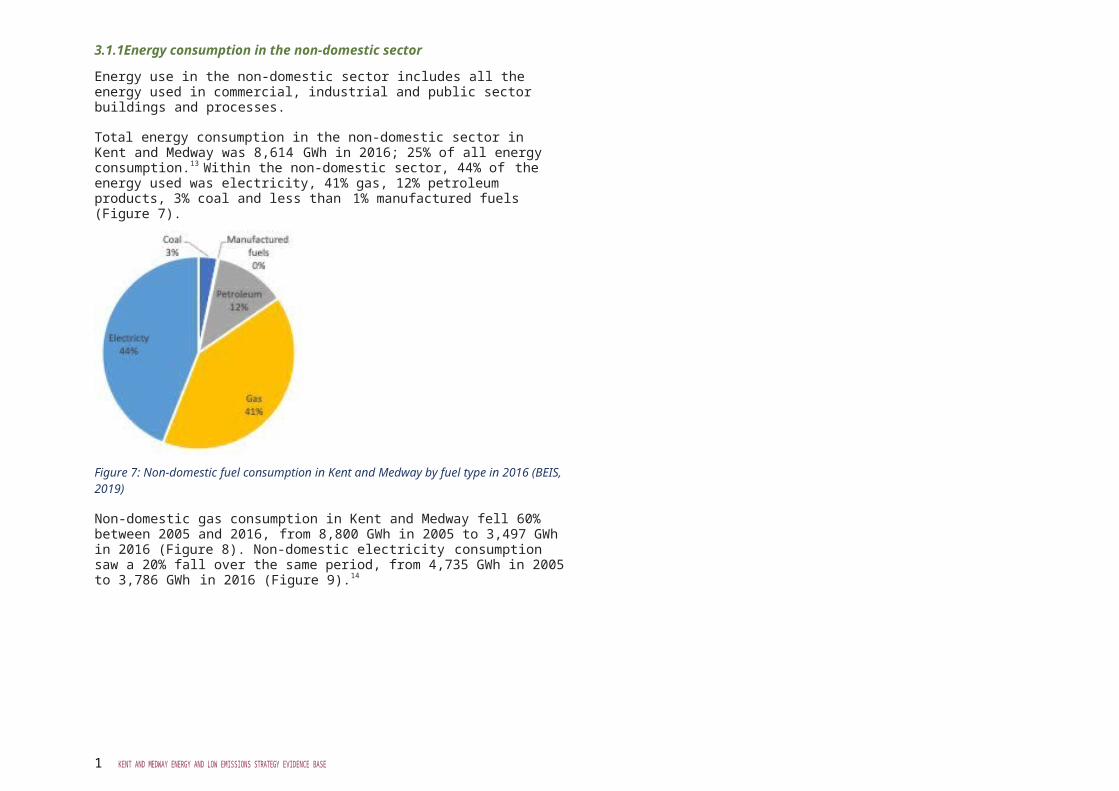
Total energy consumption in the non-domestic sector in Kent and Medway was 8,614 GWh in 2016; 25% of all energy consumption.13 Within the non-domestic sector, 44% of the energy used was electricity, 41% gas, 12% petroleum products, 3% coal and less than 1% manufactured fuels (Figure 7).
Figure 7: Non-domestic fuel consumption in Kent and Medway by fuel type in 2016 (BEIS, 2019)
Non-domestic gas consumption in Kent and Medway fell 60% between 2005 and 2016, from 8,800 GWh in 2005 to 3,497 GWh in 2016 (Figure 8). Non-domestic electricity consumption saw a 20% fall over the same period, from 4,735 GWh in 2005 to 3,786 GWh in 2016 (Figure 9).14

9 KENT AND MEDWAY ENERGY AND LOW EMISSIONS STRATEGY EVIDENCE BASE
Figure 8: Non-domestic gas consumption in Kent and Medway, 2005-2016 (BEIS, 2019)
Figure 9: Non-domestic electricity consumption in Kent and Medway 2005-2016 (BEIS, 2019)
3.1.1.1 The industrial and commercial sector
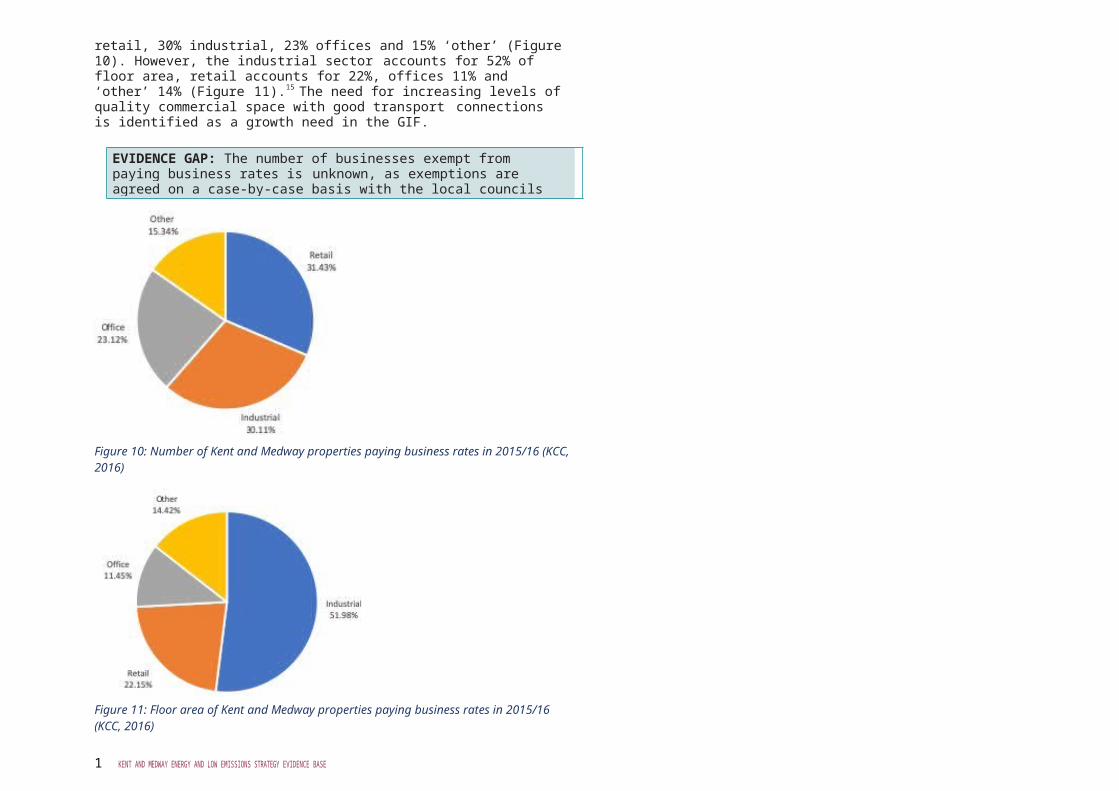
The industrial and commercial sector is significant in Kent and Medway. In 2015/16 there were 38,660 properties paying business rates in Kent and Medway: 31% of these were in
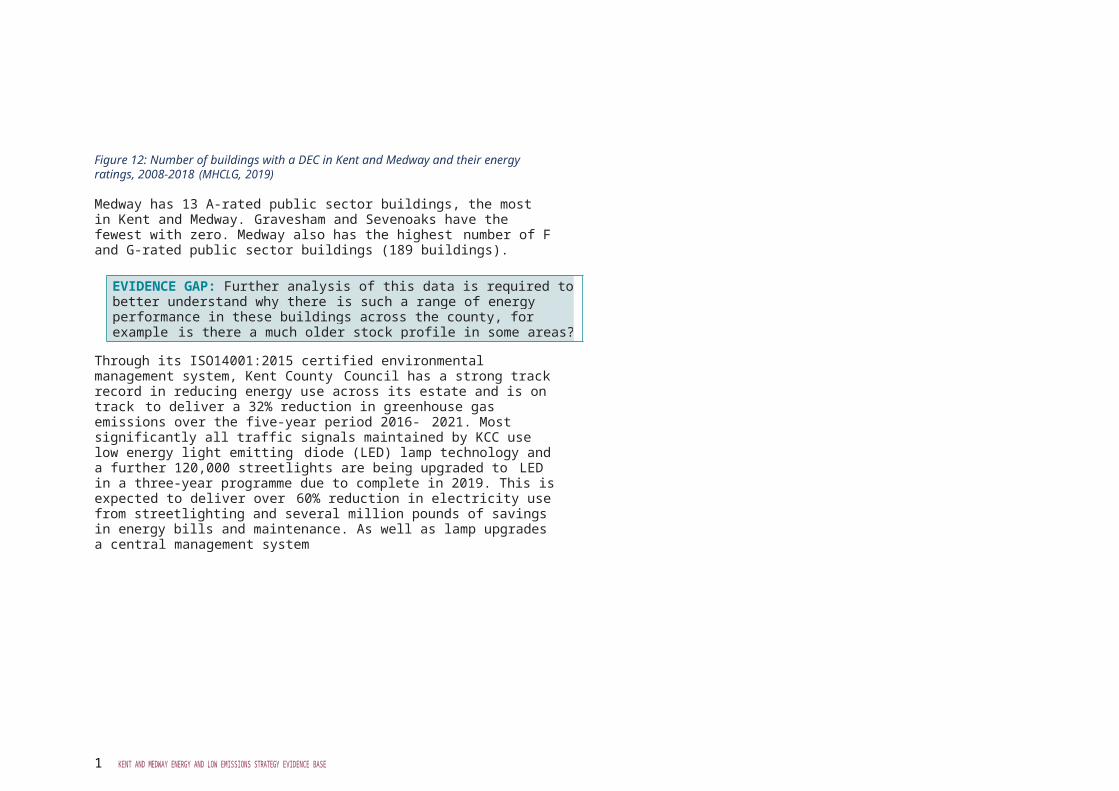
retail, 30% industrial, 23% offices and 15% ‘other’ (Figure 10). However, the industrial sector accounts for 52% of floor area, retail accounts for 22%, offices 11% and ‘other’ 14% (Figure 11).15 The need for increasing levels of quality commercial space with good transport connections is identified as a growth need in the GIF.
EVIDENCE GAP: The number of businesses exempt from paying business rates is unknown, as exemptions are agreed on a case-by-case basis with the local councils who collect business rates. Future data collection to be considered.
Figure 10: Number of Kent and Medway properties paying business rates in 2015/16 (KCC, 2016)
Figure 11: Floor area of Kent and Medway properties paying business rates in 2015/16 (KCC, 2016)
10
KENT AND MEDWAY ENERGY AND LOW EMISSIONS STRATEGY EVIDENCE BASE
energy rating from A-G (A being the most energy efficient and G being the lowest). DECs can also be provided for private sector buildings, but this is optional. DECs were produced for 11,616 buildings in Kent and Medway between 2008 and 2018.18 Figure 12 shows the distribution of ratings: 64 buildings have a DEC rating of A (0.55% of all buildings witha DEC); 452 are G-rated (3.89%). The most common rating is a D, with 4,704 buildings (40.50%).
One support mechanism for the commercial sector in Kent has been identified in the Energy South2East Local Energy Strategy as an exemplar project for replication across the South East region. Supported by European funding, the Low Carbon Across the South East (LoCASE) project provides free support to help businesses become more competitive and profitable, by reducing environmental impacts through resource efficiencies and encouraging low carbon solutions. It does this through the three-pronged approach of stimulating demand, supporting supply and transferring knowledge.
This project has seen nearly £3.5M of EU grant funding approved for 425 Kent SMEs towards a huge range of purposes. This investment is set to deliver over 4,000 tonnes CO2 equivalent of savings, through 250 energy and resource efficiency projects; from simple lighting, heating and insulation retrofit works, to investing in more effective and sustainable business practices. This support has helped create 160 jobs, launch 45 newproducts or services and support 31 business start-ups in Kent and Medway’s burgeoning Low Carbon and Environmental Goods and Services (LCEGS) sector.
3.1.1.2 The public sector
Within the K ent Environment Strategy ,16 there is a commitment to ‘reduce negative impacts and maximise the resource efficiency of public sector services, setting out our public commitments for energy, waste and water use reduction’.
Total energy consumption across local authority estates in Kent and Medway fell by 6% between 2013 and 2018, but rose 2% between 2017 and 2018.17
Public buildings are required to have a Display Energy Certificate (DEC) which provides an
EVIDENCE GAP: Data about energy use and carbon emissions in the industrial and commercial sector in Kent and Medway is limited. Further analysis is needed to segment and better understand the market, for example:
• Which commercial sectors are prevalent in Kent and Medway and which are most energy/carbon intensive? (e.g. professional, scientific & technical, administrative, retail, information & communication, accommodation & food, finance & insurance).
• Which industrial sectors are prevalent in Kent and Medway and which are most energy/carbon intensive? (e.g. food & drink, pulp & paper, cement, chemicals, glass & ceramics; agriculture could also be considered here). What are the opportunities for heat recovery or energy from waste?
• Geographically mapping the sector at a local authority level to understand where clusters exist. An understanding of economic output, employment, etc can help to identify where there may be opportunities to augment existing support services or create new offerings.
• Understanding commonalities related to buildings and to organisational behaviour, including; age and EPC rating of buildings; functional use of space; occupancy and work patterns; tenure; fleet, freight and commuting.

11
KENT AND MEDWAY ENERGY AND LOW EMISSIONS STRATEGY EVIDENCE BASE
Figure 12: Number of buildings with a DEC in Kent and Medway and their energy ratings, 2008-2018 (MHCLG, 2019)
Medway has 13 A-rated public sector buildings, the most in Kent and Medway. Gravesham and Sevenoaks have the fewest with zero. Medway also has the highest number of F and G-rated public sector buildings (189 buildings).
EVIDENCE GAP: Further analysis of this data is required to better understand why there is such a range of energy performance in these buildings across the county, for example is there a much older stock profile in some areas? Is planning guidance stronger in certain Districts influencing sustainable design and resultant energy use?
Through its ISO14001:2015 certified environmental management system, Kent County Council has a strong track record in reducing energy use across its estate and is on track to deliver a 32% reduction in greenhouse gas emissions over the five-year period 2016- 2021. Most significantly all traffic signals maintained by KCC use low energy light emitting diode (LED) lamp technology and a further 120,000 streetlights are being upgraded to LED in a three-year programme due to complete in 2019. This is expected to deliver over 60% reduction in electricity use from streetlighting and several million pounds of savings in energy bills and maintenance. As well as lamp upgrades a central management system
10 KENT AND MEDWAY ENERGY AND LOW EMISSIONS STRATEGY EVIDENCE BASE
will allow control of every lamp column, enabling remote switching and dimming of lighting as well as quickly identifying faults.
LED lighting also provides an excellent opportunity to significantly reduce electricity use in buildings and many public sector premises and schools have already upgraded to this technology. There are still significant opportunities for this technology to further reduce energy use across the public sector. Interest-free government funding is available through Salix Finance 19 on an invest-to-save loan basis, where the reduction in the energy bills repay the capital investment over several years.
Energy used by heating systems is another significant way to reduce energy use, emissions and costs, however the investment required across the public sector estate runs to millions of pounds and these projects have a much longer payback, usually more than 10 years. Salix Finance can be used to provide a top-up to existing capital investment budgets for heating systems replacement. For example, when converting oil fired boilers to gas systems, where an upgrade to an existing or a new gas pipeline is required at additional cost.
Other public sector organisations such as Kent Police have also made good use of this finance mechanism to implement energy efficiency measures. There is a significant opportunity to make better use of Salix Finance funding across the Kent Public Sector and this is already being considered by the NHS acute trusts as part of the Kent and Medway Sustainability and Transformation Programme.
3.1.2 Energy consumption in the domestic sector
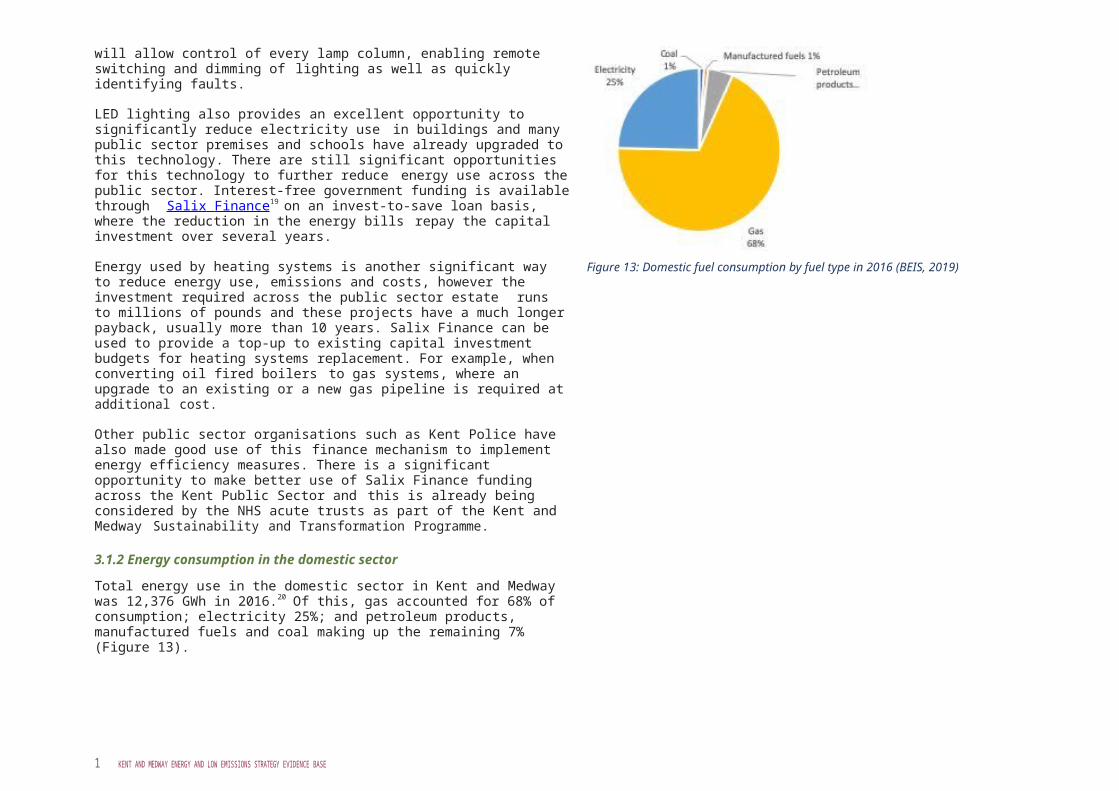
Total energy use in the domestic sector in Kent and Medway was 12,376 GWh in 2016.20 Of this, gas accounted for 68% of consumption; electricity 25%; and petroleum products, manufactured fuels and coal making up the remaining 7% (Figure 13).
Figure 13: Domestic fuel consumption by fuel type in 2016 (BEIS, 2019)
Domestic gas consumption in Kent and Medway fell 23% between 2005 and 2016; from 11,085 GWh in 2005 to 8,495 GWh in 2016 (Figure 14). Domestic electricity consumption saw a 6% fall over the same period, from 3,237 GWh in 2005, to 3,055 GWh in 2016 (Figure 15).21
Figure 14: Domestic gas consumption in Kent and Medway, 2005-2016 (BEIS, 2019)
Figure 15: Domestic electricity consumption in Kent and Medway, 2005-2016 (BEIS, 2019)

11
KENT AND MEDWAY ENERGY AND LOW EMISSIONS STRATEGY EVIDENCE BASE
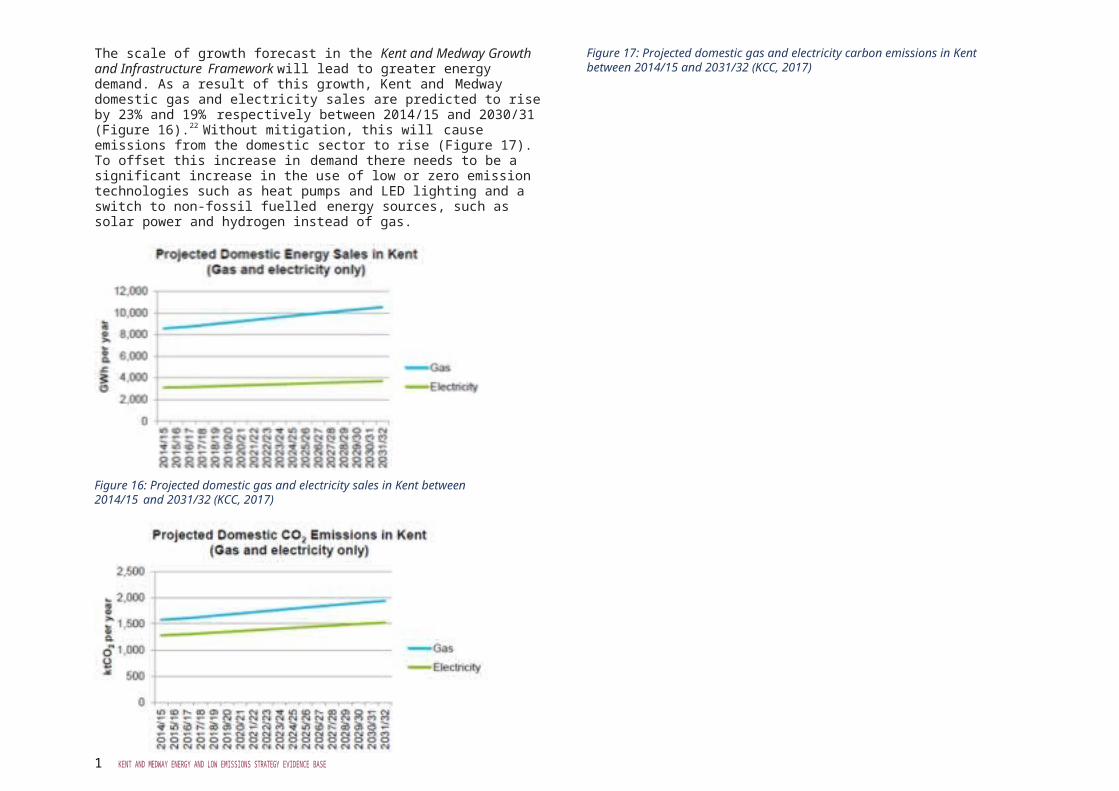
The scale of growth forecast in the Kent and Medway Growth and Infrastructure Framework will lead to greater energy demand. As a result of this growth, Kent and Medway domestic gas and electricity sales are predicted to rise by 23% and 19% respectively between 2014/15 and 2030/31 (Figure 16).22 Without mitigation, this will cause emissions from the domestic sector to rise (Figure 17). To offset this increase in demand there needs to be a significant increase in the use of low or zero emission technologies such as heat pumps and LED lighting and a switch to non-fossil fuelled energy sources, such as solar power and hydrogen instead of gas.
Figure 16: Projected domestic gas and electricity sales in Kent between 2014/15 and 2031/32 (KCC, 2017)
Figure 17: Projected domestic gas and electricity carbon emissions in Kent between 2014/15 and 2031/32 (KCC, 2017)
However, it’s important to remember that not all homes in Kent and Medway are on the gas network. In 2016, 571 GWh of energy in the domestic sector came from petroleum products (5%), 116 GWh from coal (1%) and 88 GWh from manufactured fuels (0.75%).23
The national non-gas grid map, developed for Affordable Warmth Solutions in conjunction with the Department for Business, Energy and Industrial Strategy (BEIS), shows that homes off the gas network range from 17% in Medway to 38.6% in Tunbridge Wells (Figure 18).24 This compares to 20% across Energy South2East Local Energy Strategy area.
Figure 18: Percentage of homes off the gas grid in Kent and Medway
Comparing the lower layer super output areas (LSOA), with 85-95% off-gas properties (Figure 19, dark blue on map) to levels of fuel poverty; Canterbury, Shepway and Tunbridge Wells all have off-gas grid properties with higher levels of fuel poverty at between 12 and 13% These tend to be 3 bedroom homes, privately owned or mortgaged with oil fired heating on average 500 metres or more away from the mains gas grid.
12
KENT AND MEDWAY ENERGY AND LOW EMISSIONS STRATEGY EVIDENCE BASE
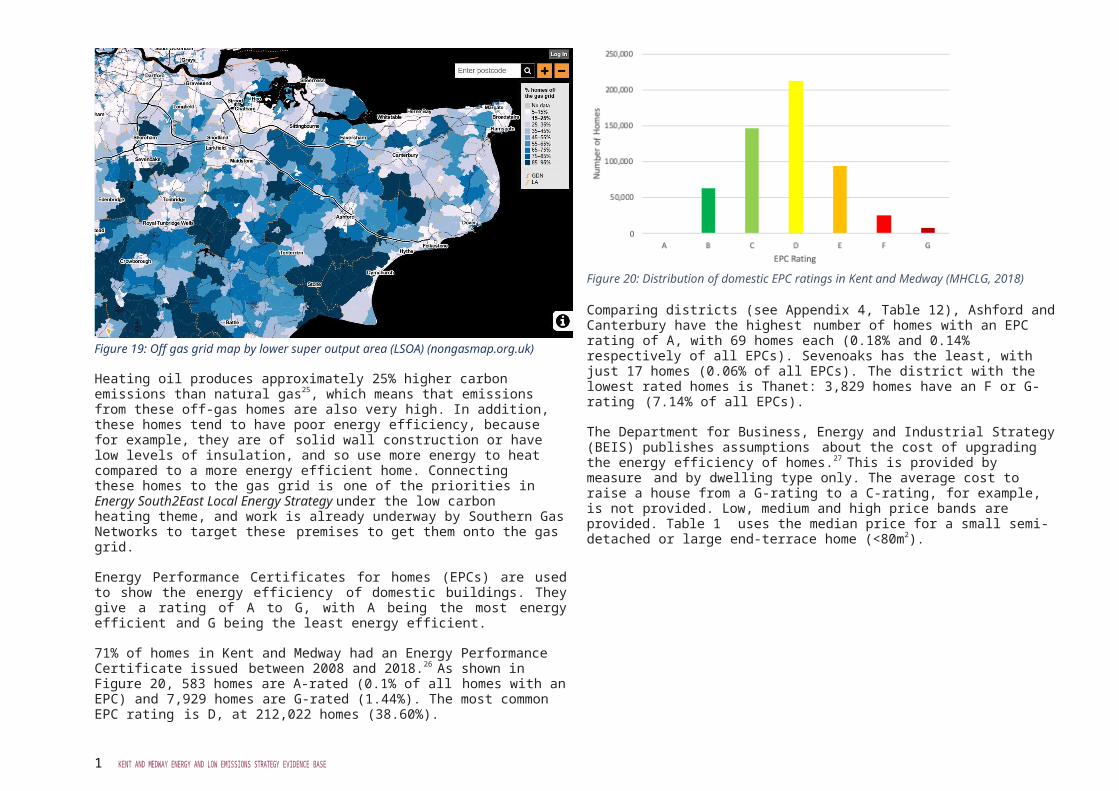
Figure 19: Off gas grid map by lower super output area (LSOA) (nongasmap.org.uk)
Heating oil produces approximately 25% higher carbon emissions than natural gas25, which means that emissions from these off-gas homes are also very high. In addition, these homes tend to have poor energy efficiency, because for example, they are of solid wall construction or have low levels of insulation, and so use more energy to heat compared to a more energy efficient home. Connecting these homes to the gas grid is one of the priorities in Energy South2East Local Energy Strategy under the low carbonheating theme, and work is already underway by Southern Gas Networks to target these premises to get them onto the gas grid.
Energy Performance Certificates for homes (EPCs) are used to show the energy efficiency of domestic buildings. They give a rating of A to G, with A being the most energy efficient and G being the least energy efficient.
71% of homes in Kent and Medway had an Energy Performance Certificate issued between 2008 and 2018.26 As shown in Figure 20, 583 homes are A-rated (0.1% of all homes with an EPC) and 7,929 homes are G-rated (1.44%). The most common EPC rating is D, at 212,022 homes (38.60%).
Figure 20: Distribution of domestic EPC ratings in Kent and Medway (MHCLG, 2018)
Comparing districts (see Appendix 4, Table 12), Ashford and Canterbury have the highest number of homes with an EPC rating of A, with 69 homes each (0.18% and 0.14% respectively of all EPCs). Sevenoaks has the least, with just 17 homes (0.06% of all EPCs). The district with the lowest rated homes is Thanet: 3,829 homes have an F or G-rating (7.14% of all EPCs).
The Department for Business, Energy and Industrial Strategy (BEIS) publishes assumptions about the cost of upgrading the energy efficiency of homes.27 This is provided by measure and by dwelling type only. The average cost to raise a house from a G-rating to a C-rating, for example, is not provided. Low, medium and high price bands are provided. Table 1 uses the median price for a small semi-detached or large end-terrace home (<80m2).
Table 1: Average cost of energy efficiency measures (BEIS, 2017)
Energy efficiency measure CostCavity wall insulation £570 (materials + labour)External solid wall insulation £8000 (materials + labour)Internal solid wall insulation £7,700 (materials + labour)Loft insulation (joists) £395 (materials + labour)Loft insulation (rafters) £2,200 (materials + labour)Double glazing £5,550 (materials + labour)Secondary glazing £110/m2 of glazing (materials + labour)Gas central heating installation £3,800Gas boiler replacement £2,800LEDs £3.50 to £10.00 (cost per bulb DIY)

Figure 21: Future Energy Scenario (Source: National Grid, 2018)
13
KENT AND MEDWAY ENERGY AND LOW EMISSIONS STRATEGY EVIDENCE BASE
3.2 Future energy scenariosEach year, National Grid publishes their F uture Ener gy Scenarios (FES)28 to identify a range of energy scenarios for the next 30 years and beyond. They look at how much energywe might need, where it could come from and what future changes might mean for the energy industry and their customers.
The 2018 FES provides a new scenarios framework linked to the speed and level of decarbonisation (Figure 21). The framework estimates speed by looking at government policy, economics and consumer attitudes, and estimates the level of decarbonisation by looking at how close the production and management of energy is to the end consumer.
Of these scenarios, only the Community Renewables and Two Degrees options will deliver the UK’s 2050 carbon reduction target. The key messages in the 2018 FES are:
• Energy capacity could double by 2050, with up to 65% of that being locally generated. This changing generation mix will mean new ways to maintain system balance will have to be found.
• Electricity demand is expected to grow significantly by 2050, driven by increased electrification of heating and transport. There could be 36 million electric vehicles by 2040; these could support the rollout of renewables by storing excess low carbon electricity generation.
• Decarbonisation of heat needs to gather pace in the 2020s to meet carbon reduction targets. Up to 60% of homes could be using heat pumps by 2050 and one third of homes could be heated by hydrogen.
In response to this, the UK government announced in its spring 2019 budget statement that a ‘future homes standard’ would ensure that new UK homes will be built without fossil fuel heating from 2025. The government also announced new proposals to increase the proportion of ‘green’ gas in the gas grid, which would help to reduce emissions from the mains gas supply. This signals the start of a phasing out of natural gas for cooking and heating. This will create significant future challenges for house developers and the future of home retrofit, which will need to consider the adoption of new technologies such as heat pumps and heat networks.
Security of energy supply is also an issue for the future. The UK’s electricity and gas supplies come from a diverse range of sources and geographical locations; it is a reliable system, but no system can be entirely risk free. Demand is generally higher in thewinter than in the summer: 70% of household gas demand happens between October and March, and on a cold day, peak demand can be three times as much as average consumption.29 Around half of Britain’s gas supplies come from our own North Sea gas fields, the remainder is imported from a variety of sources including pipelines linking us with Europe and liquified natural gas shipped in from around the world.
In the electricity system, the Capacity Market has been introduced by the government to ensure security of electricity supply. This is delivered by running annual auctions for capacity contracts, which provide a payment for reliable sources of capacity. However, in November 2018 the EU ruled that the Capacity Market could be in breach of State Aid rules and the mechanism was suspended. In February 2019, following a consultation onproposed technical amendments, the government announced a number of changes that would allow the Capacity Market to be restarted.30
There are significant electricity grid constraints within Kent and Medway making new connections increasingly difficult, particularly for energy generation projects. Innovation is required to overcome this at an infrastructure level, otherwise Kent’s growth plans will be severely hampered. Some work has already begun, with UK Power Networks (UKPN) and National Grid launching a new Active Network Management scheme to boost grid capacity and simplify the connections process for energy generators.31 However, much more innovation is needed to ensure housing developments can go ahead without significant grid connection charges.
14
KENT AND MEDWAY ENERGY AND LOW EMISSIONS STRATEGY EVIDENCE BASE
2015 to 2032 energy allowance from GHG sources andenergy demand ‘gap’ to be from clean generation
150,000
47,45565,665cleanenergy
100,000
44,146
50,000 48,71533,041
GHG-Emitting Energy Sources
31,890 21,628
2015 Tri LEP2032 TRI LEP ENERGYenergy demandDEMAND‘Gap’ in demand to be met from clean generation TransportDomesticIndudsty & Commercial
3.3 Greenhouse gas emissions from energy demand
3.3.1 National policy context and trends
The Climate Change Act 2008 commits the UK to reducing emissions of carbon dioxide and other greenhouse gases by at least 80% from 1990 levels by 2050.32 Progress against the 2050 target is measured by legally-binding carbon budgets, which cap the amount of greenhouse gases that can be emitted by the UK over a five-year period: these are measured by the Committee on Climate Change (CCC).
The South2East Local Energy Strategy highlights that the reduction in energy demand needed to meet the 2032 carbon budget is very unlikely to be met by a reduction in energy demand by society in general; ie. we will want more energy than greenhouse gas emission allowances will allow (Figure 23). Instead, the difference between demand and traditional energy supply will have to be made up by clean (low and zero emission) energy generation at both a national and local scale. This will include existing knowntechnologies such as solar, wind and energy from waste; but will also need to incorporate more innovative solutions, such as the wider adoption of heat pumps, the wide-scale development of low carbon heat networks and hydrogen as an energy source. An
34
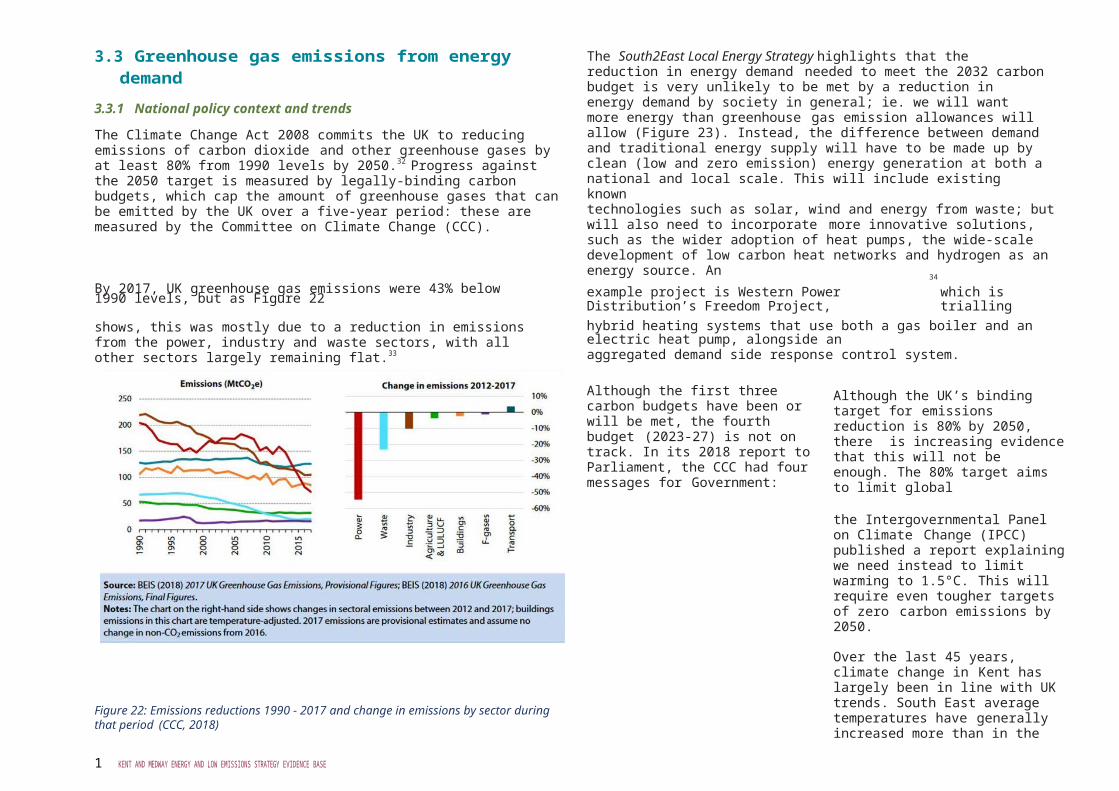
By 2017, UK greenhouse gas emissions were 43% below 1990 levels, but as Figure 22 example project is Western Power Distribution’s Freedom
Project,which is trialling
shows, this was mostly due to a reduction in emissions from the power, industry and waste sectors, with all other sectors largely remaining flat.33
hybrid heating systems that use both a gas boiler and an electric heat pump, alongside anaggregated demand side response control system.
Figure 22: Emissions reductions 1990 - 2017 and change in emissions by sector during that period (CCC, 2018)
Although the first three carbon budgets have been or will be met, the fourth budget (2023-27) is not on track. In its 2018 report to Parliament, the CCC had four messages for Government:
Although the UK’s binding target for emissions reduction is 80% by 2050, there is increasing evidence that this will not be enough. The 80% target aims to limit global
the Intergovernmental Panel on Climate Change (IPCC) published a report explaining we need instead to limit warming to 1.5°C. This will require even tougher targets of zero carbon emissions by 2050.
Over the last 45 years, climate change in Kent has largely been in line with UK trends. South East average temperatures have generally increased more than in the north of the country; our sea level has risen about 1 mm per year since the mid-20th century; we’ve seen more heavy winter downpours; and a decrease in summer rainfall. Other gradual changes have been recorded in Kent, which also indicate the impact of climate change:
• sea level rise at Sheerness• earlier emergence dates for butterflies
Figure 23: Comparison of 2015 to 2032 energy demand by Sector, highlighting energy “gap” to be met by clean energy (Energy South2East, 2019)
• support simple, low-cost options • commit to effective regulation and strict enforcement
15
KENT AND MEDWAY ENERGY AND LOW EMISSIONS STRATEGY EVIDENCE BASE
• end the chopping and changing of policy• act now to keep long term options open.
• earlier arrival and breeding of bird species that require warmer climates.
For further information on the impacts of climate change in Kent can be found in the Local Climat e Impacts P rofile (LCLIP), which summarises local impacts in the county from 1996-2010.35 An updated risk assessment will be available in 2019.
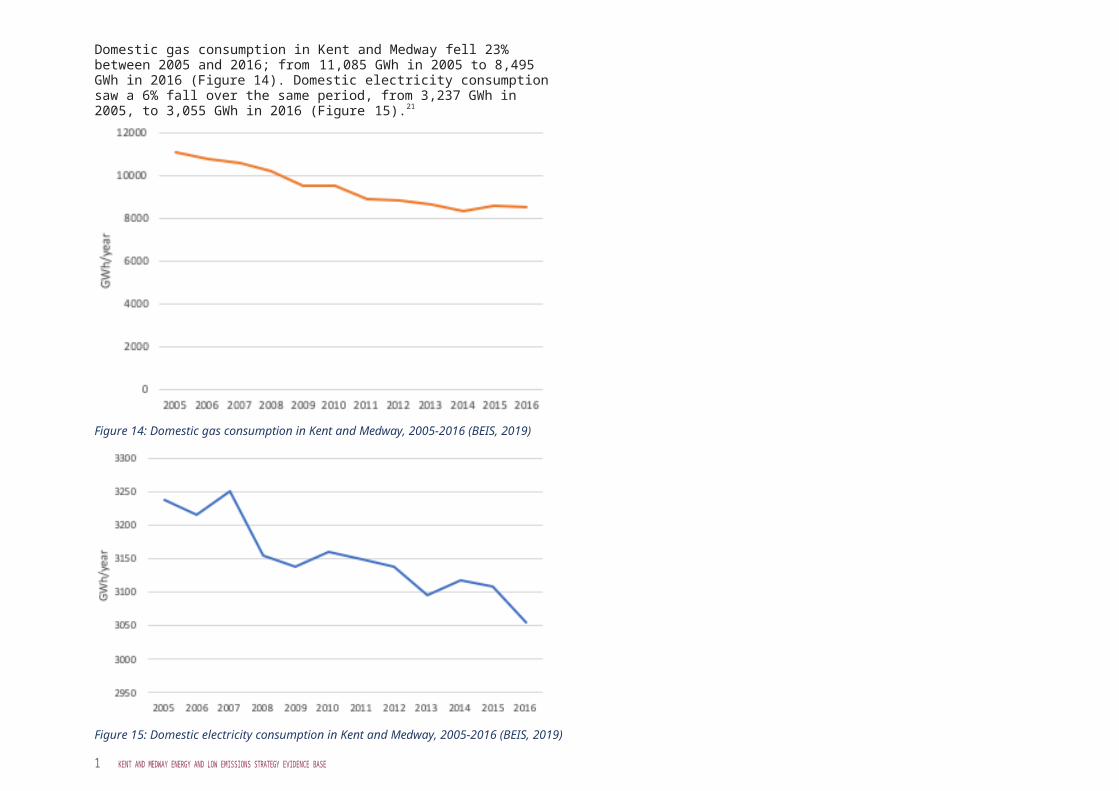
Figure 26: Percentage of Kent and Medway carbon dioxide emissions by sub-sector (BEIS 2018)
16
KENT AND MEDWAY ENERGY AND LOW EMISSIONS STRATEGY EVIDENCE BASE
3.3.2 Kent and Medway emissions from energy demand
Since 2005, the government has produced annual estimates of carbon dioxide emissions at a local authority level. These are intended as a resource to help the monitoring of efforts to reduce carbon dioxide emissions. The dataset includes all the emissions in the national inventory, excluding aviation, shipping and military transport; for which there is no obvious basis for allocating to local areas.
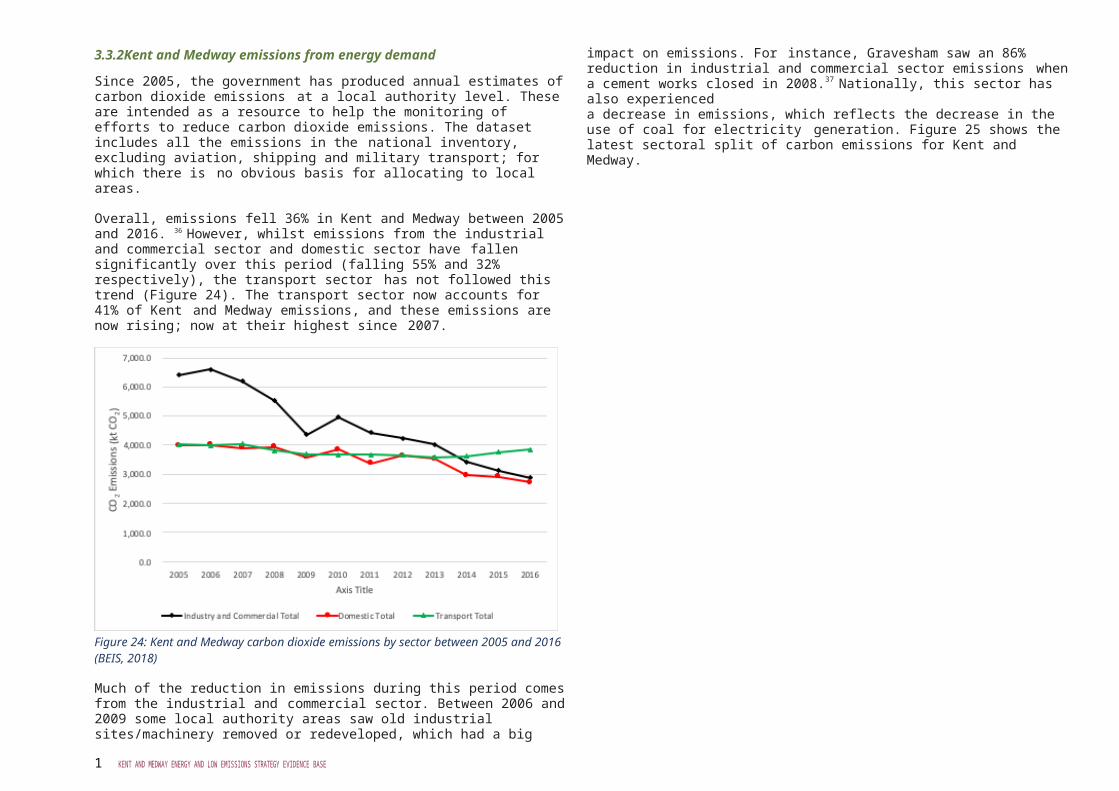
Overall, emissions fell 36% in Kent and Medway between 2005 and 2016. 36 However, whilst emissions from the industrial and commercial sector and domestic sector have fallen significantly over this period (falling 55% and 32% respectively), the transport sector has not followed this trend (Figure 24). The transport sector now accounts for 41% of Kent and Medway emissions, and these emissions are now rising; now at their highest since 2007.
Figure 24: Kent and Medway carbon dioxide emissions by sector between 2005 and 2016 (BEIS, 2018)
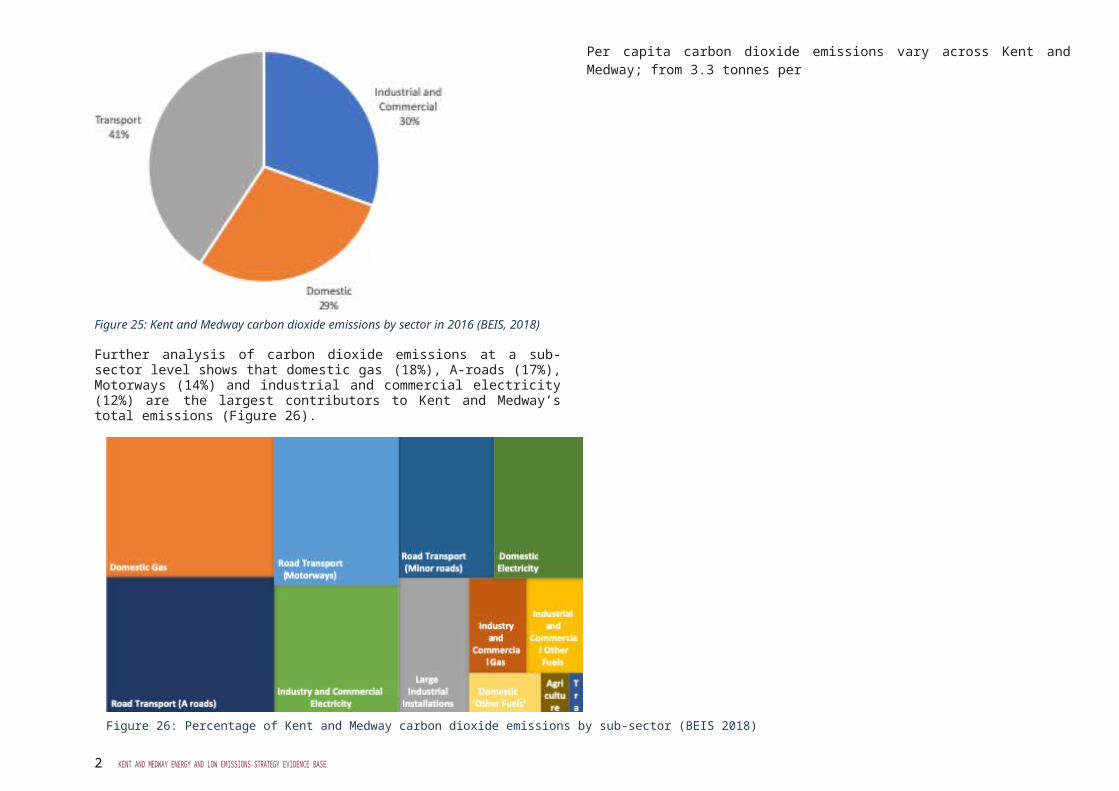
Much of the reduction in emissions during this period comes from the industrial and commercial sector. Between 2006 and 2009 some local authority areas saw old industrial sites/machinery removed or redeveloped, which had a big impact on emissions. For instance, Gravesham saw an 86% reduction in industrial and commercial sector emissions when a cement works closed in 2008.37 Nationally, this sector has also experienceda decrease in emissions, which reflects the decrease in the use of coal for electricity generation. Figure 25 shows the latest sectoral split of carbon emissions for Kent and Medway.
Figure 25: Kent and Medway carbon dioxide emissions by sector in 2016 (BEIS, 2018)
Further analysis of carbon dioxide emissions at a sub-sector level shows that domestic gas (18%), A-roads (17%), Motorways (14%) and industrial and commercial electricity (12%) are the largest contributors to Kent and Medway’s total emissions (Figure 26).
Per capita carbon dioxide emissions vary across Kent and Medway; from 3.3 tonnes per
17
KENT AND MEDWAY ENERGY AND LOW EMISSIONS STRATEGY EVIDENCE BASE
capita in Medway, to 8.5 tonnes in Swale (Figure 27). The average for the South East is 5 tonnes and the average for England is 5.3 tonnes.38 The variation within Kent and Medway is mostly due to the amount of energy intensive industry in the local authority area and the extent of the motorway network. Population density also influences the per capita emissions calculation.
Figure 27: 2016 per capita carbon dioxide emissions for Kent and Medway by local authority area (BEIS 2018)
Carbon dioxide emissions associated with gas and electricity consumption in Kent have decreased by approximately 21% since 2012, from 6,191 ktCO2 per year to 4,868 ktCO2
per year. This change can be attributed to:
• Differences in energy consumption: gas consumption decreased by approximately 10% while electricity consumption increased by approximately 1%.
• Differences in the fuel emissions factors: the carbon intensity of gas has remained relatively stable, while that of electricity has dropped by nearly 30%, from 0.521 kgCO2/ kWh to 0.345 kgCO2/kWh, due to the near elimination of the use of coal to produce electricity and an increasing proportion of electricity generated by wind and solar.
3.4 Fuel poverty
Fuel poverty in England is measured using the ‘Low-Income High-Costs’ (LIHC) indicator.
Under this indicator, a household is considered to be in fuel poverty if:
• they have required fuel costs that are above average (the national median level)• were they to spend that amount, they would be left with a residual income below
the official poverty line.
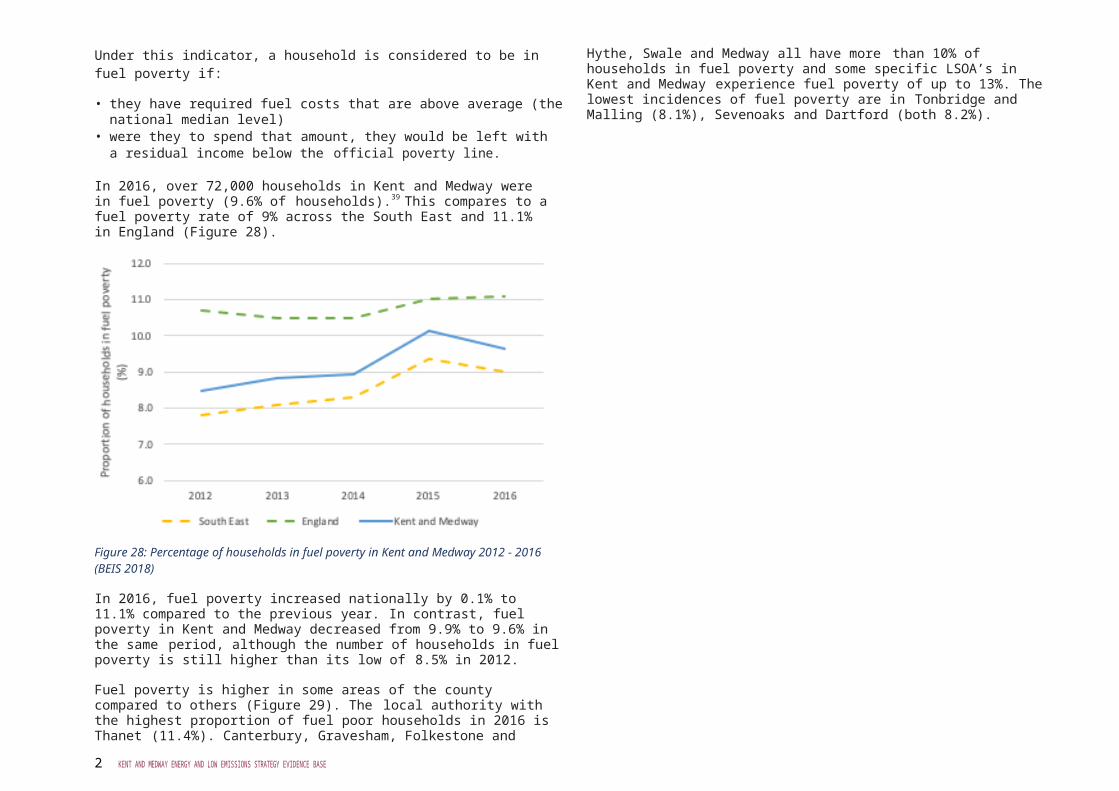
In 2016, over 72,000 households in Kent and Medway were in fuel poverty (9.6% of households).39 This compares to a fuel poverty rate of 9% across the South East and 11.1% in England (Figure 28).
Figure 28: Percentage of households in fuel poverty in Kent and Medway 2012 - 2016 (BEIS 2018)
In 2016, fuel poverty increased nationally by 0.1% to 11.1% compared to the previous year. In contrast, fuel poverty in Kent and Medway decreased from 9.9% to 9.6% in the same period, although the number of households in fuel poverty is still higher than its low of 8.5% in 2012.
Fuel poverty is higher in some areas of the county compared to others (Figure 29). The local authority with the highest proportion of fuel poor households in 2016 is Thanet (11.4%). Canterbury, Gravesham, Folkestone and Hythe, Swale and Medway all have more than 10% of households in fuel poverty and some specific LSOA’s in Kent and Medway experience fuel poverty of up to 13%. The lowest incidences of fuel poverty are in Tonbridge and Malling (8.1%), Sevenoaks and Dartford (both 8.2%).

18
KENT AND MEDWAY ENERGY AND LOW EMISSIONS STRATEGY EVIDENCE BASE
Figure 29: Fuel poverty in Kent and Medway in 2016, by local authority area (BEIS, 2018)
Resident environmental perception surveys are carried out every two years as part of the monitoring of the Kent Environment Strategy. Data from 600 interviews undertaken in July 2018 has been published.40 The survey results show that 11% of people struggle to pay their energy bills to some extent, which is slightly higher than the Government figures of 9.6% of fuel poverty for Kent and Medway. The proportion who noted they struggle,is highest amongst those aged 25-44 (15%) and those living in rented accommodation (41%).
Government data shows that household expenditure on energy is rising (Figure 30). The UK average standard annual gas and electricity bill has risen £320 over the last ten years, with the average domestic combined bill in 2018 costing £1,314. 41
Average billsin the South East are slightly higher than the UK average; in 2018 the South East average gas and electricity bills were £66142 and £67043; giving a combined cost of £1,331 (1.29% higher than the UK average). Average costs are lower for those on direct debit (~70%of southeast customers), higher for those on prepayment meters (~10% of southeast customers) and highest for those on credit meters (~20% of southeast customers).
Figure 30: Average standard UK domestic electricity and gas bills 2008 – 2018 (BEIS, 2019)
Delivering A ffor dable Warmth: a fuel poverty str ategy for K ent 44, was published by the Kent Energy Efficiency Partnership in 2016. It outlines the actions required to address Fuel Poverty in the county and is delivered in part, through the Kent and M edway War m Homes Scheme 45. Since the scheme began in 2014, Kent and Medway partners have installed over 2,400 energy efficiency measures in over 2,300 homes; helping to save residents £8.8 million over the measures’ lifetime. Despite this positive activity, which alsoincludes helping residents switch to cheaper energy tariffs and claim the benefits they are eligible for, the significant rise in annual costs of energy is making it more difficult to lift households out of fuel poverty.
Fuel poverty often leads to people living in cold, damp homes. This can contribute to increasing the risk of poor health outcomes, as well as increased morbidity and mortality. Public Health England monitors the levels of fuel poverty and excess winter deaths (EWDs) at a national and council level. The number of EWDs depends on the temperature and the level of disease in the population, including the levels of seasonal influenza, and other factors, such as how well-equipped people are to cope with a fall in temperature. Mortality during winter increases more in England and Wales compared to other European countries with colder climates, suggesting that many more deaths could be preventable in England and Wales.
EWDs (or excess winter mortality – EWM) is measured by an EWM Index, calculated as excess winter deaths divided by the average non-winter deaths, expressed as apercentage. The EWM Index for England is 21.2 and for the south-east is 21.9 (Figure
19
KENT AND MEDWAY ENERGY AND LOW EMISSIONS STRATEGY EVIDENCE BASE
31). The index varies considerably in Kent and Medway: by far the highest EWM Index is in Dover (35.6), then Gravesham (30.7). The lowest is in Tunbridge Wells where it’s just 9.8.

20
KENT AND MEDWAY ENERGY AND LOW EMISSIONS STRATEGY EVIDENCE BASE
Thanet, Maidstone, Medway and Tonbridge and Malling are also all below the English average.46
Figure 31: Excess winter mortality index, 2016-2017 (ONS, 2018)
Older people are particularly vulnerable to higher mortality risk, and physical and mental health problems are likely to be exacerbated by living in a cold home. Provisional data for 2017/2018 indicates that around 23% of EWDs are attributable to cardio-vascular diseases and 35% are attributable to respiratory diseases.47 21.5% of all EWDs are attributable to the coldest quarter of housing.48
In 2014, Age UK estimated that the adverse health effects of living in a cold home carry an estimated cost to the NHS of £1.36 billion a year.49 This cost to the NHS does not include additional spending by social services or economic loss through missed work.
3.5 Renewable and low carbon energy in Kent and Medway
3.5.1 Current renewable energy and low carbon capacity
In 2017, Kent County Council commissioned an update to the Renew able Ener gy Action Plan for K ent report which assesses renewable energy capacity and trajectories across the county.50 Renewable and combined heat and power (CHP) capacity across Kent has increased significantly in the last five years (Figure 32). The capacity of solar, wind, waste and CHP combined that was active, agreed or under construction was reported as over1,900 MW (including offshore wind farms), compared with approximately 230 MW in 2012. Most of this increase has been delivered through off shore wind and solar installations, with wind contributing over 1,100 MW and solar over 550 MW.
Figure 32: Renewable and CHP capacity in Kent and Medway, 2012 vs 2017: Active, agreed and under construction (KCC, 2017)
3.5.2 Solar and wind generation
The Energy South2East Local Energy Strategy states that solar PV schemes can produce up to 36% more electricity in the South East than elsewhere in the UK. Approximately 80% of the solar generation capacity in Kent and Medway comes from large installations of over0.5 MW (457 MW). The rest (113 MW) is made up from many smaller scale installations. 91% (1020 MW) of wind energy capacity comes from large offshore installations (>2MW). Large onshore wind installations make up 8% (84 MW) with the rest coming from small scale installations.
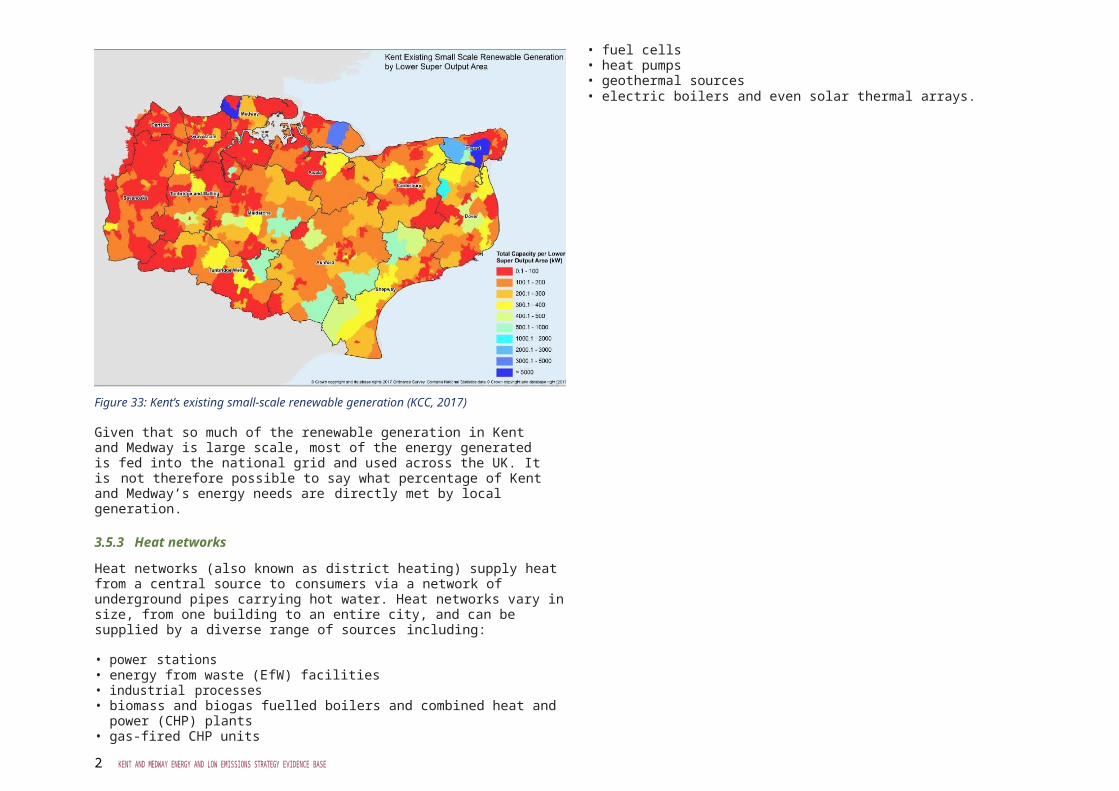
The geographical spread of existing small-scale renewable generation (defined as those<0.5MW, mainly solar and wind) can be seen in Figure 33. Blue indicates high levels of installations, whilst red indicates low levels. The map shows that there are fewerinstallations in West Kent. The highest levels are in Medway, Swale (Isle of Sheppey) and Thanet.

21
KENT AND MEDWAY ENERGY AND LOW EMISSIONS STRATEGY EVIDENCE BASE
Figure 33: Kent’s existing small-scale renewable generation (KCC, 2017)
Given that so much of the renewable generation in Kent and Medway is large scale, most of the energy generated is fed into the national grid and used across the UK. It is not therefore possible to say what percentage of Kent and Medway’s energy needs are directly met by local generation.
3.5.3 Heat networks
Heat networks (also known as district heating) supply heat from a central source to consumers via a network of underground pipes carrying hot water. Heat networks vary in size, from one building to an entire city, and can be supplied by a diverse range of sources including:
• power stations• energy from waste (EfW) facilities• industrial processes• biomass and biogas fuelled boilers and combined heat and power (CHP) plants• gas-fired CHP units• fuel cells• heat pumps• geothermal sources• electric boilers and even solar thermal arrays.
Heat networks currently supply around 1% of building’s heat demand in the UK. The government’s Clean Gr owth Str ategy 51 estimates that heat networks will meet 17% of heat demand in homes and up to 24% of heat demand in industrial and public-sector buildings by 2050.52
The South2East Local Energy Strategy proposes that the building and extension of heat networks be encouraged, particularly in new build developments: ‘Taking these schemes from concept to commissioning should be a priority for the region since they deliver substantial reductions in emissions and provide good rates of return for investors’.53 The strategy sees a key role for the Greater South East Local Energy Hub in ensuring public and private sectors work together to identify opportunities and overcome any technical or commercial obstacles for the development of heat networks.
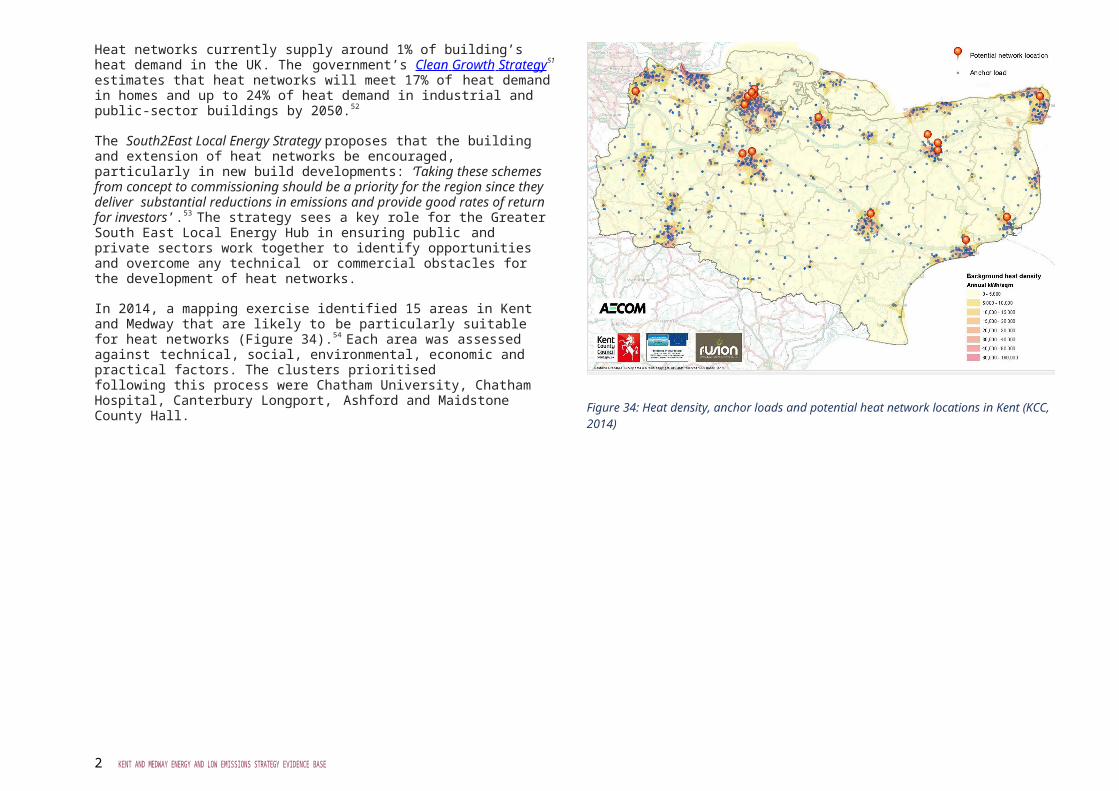
In 2014, a mapping exercise identified 15 areas in Kent and Medway that are likely to be particularly suitable for heat networks (Figure 34).54 Each area was assessed against technical, social, environmental, economic and practical factors. The clusters prioritisedfollowing this process were Chatham University, Chatham Hospital, Canterbury Longport, Ashford and Maidstone County Hall.

22
KENT AND MEDWAY ENERGY AND LOW EMISSIONS STRATEGY EVIDENCE BASE
Figure 34: Heat density, anchor loads and potential heat network locations in Kent (KCC, 2014)
20 KENT AND MEDWAY ENERGY AND LOW EMISSIONS STRATEGY EVIDENCE BASE
More detailed feasibility and planning work is taking place for a heat network in north Maidstone, incorporating Kent County Council offices, Maidstone Prison and a new commercial development.55
3.5.4 Nuclear power
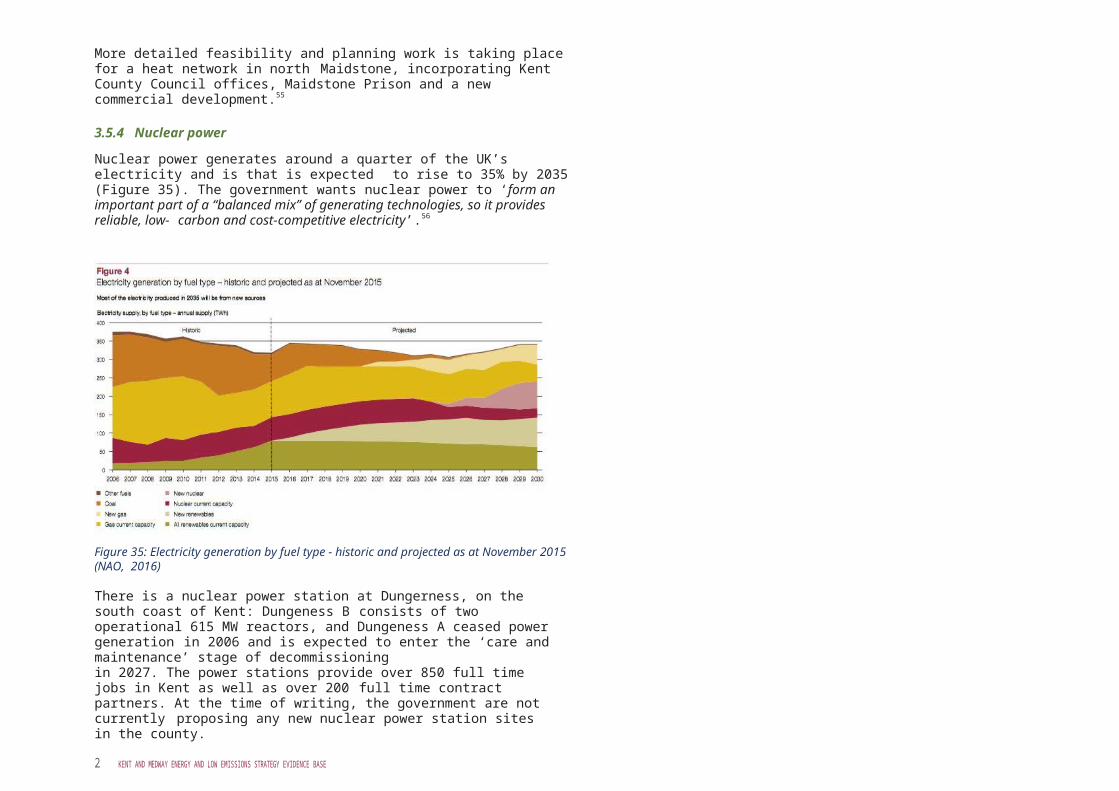
Nuclear power generates around a quarter of the UK’s electricity and is that is expected to rise to 35% by 2035 (Figure 35). The government wants nuclear power to ‘form an important part of a “balanced mix” of generating technologies, so it provides reliable, low- carbon and cost-competitive electricity’.56
Figure 35: Electricity generation by fuel type - historic and projected as at November 2015 (NAO, 2016)
There is a nuclear power station at Dungerness, on the south coast of Kent: Dungeness B consists of two operational 615 MW reactors, and Dungeness A ceased power generation in 2006 and is expected to enter the ‘care and maintenance’ stage of decommissioningin 2027. The power stations provide over 850 full time jobs in Kent as well as over 200 full time contract partners. At the time of writing, the government are not currently proposing any new nuclear power station sites in the county.
Whilst nuclear energy is zero emission, nuclear power plants require greater levels of capital investment and longer timescales to build than other forms of power generation. They also produce significant quantities of hazardous radioactive waste that requires specialist treatment, containment and secure disposal, long after a plant has been decommissioned: this makes nuclear power a less attractive option

20 KENT AND MEDWAY ENERGY AND LOW EMISSIONS STRATEGY EVIDENCE BASE
environmentally.
21
KENT AND MEDWAY ENERGY AND LOW EMISSIONS STRATEGY EVIDENCE BASE
4. Transport and travelTransport makes up 41% of Kent and Medway carbon emissions and transport emissions are on the rise; now at their highest since 2007 (see section 3.3.2 and Figure 25). This increase in emissions reflects the growth in the overall number of vehicles on the road, particularly vans.57 In Kent, freight transport volumes are disproportionally greater than other parts of the UK strategic road network, with 2.5 million HGV freight movements through Dover58 and 1.7 million lorry movements through Eurotunnel59 in 2018.
This intercontinental traffic creates air pollution and increased traffic volumes along the M2/A2 and M20/A20 corridors, which contributes to background air pollution levels and peak traffic congestion.
The main air pollutants are nitrogen dioxide (NO2) and to a lesser extent particulate matter (PM), which mainly impacts on residents living in urban town centres and along busy A roads or close to the motorways.
Economic growth predicts an increase in traffic volumes. Without positive interventions, this could see increased congestion, increased journey times and increases in the concentration of air pollutants along specific routes or in specific locations. The transport measures that can have an impact in reducing these air pollutants can be summarised as:
• strategic road network improvements and specific junction improvements to increase capacity and improve traffic flow e.g. funded through Local Growth Fund
• targeted use of low or ultra-low emission zones (also known as clean air zones)• update vehicle fleets to accelerate the uptake of EURO 6/Real Driving Emission
test (RDE) compliant vehicles• targeted measures, including retrofitting, for fleets operating in urban areas; such
as buses and taxis• increasing the availability of electric vehicle charge points and non-fossil fuel
refuelling facilities eg hydrogen• licensing policies for taxis• improved walking and cycling infrastructure, including connectivity to public
transport, schools and business parks• schemes that enable car sharing, or provide access to ultra-low emission pool cars
and bicycles• organisation-wide travel plans supported by smarter working, travel and
parking policies that promote alternatives to car travel• raising awareness of personal actions to reduce emissions and protect health.
All these measures can be found in the individual air quality action plans for Kent and Medway. For the first time, countywide data and information is being reviewed to identify which of these measures need to be prioritised for increased partnership
action to target reductions in air pollution.
22
KENT AND MEDWAY ENERGY AND LOW EMISSIONS STRATEGY EVIDENCE BASE
4.1 Transition to Ultra Low Emission Vehicles (ULEV)Ultra Low Emission Vehicles (ULEVs) are currently defined as having less than 75 grams of CO2 per kilometre (g/km) from the tail pipe. Due to advancements in technology, from 2021 the Vehicle Certification Agency expects to define ULEVs as a car or van that emits less than 50 g/km CO2.60
In 2018, the government published its Road to Zero Strategy61 setting out its ambition for at least 50%, and as many as 70%, of new car sales to be ULEVs by 2030, alongside up to 40% of new vans. By 2040, the ambition is for all new road vehicles to be “effectively zero emission”. This marks a significant step change in UK policy to deliver on the ambitions set out in the UK’s Clean Growth Strategy and supports delivery of the Clean Air Str ategy 2019.62
The transition to zero emission vehicles, paves the way for the investment and development of alternative fuels and technologies, for example; electric, hydrogen and compressed natural gas. With the government incentivising the switch to electric cars and vans by providing a grant towards the cost of a new vehicle, the take up of electric vehicles is significantly increasing.
In Kent and Medway during 2018-19, the Low Carbon Across the South East (LoCASE) business support programme has also been able to offer additional grants to further incentivise the adoption of electric vehicles by local small and medium sized businesses. At the time of writing, this has helped 16 businesses invest in a range of ultra-low emission fleet vehicles, from pool cars to all-electric work vans to reduce their running costs and air quality impacts. There was also significant interest and take up from taxi operators. Up to March 2019, 27 grants had been awarded to taxi businesses with 18of these for the TX black taxi with demand for grants outstripping availability for these owner-operators.
There were 3,850 ULEVs registered in Kent and Medway by the end of 2018 and this growth is largely in line, if not slightly exceeding, the UK trend (Figure 36).63

23
KENT AND MEDWAY ENERGY AND LOW EMISSIONS STRATEGY EVIDENCE BASE
Figure 36: Number of ULEVs registered in Kent and Medway and UK per quarter 2011-18 (DfT, 2019)
Public Transport is also being transformed, with several national and regional bus providers introducing electric-hybrid and other low emission buses, particularly those used in busy town centres and along major commuter routes. Fully electric buses were demonstrated in Kent during a trial along the Dartford Fast-track route in 2018.64 Following this successful trial, Fastrack vehicles are being considered for electrification from the start of the 2022 contract, dependent upon the complimentary infrastructure being installed.
KCC encourage operators to upgrade current diesel engines to the cleanest possible current modes and are actively encouraging the transfer to alternatively powered vehicles by coordinating applications for government grants to help reduce local air pollution.Large bus operators in the county are making significant progress towards EURO V and VI standards. More work is needed to support providers of public transport; especially smaller companies who operate older vehicle fleets.
KCC commits around £5.7 million to support rural bus routes and off-peak services not provided by commercial operators. In light of challenging budgets, the council is also exploring innovative and sustainable ways of providing transport to rural communities in Kent. Based on feedback from a public consultation called ‘The Big Conversation’ in July 2018,65 five pilot schemes in Dover, Maidstone, Sevenoaks, Tenterden and West Malling are due to launch in summer 2019. The success of the pilot schemes will be
determined by several measures, including customer feedback and passenger numbers.
24
KENT AND MEDWAY ENERGY AND LOW EMISSIONS STRATEGY EVIDENCE BASE
Hydrogen and compressed natural gas are also being adopted as alternative low emission fuels, albeit on a smaller scale, which at the time of writing are predominantly in use by larger commercial vehicle operators. The lack of refuelling stations along the strategic road network is a significant barrier, with Kent’s closest hydrogen refuelling station being on the M25 at Cobham services. However, as has been the case for the growth in electric vehicles, as the refuelling network grows, the uptake of vehicles is expected to increase; and this is likely to be achieved within the next decade.
4.1.1 Electric vehicle strategy
There is increasing demand for charging infrastructure by members of the public who are switching to plug-in electric vehicles. Consequently, KCC are considering their role in supporting a shift to electric and hybrid plug-in vehicles, and in addressing the county’s electric vehicle infrastructure requirements.
There is a need for additional planning guidance to help ensure new developments adequately support their residents to adopt plug-in vehicles, and this will be included in future updates to the Kent Design Guide. Creating public charging hubs in partnerships with local authorities and the private sector is considered important to help allay ‘range anxiety’ fears, for those wishing to make longer journeys in plug-in vehicles. Additionally, KCC will consider the testing of new charging technologies on the public highway and will look for ways to enhance the use of plug-in vehicles in KCC’s own fleet, as well as those of its partners.
4.2 Active travelActive travel is defined as walking or cycling as a means of transport, in order to get to a destination such as work, school, the shops or to visit friends. It does not cover walking and cycling done purely for pleasure, for health reasons, or simply walking the dog.
In 2015, the Department of Transport published a report called Investing in Walking and Cycling: The Economic Case for Action66 which concluded that ‘sustainable and more specifically, active travel interventions, have the potential to deliver strong benefits and deserve a place in the modern toolkit of transport policy’. Importantly from a return on investment perspective, the report also concluded that ‘sustainable travel, as well as cycling and walking, can deliver very high benefits when compared to their costs’.
The report draws on evidence from several UK active travel intervention studies and the benefit cost ratios calculated, ranging from 2.6:1 to 10:1. The report further confirms that ‘one can confidently conclude that sustainable travel and cycling and walking in particular, regularly offer high and very high value for money.’

25
KENT AND MEDWAY ENERGY AND LOW EMISSIONS STRATEGY EVIDENCE BASE
4.2.1 Current active travel in Kent and Medway
Data from the 2011 Census revealed that 54.4% of Kent’s residents aged 16 to 74 who were in employment travelled to work by driving a car or van, 10.1% travelled by foot and 1.7% cycled (Figure 37). The amount walking to work is higher than both the national and regional average of 9.8%. However, the amount cycling to work in Kent is lower than the English (1.9%) and South East (2.0%) averages. Between 2001 and 2011, the number of people who walked or cycled to work in Kent decreased by 0.8% (Figure 38). This is in line with the decreases recorded nationally and regionally. In the UK, the decreases have coincided with increases in the distance travelled to work.
Figure 37: Method of travel to work in Kent - 2011 Census (ONS, 2011)
Figure 38: Proportion of Kent residents travelling to work on foot or bicycle in 2001 and 2011 (ONS, 2001/2011)
According to the Department of Transport’s National Travel Survey figures for 2017, 51% of English primary school children and 35% of English secondary school children walk to school.67 The proportion of primary school children walking to school has remainedbroadly similar since 2002, but the proportion of secondary school children has decreased by 10% since 2002. This in part reflects the longer distances secondary children travel to school.
In Medway, 56.7% of pupils aged 5-10 and 51.6% of pupils aged 11-15 walked to school in 2017/1868, which is significantly higher than the national averages.
In Kent, 60.4% of primary school pupils and 32.1% of secondary school pupils walked, cycled, scooted or parked and walked to school in 2017.
Figures 39 and 40 show the distribution of transport modes used by Kent primary and secondary school children in 2017, based on the data provided through school travel plans. The sample size for the 2017 schools’ data was 24,433 respondents for primary schools and 18,560 respondents for secondary schools. Although this demonstrates a positive picture, this data only covers schools participating in the travel plan initiative (19.5% of primary school children and 18.6% of secondary school children).

26
KENT AND MEDWAY ENERGY AND LOW EMISSIONS STRATEGY EVIDENCE BASE
Figure 39: Mode of travel to Kent primary schools in 2017 (KCC, 2017)
Figure 40: Mode of travel to Kent secondary schools in 2017 (KCC, 2017)
4.2.2 KCC Active Travel Strategy
KCC published its Active Travel Strategy69 in March 2017 and aims to make active travel an attractive and realistic choice for short journeys in Kent. By developing and promoting accessible, safer and well-planned active travel opportunities, this strategy will help to establish Kent as a pioneering county for active travel. The strategy has three main action areas:
1. integrate active travel into planning2. provide and maintain appropriate routes for active travel3. support active travel in the community.
The strategy sets targets for active travel in Kent1, including by 2021:
• 2 in 3 primary children and 1 in 3 secondary children will travel actively to school• the proportion of people that work within 5km of their home and actively travel
to work in Kent to increase to 40%• the number of people cycling along key routes monitored by the Department
of Transport in Kent to increase by 10%.
A key action is to target regular short journeys, such as to work and school, in areas where there is peak traffic congestion and local air pollution hotspots.
4.2.3 Public rights of way
The Public Rights of Way network provides ‘off the highway’ walking and cycling routes. The network is increasingly being improved and promoted as a healthier route to work, school and the rail network; avoiding the pollution generated by road traffic. This includes benefitting from schemes funded by the Local Growth Funds such as:
• West Kent Local Sustainable Transport (cutting congestion) - A package of schemes and initiatives to allow people to transfer between different types of transport; making sustainable transport a real alternative to the private car in Sevenoaks, Maidstone, Tunbridge Wells and Tonbridge and Malling.70
• Kent Thameside Local Sustainable Transport (integrated door-to-door journeys) - to improve walking and cycling facilities in and around bus and train stations in Dartford and Gravesham, as well as improving the Fastrack service to reduce the reliance on cars.71
• Sholden village housing development, near Deal - KCC is providing upgrades to existing public footpaths to facilitate cycling. These improvements are beingcompleted at the request of the parish council and in response to planning application conditions to provide traffic free cycle access to local schools, Fowlmead Country Park and Deal town centre.
1 These targets do not currently include Medway.

27
KENT AND MEDWAY ENERGY AND LOW EMISSIONS STRATEGY EVIDENCE BASE
4.3 Emissions from maritime traffic and aviation4.3.1 Emissions from maritime trafficIn January 2019, the Government published Maritime 2050: Navigating the Future,72
which is due to be supported by a ‘Clean Maritime Plan’, to be published in summer 2019.
The ambition is for the UK to be a global exemplar in green maritime issues. The Maritime Strategy includes the aims that by 2050: the impact of the UK maritime sector on the environment is close to zero, as well as a leading supplier of zero and low emission shipping technology and green maritime finance.
The Government requires major ports to publish Port Air Quality Strategies in summer 2019 and will work with ports to review their understanding and implementationof climate change adaptation measures and encourage periodic reporting via the Adaptation reporting power.
The Dover Strait is one of the busiest straits in the world, with almost 20% of worldwide maritime traffic passing through in 2006.73 Data collected through a study for the EU
The study also revealed that more than 70,000 ships passed through the strait in 2016 without calling at any of the strait’s ports, and these vessels carried about 702 million tonnes of cargo. The study concluded that maritime activity in the Dover Strait was responsible for 104 million tonnes of CO2e, from which just 14% was emitted within the boundary of the strait. The study highlights the difficulties Kent and Medway, and indeed the UK government, have in influencing and tackling the impacts of maritime traffic in the Dover Strait.
4.3.2 Emissions from aviation
The Government is also consulting on Aviation 2050: the future of UK aviation, due to be completed in summer 2019.The executive summary states “The UK has the largestaviation network in Europe and the third largest in the world. Aviation directly contributes at least £22 billion to the economy and supports around half a million jobs. The government supports the growth of aviation and the benefits this would deliver, provided that growth takes place in a sustainable way, with actions to mitigate the environmental75
Interreg PASSAGE project (and shown in Table 2), estimated that cross-border activities in the Dover Strait emitted over 2.5 million tonnes of carbon dioxide equivalent (CO2e) in2016, with an additional 1.2 million tonnes emitted from port operations and road and rail traffic related to the Port of Dover and Channel Tunnel. 74
impacts.”
The objectives of the strategy are to:
• help the aviation industry work for its customers• ensure a safe and secure way to travel• build a global and connected Britain• encourage competitive markets• support growth while tackling environmental impacts• develop innovation, technology and skills.
This includes asking for views on reducing the environmental and air quality impacts of aviation, including improving connectivity to other forms of transport.
A white paper is expected to be published later in 2019.
T able 2: Sourc e of e missions within the Strait of Dover in 2016 (PASSAGE, 2018)2 In Kent, no industry included in the strait’s perimeter is part of the EU emissions trading system. For a better understanding of these figures, please refer to the methodology of the study.
Emission source (within the strait’s boundary)in tCO2e
France Cross border
UK
Port operations
Energy consumption 6 543 9 662Ships in port areas 146 732 60 136
Maritime transport
Local maritime cruise 725 457Maritime cruise with calls to the strait’s ports 21 834
Transit maritime cruise 1 702 548In-land traffic
Road transport 1 185 908 426 075Railway transport 16 796 16 154Waterways transport 36 345 0Tunnel 64 899
Induced economical activities
Industries 8 346 854 0 2
Cities & Towns 980 425 3 686 589 4
Tourism 8 074 29 822TOTAL 10 727 677 2 514 739 1 228 439

28
KENT AND MEDWAY ENERGY AND LOW EMISSIONS STRATEGY EVIDENCE BASE
3 Equivalent of 1.252 tCO2e/inhabitant4 Equivalent of 1.32 tCO2e/inhabitant
29
KENT AND MEDWAY ENERGY AND LOW EMISSIONS STRATEGY EVIDENCE BASE
5. Air quality5.1 An introduction to air qualityThe term “air quality” describes a wide range of substances and processes which create a state of air to which people or ecosystems are exposed to and which may be harmful to humans and the environment. Poor air quality usually refers to air where pollutant levels are higher than levels set by government or health organisations. These pollutants can have profound impacts on the natural environment; however, poor air quality is more commonly associated with negative impacts on human health, as outlined in section 5.2 . Further information on air quality, including its health effects, can be found on the Kent A ir website .76
Figure 41 provides an illustration of the main sources and effects of air pollution.77
People and ecosystems are both impacted by air quality and are described as receptors. Not all receptors will be impacted by poor air quality in the same way.
Air pollution emitters, or sources, include almost anything that involves fuel combustion such as:
• car and lorry engines• domestic or commercial heating boilers• gas or coal fired electricity generation• open fires (including wood burning stoves and boilers)• anything else where a fuel is burned.
Sources also include industrial processes, some agricultural practices and even natural vegetation and livestock. Factors affecting the impact on receptors are:
• the types of substance being emitted• the concentration• the distance between source and receptor• the behaviour of the substances transported in the air.
Understanding the source-transport-receptor process is key to understanding air quality and to taking action to improve it.
Figure 41: The sources of air pollutants (PHE, 2018)
Research into the health effects of poor air quality has identified the key pollutants which drive those effects. They include:
• Fine particulate matter (PM10 or PM2.5)• Nitrogen dioxide (NO2)• Ozone (O3).
Other pollutants, such as sulphur dioxide (SO2), carbon monoxide (CO) and lead were a problem in the past, with many cities and towns experiencing smogs. Following theintroduction of the Clean Air Act 1956, emissions have significantly reduced, albeit current levels are still known to be harmful to health.
5.2 Health impacts of poor air qualityPoor air quality is the largest environmental risk to the public’s health, contributing to cardiovascular disease, lung cancer and respiratory disease.78 Indeed, between 28,000 and 36,000 deaths each year in the UK are associated with air pollution.79
Poor air quality increases the chances of hospital admissions, visits to A&E Departments and respiratory and cardiovascular symptoms which interfere with everyday life. There is also ongoing research into the effects of air pollution on the brain; including studies of air pollution and Alzheimer’s and Parkinson’s diseases. There is also emerging evidence that inflammation associated with poor air quality could influence diabetes, developmental outcomes in children and reproductive health
30
KENT AND MEDWAY ENERGY AND LOW EMISSIONS STRATEGY EVIDENCE BASE
outcomes such as low birth weight.
31
KENT AND MEDWAY ENERGY AND LOW EMISSIONS STRATEGY EVIDENCE BASE
While air pollution affects everyone, it doesn’t affect everyone equally. People living with lung diseases, such as chronic obstructive pulmonary disease (COPD) and asthma, as well as heart disease, may find that their symptoms become worse on days with higher air pollution. Those not sensitive to any immediate effects of air pollution are still at risk through the long-term health effects of air pollution. These effects happen at lower pollution levels than the short-term effects and are often not noticed by people at the time the damage is being done.
Gestation5, infancy and early childhood are vulnerable times because the young body is growing and developing rapidly. We know that the heart, brain, hormone systems and immunity can all be harmed by air pollution. Research is beginning to point towards effects on growth, intelligence, and development of the brain and coordination.80 The elderly are also vulnerable, due to the decline in organ function with age and an increased prevalence of age-related disease, which could be exacerbated by exposure to pollutants. Those who spend more time in highly polluted areas could also be affected more and this would contribute to a widening of health inequalities.
Public Health England (PHE) monitors the impact of poor air quality on premature mortality at a national and council level. The indicator used in the Public Health Outcomes Framework (PHOF) is the fraction of mortality attributable to particulate air pollution.81 Table 3 indicates how Kent and Medway councils compare to England and the South East.82
is Tonbridge and Malling) and the highest deprivation ranking (key exception is Dartford).
Table 4: Premature mortality rates per 100,000 and attributable to PM2.5
It is estimated that there were 922 deaths in 2017 that could be associated with particulate matter (PM2.5) exposure across Kent and Medway.
Table 3: Fraction of all-cause adult mortality attributable to particulate air pollution 2017 (PHE, 2017)
Analysis by Kent Public Health Observatory used the PHOF 3.01 indicator to calculate the premature (under 75), mortality rate per 100,000 that was attributable to PM2.5. It concluded that poor air quality is linked with an approximately similar rate of death as respiratory disease and liver disease. It is associated with more deaths in Kent and Medway than suicide and communicable diseases.83
Table 4 presents the overall premature mortality rate per 100,000 and the mortality rate attributable to PM2.5 for each council (note that Medway is excluded from this table as it is a unitary authority). It also includes the district councils’ rating on Indices of Multiple Deprivation (IMD2015) which is the official measure of relative deprivation for small areasin England.84 Broadly speaking, the areas with the highest overall premature mortality rate also tend to have the highest premature mortality rate attributable to PM2.5 (key
exception
5 The period of time between conception and birth.
England 5.1South East 5.6Kent 5.6Medway 6.3
District Council Mortality rate (per 100,000)attributable to PM2.5
Overall Premature Mortality Rate All Causes (per 100,000)
Kent Ranking on IMD2015
Thanet 20.1 395.6 1Dartford 19.4 353.3 6Swale 18.7 350.0 2Folkstone and Hythe 17.3 355.4 3Dover 17.0 340.9 5Gravesham 16.6 322.1 4Maidstone 15.9 288.8 9Canterbury 15.7 321.0 8Ashford 14.7 289.4 7Tonbridge & Malling 14.6 367.5 11Tunbridge Wells 14.1 267.9 12Sevenoaks 12.5 248.7 10

32
KENT AND MEDWAY ENERGY AND LOW EMISSIONS STRATEGY EVIDENCE BASE
The UK Health Forum and Imperial College London, in collaboration with, and funded by Public Health England, carried out a modelling study. It quantified the potential costs to the NHS and social care system due to the health impacts of PM2.5 and NO2 anddeveloped a tool for use by local authorities to quantify the number of expected disease cases and costs in their local area.85
The total NHS and social care cost due to PM2.5 and NO2 in 2017 was estimated to be£42.88 million (based on data where there is more robust evidence for an association), increasing to £157 million when diseases are included where there is currently less robust or emerging evidence for an association. Between 2017 and 2025, the total cost to the NHS and social care of air pollution where there is robust evidence for an association, is estimated to be £1.60 billion for PM2.5 and NO2
combined increasing to £5.56 billion if we include other diseases for which there is currently less robust evidence for an association.
5.3 Assessing air quality
Air quality can be assessed in two different ways, by monitoring or modelling.
33
KENT AND MEDWAY ENERGY AND LOW EMISSIONS STRATEGY EVIDENCE BASE
5.3.1 Air quality monitoring
Monitoring involves taking physical measurements of the composition of the air and is thus often seen as being more reliable. Monitoring methods can be further divided into passive sampling and continuous monitoring.
• Passive sampling, for example diffusion tubes are often used to measure concentrations of nitrogen dioxide (NO2). They can only provide data on the average concentration over a specific period, usually over a 1 month period and are usedto assess the annual objective. This sampling is not suitable for measuring the concentration of particulate matter which requires more complex techniques.
• Continuous monitoring utilises more complex equipment, which samples the air continuously and provides data over very short time period (15 minutes, 1 hour or 24 hour periods). High quality data such as that produced by well-maintained continuous analysers is generally required to show compliance with air quality technical guidance.
There were 15 sites with continuous analysers operating in Kent and Medway in 2017, measuring NO2, PM10, PM2.5, Ozone and Sulphur Dioxide (SO2), as shown in Table 5.
Site Name
Canterbury NO2 O3 PM10 URBAN BACKGROUND
Canterbury Military Road NO2 ROADSIDEChatham Roadside NO2 PM10 PM2.5 ROADSIDEDover Centre Roadside PM10 ROADSIDEGravesham A2 Roadside NO2 PM10 ROADSIDEGravesham Industrial Background NO2 PM10 URBAN
BACKGROUND
Maidstone Rural NO2 PM10 RURALRochester Stoke NO2 PM10 PM2.5 O3 SO2 RURALSwale Newington 3 NO2 ROADSIDESwale Ospringe Roadside 2 NO2 PM10 ROADSIDESwale St Pauls Street NO2 ROADSIDEThanet Birchington Roadside NO2 PM10 ROADSIDEThanet Ramsgate Roadside NO2 PM10 ROADSIDETonbridge Roadside 2 NO2 ROADSIDETunbridge Wells A26 Roadside NO2 PM10 ROADSIDE
Table 5: Continuous air quality monitoring sites operating in Kent and Medway

34
KENT AND MEDWAY ENERGY AND LOW EMISSIONS STRATEGY EVIDENCE BASE
Local authorities in Kent and Medway also routinely use networks of diffusion tubes to assess levels of NO2 at key locations, and the results can be found on the Kent A ir website.86
5.3.2 Air quality modelling
One of the downsides of monitoring air quality is that it only provides information on air quality at that specific location. To estimate the levels of air pollution at other locations, and to assess the likely effect of actions to address air quality in the future, air quality modelling is required.
In order to replicate the variability of emissions, the weather, chemical processes in the atmosphere and geographical features, air quality models are generally very sophisticated and require specialist expertise to operate. Nevertheless, their usefulness means that they are considered essential to obtaining a detailed picture of air quality in an area.
The UK uses a model to supplement air quality monitoring data to assess compliance with European air quality standards. Local authorities routinely use modelling to characterise area of high air pollution in their areas, an example of which is shown in Figure 42.
Figure 42: Modelling for Maidstone Borough Council in 2017 (Maidstone Borough Council ASR, 2017)
While local modelling has been undertaken in Kent and Medway, there is no current
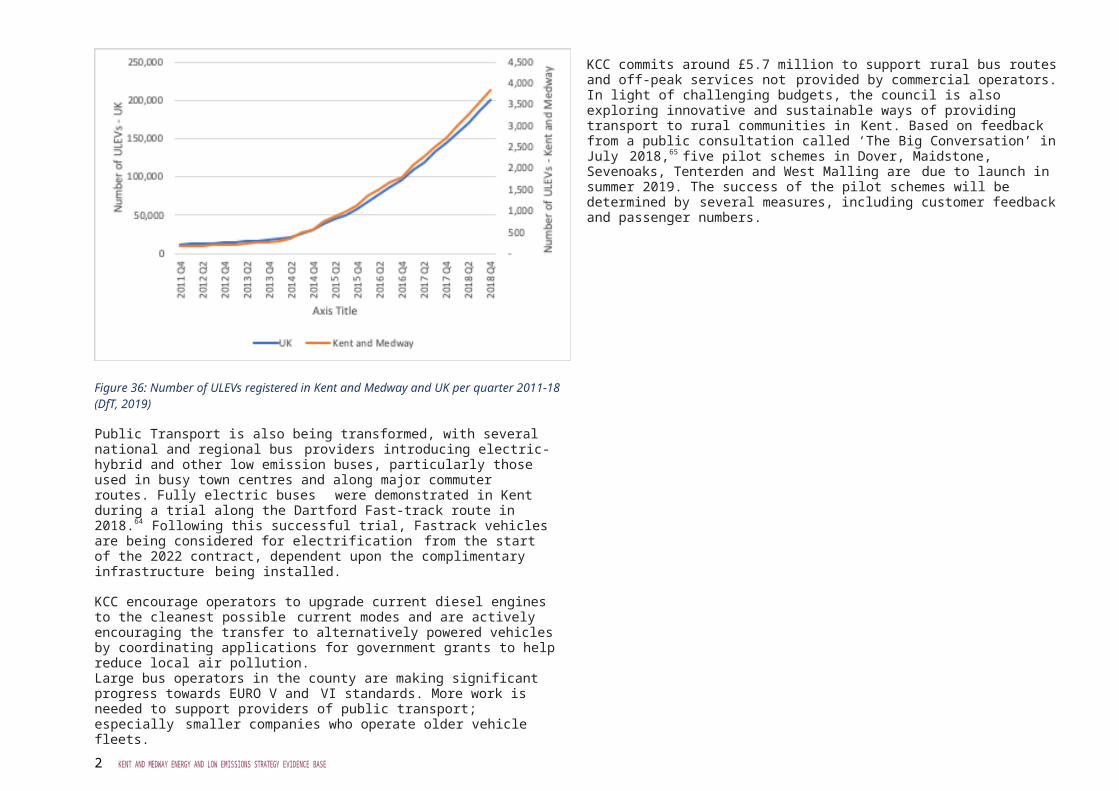
35
KENT AND MEDWAY ENERGY AND LOW EMISSIONS STRATEGY EVIDENCE BASE
model covering the whole county. It is hoped this will be developed in future as a useful tool to support District planning and development of air quality actions plans. Maps of ‘background’ concentrations of air pollutants are available now from Defra, as outputs from the national modelling processes.
5.3.3 Sources of air pollution emissions
A key tool in understanding and modelling air quality is an emissions inventory. This is a model which reconstructs emissions of different pollutants from different sources,potentially placing them geographically. This is done at its most basic level by multiplying activity data (eg. number of cars using a stretch of road), by an emission factor (eg. the amount of a pollutant emitted by an individual car per kilometre travelled). All emissions calculations are based on assumptions (for example, assuming all cars emit the same amount of the pollutant as each other all the time).
A well-designed emissions inventory allows policies to be tested for their impact on air quality. For example, a scheme providing incentives for people to buy electric or low emission vehicles will change the composition of traffic. The impact of this change can be estimated by adjusting the emissions inventory; the outputs from which can be fed into air quality models and so the effectiveness of the policy can be assessed before it is implemented. In this way, a high-quality emissions inventory can result in better, more informed decision making and more cost-effective actions.
The UK Government maintains a national emissions inventory (the National Atmospheric Emissions I nventory ,87 or NAEI), both to help develop policy and to fulfil its legal requirements to report on the UK emissions of air pollutants and greenhouse gasses.There is no separate emissions inventory for Kent and Medway, nor do local authorities run and maintain emissions inventories for their areas.
Using the NAEI, it is possible to extract emissions data for Kent. Figures 43 and 44 provide a breakdown of emissions in Kent and Medway for NOX and PM2.5
Figure 43: NOX emissions from Kent and Medway, 2015 (NAIE)
Figure 44: PM2.5 emissions from Kent and Medway, 2015 (NAIE)
It is also possible to map this data, to provide a view on the distribution of emissions across the area. Figures 45 and 46 shows emissions maps of Kent and Medway for NOX
(as NO2) and Figures 47 to 49 provides the same maps but for PM2.5. Table 6 provides the total emission for NOX and PM2.5 for Kent and Medway local authorities.
EVIDENCE GAP: Breaking the figures down further, for example breaking down road transport emissions into fuel, vehicle or road type, would be beneficial for policy development and tracking, but is not possible with the dataset as it currently stands.

30 KENT AND MEDWAY ENERGY AND LOW EMISSIONS STRATEGY EVIDENCE BASE
Figure 45: Total NOX (as NO2) emissions for Kent and Medway, 2015 (NAIE)
Figure 46: Road NOX (as NO2) emissions for Kent and Medway, 2015 (NAIE)
Figure 47: Total PM2.5 emissions for Kent and Medway, 2015 (NAIE)
Figure 48: Road transport PM2.5 emissions for Kent and Medway, 2015 (NAIE)

31
KENT AND MEDWAY ENERGY AND LOW EMISSIONS STRATEGY EVIDENCE BASE
Figure 49: Commercial and residential PM2.5 emissions for Kent and Medway, 2015 (NAIE)
Figure 50 shows the trends in annual emissions of six air pollutants in UK since 1970 (1980 for ammonia)88. It shows the general trend is downwards and improving, apart from ammonia, which is increasing. The main sources of ammonia emissions are fromagriculture, in particular livestock farms. While agriculture in Kent is a significant sector, it is largely arable, orchard and soft fruit crops, with ammonia emissions arising from organic wastes spread on the land to enrich the soil. Currently Defra and the Environment Agency work with the agricultural sector to address this trend.
Figure 50: Trends in annual emissions of six air pollutants in the UK, 1970 – 2017 (Defra, 2019)
Figure 51 shows the emissions trend by source sector for NOX, identifying the key components for road transport.89 The prime focus for local authorities across Kent and Medway is influencing the reduction in emissions from road transport on roads maintained by Kent County Council and Medway Council. Whilst the traffic using themotorways and trunk roads in the county (maintained by Highways England) is significant and impacts background emission levels in general, there is less direct impact on residential properties or areas where the public are exposed whilst walking and cycling.
Table 6: Total NOX and PM2.5 emissions for Kent and Medway Districts, 2015
District Total NOX emitted (t) Total PM2.5 emitted (t)Ashford 1,227 251Canterbury 1,054 232Dartford 1,207 158Dover 670 207Gravesham 658 152Maidstone 1,520 290Medway 3,278 383Sevenoaks 1,608 230Folkstone and Hythe 742 172Swale 1,864 329Thanet 609 180Tonbridge and Malling 2,295 246Tunbridge Wells 686 187Kent and Medway Total 17,418 3,017

32
KENT AND MEDWAY ENERGY AND LOW EMISSIONS STRATEGY EVIDENCE BASE
Figure 51: Emission trend for nitrogen oxides by source sector, England, 1990-2016 (NAEI, 2018)
While the NAEI provides very useful information on emissions at a national scale and offers a starting point for understanding emissions from Kent, it does not use information specific to Kent to construct emissions for the area. Sub-national scale inventories have been constructed for London (the LAEI), Wales and Scotland, and increasingly for larger urban areas in the UK, in response to a requirement for such areas to investigate Clean Air Zones. Defra is showing an increasing interest in embedding more local scale inventories into the national policy development framework.
In the absence of a local scale emissions inventory, source apportionment can be used to estimate the key sources contributing to air quality as assessed at monitoring stations.
Table 7 shows the source apportionment calculated for six locations within one of Medway Council’s Air Quality Management Areas, as part of its Air Quality Action Plan90 adopted in 2015. This has been constructed by subtracting the ‘background’ concentration from the measured concentrations at that location. The remainder is then split between different road transport sources using local traffic counts. This is avery useful way of estimating the key sources at a specific location, it cannot be used to provide information at locations without any monitoring, nor can it be used to test ex ante policy effectiveness.
5.4 Air quality in Kent and Medway
5.4.1 Air quality objectives
Based on available data, air quality in Kent and Medway is generally improving, with the number of days of moderate or high air pollution falling between 2012 and 2016,although 2017 data showed an increase to 49 days compared to 32 days in 2016 (where at least one pollutant recorded levels of moderate or higher air pollution).
Areas where concentrations of nitrogen dioxide (NO2) or particulate matter are above or close to the national Air Quality Standards, have been declared as Air Quality Management Areas, with 43 currently declared across the county.
Defra provides the complete set of EU Limit Values and National Air Quality Objectives.91 The limits for nitrogen dioxide and particulate matter are:
• Nitrogen Dioxide (NO2) - annual average concentration of 40µg/m3
• PM10 -• Annual average concentration of 40µg.m-3
• 24hr average PM10 concentration of 50 µg m-3 with 35 exceedances allowed per year• PM2.5 - annual average PM2.5 concentration of 25µg.m-3
Table 7: Central Medway AQMA NO2 source apportionment diffusion tube sites where 2013 annual mean concentration greater than 40 µg.m-3 (Medway Council, 2015)
5.4.2 Nitrogen dioxide (NO2)
Figure 52 shows the background concentrations on NO2 for Kent and Medway, for 2015. The map is taken from data provided by Defra to assist local authorities in assessing air quality in their area. It gives the annual average concentrations averaged in each 1x1km grid square. This means that the higher concentrations found closer to sources such as major roads are smoothed out. However, it provides a good indication of the distribution of NO2 across the area and clearly shows the importance of both urban areas and major roads, including the motorway network in contribution to poor air quality. It also shows the proximity of London with higher levels of air pollution also contributes to overall pollution levels in the north east of the county.
Location Total NO2
Road NO2
Back ground
Cars HGV LGV Buses Motor cycles
Luton Arches Junction 44.2 24.5 19.7 11.4 2.5 3.3 7.2 0.05
18 Star Hill 45.6 25.9 19.7 11.5 4.5 3.2 6.7 0.05
High Street, Strood (Tanning Shop)
45 25.3 19.7 11.8 5.6 4.2 3.7 0.04
High Street, Strood (Southern Heating)
52.4 32.7 19.7 16.9 4.5 5.8 5.5 0.06
London Road, Strood 41.6 21.9 19.7 10 4.2 5.1 2.5 0.03
33 London Road, Strood
42.9 23.2 19.7 11.2 3.8 6 2.2 0.03

3.
33
KENT AND MEDWAY ENERGY AND LOW EMISSIONS STRATEGY EVIDENCE BASE
Figure 52: Modelled background concentrations of NO2 (annual average) in Kent and Medway, 2015 (Defra)Monitoring data from roadside locations generally shows higher concentrations than indicated by the map above. Figure 53 shows the trend in roadside NO2 concentrations in Kent and Medway, based on the continuous analysers currently in operation. The dotted line shows the average concentrations over the period while the shaded area shows the range of annual averages measured. While the overall trend is downward, progress is slow.
The monitoring results for the period for currently operating sites are shown in Table 8.92 In 2017, one site out of thirteen, shown in bold red type, measured annual average NO2 concentrations at or above the UK air quality objective (AQO) of 40µg/m3.
Figure 53: Trend in annual average NO2 concentrations in Kent and Medway at all continuous
analyser sites, 2008-2017
Dartford St Clements 69 60 57 54 57 53 61 50 47 43Maidstone Rural 18 16 17 13 14 14 12 13 12 13Rochester Stoke AURN 18 17 24 19 18 14 15 13 14 15Sevenoaks Bat & Ball 33 31 31 30 29 31 29 32 31 28Sevenoaks Greatness Park 21 21 21 19 19 20 17 17 17 16Swale Newington 3 29 30 35 33 30 28 30Swale Ospringe Roadside 2 34 30 39 39 35 37 41 33 33Swale St Pauls Street 34 35 38 35 36Thanet Birchington Roadside 39 40 35 36 41 35 31 25 32 32Thanet Ramsgate Roadside 26 30 26 27 25 25 26 23 23 23Tunbridge Wells A26 Roadside 49 52 57 43 48 47 48 44 44 40

34
KENT AND MEDWAY ENERGY AND LOW EMISSIONS STRATEGY EVIDENCE BASE
Table 8: Annual average NO2 concentrations measured by currently operating continuous analysers in Kent and Medway, 2008-2017
5.4.3 Particulate Matter up to 10 microns (PM10)
The pattern of concentrations for PM10 is similar to that for NO2, as shown in Figure 54. However, the presence of sources such as transboundary air pollution means that the concentration gradient (the difference between high and low concentrations and the distance over which they vary) is much less.
The trend in annual average concentrations of PM10 is shown in Figure 55, and shows a downward pattern, as controls on emissions, such as fitting particle traps to diesel powered vehicles, have an impact. However, this trend appears to have levelled out in recent years.
Dartford St Clements 69 60 57 54 57 53 61 50 47 43Maidstone Rural 18 16 17 13 14 14 12 13 12 13Rochester Stoke AURN 18 17 24 19 18 14 15 13 14 15Sevenoaks Bat & Ball 33 31 31 30 29 31 29 32 31 28Sevenoaks Greatness Park 21 21 21 19 19 20 17 17 17 16Swale Newington 3 29 30 35 33 30 28 30Swale Ospringe Roadside 2 34 30 39 39 35 37 41 33 33Swale St Pauls Street 34 35 38 35 36Thanet Birchington Roadside 39 40 35 36 41 35 31 25 32 32Thanet Ramsgate Roadside 26 30 26 27 25 25 26 23 23 23Tunbridge Wells A26 Roadside 49 52 57 43 48 47 48 44 44 40

35
KENT AND MEDWAY ENERGY AND LOW EMISSIONS STRATEGY EVIDENCE BASE
Figure 54: Modelled background concentrations of PM10 (anual average) in Kent and Medway, 2015 (Defra)
Figure 55: Trend in annual average PM10 concentrations in Kent and Medway at continuous analysers sites, 2008-2017
PM10 is currently measured at 16 sites across Kent and Medway, as shown in Tables 9 and
10. Evidence indicates that PM10 does not have a “safe” level, and that health benefits are

36
KENT AND MEDWAY ENERGY AND LOW EMISSIONS STRATEGY EVIDENCE BASE
accrued from any reduction in population exposure. Further action is therefore needed on PM10.
Site
2008
2009
2010
2011
2012
2013
2014
2015
2016
2017
Canterbury AURN 23 19 18 20 18 19 18 17 17 17Chatham Roadside AURN 21 24 21 23 21 19 19 24Dartford Town Centre 26 24 24 27 24 28 24 23 33 25Dartford St Clements 33 31 28 28 22 24 25 20 24 21Dartford Bean Interchange 29 24 25 24 21 21 27 26 27 28Dover Centre Roadside 32 29 27 30 26 28 27 25 26 24Gravesham A2 Roadside 24 24 18 21 18 20 17 15 19 16Gravesham Industrial Background 31 27 30 24 20 20 19 16 18 22
Maidstone Rural 19 17 14 16 18 19 25 19 20 20Rochester Stoke AURN 22 20 14 16 18 18 15 16 18Stanford-le-Hope Roadside AURN 24 21 21 23 23 24 19 17 20 18
Sevenoaks Bat & Ball 23 23 23 25 24 22 21 21 21 20Sevenoaks Greatness Park 17 20 20 23 20 20 19 21 18 18Swale Ospringe Roadside 2 28 27 29 26 29 27 28 25Thanet Birchington Roadside 23 23 24 29 25 25 21 23 25 26Thanet Ramsgate Roadside 31 30 28 35 28 27 25 26 26 24.6Thurrock AURN 21 21 24 25 18 19 19 17 17 19Tunbridge Wells A26 Roadside 29 29 28 30 28 28 28 28 26 25
Table 9: PM10 concentrations measured by currently operating continuous analysers in Kent and Medway, 2008-2017

37
KENT AND MEDWAY ENERGY AND LOW EMISSIONS STRATEGY EVIDENCE BASE
Site Name Annual Mean (µg m-3)*Chatham Roadside 14Rochester Stoke 10
Table 11: PM2.5 concentrations measured by continuous analysers in Kent and Medway, 2017
Table 10: PM10 daily “exceedance days” recorded by continuous analysers in Kent and Medway, 2017
5.4.4 Particulate matter up to 2.5 microns (PM2.5)
PM2.5 is measured at only two sites in the area, one of which started measurements relatively recently. The annual average concentrations in 2017 for these two sites are given in Table 11. This shows that concentrations at these sites are well below the national air quality objective of 25µg.m-3.
However, this objective, derived from European legislation, is intended as a “backstop” with the main policy instrument being a reduction in population exposure on a national basis, rather than focussing on hotpot areas. The World Health Organisation has suggested a guideline value for the protection of human health of 10µg.m-3 while at the same time acknowledging that the evidence does not indicate a “safe” level93. Further reduction in PM2.5 would therefore derive health benefits for the population of Kent and Medway.
6 Data omitted due to extremely low data capture
Site Name Exceedance Days*
Canterbury 2Chatham Roadside 6Dartford Town Centre 10Dartford St Clements 4Dartford Bean Interchange 14Dover Centre Roadside 18Gravesham A2 Roadside 5Gravesham Industrial Background 4Maidstone Rural 0Rochester Stoke 4Sevenoaks Bat & Ball 4Sevenoaks Greatness 6Swale Ospringe Roadside 26 -Thanet Birchington Roadside 9Thanet Ramsgate Roadside 13Tunbridge Wells A26 Roadside 13
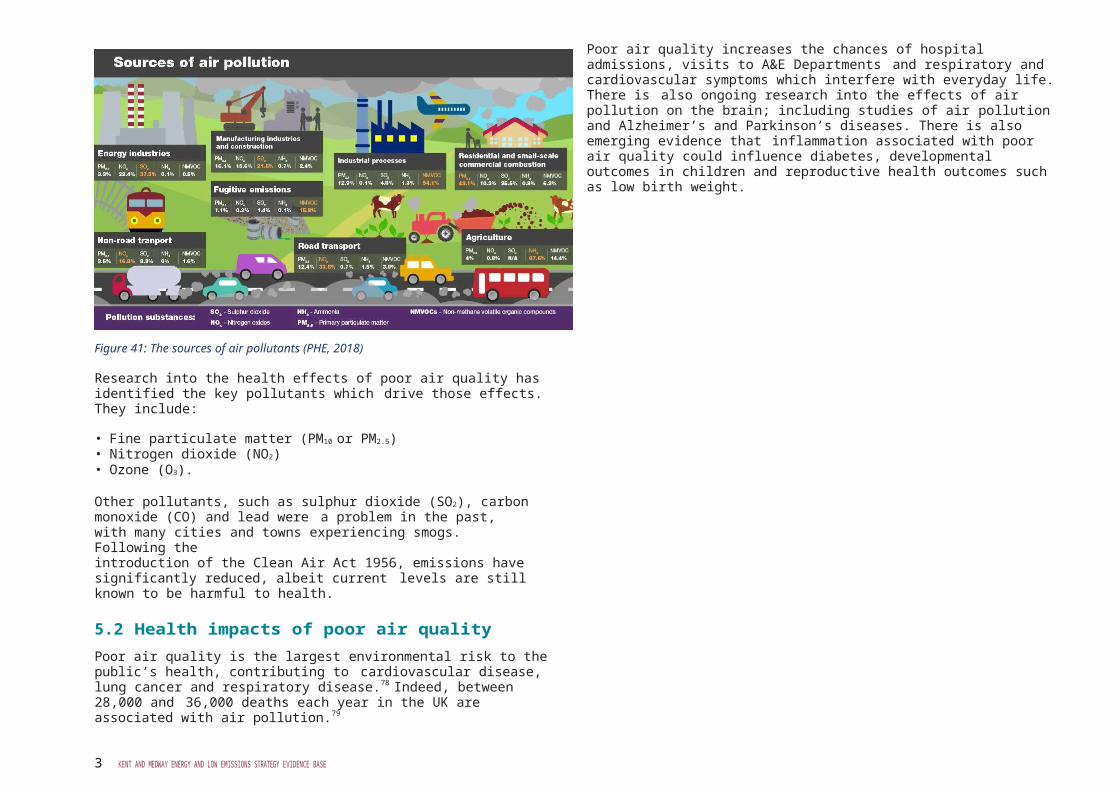
38
KENT AND MEDWAY ENERGY AND LOW EMISSIONS STRATEGY EVIDENCE BASE
5.4.5 Other air pollutants
Historically, other air pollutants have had a significant impact on air quality, including sulphur dioxide, carbon monoxide, lead and benzene. However, controls on industrial and transport emissions, including shipping emissions, changes to the way we generate electricity and the removal of lead and sulphur from road fuels have reducedconcentrations to the point where they no longer cause significant health impacts in the UK. Indeed, concentrations are generally at or below the limits of detection for standard monitoring methods in most areas.
Sulphur Dioxide remains a significant transboundary air pollutant and contributes to the formation of secondary particulate matter, and as such is subject to emission controls at a national and European level.
Ozone is another significant transboundary pollutant but one which is entirely “secondary” in nature. Reduction in ozone’s precursor pollutants – Nitrogen dioxide and some volatile organic compounds – has greatly reduced peak concentrations but both national and international action is required to reduce levels further. Evidence shows that action at the level of Kent and Medway would do little to reduce ozone concentrations in isolation.
Ammonia is a further pollutant of concern and is the only major pollutant whose emissions are not decreasing over time. It differs from most other pollutants in that it is not produced by combustion processes. Ammonia is produced almost wholly fromagricultural processes and it is highly reactive. This means that concentrations of ammonia are generally very low, but it is a key component in secondary particulate matter and thus has significant indirect impacts on both human and environmental health. It also has a significant impact on the natural environment, on vulnerable eco-systems and habitats (especially those which are naturally nitrogen poor). Therefore, the control of emissions of ammonia are a priority for national and international emissions control legislation.
5.5 Acting on poor air qualityIn response to the requirements of Local Air Quality Management (as established through the Environment Act 1995), district councils in Kent and Medway Council have developed air quality action plans: 43 Air Quality Management Areas (AQMAs) have been declared across the area. These are listed in Table 12, which provides a description of each AQMA declared in Kent and the latest monitoring data, where available. All the AQMAs have been declared on an exceedance or risk of exceedance of the NO2 annual average air quality standard (40µg.m-3) using diffusion tube monitoring. Two district councils, Ashford and Folkstone and Hythe, have not declared AQMAs.
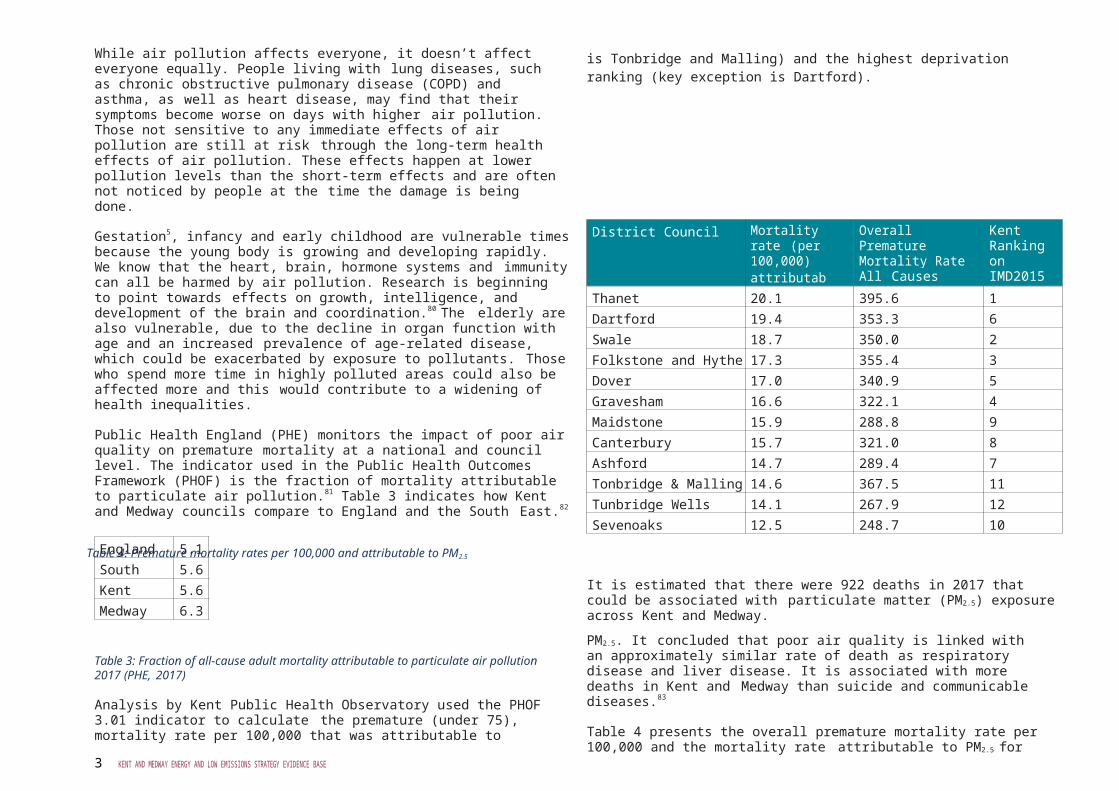
39
KENT AND MEDWAY ENERGY AND LOW EMISSIONS STRATEGY EVIDENCE BASE
District/Council AQMA Name AQMA Description Most recent measured NO2 annual average (µg.m-3)
Measurement year
Ashford N/A N/A N/A N/A
Canterbury Air Quality Management Area – Canterbury 3 Larger City Centre AQMA 47.1 2017
Air Quality Management Area – Herne 1 Junction of the A291 and School Lane 38.2 2017
Dartford A282 Tunnel Approach The approach road to the Dartford Crossing which is flanked at several points by residential properties
56 2016
London Road The length of London Road (A226) which runs from Swanscombe in the east to the Princes Road roundabout, Dartford.
47 2016
Dartford Town Centre and Approach Roads Several stretches of road converging on Dartford town centre. 38 2016
Bean Interchange An area encompassing residential properties near to the Bean Interchange between the A2 and Bluewater Shopping Centre.
57 2016
Dover A20 AQMA An area following the A20 from just west of the Limekiln Roundabout at the western end to a point c.140m from the Eastern Docks in Dover. No longer includes properties in Marine Parade and East Cliff to the east.
42.8 2017
High Street/Lady -well AQMA An area encompassing roads and properties between the junction of Effingham Crescent/High Street, and Priory Hill/High Street.
45.4 2017
Gravesham A2 Trunk Road AQMA The A2 Trunk Road AQMA. An area extending either side of the length of the A2 within the borough
31 2016
Northfleet Industrial Area AQMA An area encompassing the Northfleet Industrial Area in Gravesham 33.6 2016
A226 One-way system in Gravesend AQMA An area incorporating the entirety of the A226 One-way system in Gravesend
40.6 2016
B262/B261 Pelham Arms Junction AQMA An area encompassing the junction of the B262 Pelham Road, B262 Pelham Road South and the B261 Old Road West
34.5 2016
A227/B261 Wrotham Road/Old Road West Junction AQMA
An area encompassing the junction of the A227 Wrotham Road and B261 Old Road West extending south to a point just beyond the Woodlands Restaurant
38.2 2016
The Echo Junction Area AQMA On B261 Gravesend 34.4 2016
The Parrock Street Area AQMA An area encompassing Parrock Street (from the point at which it crosses the railway line, southwards to the junction of Christ Church Road), and Lord Street (from its junction with Parrock Street to its junction with Windmill Street
30.5 2016
Maidstone Maidstone Town AQMA An Area encompassing the entire Maidstone conurbation including the location previously designated as the separate M20 AQMA
79.3 2017

40
KENT AND MEDWAY ENERGY AND LOW EMISSIONS STRATEGY EVIDENCE BASE
District/Council AQMA Name AQMA Description Most recent measured NO2 annual average (µg.m-3)
Measurement year
Medway Central Medway AQMA A large central AQMA which includes the previous AQMAs of Frindsbury Road, Cuxton Road, Strood Centre, Rochester Centre and Chatham Centre which have been slightly extended, but also includes the new areas of Luton Road, Chatham, High Street, Chatham and Rainham Road, Chatham.
51 2017
Rainham AQMA An area running along the High Street in Rainham. 45.4 2017
Gillingham AQMA An area along Pier Road in Gillingham 42.9 2017
Four Elms Hill AQMA Part of Four Elms Hill, Chattenden 50.8 2017
Sevenoaks AQMA 1 Junction 3 of the M25 to the district boundary with Tonbridge and Malling Borough Council including part of the A20 at Farningham.
45.8 2016
AQMA 2 County border with Surrey to district border with Dartford, including Junctions 3, 4 and 5 and the extension of Junction 5 to connect with the A25 at Bessel’s Green
43.1 2016
AQMA 3 M26 - from junction 5 of the M25 to the district boundary with Tonbridge and Malling Borough Council.
No current monitoring N/A
AQMA 4 Swanley Bypass - from junction 3 of the M25 to the district boundary with the London Borough of Bromley
No current monitoring N/A
AQMA 6 Junction 5 to Kent / Surrey border No current monitoring N/A
AQMA 8 Swanley – London Road (East); High Street; Bartholomew Way and parts of Central town area
No current monitoring N/A
AQMA 10 Sevenoaks – High Street 54.7 2016
AQMA 13 The entire length of the A25 from the border with Tonbridge and Malling in the east to the border with Tandridge in the west.
57.9 2016
AQMA 14 The junction of London Road and Birchwood Road, Swanley. 60.5 2016
Folkstone and Hythe N/A N/A N/A N/A
Swale AQMA 1: Newingto n (A2 / High Street) An area encompassing those parts of London Road and High Street, Newington where the speed limit is 30mph
48.5 2017
AQMA 6: Ospringe Street, Faversham (A2 / Ospringe)
Area incorporating all of Ospringe Street, Ospringe which is a section of the A2 London Road, trunk road near Faversham between the grid reference 600106, 160936 and the grid reference 600466, 160839.
61.3 2017
AQMA 3: East Street, Sittingbourne (A2 / Canterbury Road)
The designated area incorporates the area of East Street, Sittingbourne.
42.5 2017
AQMA 4: St Paul’s Street, Milton, Sittingbourne (B2006)
The designated area incorporates the area of St Pauls Street, Sittingbourne
55.7 2017
AQMA 5: Teynham (A2 / London Road) A2 London Teynham. 39.9 2017
Thanet Thanet Urban AQMA An area encompassing a number of urban areas within Thanet 40 2016

41
KENT AND MEDWAY ENERGY AND LOW EMISSIONS STRATEGY EVIDENCE BASE
District/Council AQMA Name AQMA Description Most recent measured NO2 annual average (µg.m-3)
Measurement year
Tonbridge and Malling M20 AQMA 1 An area extending 39m from the centreline along the M20 motorway between the points where it passes below New Hythe Lane, Larkfield to the west and where it crosses Hall Road, Aylesford to the east.
36.7 2017
Ditton AQMA 2 An area incorporating the Station Road/London Road A20 crossroads in the Parish of Ditton.
31.9 2017
Tonbridge High Street AQMA 3 An area incorporating the High Street between Botany and the High Street/Vale Road roundabout, Tonbridge.
49.6 2017
Wateringbury AQMA 4 An area incorporating the Red Hill/Tonbridge Road A26 crossroads in the Parish of Wateringbury.
61.3 2017
Aylesford AQMA 5 An area encompassing the A20 London Road in Aylesford, including the junction with Hall Road and Mills Road.
44.8 2017
Larkfield AQMA 6 An area encompassing the A20 London Road in East Malling, Larkfield and Ditton, including the junction with New Hythe Lane.
43.2 2017
Borough Green AQMA 7 Parts of Sevenoaks Road A25, Western Road and the High Street in Borough Green
43 2017
Tunbridge Wells A26 AQMA The A26 between Park Road and Neville Terrace and also including Grosvenor Road at 0- 80m from the road
43.3 2017
Table 12: AQMAs declared by Kent and Medway councils
A number of the air quality action plans are currently being reviewed and updated, so a definitive list of the actions currently underway is not available. However, a preliminary analysis of published reports showed around 250 individual actions; ranging from the very specific, e.g. addressing a particular junction or road section, though to the more general, dealing with broader council policy or approach.
Roughly two thirds of the actions were aimed at transport sources, including:
• promotion of low emission vehicles and infrastructure• supporting walking and cycling• low emission buses and taxis• specific road improvements.
The other third was aimed at development control and council policies, including:
• the adoption of common guidance on handling air quality in planning applications• a commitment to a joint air quality strategy• the development of awareness raising campaigns• reducing the impact of Council fleet vehicles.
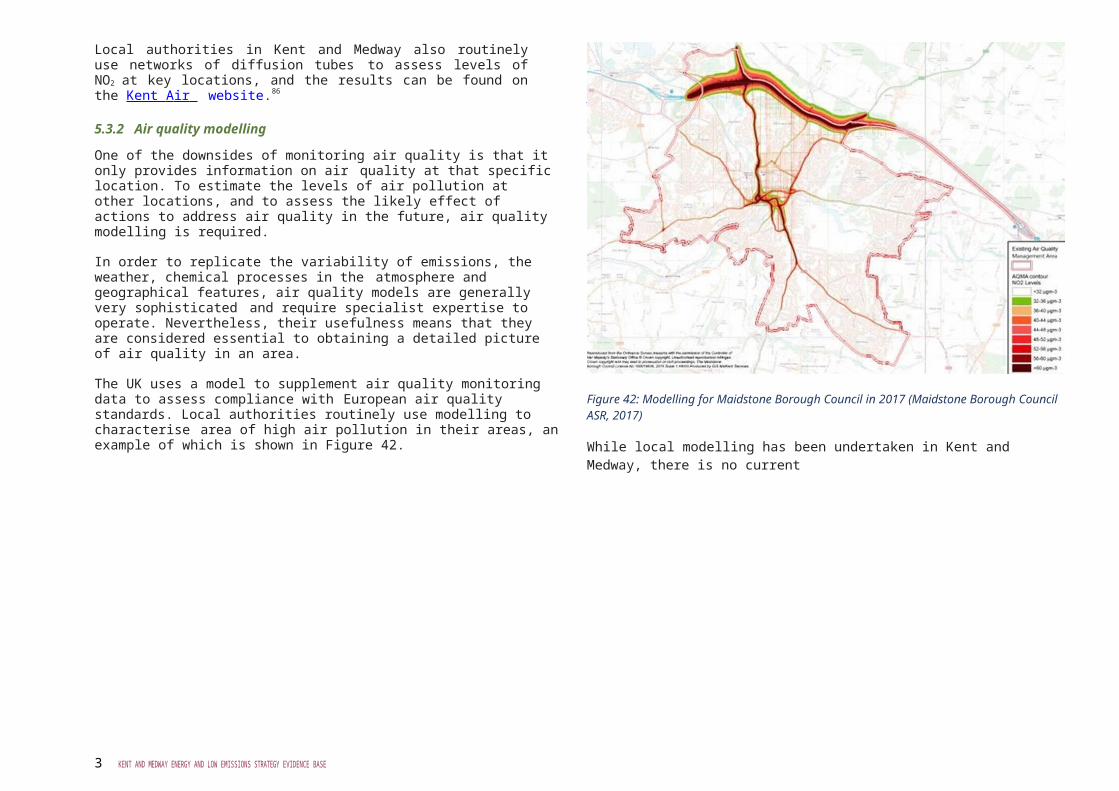
42
KENT AND MEDWAY ENERGY AND LOW EMISSIONS STRATEGY EVIDENCE BASE
5.5.1 The role of green infrastructure
Green infrastructure is a term usually used to describe an urban network of greenspace that is often strategically planned and managed. It includes roadside trees, shrubs and hedges; parks, cemeteries and allotments; urban woodland, riverbanks and wetlands; private gardens; and green walls, sustainable urban drainage systems and green roofs.
There has been increasing recognition that green infrastructure can play an important role in influencing urban air quality. Vegetation acts as a natural filter; with the surface of leaves absorbing carbon dioxide, dust particles and other pollutants such as sulphur dioxide. A 2017 study for the Office of National Statistics94
estimated that existing UK vegetation reduces the average annual surface concentrations of PM2.5 by 10%, PM10 by 6%, ozone by 13%, ammonia by 24% and sulphur dioxide by 30%, but did not markedly change nitrogen dioxide concentrations. The study concluded that UK vegetation removes 1,354 kilotons of pollutants annually, with an annual value of £1 billion.
Research by Lancashire University95 showed that trees removed airborne pollutants at three times the rate of grasslands. The research also revealed that there is variation in the effectiveness of different species of trees: Scots pines, common alder, larch, Norway maple, field maple, ash and silver birch were found to remove the most pollutants.However, species of oak and willow were found to be detrimental to air quality, due to the emittance of biogenic volatile organic compounds (bVOCs), which enhance the formation of pollutants such as ozone. Other negative impacts related to trees and hedges include the release of allergenic pollens in some species; the loss of effectiveness in winter dueto leaf fall in deciduous species; and a reduction in air-flow if planted too densely, leading to pollutant concentration spikes. However, these impacts can all be avoided if suitable species are selected and correctly planted at the outset.
As well as the air quality benefits, green infrastructure is seen as an essential tool in the creation of healthy and sustainable communities because it provides many other benefits, including:
• enhanced physical and mental wellbeing• important urban wildlife habitat, supporting many different species• acts as a sound barrier, reducing the impact of urban noise• natural drainage, which helps prevent flooding• urban shading, to reduce the impact of heatwaves and mitigate the ‘urban heat
island’• carbon storage, mitigating the impacts of climate change• increased property values from enhanced aesthetics
A recent report by Fields in Trust concluded that based on estimates of a reduction in
GP visits by regular park users in the UK population, the annual NHS cost saving from parks and greenspace is £111 million, or £3.16 per person.96

43
KENT AND MEDWAY ENERGY AND LOW EMISSIONS STRATEGY EVIDENCE BASE
However, whilst green infrastructure is beneficial for air quality and has many multiple benefits, it is unlikely to resolve air quality problems at a city scale. One of the problems is that there is often insufficient space to plant vegetation in the quantity required tohave an impact. Research from the Air Quality Expert Group on behalf of Defra concluded that realistic urban planting schemes would reduce PM10 concentrations by only afew percent. 97 For this reason, Public Health England have recently cautioned that appropriately designed urban green infrastructure can improve air quality, improve health inequalities and promote health and wellbeing, but should not be used in isolation to address air pollution.98
5.6 Published Air Quality InformationThe Kent Air website provides access to published data and reports for Medway and all district councils except for Dartford and Sevenoaks; whose data is hosted on the London Air Quality Network:
http://kentair.org.uk
http://ww w .londonai r .org.uk
These websites provide information and advice for individuals and to be used as educational resources and together show the status of air pollution across the county.
5.6.1 Ashford Borough Council
Air Quality in the borough is considered to be good with pollutant concentrations below the national air quality objectives and monitoring data showing levels are continuing to decrease slightly. The council has therefore not declared any AQMAs.
5.6.2 Canterbury City Council
There are two AQMAs declared in the district. Monitoring of the levels of nitrogen dioxide is from a continuous analyser at a roadside site and a network of 44 diffusion tubesites. In addition, nitrogen dioxide, ozone and PM10 monitoring take place at an urban background AURN affiliated site.
The nitrogen dioxide diffusion tube network was further expanded in 2017 to include additional sites in response to a number of planning applications and local concerns.
5.6.3 Dartford Borough Council
There are four AQMAs declared in Dartford for NO2 and PM10 mainly due to emissions from road traffic sources. Levels of pollution have been improving over recent years but remain high. All four AQMAs still record levels of NO2 in excess of the annual average objective.

40 KENT AND MEDWAY ENERGY AND LOW EMISSIONS STRATEGY EVIDENCE BASE
Dartford has two major trunk roads running through it, incidents on these roads can result in vehicles being displaced onto the local road network. This combined with higher background pollution levels due to its geographical proximity to London results in pollution levels higher than many other Kent districts.
New air quality action plans are to be produced in 2019.
5.6.4 Dover District Council
There are two AQMAs declared in the district. The extent of these AQMAs has now been reviewed and modelled by the council’s consultants and no changes to area boundaries are necessary. Although additional monitoring at an extra four sites at the High Street / Ladywell AQMA and at residential locations close to the Townwall Street AQMA continue.
Dover faces several challenges to manage traffic to and from the Port and discussions are taking place with central government and Highways England to manage the expected major increase in housing stock in South East England coupled with proposals for the third Thames crossing.
5.6.5 Folkestone and Hythe District Council
Folkestone and Hythe District Council has not been required to declare an AQMA and the 2017 annual status report supports this decision.
The 2017 monitoring results indicated that the prescribed objectives were all being met. The highest monitored levels are still at the busy roadside sites in Folkestone town. Therefore, the council continues to monitor at these locations to demonstrate continued compliance with the prescribed objectives. A review of the network will also be considered to ensure the monitoring stays relevant.
5.6.6 Gravesham Borough Council
There are seven AQMAs declared in the district. The adoption of the action plans and Air Quality Strategy have enabled the council to make excellent progress in improving air quality and three AQMAs are being considered for revocation around the area of Rathmore Road, although monitoring of NO2 will continue. This will help the council to ascertain whether the actions being taken through the planning process, includingjunction improvements when new developments come along, have a beneficial effect on air quality.
The general trend of pollution levels across the borough is a downward one, with significant improvements being made in the AQMAs above.
5.6.7 Maidstone Borough Council
Extensive air quality modelling was undertaken in 2016, to enable a review of the
boundaries of Maidstone’s AQMA. Maidstone previously had one large AQMA covering

40 KENT AND MEDWAY ENERGY AND LOW EMISSIONS STRATEGY EVIDENCE BASE
the whole of the urban area, but the modelling showed that a much smaller AQMA could be considered. Maidstone councillors approved this change at the end of 2017 and a new AQMA has been declared which closely follows the carriageways of the main roads through Maidstone Borough. The actual boundary of the AQMA is based on the 36µgm-3 NO2 contour predicted by the modelling.
A review of air quality monitoring provision in Maidstone was undertaken, which concluded that automatic monitoring in the town centre was essential, with Upper Stone Street being the preferred location. A suitable monitoring site in Upper Stone Street was identified and a new monitoring station has now been installed, which measures NO2 and PM10 and also measures PM2.5 in Maidstone for the first time.
5.6.8 Medway Council
Many challenges still lie ahead for Medway Council in terms of making a positive contribution to improving air quality.
A weak trend of decreasing measured concentrations of NO2 is apparent at most sites from 2011 to 2017. However, monitoring results for 2017 demonstrate that air quality in Medway continues to exceed the annual mean NO2 objective at some locations adjacent to roads covered by the four AQMAs. Measured pollution concentrations remain below the national objectives outside the declared AQMAs, and at numerous sites within them.
The council is now planning to develop an Air Quality Action Plan for this AQMA, which is expected to run in conjunction with development of the new Medway Local Plan during 2018/19.
5.6.9 Sevenoaks District Council
There are nine AQMAs declared in Sevenoaks district for NO2 and PM10 mainly due to emissions from road traffic sources.
Sevenoaks district Council maintains a network of air quality monitoring including ozone monitoring. Levels of NO2 and PM10 have generally been improving over recent years however Ozone levels recorded at the Greatness park background have breached objective levels in nine of the last ten years.
A review of the current AQMAs is to be carried out in 2019 as part of the development of a new air quality action plan. It is likely that some of the AQMAs will be able to be revoked as a result of this review.
5.6.10 Swale Borough Council
There are five AQMAs declared in the district, due to elevated levels of NO2 from excessive traffic and congestion on and near the A2. The extension to the Ospringe AQMA has now been consolidated into one AQMA designation.
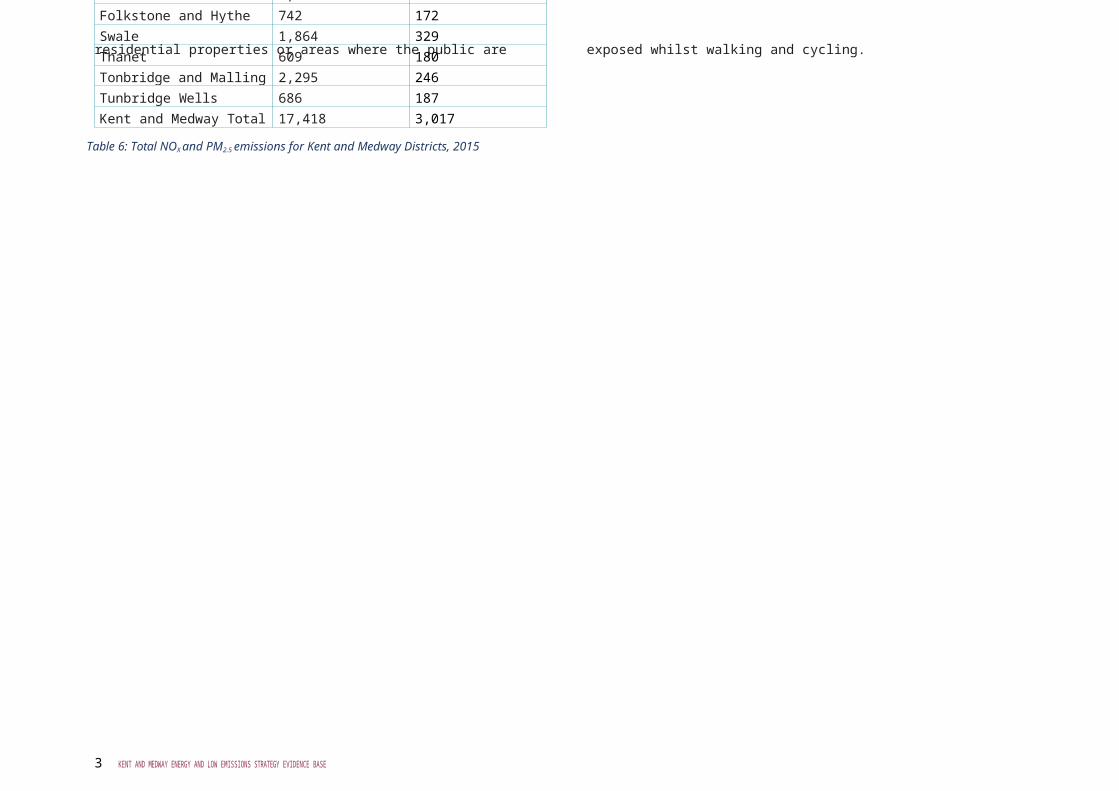
41
KENT AND MEDWAY ENERGY AND LOW EMISSIONS STRATEGY EVIDENCE BASE
Monitoring activity has reduced. The Ospringe monitoring site has been closed since February 2017 to accommodate the building of a new property; this has meant that access to the station was not possible. A review of diffusion tubes has left a similar number as before - 72 tubes - but some sites have been moved as different requirements have been accommodated. Results still show extensive individual exceedances of the NO2 annual means in most of the AQMAs.
There have been a significant number of large planning applications with associated, complex air quality assessments to review. Reference to the significant amount of Swale monitoring data has been critical in this process.
5.6.11 Thanet District Council
An urban wide AQMA was declared in 2011 to incorporate several busy junctions that were close to or exceeding the annual objective for nitrogen dioxide. During the last five years there have been good air quality improvements, which have led to only one exceedance at High Street St Lawrence, Ramsgate. However, the large urban AQMA boundary will be retained until all areas fall below health objectives, as it provides the council with more flexibility to secure mitigation measures through the development control process over a wider area and benefiting the whole district.
5.6.12 Tonbridge and Malling Borough Council
There are seven AQMAs declared within the district. All are declared due to exceedances of NO2, and the M20 AQMA also exceeds the objective for particulate matter. Air quality is monitored using 74 diffusion tubes, as well as a continuous NOx analyser currently located on Tonbridge High Street.
With the scheduled refit of the site of the NOx analyser, the continuous analyser will be moved to Wateringbury Village Hall, to better monitor air quality in the AQMA there.
5.6.13 Tunbridge Wells Borough Council
There is one AQMA declared in the district. Amendments to the AQMA boundary to create a longer, but narrower, AQMA were approved and the order made on the 1st
September 2018. Public consultation on a draft plan was also carried out between September and October 2018, with a new Air Quality Action Plan adopted in March 2019.
The council measures NO2 and PM10 in a continuous monitoring station in St Johns Road, in addition to a network of diffusion tubes. Results at most tube locations were lower in 2017 than in 2016. The annual mean NO2 level measure at the continuous monitoring station in 2017 was equal to the annual mean objective for NO2 at 40µgm-3

42
KENT AND MEDWAY ENERGY AND LOW EMISSIONS STRATEGY EVIDENCE BASE
6. References1. KCC (2018) Kent and Medway Growth and Infrastructure Framework,
https://www. kent.gov.uk/about-the-council/strategies-and-policies/environment-waste-and- planning-policies/growth-and-infrastructure-framework-gif
2. KCC (2011) Kent Design Guide https://www.kent.gov.uk/about-the-council/strategies- and-policies/regeneration-policies/kent-design-guide
3. Port of Dover annual traffic statistics; https://www.doverport.co.uk/about/ performance/
4. Eurotunnel traffic statistics; https://www.getlinkgroup.com/uk/eurotunnel-group/ operations/traffic-figures/
5. Department for Transport (2018) Road congestion and reliability statistics; https:// www.gov.uk/government/collections/road-congestion-and-reliability-statistics
6. Highways England (2019) https://highwaysengland.co.uk/OperationBrock/
7. House of Commons Transport Committee (2016) Operation Stack https://publications. parliament.uk/pa/cm201617/cmselect/cmtrans/65/65.pdf
8. KCC (2016) Local Transport Plan 4 https://www.kent.gov.uk/about-the-council/ strategies-and-policies/transport-and-highways-policies/local-transport-plan
9. BEIS (2019) Final energy consumption at local authority level https://www.gov.uk/ government/statistical-data-sets/total-final-energy-consumption-at-regional-and- local-authority-level#history.
10. DECC (2013) The Future of Heating; https://www.gov.uk/government/publications/ the-future-of-heating-meeting-the-challenge
11. DECC (2013) Estimates of heat use in the United Kingdom in 2013 https://assets. publishing.service.gov.uk/government/uploads/system/uploads/attachment_data/ file/386858/Estimates_of_heat_use.pdf
12. South East LEP (2019); Energy South2East Local Energy Strategy https://www. southeastlep.com/energysouth2east
13. BEIS (2019) Final energy consumption statistics https://www.gov.uk/government/ statistical-data-sets/total-final-energy-consumption-at-regional-and-local-authority- level#history
14. BEIS (2019) Final energy consumption statistics https://www.gov.uk/government/ statistical-data-sets/total-final-energy-consumption-at-regional-and-local-authority- level#history
15. KCC (2016) Business rates in Kent 2015/16 https://www.kent.gov.uk/ data/assets/ pdf_file/0003/7554/Business-rates-in-Kent.pdf.

43
KENT AND MEDWAY ENERGY AND LOW EMISSIONS STRATEGY EVIDENCE BASE
16. KCC (2016) Kent Environment Strategy; https://www.kent.gov.uk/ data/assets/pdf_ file/0020/10676/KES_Final.pdf
17. KCC (2019), Kent Environment Strategy Indicators https://www.kent.gov.uk/ data/ assets/pdf_file/0005/91058/Kent-environment-strategy-indicators-January-2019.pdf
18. MHCLG (2019) Display Energy Certificates https://www.gov.uk/government/statistical- data-sets/live-tables-on-energy-performance-of-buildings-certificates.
19. Salix Finance https://www.salixfinance.co.uk/
20. BEIS (2019) Final energy consumption statistics https://www.gov.uk/government/ statistical-data-sets/total-final-energy-consumption-at-regional-and-local-authority- level#history.
21. BEIS (2019) Final energy consumption statistics https://www.gov.uk/government/ statistical-data-sets/total-final-energy-consumption-at-regional-and-local-authority- level#history.
22. KCC (2017) Renewable Energy Action Plan: 2017 Update https://www.kent.gov.uk/ data/assets/pdf_file/0011/89498/Renewable-energy-for-Kent-2017-action-plan- update.pdf
23. BEIS (2019) Final energy consumption statistics https://www.gov.uk/government/ statistical-data-sets/total-final-energy-consumption-at-regional-and-local-authority- level#history.
24. Non-gas map https://www.nongasmap.org.uk/.
25. Energy South2East Local Energy Strategy (2019) https://www.southeastlep.com/app/ uploads/2019/03/Local-Energy-Strategy-FINAL.pdf
26. MHCLG live tables on energy performance of buildings https://www.gov.uk/ government/statistical-data-sets/live-tables-on-energy-performance-of-buildings- certificates.
27. BEIS (2017) Update of domestic cost assumptions https://www.gov.uk/government/ publications/domestic-cost-assumptions-what-does-it-cost-to-retrofit-homes
28. National Grid (2018) Future Energy Scenarios http://fes.nationalgrid.com/
29. Ofgem (2018) Energy Security; https://www.ofgem.gov.uk/system/files/docs/2018/10/ october-energy-security.pdf
30. BEIS (2019) Capacity Market: outcome of consultation on technical amendments; https://www.gov.uk/government/collections/electricity-market-reform-capacity- market
31. UK Power Networks https://www.ukpowernetworks.co.uk/internet/en/news-and-
press/press-releases/UK-Power-Network-and-National-Grid-launch-major-project-to- boost-network-capacity.html

44
KENT AND MEDWAY ENERGY AND LOW EMISSIONS STRATEGY EVIDENCE BASE
32. Climate Change Act 2008 https://www.legislation.gov.uk/ukpga/2008/27/contents
33. Committee on Climate Change (2018) 2018 Progress report to parliament https:// www.theccc.org.uk/wp-content/uploads/2018/06/CCC-2018-Progress-Report-to- Parliament.pdf
34. Western Power https://www.westernpower.co.uk/projects/freedom
35. IPPC (2018) Special Report http://www.ipcc.ch/report/sr15/
36. KCC (2009) Local Climate Impacts Profile https://www.kent.gov.uk/about-the-council/ information-and-data/Facts-and-figures-about-Kent/environmental-policies/climate- change/kents-changing-climate
37. BEIS (2018) Local Authority carbon dioxide emissions https://www.gov.uk/ government/collections/uk-local-authority-and-regional-carbon-dioxide-emissions- national-statistics.
38. BEIS (2018) Local Authority carbon dioxide emissions estimates 2016 https://assets. publishing.service.gov.uk/government/uploads/system/uploads/attachment_data/ file/719182/Local_Authority_CO2_Emissions_Statistical_Release_2016.pdf
39. BEIS (2018) Local Authority carbon dioxide emissions https://www.gov.uk/ government/collections/uk-local-authority-and-regional-carbon-dioxide-emissions- national-statistics.
40. BEIS (2018) Fuel poverty sub regional statistics https://www.gov.uk/government/ collections/fuel-poverty-sub-regional-statistics#2016-statistics. See also tables 23 and 24 in appendix 4.
41. KCC (2018) Environment Perception Survey 2018 https://www.kent.gov.uk/ data/ assets/pdf_file/0006/88170/Kent-environment-survey-research-report.pdf
42. BEIS (2019) Quarterly Energy Prices, Q4 2018 https://assets.publishing.service.gov.uk/ government/uploads/system/uploads/attachment_data/file/790035/QEP_Q4_2018. pdf
43. BEIS (2019) Average annual domestic gas bills for GB regions https://assets.publishing. service.gov.uk/government/uploads/system/uploads/attachment_data/file/790133/ table_233.xlsx
44. BEIS (2019) Average annual domestic electricity bills for GB regions https://assets. publishing.service.gov.uk/government/uploads/system/uploads/attachment_data/ file/790129/table_224.xlsx
45. KEEP (2016) Delivering Affordable Warmth http://www.gravesham.gov.uk/home/ housing/saving-money-on-your-bills/fuel-poverty-strategy-for-kent
46. Kent and Medway Warm Homes Scheme https://www.kent.gov.uk/about-the-council/ campaigns-and-events/warm-homes
47. ONS (2018) Excess winter mortality in England and Wales https://www.ons.gov.
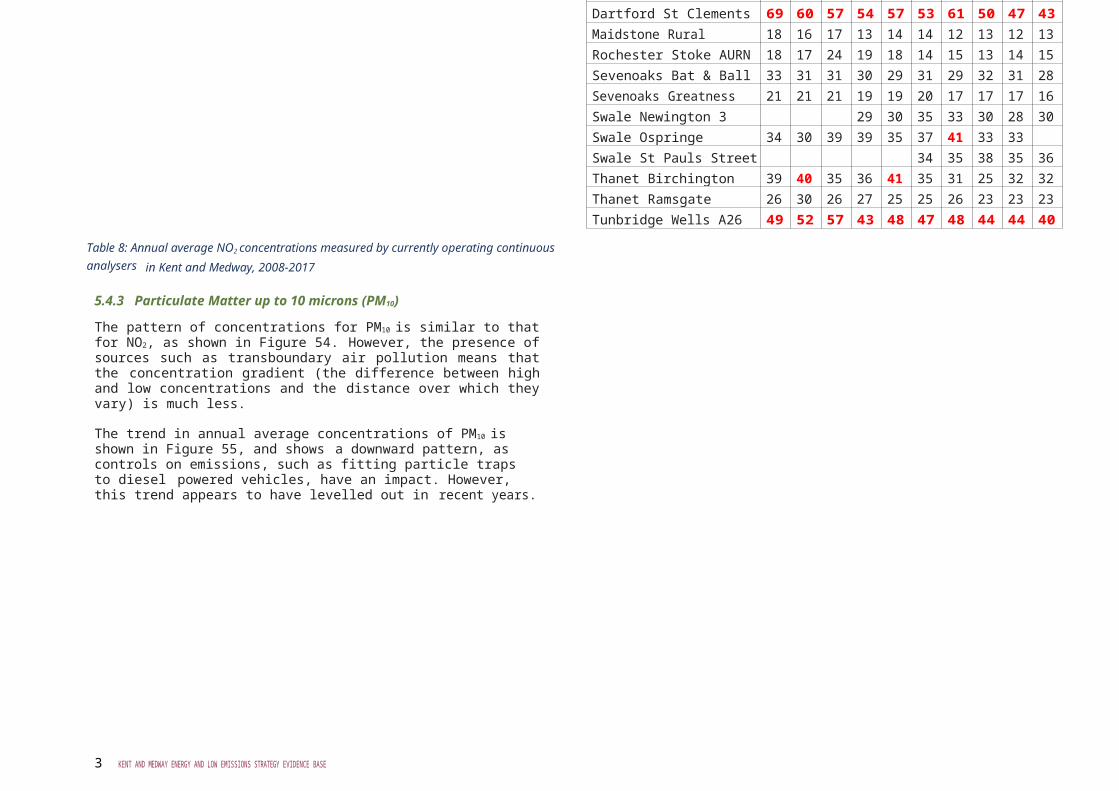
45
KENT AND MEDWAY ENERGY AND LOW EMISSIONS STRATEGY EVIDENCE BASE
uk/peoplepopulationandcommunity/birthsdeathsandmarriages/deaths/datasets/ excesswintermortalityinenglandandwalesreferencetables. Also see table 20 in appendix 4.
48. ONS (2018) Excess winter mortality in England and Wales: 2017 to 2018 (provisional) https://www.ons.gov.uk/peoplepopulationandcommunity/birthsdeathsandmarriages/deaths/bulletins/ excesswintermortalityinenglandandwales/2017to2018provisionaland2016to2017final
49. Friends of the Earth (2011) The health impacts of cold homes and fuel poverty https:// friendsoftheearth.uk/sites/default/files/downloads/cold_homes_health.pdf
50. Age UK (2014) Reducing fuel poverty – a scourge for older people https://www. ageuk.org.uk/Documents/EN-GB/For-professionals/Consumer-issues/reducing_fuel_ poverty_report.pdf?dtrk=true
51. KCC (2017) Renewable Energy Action Plan: 2017 Update https://www.kent.gov.uk/ data/assets/pdf_file/0011/89498/Renewable-energy-for-Kent-2017-action-plan- update.pdf
52. BEIS (2018) Clean Growth Strategy https://www.gov.uk/government/publications/ clean-growth-strategy
53. BEIS (2018) Heat Networks Investment Project https://assets.publishing.service.gov.uk/ government/uploads/system/uploads/attachment_data/file/691643/Heat_Network_ Case_Study_Brochure.pdf
54. SE LEP (2019) Energy South2East Local Energy Strategy https://www.southeastlep. com/app/uploads/2019/03/Local-Energy-Strategy-FINAL.pdf
55. AECOM/KCC (2014) Heat Networks in Kent and Medway: pre-feasibility study (not published)
56. AECOM/KCC (2016) Maidstone Heat Network Feasibility Study (not published)
57. National Audit Office (2016) Nuclear Power in the UK https://www.nao.org.uk/wp- content/uploads/2016/07/Nuclear-power-in-the-UK.pdf
58. Committee in Climate Change (2018) 2018 Progress report to Parliament https://www. theccc.org.uk/wp-content/uploads/2018/06/CCC-2018-Progress-Report-to-Parliament. pdf
59. Port of Dover annual traffic statistics https://www.doverport.co.uk/about/ performance/
60. Eurotunnel traffic statistics https://www.getlinkgroup.com/uk/eurotunnel-group/ operations/traffic-figures/
61. Vehicle Certification Agency https://www.vehicle-certification-agency.gov.uk/fcb/ulev. asp
62. DfT (2018) The Road to Zero https://assets.publishing.service.gov.uk/government/

46
KENT AND MEDWAY ENERGY AND LOW EMISSIONS STRATEGY EVIDENCE BASE
uploads/system/uploads/attachment_data/file/739460/road-to-zero.pdf
63. DEfRA (2019) Clean Air Strategy 2019 https://www.gov.uk/government/publications/ clean-air-strategy-2019
64. DfT (2019) Road vehicle statistics https://www.gov.uk/government/statistical-data- sets/all-vehicles-veh01#ultra-low-emissions-vehicles
65. Fastrack electric bus trial http://www.go-fastrack.co.uk/electric-bus-trial.html
66. KCC The Big Conversation https://www.kent.gov.uk/roads-and-travel/travelling- around-kent/big-conversation
67. DfT (2015) Investing in walking and cycling: the economic case for action https:// assets.publishing.service.gov.uk/government/uploads/system/uploads/attachment_ data/file/416826/cycling-and-walking-business-case-summary.pdf
68. Dft (2017) National Travel Survey 2017 https://assets.publishing.service.gov.uk/ government/uploads/system/uploads/attachment_data/file/729521/national-travel- survey-2017.pdf
69. Medway Council (2018) Medway Sustainable School Travel Strategy https://www. medway.gov.uk/download/downloads/id/1811/medway_sustainable_school_travel_ strategy.pdf
70. KCC (2017) Active Travel Strategy https://www.kent.gov.uk/about-the-council/ strategies-and-policies/transport-and-highways-policies/active-travel-strategy
71. West Kent Local Sustainable Transport Fund https://www.southeastlep.com/project/ west-kent-local-sustainable-transport-fund-lstf/
72. Kent Thameside Local Sustainable Transport https://www.kent.gov.uk/roads-and- travel/what-we-look-after/roads/road-projects/in-progress-road-projects/kent- thameside-local-sustainable-transport-integrated-door-to-door-journeys
73. DfT (2018) Maritime 2050 Navigating the future https://assets.publishing.service. gov.uk/government/uploads/system/uploads/attachment_data/file/773178/ maritime-2050.pdf
74. Atlas Transmanche (https://atlas-transmanche.certic.unicaen.fr/fr/page-382.html)
75. PASSAGE Interreg Europe (2018) PASSAGE carbon study https://www.interregeurope. eu/passage/library/#
76. DfT (2018) Aviation 2050 the future of UK aviation, a consultation https://assets. publishing.service.gov.uk/government/uploads/system/uploads/attachment_data/ file/769695/aviation-2050-web.pdf
77. Kent Air http://kentair.org.uk/information
78. PHE (2018) Health matters: Air pollution https://www.gov.uk/government/ publications/health-matters-air-pollution/health-matters-air-pollution
79. Defra (2017) Air quality: A briefing for Directors of Public Health https://laqm.defra.gov. uk/assets/63091defraairqualityguide9web.pdf
80. PHE (2019) Review of Interventions to Improve Outdoor Air Quality and Public Health https://assets.publishing.service.gov.uk/government/uploads/system/uploads/ attachment_data/file/784055/Review_of_interventions_to_improve_air_quality.pdf
81. Royal College of Physicians (2016) Every breath we take: the lifelong impact of air pollution https://www.rcplondon.ac.uk/projects/outputs/every-breath-we-take- lifelong-impact-air-pollution
82. Public Health Outcomes Framework https://fingertips.phe.org.uk/profile/public- health-outcomes-framework/data#page/3/gid/1000043/pat/6/par/E12000008/ ati/102/are/E06000036/iid/30101/age/230/sex/
83. PHE Public Health Profiles: PHOF 3.01: Fraction of all-cause adult mortality attributable to anthropogenic particulate air pollution (measured as fine particulate matter, PM2.5) https://fingertips.phe.org.uk/search/air%20quality#page/0/gid/1/pat/6/par/ E12000008/ati/102/are/E10000016
84. Kent Public Health Observatory (2018) Air quality https://www.kpho.org.uk/ data/ assets/pdf_file/0004/80617/Air-Quality.pdf
85. KCC (2015) The English Index of Multiple Deprivation headline findings for Kent http:// www.kent.gov.uk/ data/assets/pdf_file/0006/7953/Indices-of-Deprivation-headline- findings.pdf
86. PHE (2018) Estimation of costs to the NHS and social care due to the health impacts of air pollution https://assets.publishing.service.gov.uk/government/uploads/system/uploads/attachment_data/file/708855/Estimation_of_costs_to_the_NHS_and_social_ care_due_to_the_health_impacts_of_air_pollution_-_summary_report.pdf
87. Kent Air www.kentair.org.uk
88. National Atmospheric Emissions Inventory, http://naei.beis.gov.uk
89. Defra (2019) Emissions of air pollutatns in the UK, 1970 to 2017 https://assets. publishing.service.gov.uk/government/uploads/system/uploads/attachment_data/ file/778483/Emissions_of_air_pollutants_1990_2017.pdf
90. National Atmospheric Emissions Inventory (2018) Air pollutant inventories for England, Scotland, Wales and Northern Ireland 1990 – 2016 https://uk-air.defra.gov.uk/assets/ documents/reports/cat09/1810160958_DA_Air_Pollutant_Inventories_1990-2016_ Issue1.pdf
91. Medway Council (2015) Air quality action plan https://www.medway.gov.uk/

47
KENT AND MEDWAY ENERGY AND LOW EMISSIONS STRATEGY EVIDENCE BASE
download/downloads/id/1982/medway_air_quality_action_plan_2015.pdf
92. Defra https://uk-air.defra.gov.uk/air-pollution/uk-eu-limits.
93. Kent and Medway Air Quality Partnership

48
KENT AND MEDWAY ENERGY AND LOW EMISSIONS STRATEGY EVIDENCE BASE
94. http://www.who.int/news-room/fact-sheets/detail/ambient-(outdoor)-air-quality- and-health
95. ONS (2017) Developing estimates for the valuation of air pollution in ecosystem accounts https://www.ons.gov.uk/economy/environmentalaccounts/articles/ developingestimatesforthevaluationofairpollutioninecosystemaccounts/2017-07-25 Centre for Ecology and Hydrology (?) Using trees to improve air quality in cities http:// www.es.lancs.ac.uk/people/cnh/UrbanTreesBrochure.pdf
96. Fields in Trust (2018) Revaluing parks and green spaces: measuring their economic and wellbeing value to individuals http://www.fieldsintrust.org/Upload/file/research/ Revaluing-Parks-and-Green-Spaces-Report.pdf
97. Air quality expert group (2018) Impacts of vegetation on urban air pollution https:// uk-air.defra.gov.uk/assets/documents/reports/cat09/1807251306_180509_Effects_of_ vegetation_on_urban_air_pollution_v12_final.pdf
98. PHE (2019) Review of interventions ot improve air quality https://assets.publishing. service.gov.uk/government/uploads/system/uploads/attachment_data/file/784055/ Review_of_interventions_to_improve_air_quality.pdf
49
KENT AND MEDWAY ENERGY AND LOW EMISSIONS STRATEGY EVIDENCE BASE
Appendix 1: National policy context 1 IntroductionThis Appendix summarises key areas of national government policy which have an impact on the drive to reduce carbon emissions and improve air quality. Policy approaches have been categorised for ease of reference into:
• Environmental policy• Health and social policy
2Environmental policy2.1 UK Industrial Strategy and Clean Growth StrategyIn 2017, the Government published its Industrial Strategy1, setting out its plan to create an economy that boosts productivity and earning power throughout the UK and as part of this, maximising the advantages for UK industry from the global shift to clean growth. The Clean Growth Strategy2 goes on to give more detailed policies and proposals including improving business and industry efficiency (in their processes as well as their buildings),improving homes and accelerating the shift to low carbon.
2.2 Clean Air StrategyIn January 2019, Defra published the Clean Air Strategy 20193, which addresses broadly air quality and is aimed at meeting the national emissions reductions obligations. This Strategy also provides a specific focus on reducing population exposure to particulate matter and indoor air pollution. It also seeks to address the upwards trend in ammonia emissions from agriculture, which negatively impacts the natural environment, such as nitrogen deposition.
2.3 25-Year Environment PlanA Green Future: Our 25 Year Plan to Improve the Environment4, published in January 2018, sets out the Government’s strategy with regard to environmental protection. Climate change and air pollution were identified as key action areas, under 6 policy focusses:
• Using and managing land sustainably• Recovering nature and enhancing the beauty of landscapes• Connecting people with the environment to improve health and wellbeing• Increasing resource efficiency, and reducing pollution and waste• Securing clean, productive and biologically diverse seas and oceans• Protecting and improving the global environment
The 25 Year Plan also made explicit links to the Government’s Industrial Strategy stating that: “Environmental protection is at the heart of the [industrial] strategy, as our Clean Growth Grand Challenge shows, and is also evident in our investment in clean innovation, the support for zero-emission vehicles, and measures to tackle local air pollution.
Similarly, the 25 Year Environment Plan will help boost productivity by enhancing our natural capital – the air, water, soil and ecosystems that support all forms of life – since this is an essential basis for economic growth and productivity over the long term”.
2.4 Climate Change Act 2008The 2008 Climate Change Act5 sets the legal framework for the UK to cut greenhouse gas emissions to 80% below 1990 levels by 2050. It was innovative legislation, setting mandatory targets and requiring five-year carbon budgets for the first time, as wellas setting up the Committee on Climate Change6 to provide the government with independent advice and to report on progress made. Work in the UK was strengthened by the 2015 UN Paris Agreement7, an international agreement to limit global temperature rise to below 2°C above pre-industrial levels. An IPCC Special Report8, published in October 2018, suggests that warming needs to be restricted to 1.5°C to avoid damaging climate change.
2.5 Public Sector Carbon EmissionsIn April 2018, BEIS published the ‘Emissions Reduction Pledge 2020’.9 The Pledge responds to a commitment in the Clean Growth Strategy to introduce a voluntary greenhouse
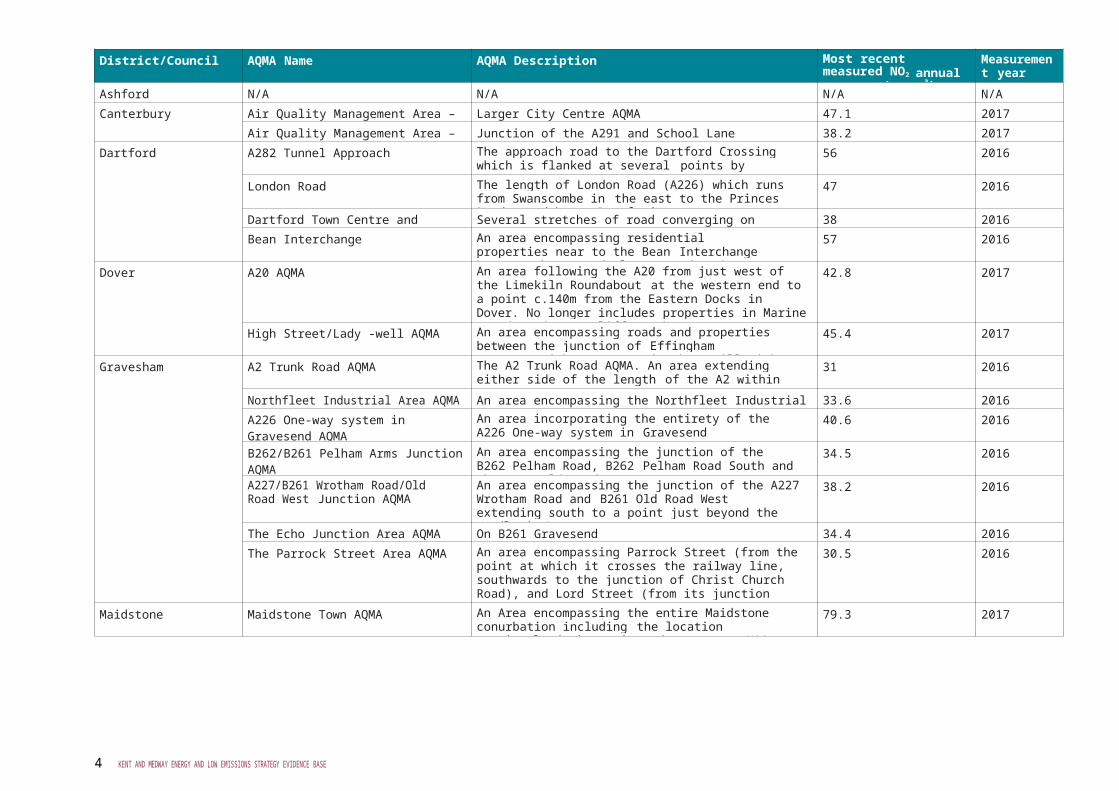
50
KENT AND MEDWAY ENERGY AND LOW EMISSIONS STRATEGY EVIDENCE BASE
1 https://www.gov.uk/government/publications/industrial-strategy-building-a-britain-fit-for-the-future2 https://www.gov.uk/government/publications/clean-growth-strategy3 https://www.gov.uk/government/publications/clean-air-strategy-20194
https://www.gov.uk/government/publications/25-year-environment-plan5 https://www.legislation.gov.uk/ukpga/2008/27/contents6 https://www.theccc.org.uk/7 https://unfccc.int/process-and-meetings/the-paris-agreement/the-paris-agreement8 http://www.ipcc.ch/report/sr15/9 https://assets.publishing.service.gov.uk/government/uploads/system/uploads/attachment_data/file/745003/ Guidance_note_for_voluntary_reporting-final.pdf

51
KENT AND MEDWAY ENERGY AND LOW EMISSIONS STRATEGY EVIDENCE BASE
gas reduction target for the public and higher education sectors in England, aiming to reduce these emissions by 30% by 2020/21 compared to a 2009/10 baseline. In the document, BEIS sets out the voluntary target and reporting framework which is ‘intended to standardise public and higher education sectors reporting, engage sector leaders and encourage future action on decarbonisation.’ Organisations that sign up are required to:
• Develop and implement the business case for measuring and reducing energy use, costs and carbon emissions in their organisation
• Implement the Emissions Reduction Pledge 2020, using regular measurement to inform management action
• Report annual energy use to BEIS through existing reporting mechanisms where possible
• Share best practice in their local area and within the sectors.
2.6 Minimum Energy Efficiency Standards for BuildingsIntroduced under the Energy Efficiency (Private Rented Property) (England and Wales) Regulations 2015, Minimum Energy Efficiency Standards (or MEES) came into force in April 2018. They set a legal standard for energy efficiency in both the domestic and commercial rented sectors. F and G-rated buildings can no longer be let: this goes for allnew buildings from 2018 and all existing buildings from 2023 (although some exemptions do apply). This puts the onus on the landlord to improve the energy efficiency of their buildings in order to continue to rent them out. In the domestic sector, energy efficiency standards in rented accommodation can also be enforced through the Housing Health and Safety Rating System (HHSRS).10
2.7 Low Carbon HeatThe UK spends about £32bn/year on heating, accounting for about one-third of our greenhouse gas emissions. In 2012, the Government published The Future of Heating: A Strategic Framework for Low Carbon Heat11, their strategy to decarbonise heat to contribute to meeting carbon budgets and the 2050 target. In The Future of Heating: Meeting the Challenge12 published the next year, the Government set out their action plan to deliver low carbon heat across industry, heat networks, heating and cooling in domestic and non-domestic buildings and the long term options for the gas grid.
10 For more information on how MEES and HHSRS can be used to promote energy efficiency in the domestic sector also see https://www.theade.co.uk/resources/publications/the-warm-arm-of-the-law-tackling-fuel-pover- ty-in-the-private-rented-sector.11 https://www.gov.uk/government/publications/the-future-of-heating-a-strategic-framework-for-low-carbon- heat
12 https://www.gov.uk/government/publications/the-future-of-heating-meeting-the-challenge
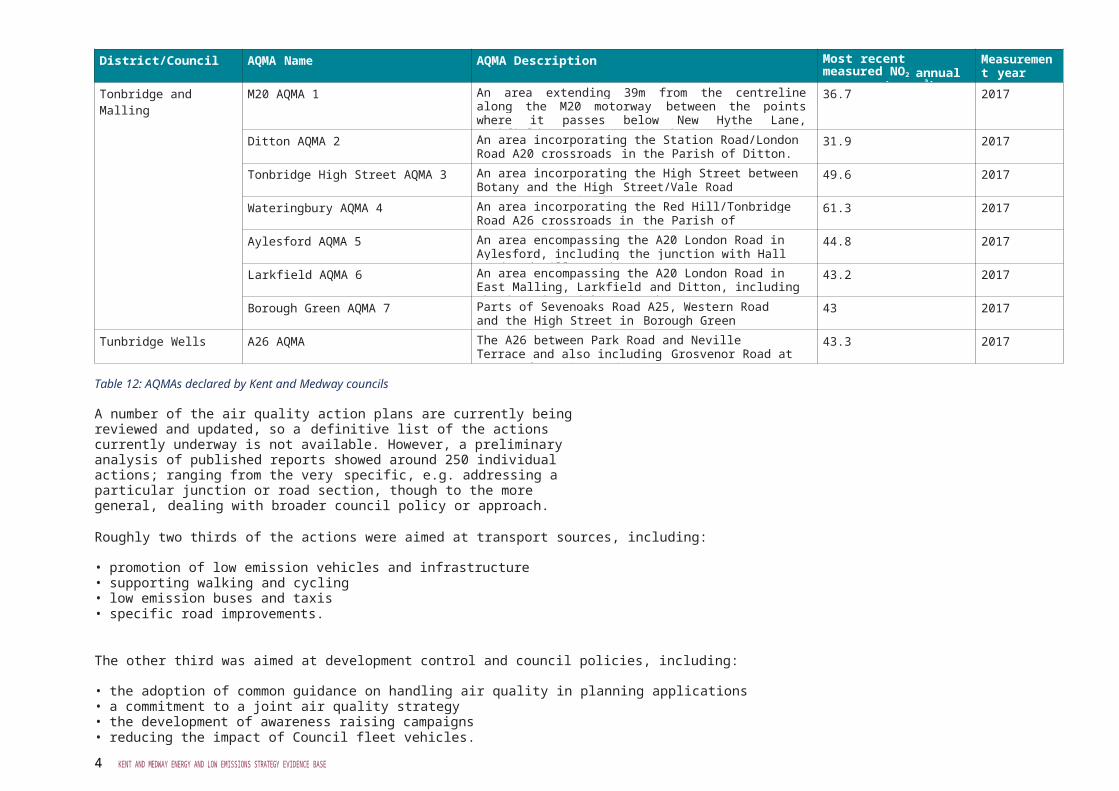
52
KENT AND MEDWAY ENERGY AND LOW EMISSIONS STRATEGY EVIDENCE BASE
As part of this, the Heat Networks Delivery Unit (HNDU)13 was established to support local authorities to develop heat networks. This is now further supported by the Heat Networks Investment Project (HNIP)14 which will provide over £300m capital investment and support for the delivery of heat networks.
2.8 Low Emission TransportThe Road to Zero white paper, published in 2018, sets out both the ambition for all new road vehicles to be “effectively zero emission” by 2040 and the steps by which the Government intends to achieve this. This includes stimulating the design and manufacture of low emission vehicles, supporting the development of relevantinfrastructure, e.g. charging points, and incentivising the uptake of low emission vehicles by businesses and the public. It includes steps to support action at a local level:
• Fulfilling a £48m ultra low emission bus scheme funding round to accelerate uptake and deployment of supporting infrastructure.
• Launching a second round of funding of at least £6m for local authorities to roll out dedicated taxi charging infrastructure.
• Setting out definitions of ultra low and zero emission vehicles that local areas
may adopt.• Running a series of roadshows across the UK on best practice approaches to
driving the uptake of ultra low emission vehicles.• It is clear that local authorities can benefit from new funding streams
2.9 Air QualityEU legislation forms the core of the current UK legislative framework on air quality, covering all four aspects of air quality and air pollution control policy: national emissions, ambient concentrations, industrial emissions and produce standards (including vehicle emissions standards). Most prominent are the Ambient Air Quality Directive (2008/50/EC), the Reduction of National Emissions Directive, the Industrial Emissions Directive (2010/75/ EU) and the suite of vehicle emissions standards known collectively as the Euro Standards.
Responsibility for Local Air Quality Management (under the Environment Act 1995) rests with District Councils and unitary authorities, whereas national responsibility is retained by Defra. However, County Councils retain a strong role in improving air quality, including the obligation to set out the measures at their disposal in support of the District Councils’ Air Quality Action Plans.
13 https://www.gov.uk/guidance/heat-networks-delivery-unit14 https://www.gov.uk/government/publications/heat-networks-investment-project-hnip
53
KENT AND MEDWAY ENERGY AND LOW EMISSIONS STRATEGY EVIDENCE BASE
The Government’s 2017 National Air Quality Plan15 is aimed at fulfilling current obligations to meet air quality Limit Values, specifically on NO2. Central to this is a system of Clean Air Zones and other nationally coordinated actions (undertaken by local authorities), running alongside local Air Quality Management Areas to help achieve UK Air Quality Objectives.
The full set of UK and European air quality targets is provided16.
3Health and social policy3.1 Public HealthIn 2012, the Health and Social Care Act17 transferred local public health duties out of the National Health Service (NHS) and back into local government. The Act gives local authorities the responsibility for improving and protecting the health of their local populations.
This reflects the importance of the wider determinants of health (including good housing, access to open spaces, public transportation and clean air to breath) which are more important for population health and wellbeing than the quality of healthcare received.’
Review of interventions to improve outdoor air quality and public health’
Public Health England published a review of interventions to improve outdoor air quality in March 201918. This report aimed to support local authorities and partners to take effective action to reduce emissions of air pollution at source. Five areas were considered: vehicles and fuels, spatial planning, industry, agriculture and behaviour change. The evidence was assessed and the interventions with the potential for the most benefit to health by reducing emissions, concentration and exposures were identified.
Several principles were developed. These included that air pollutants should be considered and tacked together; that the pollutants do not respect borders and local authorities need to work together; that effective strategies require a coherent approache.g. through public health working with planning or local government working with local communities; that individuals need to change behaviours to reduce their contributionto pollution and their contribution to that pollution and that prevention is better – that preventing, reducing or replacing polluting activities is better than mitigation. In addition, some of those affected may need additional help, e.g. those that have to drive for a living, but do not have resources available for less polluting vehicles and
reducing pollutants does not hav e t o b e at the expense of economic growth.15 www.gov.uk/government/publications/air-quality-plan-for-nitrogen-dioxide-no2-in-uk-201716 https://uk-air.defra.gov.uk/assets/documents/Air_Quality_Objectives_Update.pdf17 https://www.gov.uk/government/publications/health-and-social-care-act-2012-fact-sheets18 Review of intervention to improve outdoor air quality and public health. Public Health England. March 2019.

54
KENT AND MEDWAY ENERGY AND LOW EMISSIONS STRATEGY EVIDENCE BASE
There were a number of interventions identified. These are scalable and could deliver greatest health benefits when widely implemented. These interventions include:
• targeted intervention such as anti-idling at specific hotspots or close to schools and hospitals
• interventions to reduce or prevent emissions rather than mitigating pollution that has already occurred
• interventions in urban areas that target road vehicles or emissions from wood-burners
• all interventions should be systematically evaluated.
In addition, there were several interventions on specific areas. These add credence to this strategy as they demonstrate the evidence base used for the interventions in the Energy and Low Emissions Strategy and the current and future work plans of Kent Public Health. Firstly, for traffic-related pollution, the interventions included:
• promoting the uptake of low emission vehicles and reducing demand for more polluting forms of transport
• using spatial planning and transport tools to reduce the sources and exposure to pollution e.g. by reducing the need for individual car use or changing road layouts.
For intervention on non-traffic sources of pollution there were interventions suggested on low emission transport such as:
• lower-emission trains and planes• reducing pollution from local industry and agriculture such as dust abatement
and livestock management.
To address public behaviour, awareness campaigns are suggested along with the provision of information to allow people to make informed choices to minimise their contribution to air pollution and, as importantly, how they can minimise their exposure to pollution.
3.2 The NHS long term plan 2019This plan confirms the need for more action on Prevention and Health Inequalities, by improving upstream prevention of avoidable illnesses and its exacerbations. Examples of targeted action that will positively impact health includes smoking cessation, reducing obesity and lowering air pollution.
It makes clear that action goes beyond the NHS and requires individuals, communities, businesses and national government to ensure health is hardwired into social and economic policy, making clear that socioeconomic inequality costs the NHS an extra
£4.8 billion per year, in greater hospitalisations alone.

55
KENT AND MEDWAY ENERGY AND LOW EMISSIONS STRATEGY EVIDENCE BASE
The role of local authorities is an important one, which the NHS can complement. In recent years top tier and unitary councils have become responsible for funding and commissioning preventive health services, this in addition to its wider responsibilities for planning, education, housing, roads, social care, economic development and green spaces, all of which have an important role in supporting improved health outcomes.
While the NHS recognises wider action to reduce air pollution will be government led, the NHS is also committed to work to reduce air pollution, specifically by cutting business mileage and fleet emissions by 20% by 2023/24. Redesigned care and greater use of ‘virtual’ appointments will also reduce the need for patient and staff travel.
The NHS long term plan provides some key facts about air pollution:
• Almost 30% of preventable deaths in England are due to non-communicable diseases specifically attributed to air pollution. (See Figure 12 from NHS long term plan below)
• More than 2,000 GP practices and 200 hospitals are in areas affected by toxic air.• In 2017, 3.5% (9.5 billion miles) of all road travel in England was related to
patients, visitors, staff and suppliers to the NHS.• At least 90% of the NHS fleet will use low-emissions engines (including 25% Ultra
Low Emissions) by 2028, and primary heating from coal and oil fuel in NHS sites will be fully phased out.
The top five priorities for the renewed NHS prevention programme are: smoking, poor diet, high blood pressure, obesity, alcohol and drug use. Air pollution and lack of exercise are also significant, with a need to intensify the NHS focus on children’s health, cardiovascular and respiratory conditions, amongst others.
Key facts from the NHS Long Term Plan19 (linked references refer to references in the NHS Long Term Plan)
• The NHS Long Term Plan has been informed by the Global Burden of Disease (GBD) study which quantifies and ranks the contribution of various risk factors that cause premature deaths in England [21]
• Lung conditions, including lung cancer, are estimated to cost wider society around£9.9 billion each year [129].
• Respiratory disease affects one in five people in England, and is the third biggest cause of death [130]. Hospital admissions for lung disease have risen over the past seven years at three times the rate of all admissions generally [131] and remain a major factor in the winter pressures faced by the NHS. Over the next ten years the NHS will target investment in improved treatment and support for those with respiratory disease,with an ambition to transform our outcomes to equal, or better, our international counterparts.
• Incidence and mortality rates for those with respiratory disease are higher in disadvantaged groups and areas of social deprivation [132], where there is often higher smoking incidence, exposure to higher levels of air pollution, poor housing conditions and exposure to occupational hazards.
• Preventive action commissioned by local authorities focused on smoking cessation, reduced air pollution and fuel poverty will be important to help achieve reduced admissions due to respiratory disease and a reduced burden on NHS resources.
3.3 Fuel PovertyAround 4 million UK households are in fuel poverty, unable to afford to live in a warm, dry home. The Fuel Poverty Strategy for England (2015)20 set an ambition for as many fuel poor homes in England as is reasonably practicable to an Energy Performance Certificate (EPC) Band E by 2020, Band D by 2025 and Band C by 2030. One route to achieving this is to improve the energy efficiency of homes.

56
KENT AND MEDWAY ENERGY AND LOW EMISSIONS STRATEGY EVIDENCE BASE
19 https://www.longtermplan.nhs.uk/wp-content/uploads/2019/01/nhs-long-term-plan.pdf20 https://www.gov.uk/government/publications/cutting-the-cost-of-keeping-warm
50 KENT AND MEDWAY ENERGY AND LOW EMISSIONS STRATEGY EVIDENCE BASE
Appendix 2: Regional Policy ContextKent and Medway falls within the region covered by the South East Local Enterprise Partnership (SELEP) 21, one of 38 business-led public/private bodies established to drive economic growth in the region. SELEP covers East Sussex, Kent, Medway, Southend and Thurrock and is the key body determining strategic priorities, making investments and delivering activities to drive local growth and jobs. The SELEP is also part of a new collaboration with 10 other LEPs to form the Greater South East Energy Hub, aimed at increasing the number, quality and scale of local energy projects being delivered across the South East of the UK, over time.22
SELEP has joined with the Coast to Capital LEP and the Enterprise M3 LEP to deliver the Energy South2East local energy strategy.23 Five themes have been identified for the strategy as shown in Figure A2.1
Figure A2.1: The five priority themes for categorising energy interventions
The strategy identifies 18 Project Models, acting as exemplar or ‘lighthouse’ projects to help implement the five themes. If delivered, by 2032 the tri-LEP region will have:
• secured investment in the region of £14.755 billion in commercially and technically viable projects that deliver healthy returns to stakeholders
• delivered a reduction in CO2 emissions across the electricity, heat and transport sectors of 13,615 ktCO2e
• reduced energy consumption by 48,583 GWh• created or secured 75,652 jobs across the tri-LEP area.
The proposed Project Models have been considered and those considered priorities for the county have been included in the KMELES action plan.
21 https://www.southeastlep.com/22 http://46.32.240.41/energyhub.org.uk/
50 KENT AND MEDWAY ENERGY AND LOW EMISSIONS STRATEGY EVIDENCE BASE
23 https://www.southeastlep.com/energysouth2east/
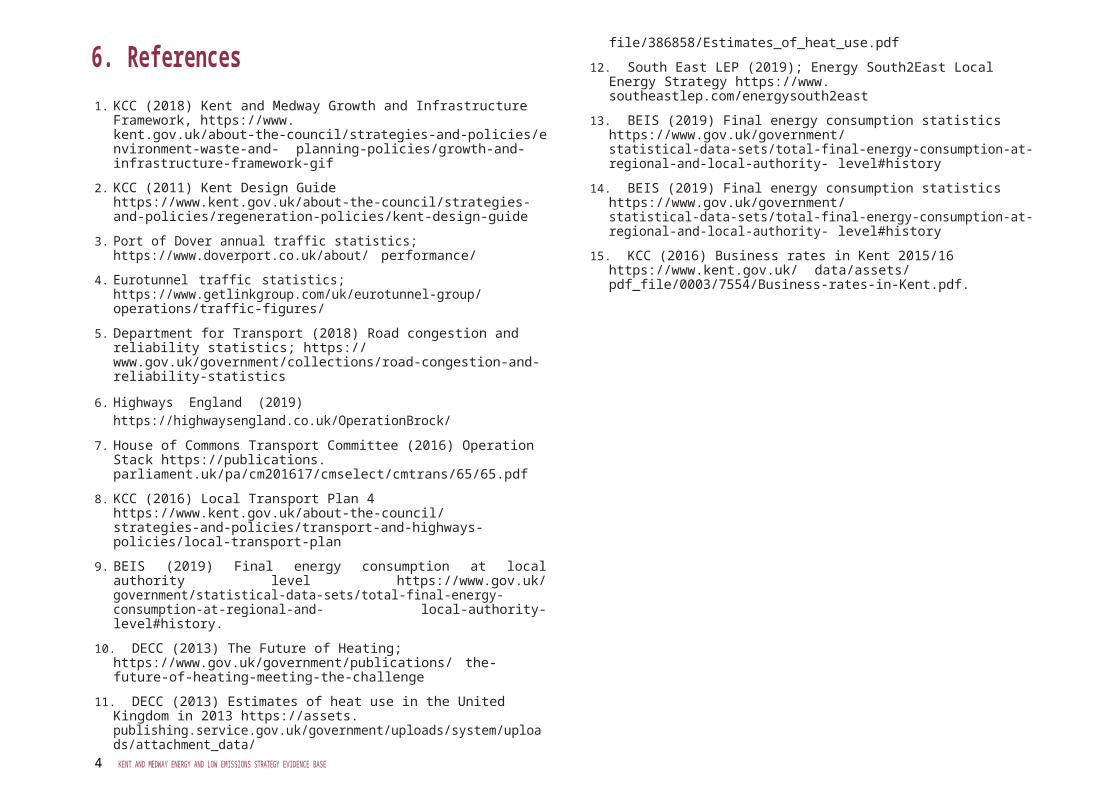
51
KENT AND MEDWAY ENERGY AND LOW EMISSIONS STRATEGY EVIDENCE BASE
Appendix 3: Kent and Medway Policy Context1.EnvironmentThe 2016 Kent Environment Strategy (KES)24 seeks to address environmental risks and priorities and to balance and mitigate the impacts of growth. This includes a focus on sustainable and alternative transport options, green infrastructure, energy, water and climate risks such as flooding and other severe weather impacts. The KES includes countywide targets including reducing greenhouse gas emissions by 34% by 2020 and 60% by 2030, from a 2005 baseline. It draws together priorities and strategies from partner organisations across Kent and Medway in environment, growth, economy and health to provide a single, integrated approach to tackling the challenges and maximising the opportunities provided by our changing environment. The strategy identifies 10 priorities, including the need to develop a Low Emissions Strategy to tackle air pollution and its associated health impacts. Since KES was updated, it has been recognised that actions to address energy demand and resulting emissions were common to those impacting on air quality and should be brought together in a single Energy and Low Emissions Strategy.
2.Air QualityAction on air quality by district councils across Kent and Medway is primarily driven by a legal requirement to assess air quality in their area. The results of these assessments are updated annually, with an Annual Status Report submitted to Defra. Where there is or is likely to be a breach of the national air quality objectives, the council must declare an Air Quality Management Area and develop an Air Quality Action Plan. Currently, onlytwo councils in Kent and Medway – Ashford and Folkestone & Hythe – have not declared AQMAs, although they monitor air quality and have adopted actions aimed at improving air quality. In addition to these requirements, the District authorities have formed the Kent and Medway Air Quality Partnership, which allows them to share experience, expertise and resources. They also jointly fund a network of air quality monitoring, with results shown online25 on the KentAir website alongside the “Care for Air” information resource.
The Partnership has also prepared Air Quality Planning Guidance aimed at local authorities, developers and consultants. The guidance was produced following an extensive review of the partnership guidance published in 2011 and made in response to changes in national planning policy, through the National Planning Policy Framework.The guidance uses a method for assessing the air quality impacts of a development which includes the q uantification of impacts, calculation of damage costs, and the
identification 24 https://www.kent.gov.uk/about-the-council/information-and-data/Facts-and-figures-about-Kent/environ- mental-policies/kent-environment-strategy25 http://www.kentair.org.uk/
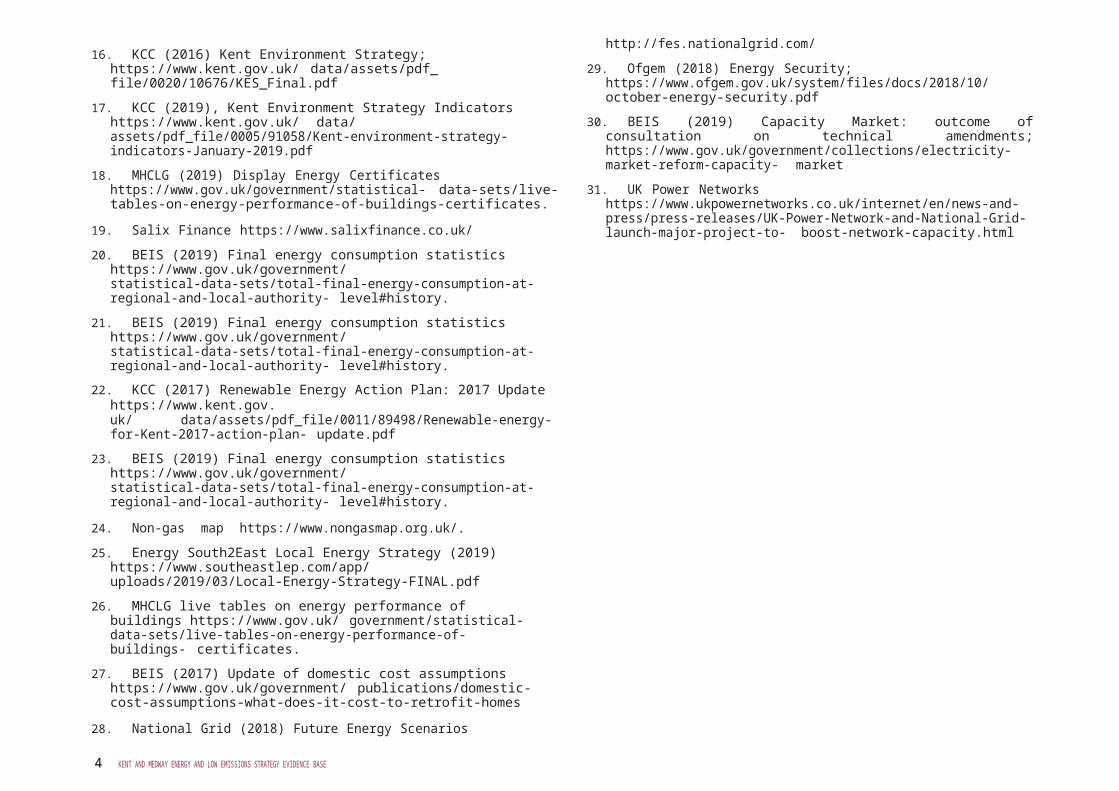
52
KENT AND MEDWAY ENERGY AND LOW EMISSIONS STRATEGY EVIDENCE BASE
of mitigation measures to be implemented to negate the impact of development on air quality. It is hoped that the guidance will be adopted across the county and provideclarity and consistency of approach for developers, the local planning authority and local communities. The guidance is available on the KentAir website.
3.HealthThe Sustainability and Transformation Plan (STP) for Kent and Medway (updated in 2016)26 sets out how health and social care services need to change over the next five years to achieve the right care for people for decades to come. The STP calls for reduced health inequalities (avoidable differences in health and life expectancy that people experience in some parts of the county due to the wider determinants of health such as poor access to healthy food) and death rates from preventable conditions, and improved services to prevent and manage long-term health conditions, such as diabetes and lung disease, both of which can be exacerbated by fuel poverty and air pollution. The STP also callsfor improved care for children and young people with mental health and emotional wellbeing issues, which again can be impacted by living in a cold home. The STP includes a prevention workstream aimed at empowering and engaging individuals and communities to stay healthier for longer. An important part of this could be the actions that individuals can take to mitigate the impact of poor air quality and fuel povertyon their health, alongside training frontline staff to recognise and support vulnerable residents. These areas are now being added into the work plans for the prevention workstream.
The STP also has an energy sub-group aimed at reducing energy demands and emissions from the NHS estate, primarily working with the acute Trusts whose hospitals are a significant user of energy. This further demonstrates the cross-cutting nature of energy and low emissions across the public sector with services being both a contributor to the cause of air pollution and also the provider of solutions.
Public Health departments sit within Kent County Council and Medway unitary authority. Both are represented on the STP sub-group and on the Kent and Medway Air Quality Partnership. The role in addressing the health impacts of air quality is relatively newand still being established. One of the most significant roles will be to raise awareness amongst the public and across more vulnerable groups of how air pollution can impact health and the simple actions that can be taken to protect health or reduce impacts during periods of high levels of pollution. Public Health will also be a key enabler in engaging with health practitioners to put this relatively new topic at the heart of the prevention agenda.
26 https://kentandmedway.nhs.uk/stp/stp/

53
KENT AND MEDWAY ENERGY AND LOW EMISSIONS STRATEGY EVIDENCE BASE
4.Fuel PovertyDelivering Affordable Warmth: A Fuel Poverty Strategy for Kent (2016)27 sets out four objectives to help people in Kent and Medway out of fuel poverty and into affordable warmth. This provides a focus on:
1. Information gathering and sharing
2. Reducing energy demand by improving energy efficiency, working towards achieving the national target of ensuring that as many fuel poor homes as is reasonably practicable achieve a minimum energy efficiency rating of Band C by 2030
3. Reducing fuel costs by encouraging fuel switching, oil buying clubs and a switch to mains gas where practicable
4. Increasing household income by maximising take up of eligible benefits and working with partners to support people into employment
There is a strong emphasis on partnership working, as demonstrated in the accompanying Action Plan.
5. Renewable EnergyRenewable Energy for Kent: An Action Plan for Delivering Opportunities (2013)28 was commissioned by KCC to AECOM and published in 2012. It summarised the current uptake of renewable energy technologies and outlined the key actions required to increase this in the short, medium and long term.
Kent County Council further commissioned AECOM in 2017 to update key components of the Kent Renewable Energy Action Plan (REAP) 29. As reflected in section 3.6 of this report, the update assesses renewable energy capacity and trajectories across the county. Renewable and combined heat and power (CHP) capacity across Kent has increased significantly in the last five years. The capacity of solar, wind, waste and CHP combined that was active, agreed or under construction was reported as over 1,900 MW (including offshore wind farms), compared with approximately 230 MW in 2012. The majority of this increase has been delivered through solar and wind installations, with wind contributing over 1,100 MW and solar over 550 MW. The switch to low carbon heat technologies had been lower than expected, this being confirmed by the conclusions drawn by the Energy South2East Local Energy Strategy.
The updated Renewable Energy Action Plan identifies the following as key factors, which are likely to affect the uptake of each renewable technology, as well as how each of the delivery partners will impact the renewable energy sector in Kent in the future:
• grid decarbonisation• reducing costs of renewable technologies• electricity grid capacity limits• electric vehicle uptake• increasing technology efficiency• the phasing out of incentive schemes.
An improving financial case is expected to promote the installation of renewable technologies in future with the improved economics of various technologies offsetting the loss of incentive schemes.

54
KENT AND MEDWAY ENERGY AND LOW EMISSIONS STRATEGY EVIDENCE BASE
27 https://www.gravesham.gov.uk/ data/assets/pdf_file/0003/212088/Fuel-Poverty-Strategy-for-Kent.pdf28
https://www.kent.gov.uk/about-the-council/information-and-data/Facts-and-figures-about-Kent/environ- mental-policies/renewable-energy
29 https://www.kent.gov.uk/ data/assets/pdf_file/0011/89498/Renewable-energy-for-Kent-2017-ac- tion-plan-update.pdf

KENT AND MEDWAY ENERGY AND LOW EMISSIONS STRATEGY
This document is available in alternative formats and can be explained in a range of languages. Please contact [email protected]


