201
1 Introductions Who you are Where you’re from What you trade Why you are here What you want One fun thing
1
Introductions
Who you areWhere you’re fromWhat you tradeWhy you are hereWhat you wantOne fun thing
Time Frames
2
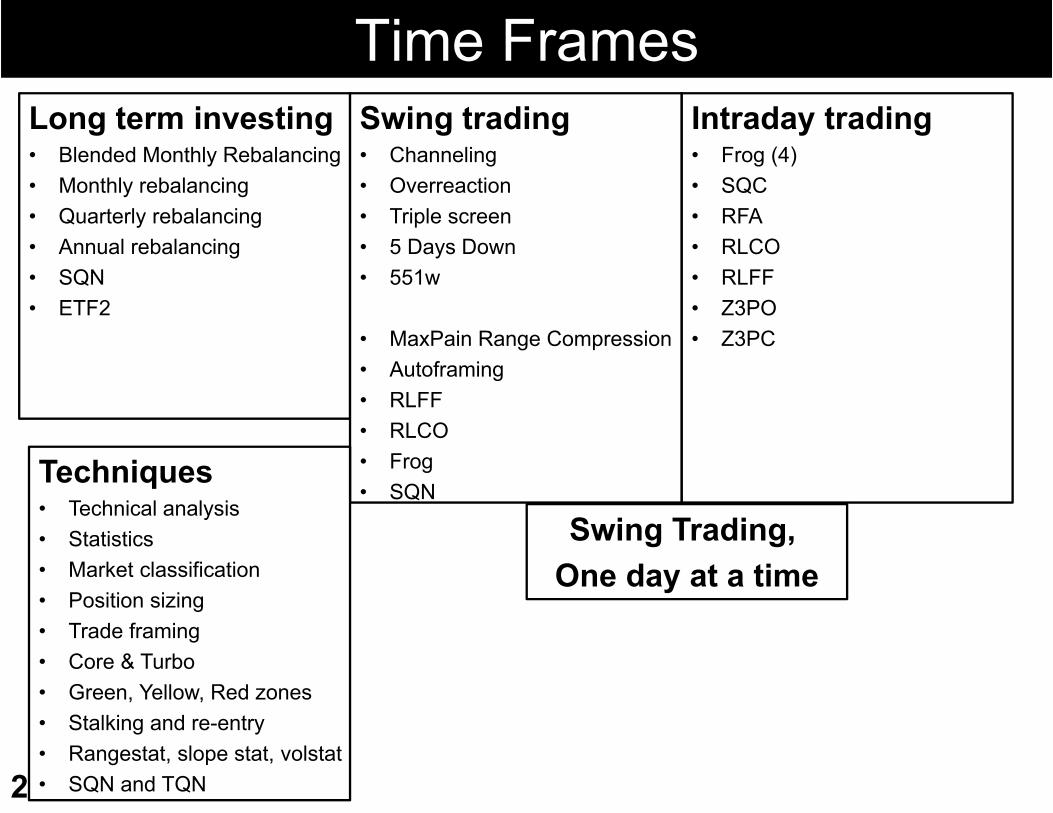
Long term investing• Blended Monthly Rebalancing• Monthly rebalancing• Quarterly rebalancing• Annual rebalancing• SQN• ETF2
Swing trading• Channeling• Overreaction• Triple screen• 5 Days Down• 551w
• MaxPain Range Compression• Autoframing• RLFF• RLCO• Frog• SQN
Intraday trading• Frog (4)• SQC• RFA• RLCO• RLFF• Z3PO• Z3PC
Swing Trading, One day at a time
Techniques • Technical analysis• Statistics• Market classification• Position sizing• Trade framing• Core & Turbo• Green, Yellow, Red zones• Stalking and re-entry• Rangestat, slope stat, volstat• SQN and TQN

3
Beliefs about Self
4
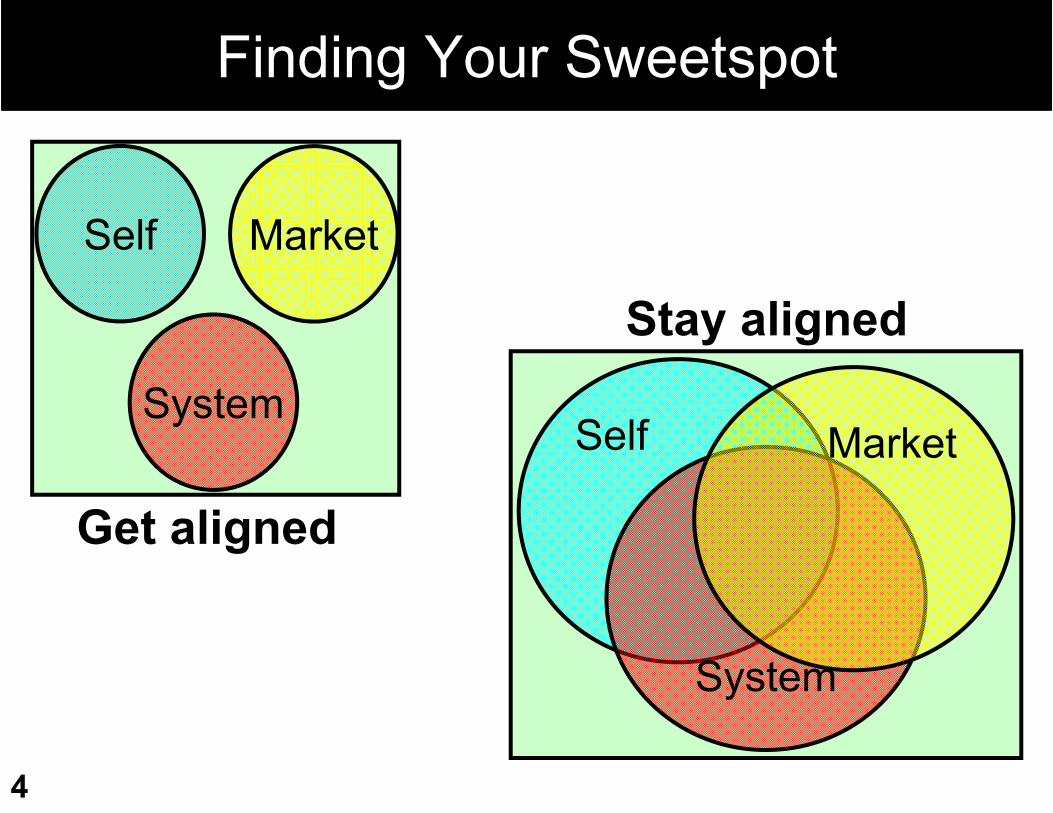
Finding Your Sweetspot
Self
System
Market
Self
System
Market
Get aligned
Stay aligned
5
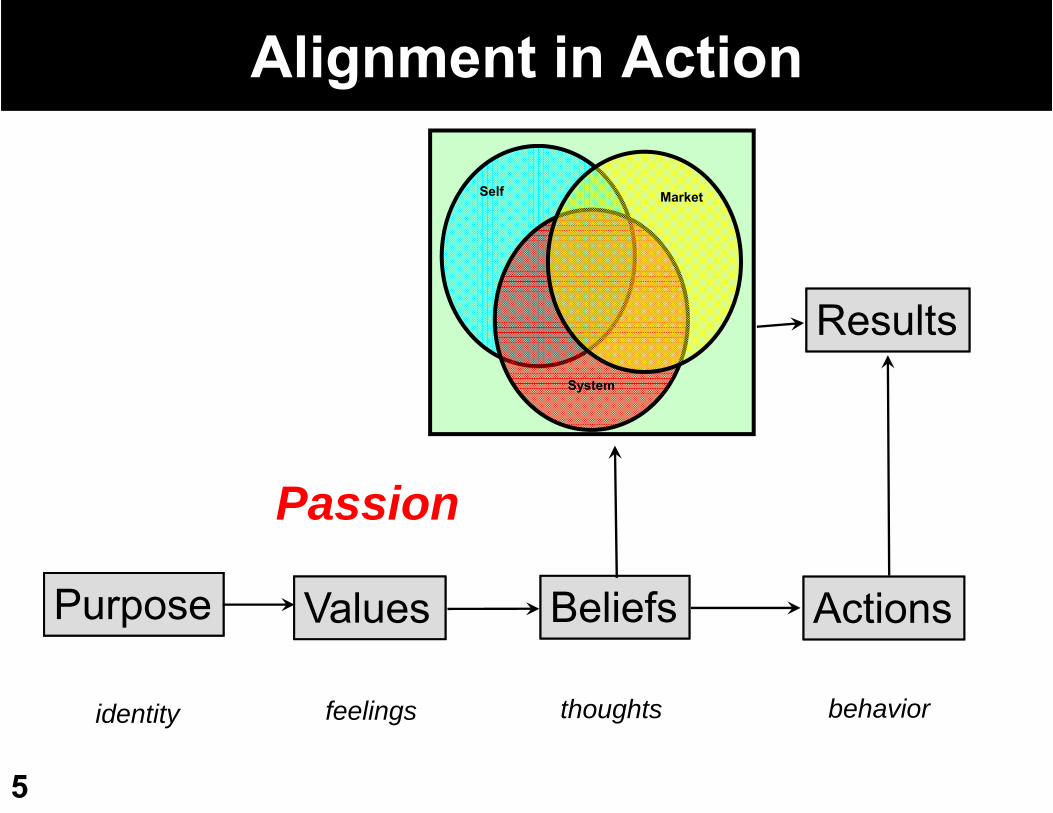
Alignment in Action
Self
System
Market
Results
Purpose Values Beliefs Actions
identity feelings thoughts behavior
Passion

6
Beliefs about Self: “quickwrite”•Identity
•Purpose
•Strengths & Weaknesses
•Goals & Objectives
•Strategy
7
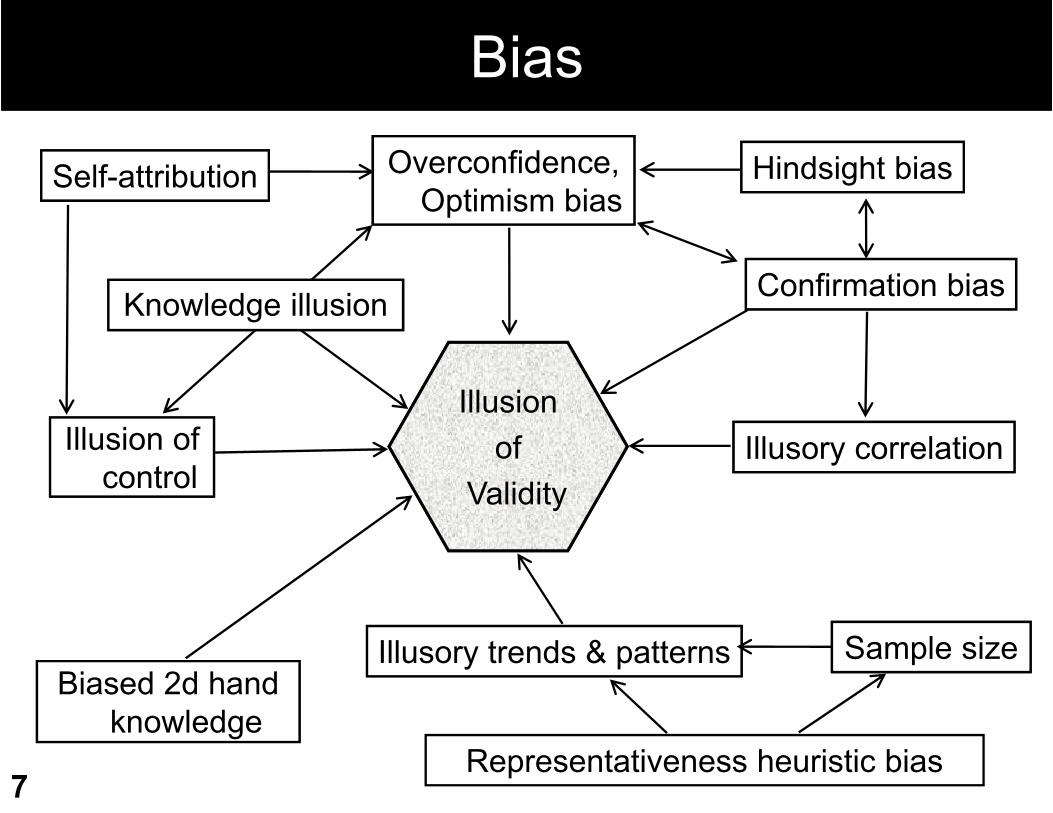
Bias
Self-attribution
Knowledge illusion
Illusion of control
Biased 2d hand knowledge
Hindsight bias
Confirmation bias
Illusory correlation
Overconfidence, Optimism bias
Illusory trends & patterns Sample size
Representativeness heuristic bias
Illusionof
Validity
8
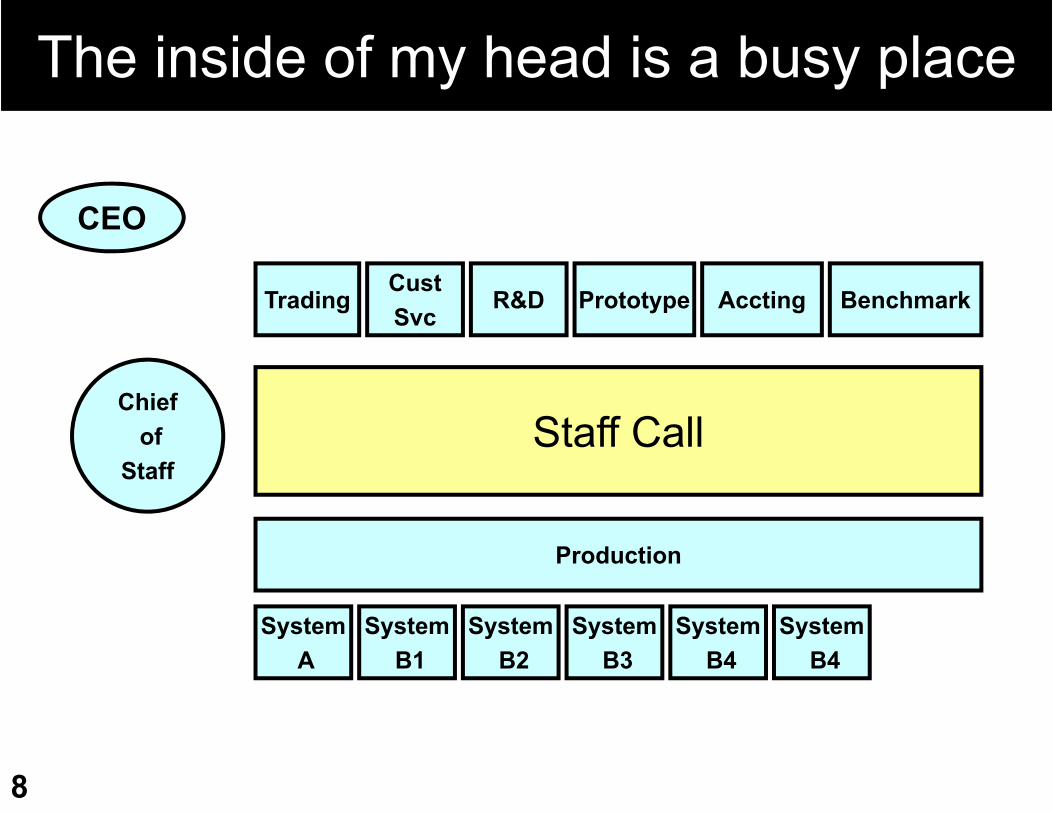
The inside of my head is a busy place
Chiefof
StaffStaff Call
SystemA
SystemB1
CEO
SystemB2
SystemB3
SystemB4
SystemB4
R&DCustSvc
Trading Prototype Accting Benchmark
Production
9
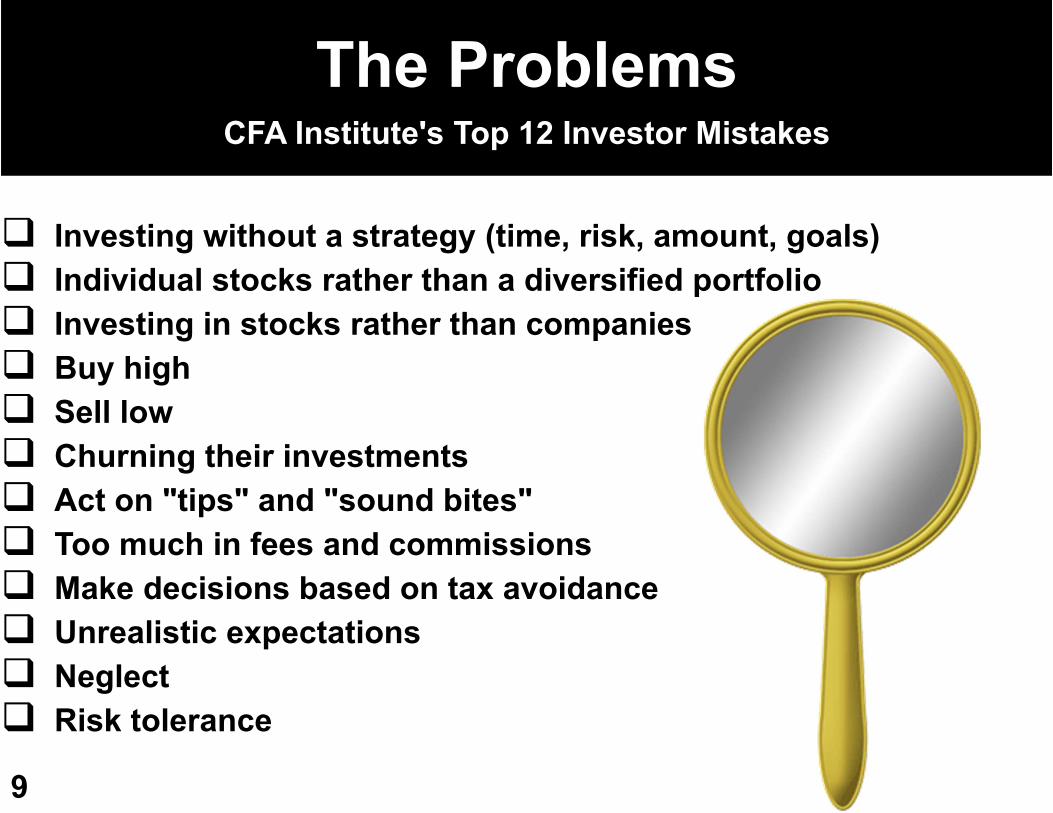
Investing without a strategy (time, risk, amount, goals) Individual stocks rather than a diversified portfolio Investing in stocks rather than companies Buy high Sell low Churning their investments Act on "tips" and "sound bites" Too much in fees and commissions Make decisions based on tax avoidance Unrealistic expectations Neglect Risk tolerance
The ProblemsCFA Institute's Top 12 Investor Mistakes

10
Systems Beliefs
11
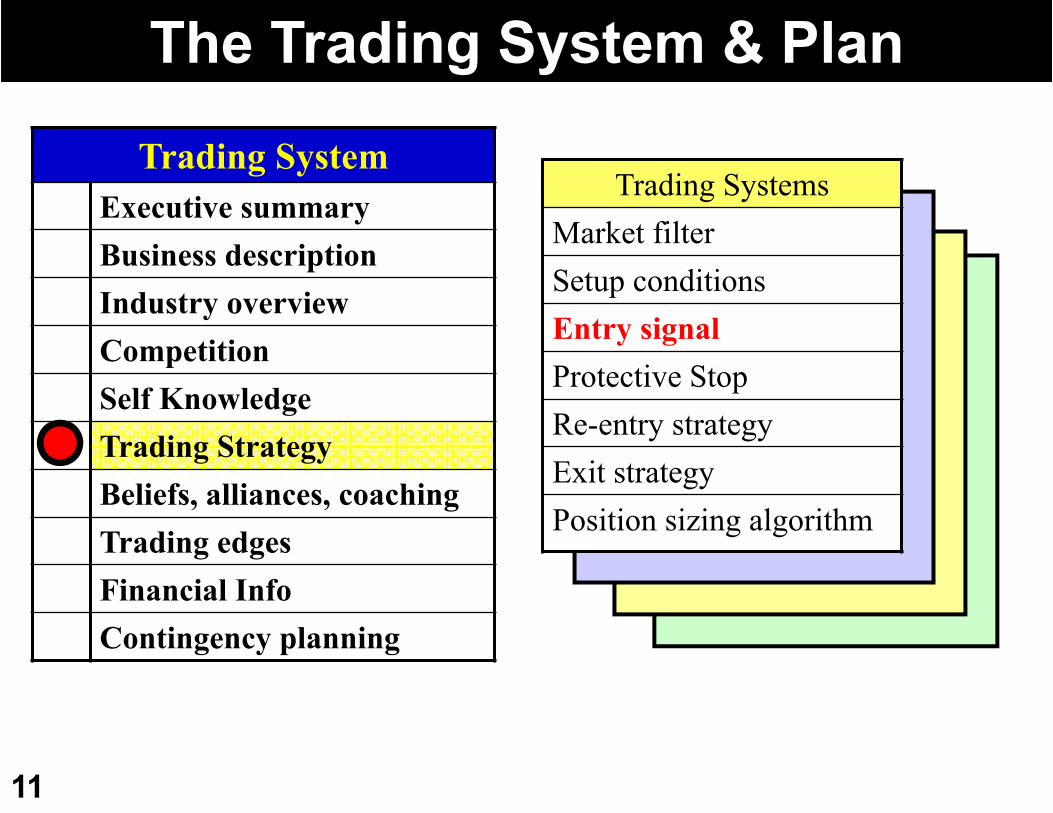
The Trading System & Plan
Trading SystemsMarket filterSetup conditionsEntry signalProtective StopRe-entry strategyExit strategyPosition sizing algorithm
Trading SystemExecutive summaryBusiness descriptionIndustry overviewCompetitionSelf KnowledgeTrading StrategyBeliefs, alliances, coachingTrading edgesFinancial InfoContingency planning
12
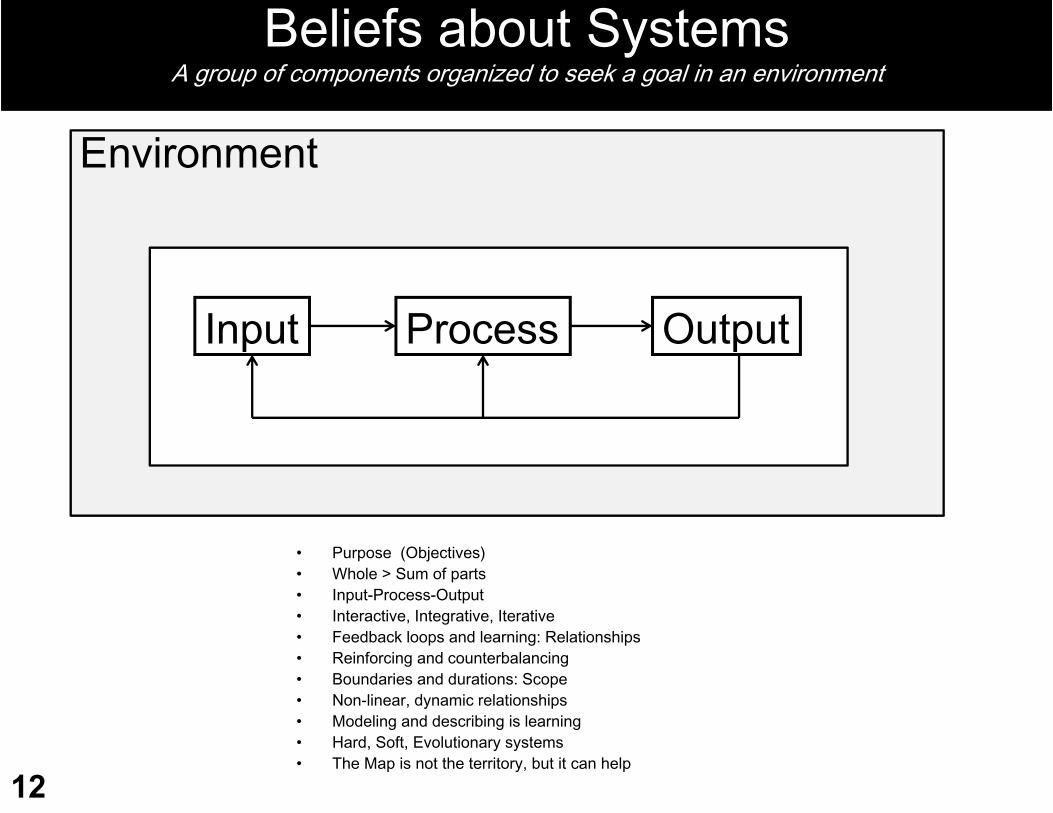
Beliefs about SystemsA group of components organized to seek a goal in an environment
• Purpose (Objectives)• Whole > Sum of parts• Input-Process-Output• Interactive, Integrative, Iterative• Feedback loops and learning: Relationships• Reinforcing and counterbalancing• Boundaries and durations: Scope• Non-linear, dynamic relationships• Modeling and describing is learning• Hard, Soft, Evolutionary systems• The Map is not the territory, but it can help
Input Process
Environment
Output
13
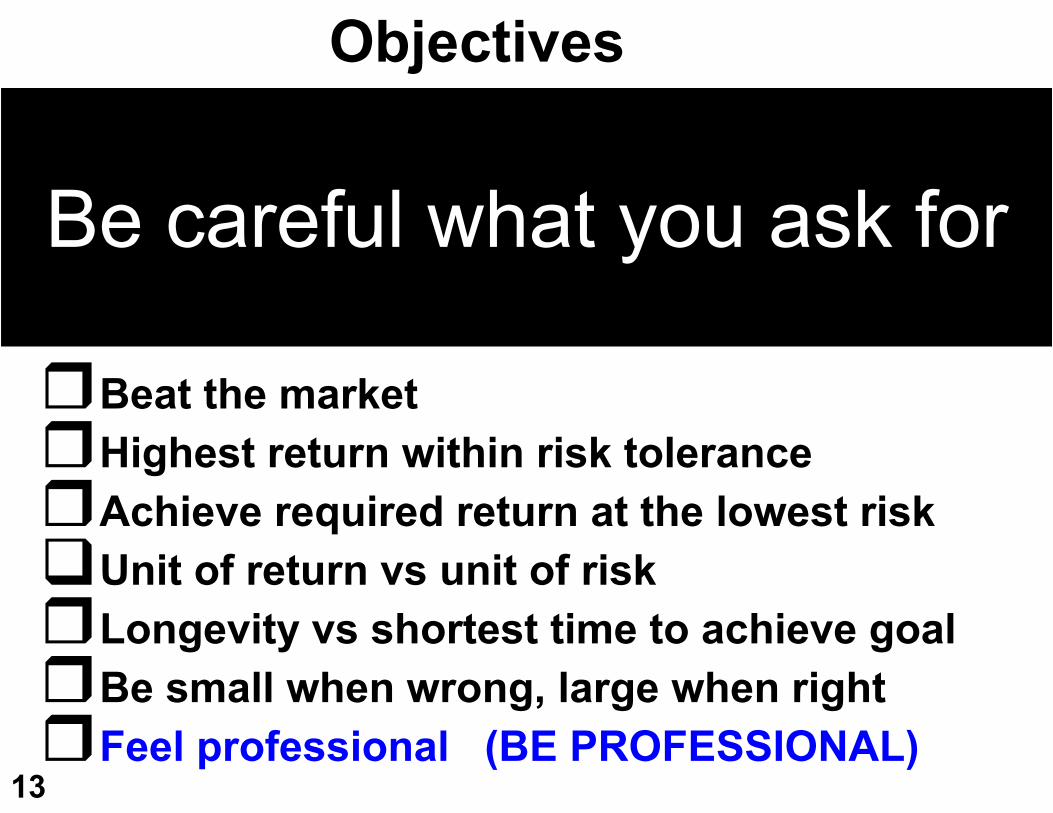
Beat the marketHighest return within risk toleranceAchieve required return at the lowest riskUnit of return vs unit of riskLongevity vs shortest time to achieve goalBe small when wrong, large when rightFeel professional (BE PROFESSIONAL)
Be careful what you ask for
Objectives
14
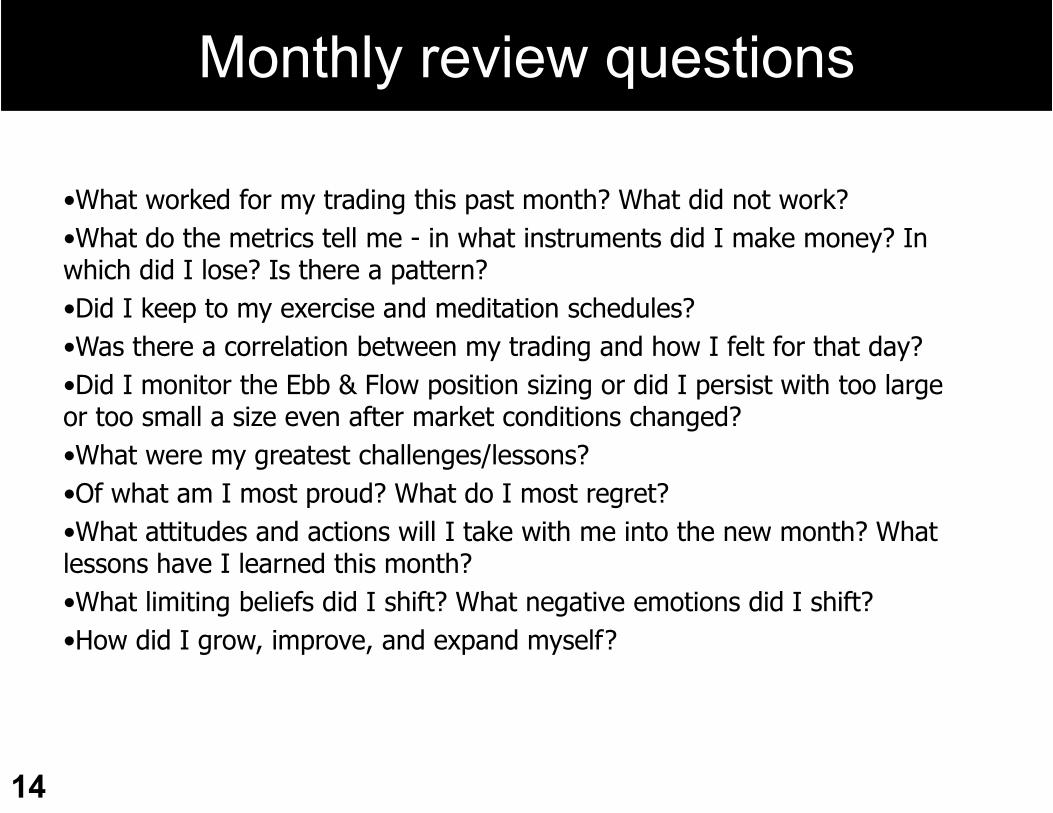
Monthly review questions
•What worked for my trading this past month? What did not work? •What do the metrics tell me - in what instruments did I make money? In which did I lose? Is there a pattern? •Did I keep to my exercise and meditation schedules? •Was there a correlation between my trading and how I felt for that day? •Did I monitor the Ebb & Flow position sizing or did I persist with too large or too small a size even after market conditions changed? •What were my greatest challenges/lessons? •Of what am I most proud? What do I most regret? •What attitudes and actions will I take with me into the new month? What lessons have I learned this month? •What limiting beliefs did I shift? What negative emotions did I shift? •How did I grow, improve, and expand myself?
15
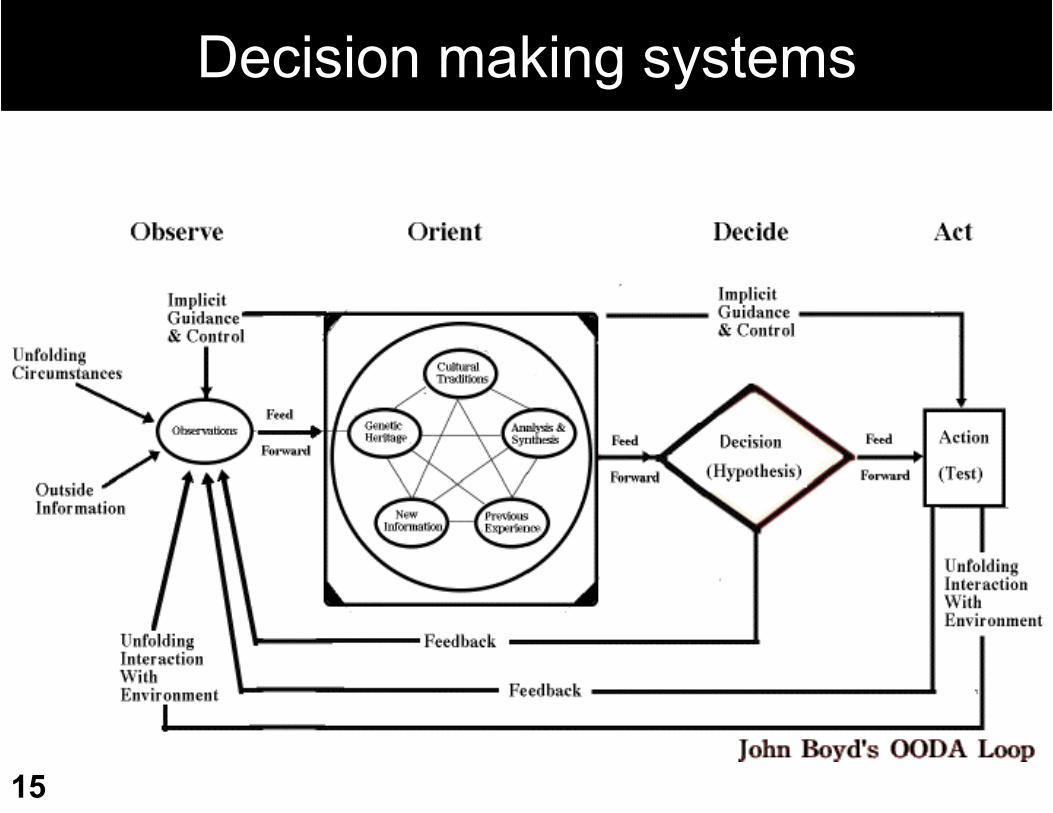
Decision making systems
16
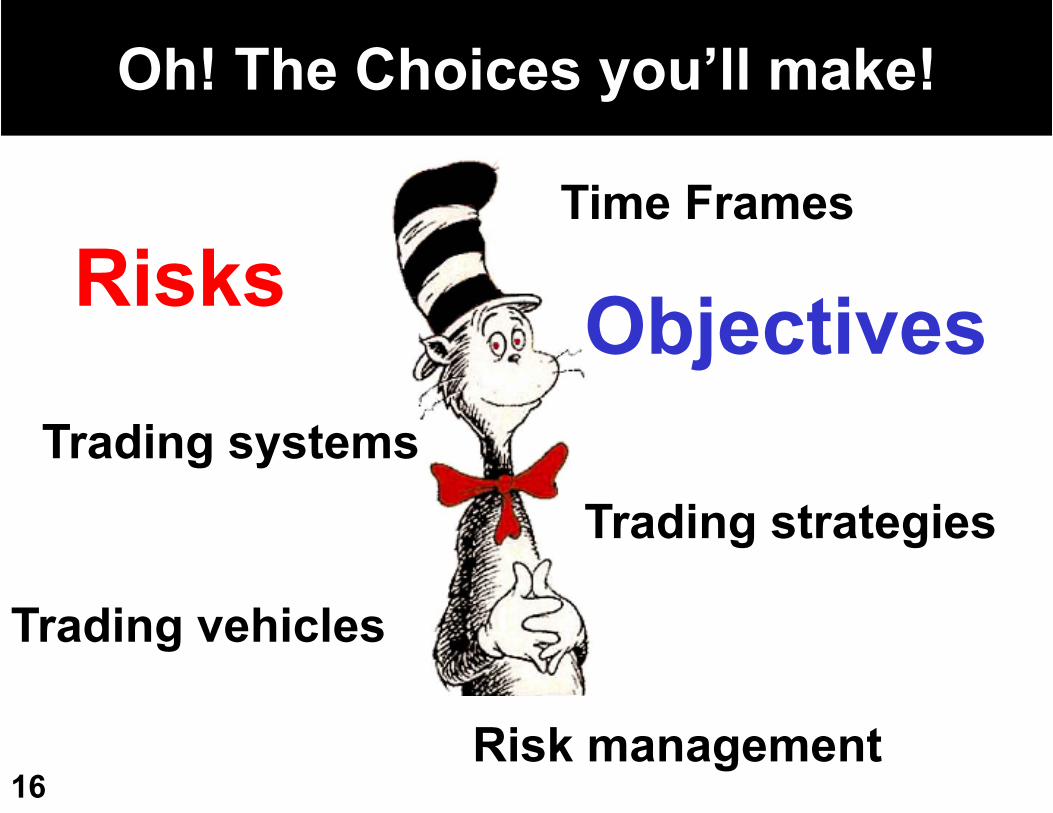
Oh! The Choices you’ll make!
Risks
Risk management
Trading vehicles
Trading systemsTrading strategies
Time Frames
Objectives

17
Market Beliefs
18
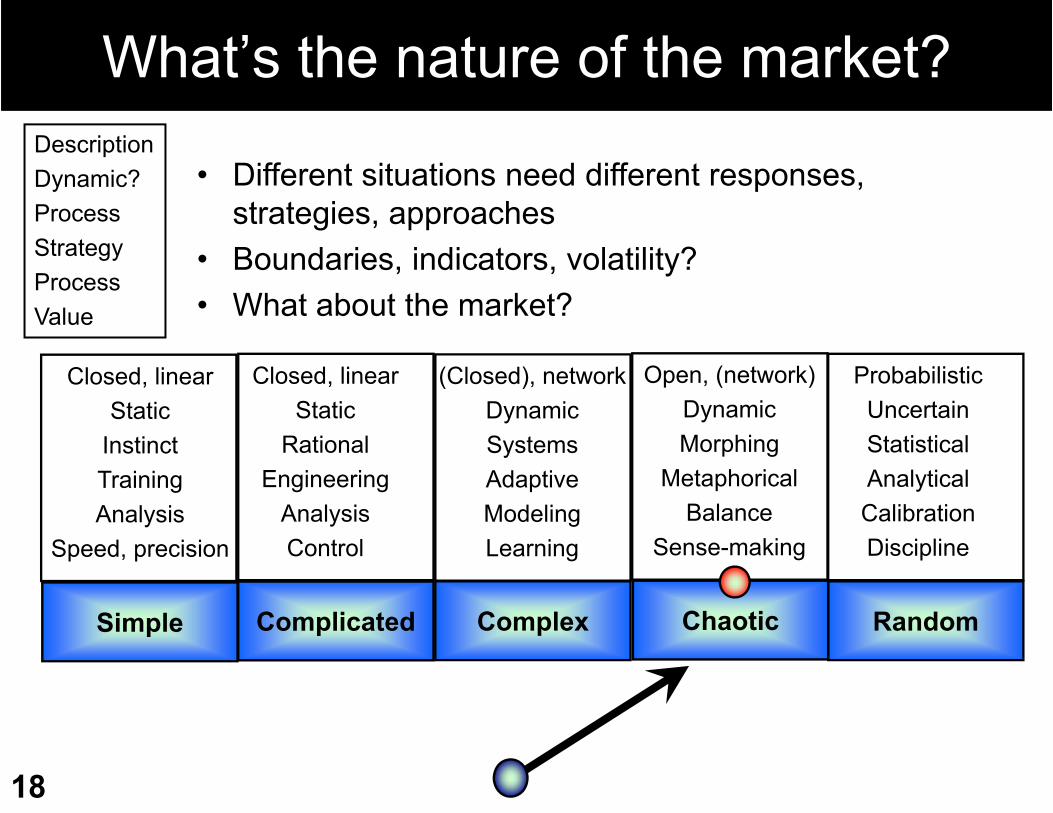
What’s the nature of the market?DescriptionDynamic?ProcessStrategyProcessValue
Simple RandomChaoticComplexComplicated
Closed, linearStatic
InstinctTrainingAnalysis
Speed, precision
Closed, linearStatic
RationalEngineering
AnalysisControl
(Closed), networkDynamicSystemsAdaptiveModelingLearning
Open, (network)DynamicMorphing
MetaphoricalBalance
Sense-making
ProbabilisticUncertainStatisticalAnalyticalCalibrationDiscipline
• Different situations need different responses, strategies, approaches
• Boundaries, indicators, volatility?• What about the market?
19
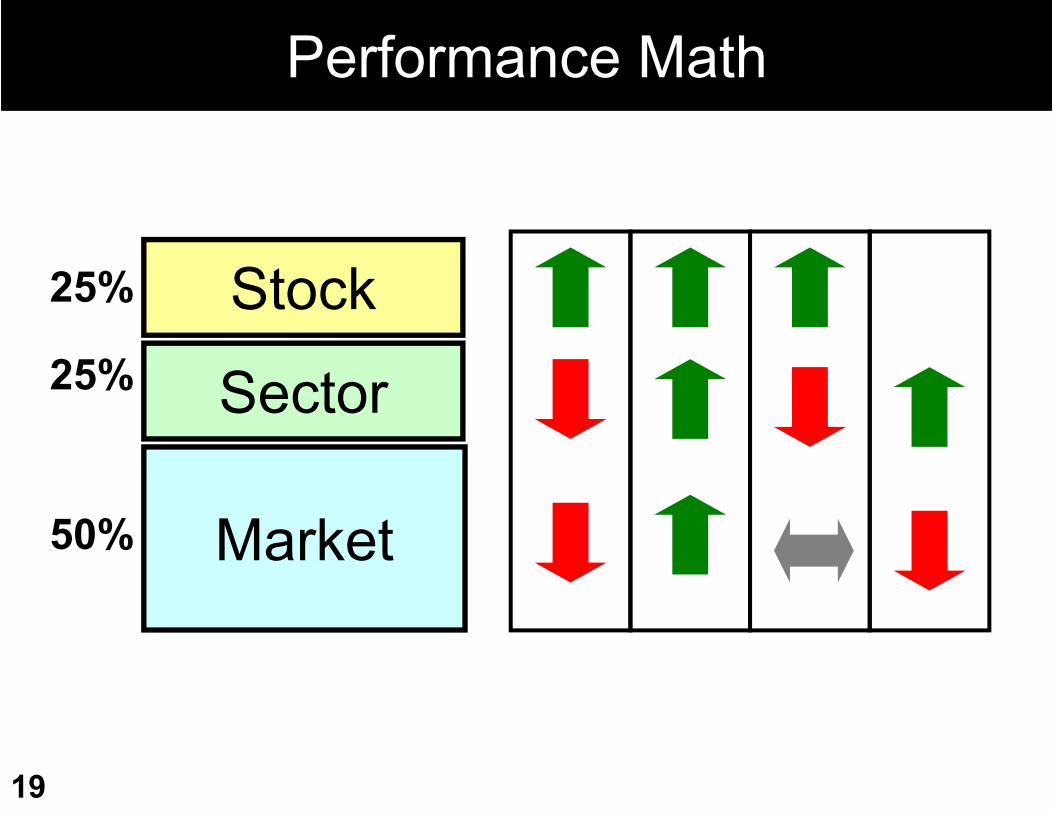
Performance Math
Market
Sector
Stock
50%
25%
25%
20
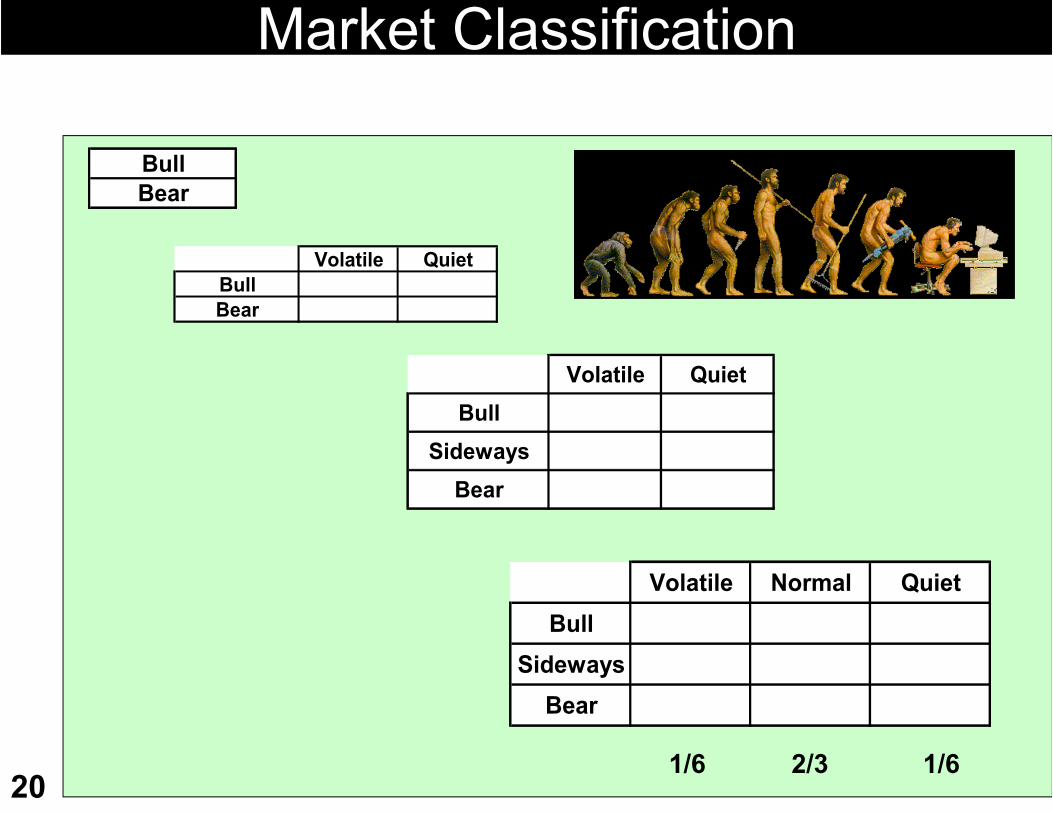
Market Classification
BullBearBullBear
Volatile QuietBullBear
Volatile QuietBullBear
Volatile QuietBull
SidewaysBear
Volatile QuietBull
SidewaysBear
Volatile Normal QuietBull
SidewaysBear
Volatile Normal QuietBull
SidewaysBear
2/3 1/61/6
21
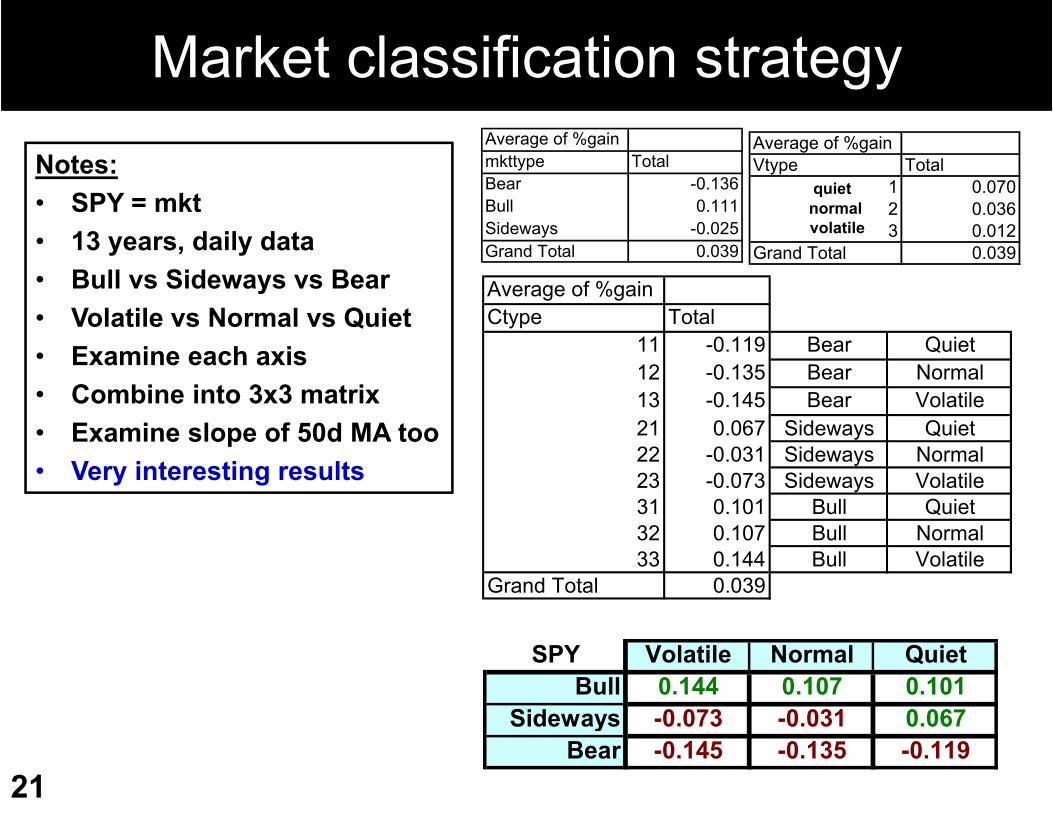
Market classification strategyAverage of %gainmkttype TotalBear -0.136Bull 0.111Sideways -0.025Grand Total 0.039
Average of %gainVtype Total
1 0.0702 0.0363 0.012
Grand Total 0.039
Average of %gainCtype Total
11 -0.119 Bear Quiet12 -0.135 Bear Normal13 -0.145 Bear Volatile21 0.067 Sideways Quiet22 -0.031 Sideways Normal23 -0.073 Sideways Volatile31 0.101 Bull Quiet32 0.107 Bull Normal33 0.144 Bull Volatile
Grand Total 0.039
SPY Volatile Normal QuietBull 0.144 0.107 0.101
Sideways -0.073 -0.031 0.067Bear -0.145 -0.135 -0.119
Notes:• SPY = mkt• 13 years, daily data• Bull vs Sideways vs Bear• Volatile vs Normal vs Quiet• Examine each axis• Combine into 3x3 matrix• Examine slope of 50d MA too• Very interesting results
quietnormalvolatile
22
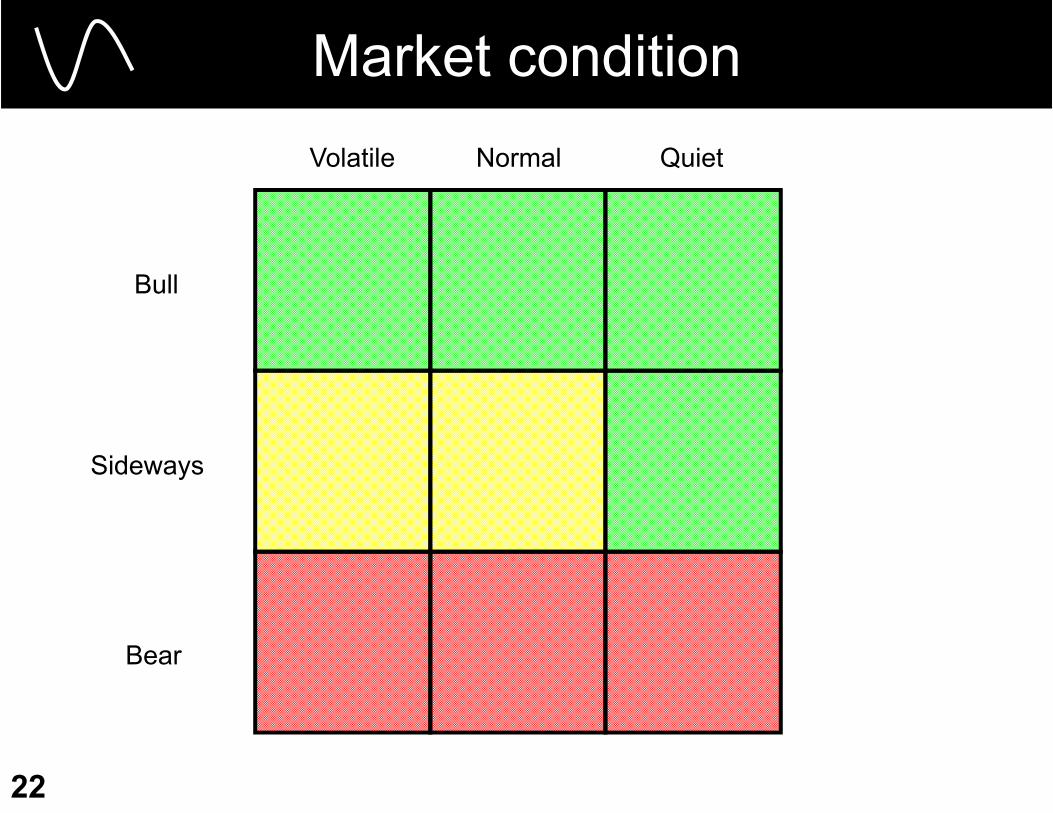
Market condition
Bull
Sideways
Bear
QuietNormalVolatile
23
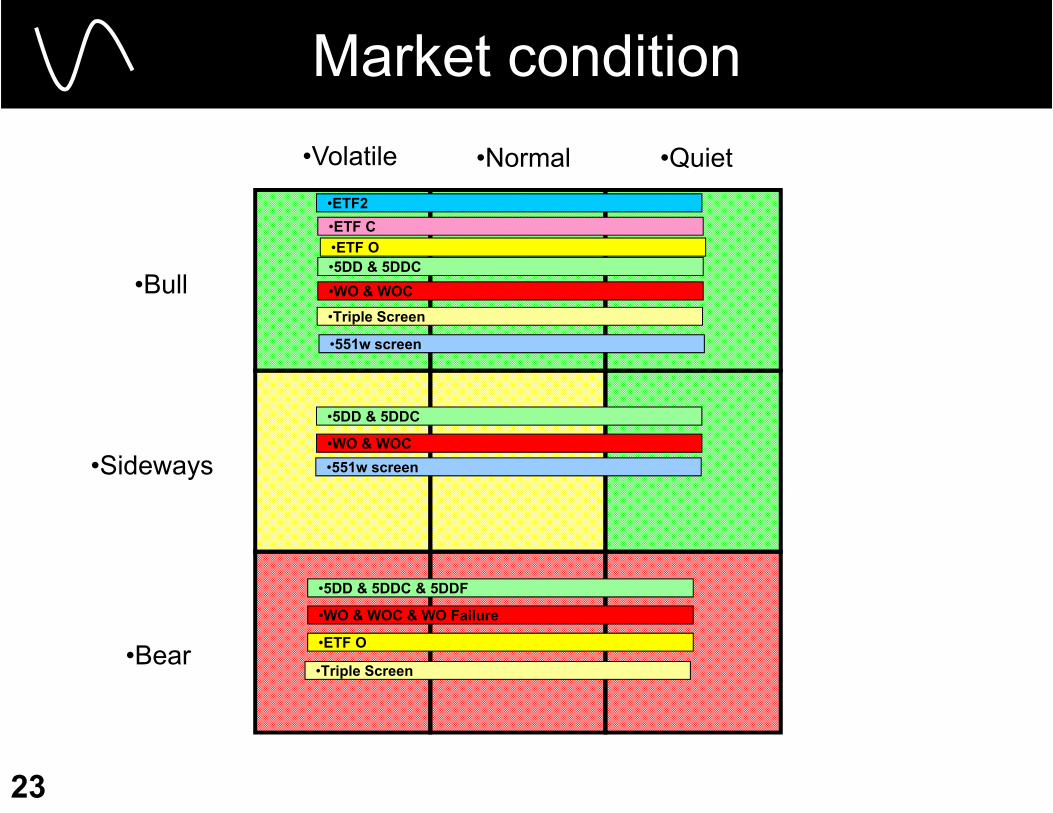
Market condition
•Bull
•Sideways
•Bear
•Quiet•Normal•Volatile
•5DD & 5DDC
•ETF2•ETF C
•WO & WOC
•ETF O
•5DD & 5DDC
•WO & WOC
•5DD & 5DDC & 5DDF
•WO & WOC & WO Failure
•ETF O
•Triple Screen
•Triple Screen
•551w screen
•551w screen

24
Mental Models
25
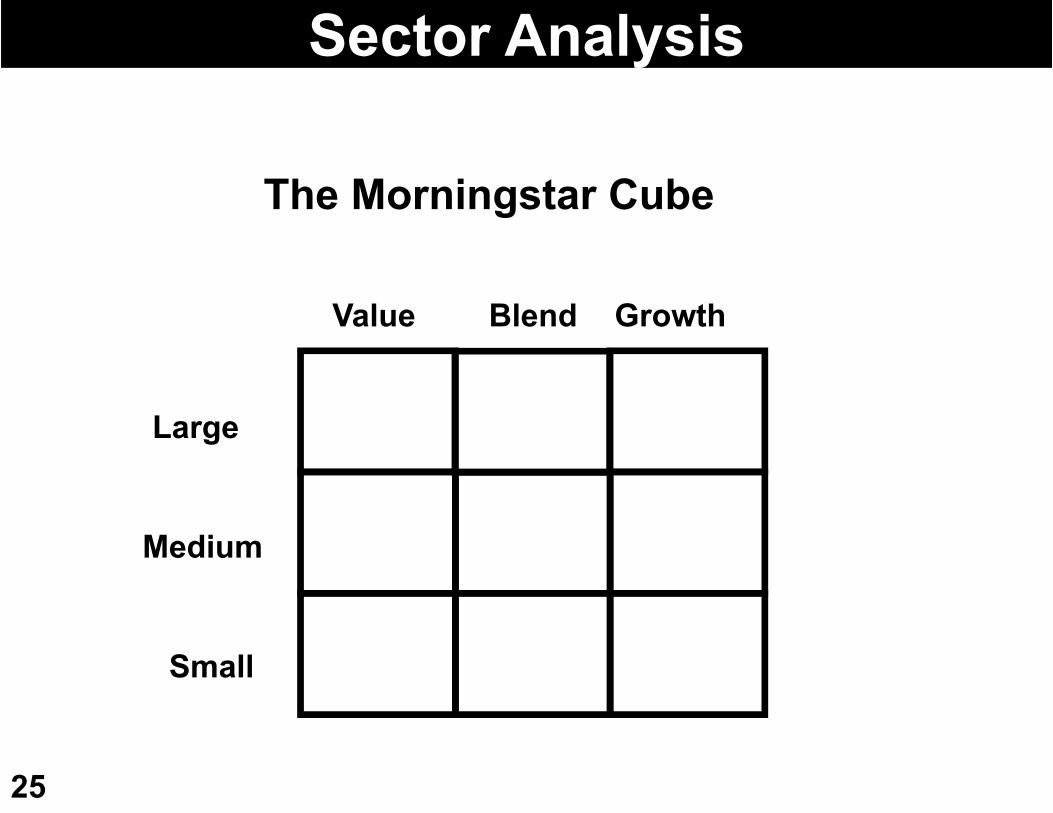
Sector Analysis
Large
Value Blend Growth
Medium
Small
The Morningstar Cube
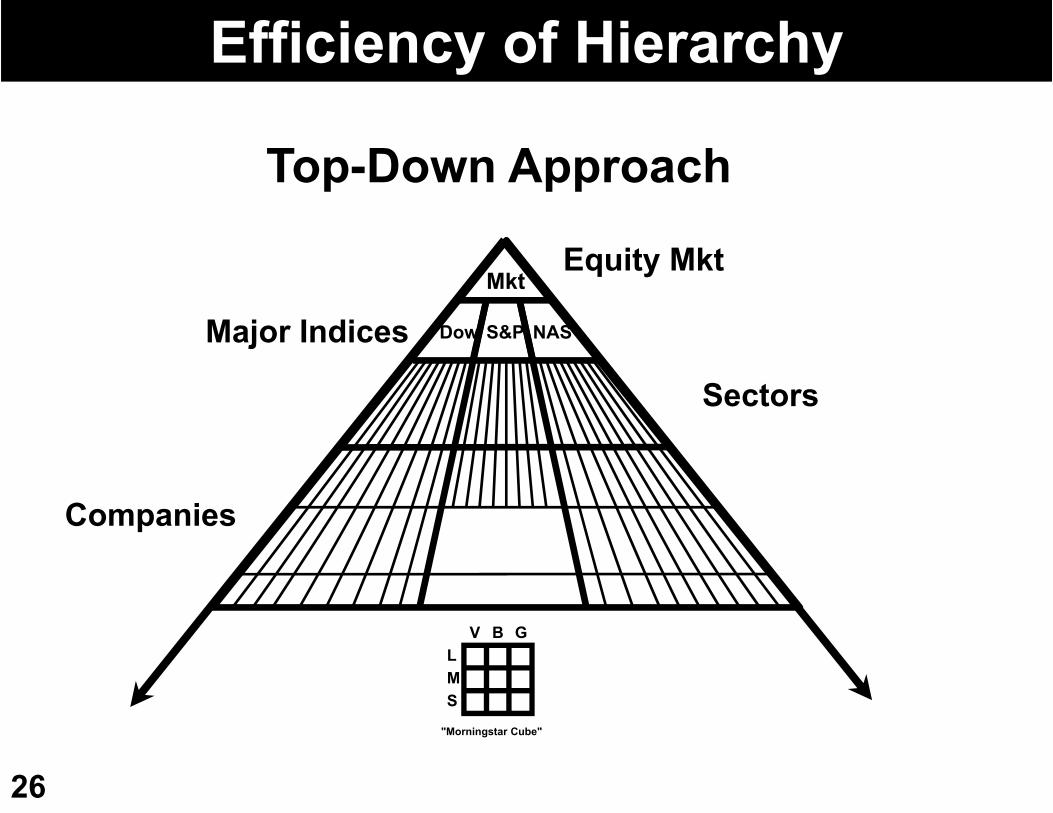
26
Efficiency of Hierarchy
Mkt
Dow NASS&P
Companies
Sectors
Major Indices
Equity Mkt
S
B G
M
VL
"Morningstar Cube"
Top-Down Approach
27
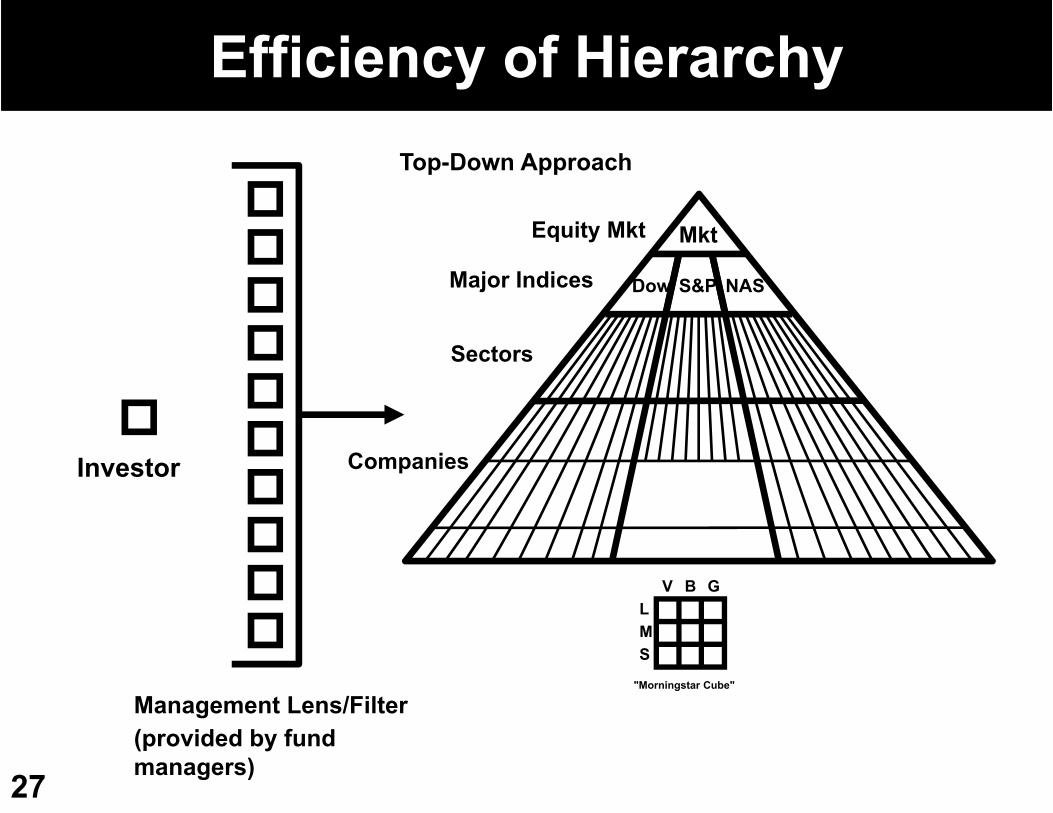
Mkt
Dow NASS&P
Companies
Sectors
Major Indices
Equity Mkt
S
B G
M
VL
"Morningstar Cube"
Investor
Management Lens/Filter(provided by fund managers)
Top-Down Approach
Efficiency of Hierarchy
28
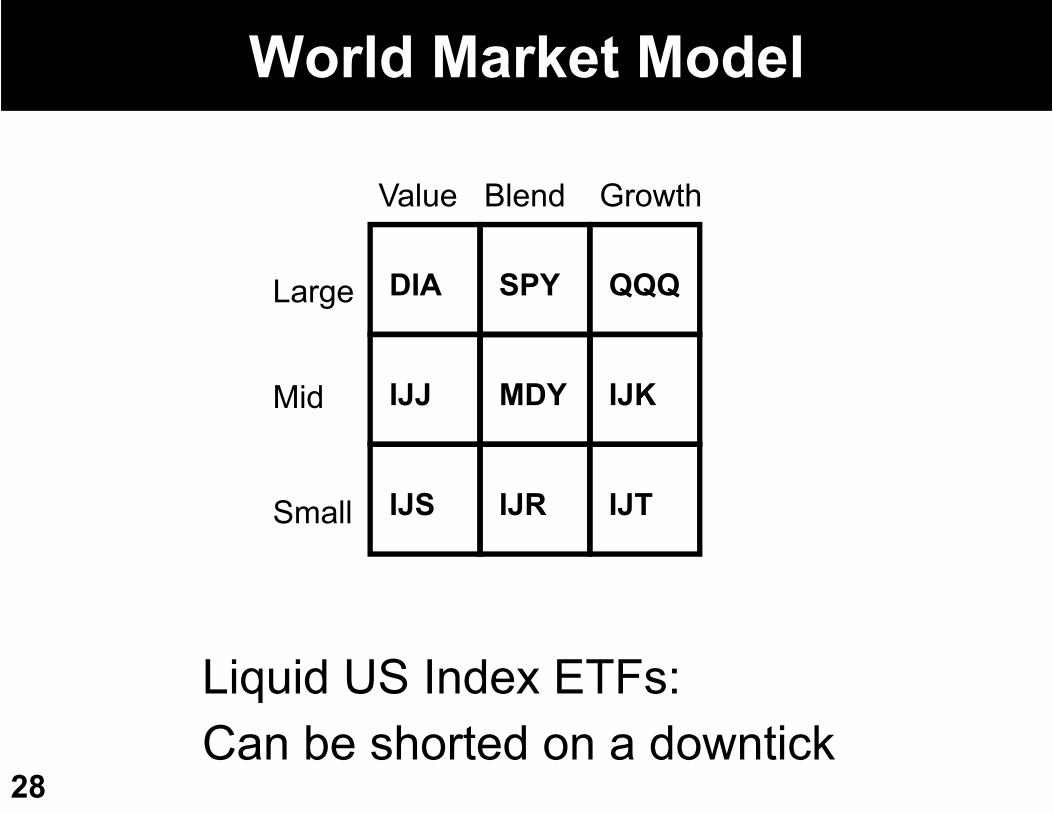
Liquid US Index ETFs: Can be shorted on a downtick
DIA SPY QQQ
IJJ MDY IJK
IJS IJR IJT
Value Blend Growth
Large
Mid
Small
World Market Model
29
30
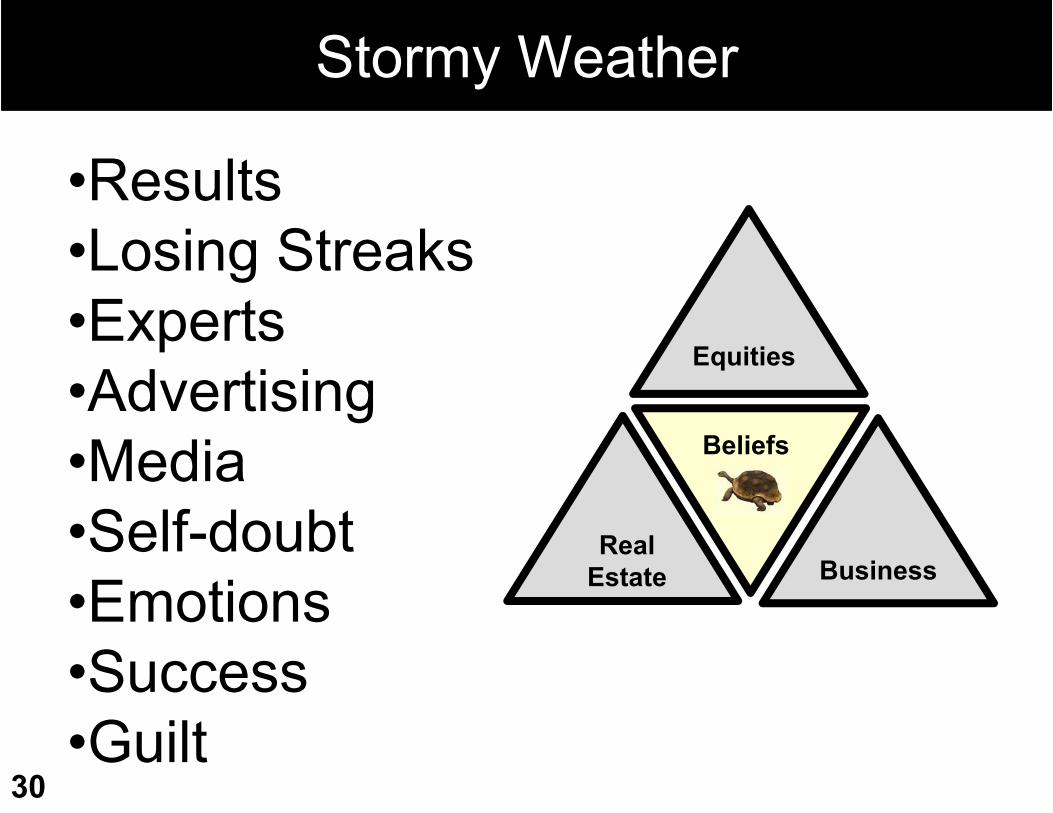
Equities
Beliefs
Real Estate Business
Stormy Weather
•Results•Losing Streaks•Experts•Advertising•Media•Self-doubt•Emotions•Success•Guilt

Statistics
31
32
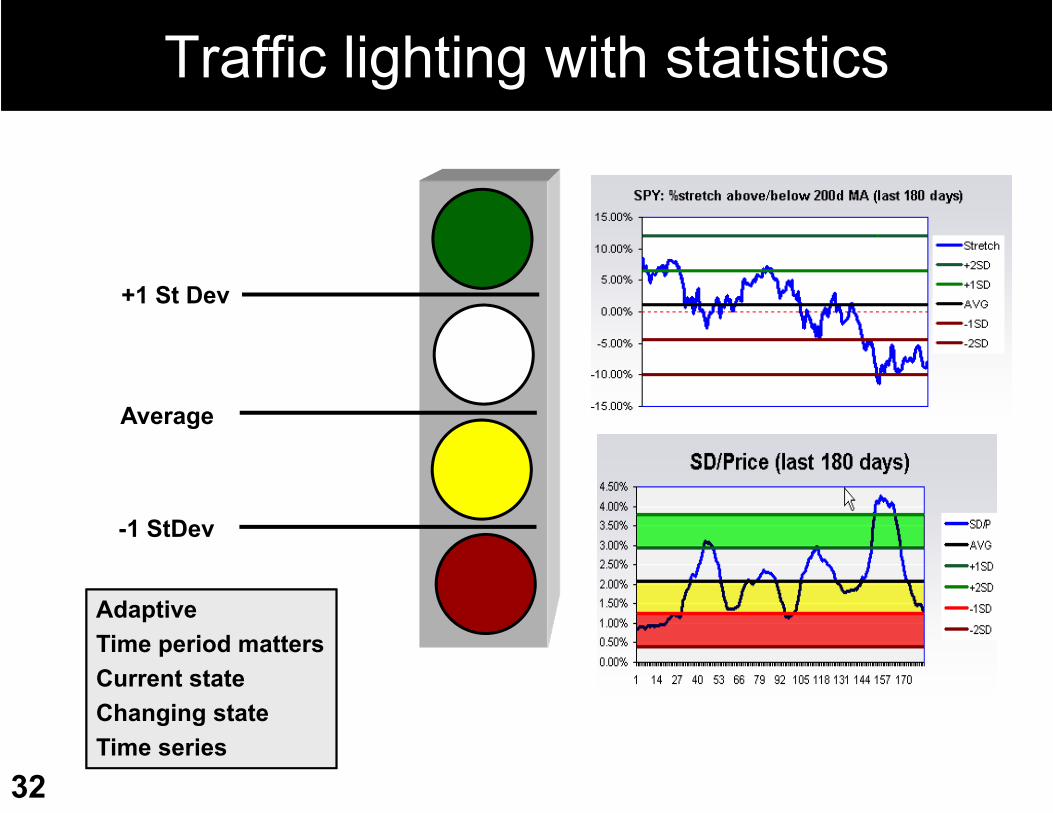
Traffic lighting with statistics
Average
+1 St Dev
-1 StDev
AdaptiveTime period mattersCurrent stateChanging stateTime series
33
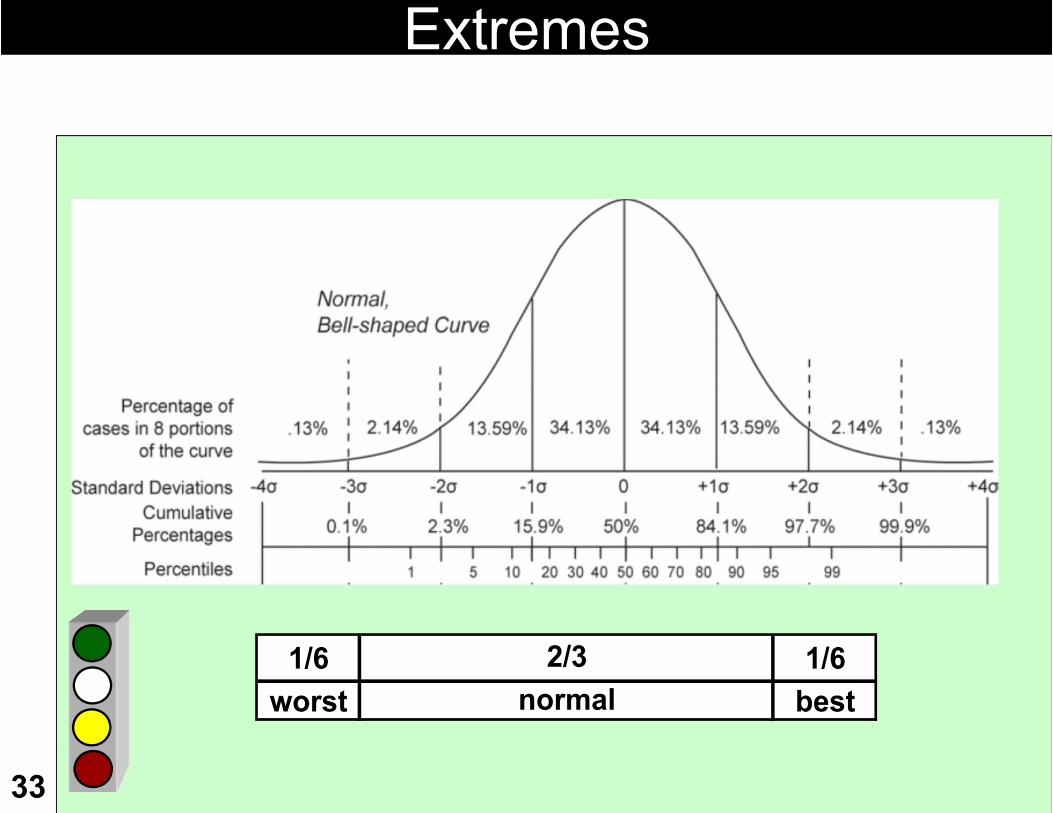
Extremes
1/6 1/6worst best
2/3normal

34
Getting on the bandwagon
InnovatorsEarly adoptersEarly mass adoptersLate mass adopters“Grumpy old men”
12
43
5 12
4
3
5
0%
100%
50%

Systems
35
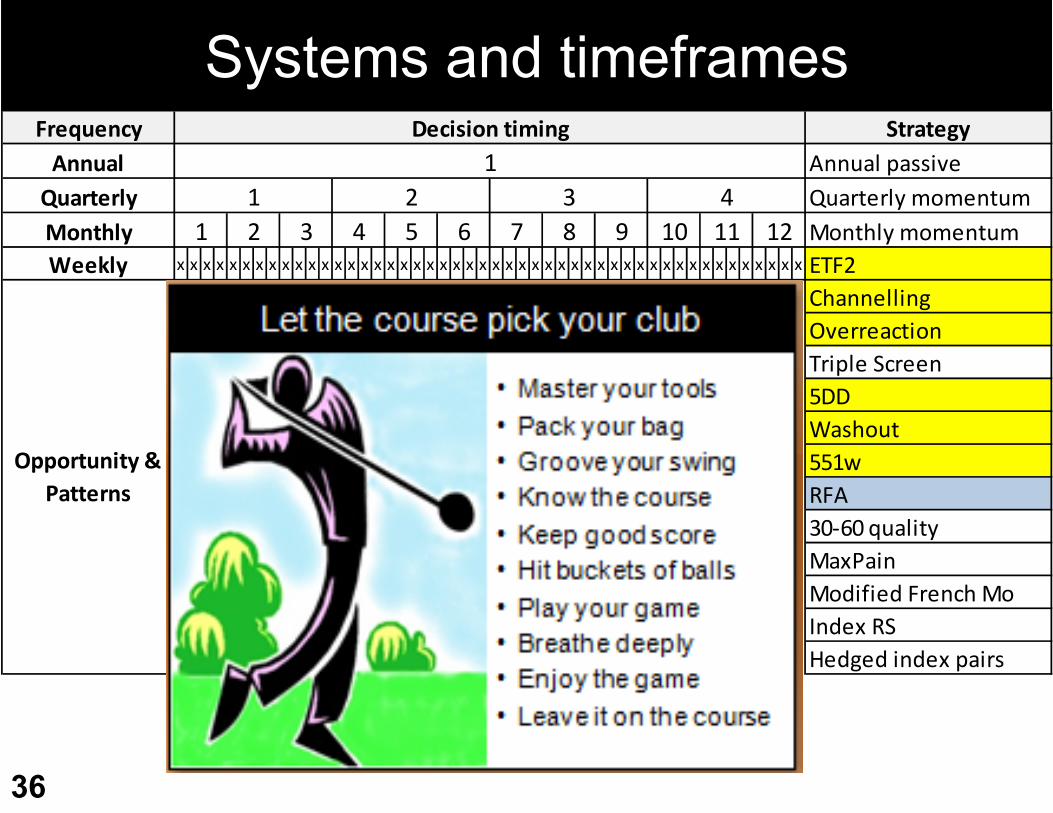
Systems and timeframes
36
Frequency StrategyAnnual Annual passiveQuarterly Quarterly momentumMonthly Monthly momentumWeekly x x x x x x x x x x x x x x x x x x x x x x x x x x x x x x x x x x x x x x x x x x x x x x x x ETF2
ChannellingOverreactionTriple Screen5DDWashout551wRFA30‐60 qualityMaxPainModified French MoIndex RSHedged index pairs
Opportunity & Patterns
121 2 3 4 5 6 7 8 9 10 11
1Decision timing
1 2 3 4
Example of Green & Yellow Zone
37
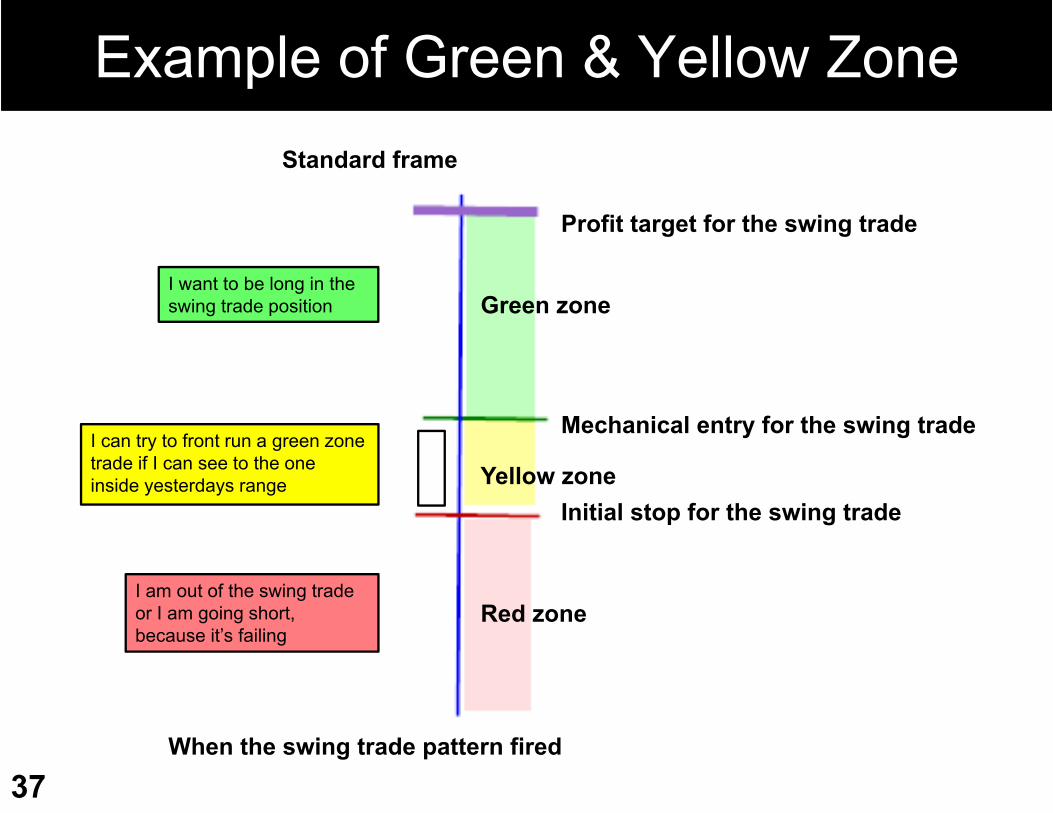
Mechanical entry for the swing trade
Profit target for the swing trade
Standard frame
Initial stop for the swing tradeYellow zone
Red zone
When the swing trade pattern fired
Green zoneI want to be long in the swing trade position
I can try to front run a green zone trade if I can see to the one inside yesterdays range
I am out of the swing trade or I am going short, because it’s failing
38
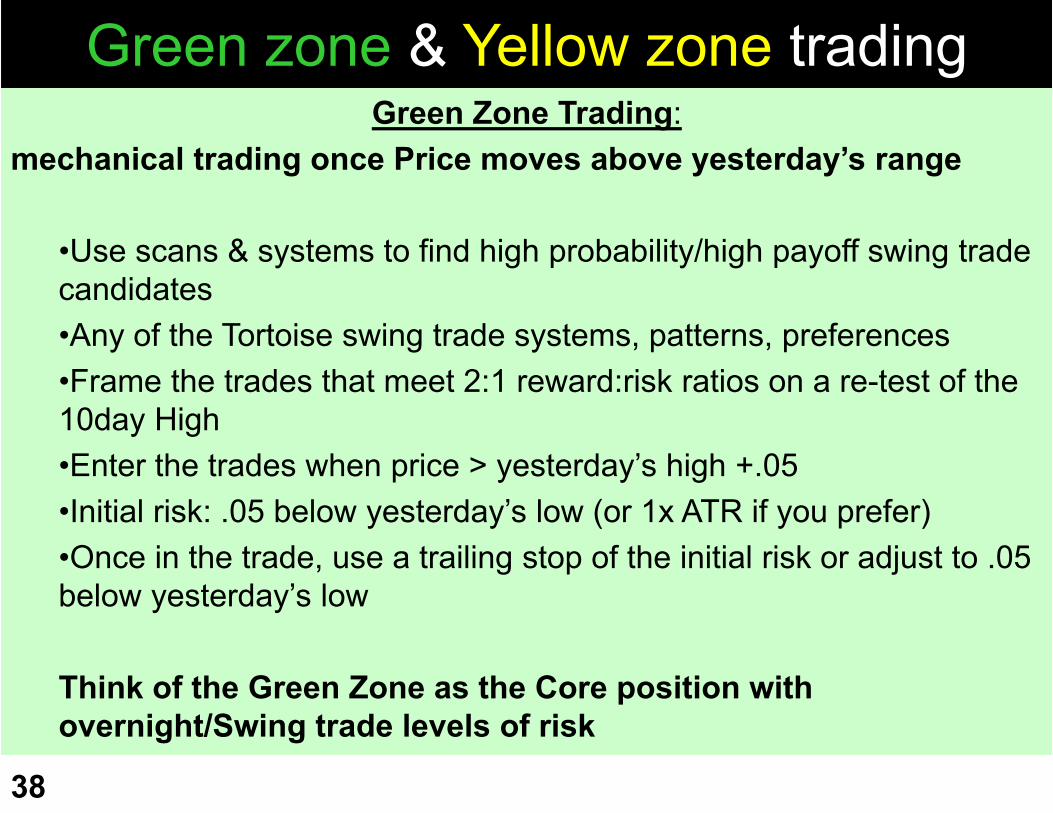
Green Zone Trading: mechanical trading once Price moves above yesterday’s range
•Use scans & systems to find high probability/high payoff swing trade candidates•Any of the Tortoise swing trade systems, patterns, preferences•Frame the trades that meet 2:1 reward:risk ratios on a re-test of the 10day High•Enter the trades when price > yesterday’s high +.05•Initial risk: .05 below yesterday’s low (or 1x ATR if you prefer)•Once in the trade, use a trailing stop of the initial risk or adjust to .05 below yesterday’s low
Think of the Green Zone as the Core position with overnight/Swing trade levels of risk
Green zone & Yellow zone trading
Green zone & Yellow zone trading
39
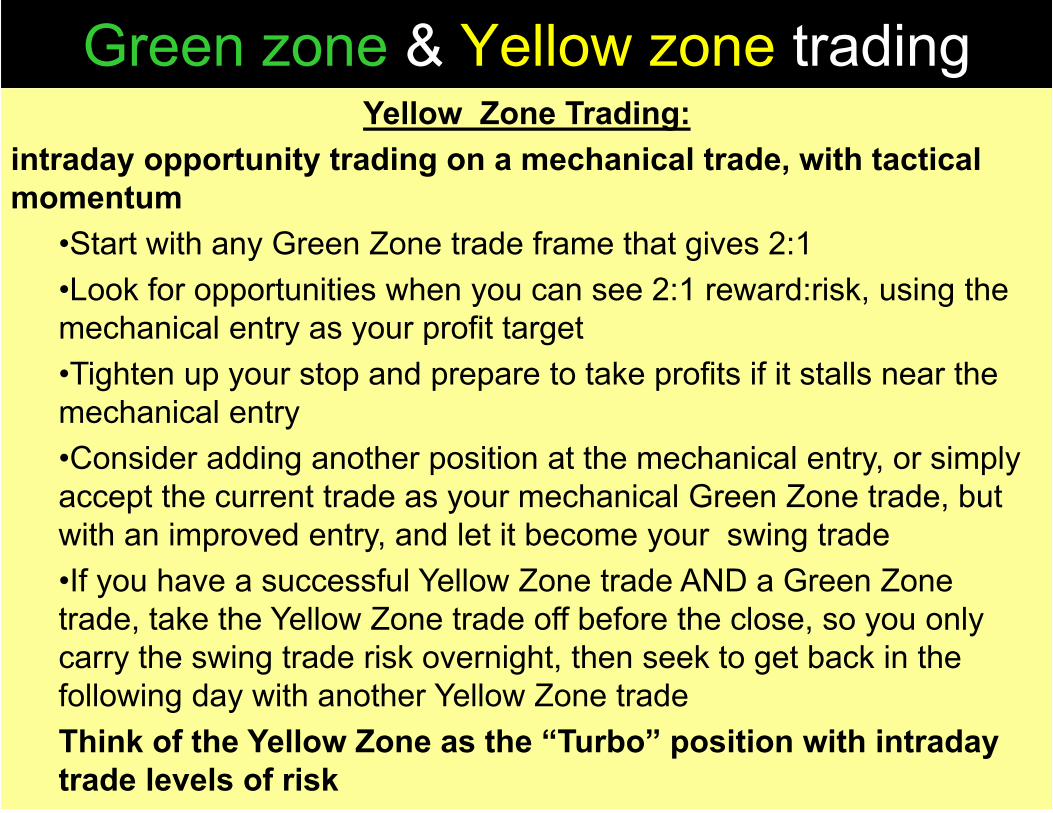
Yellow Zone Trading: intraday opportunity trading on a mechanical trade, with tactical momentum
•Start with any Green Zone trade frame that gives 2:1•Look for opportunities when you can see 2:1 reward:risk, using the mechanical entry as your profit target•Tighten up your stop and prepare to take profits if it stalls near the mechanical entry•Consider adding another position at the mechanical entry, or simply accept the current trade as your mechanical Green Zone trade, but with an improved entry, and let it become your swing trade•If you have a successful Yellow Zone trade AND a Green Zone trade, take the Yellow Zone trade off before the close, so you only carry the swing trade risk overnight, then seek to get back in the following day with another Yellow Zone tradeThink of the Yellow Zone as the “Turbo” position with intraday trade levels of risk
40
Green zone & Yellow zone trading
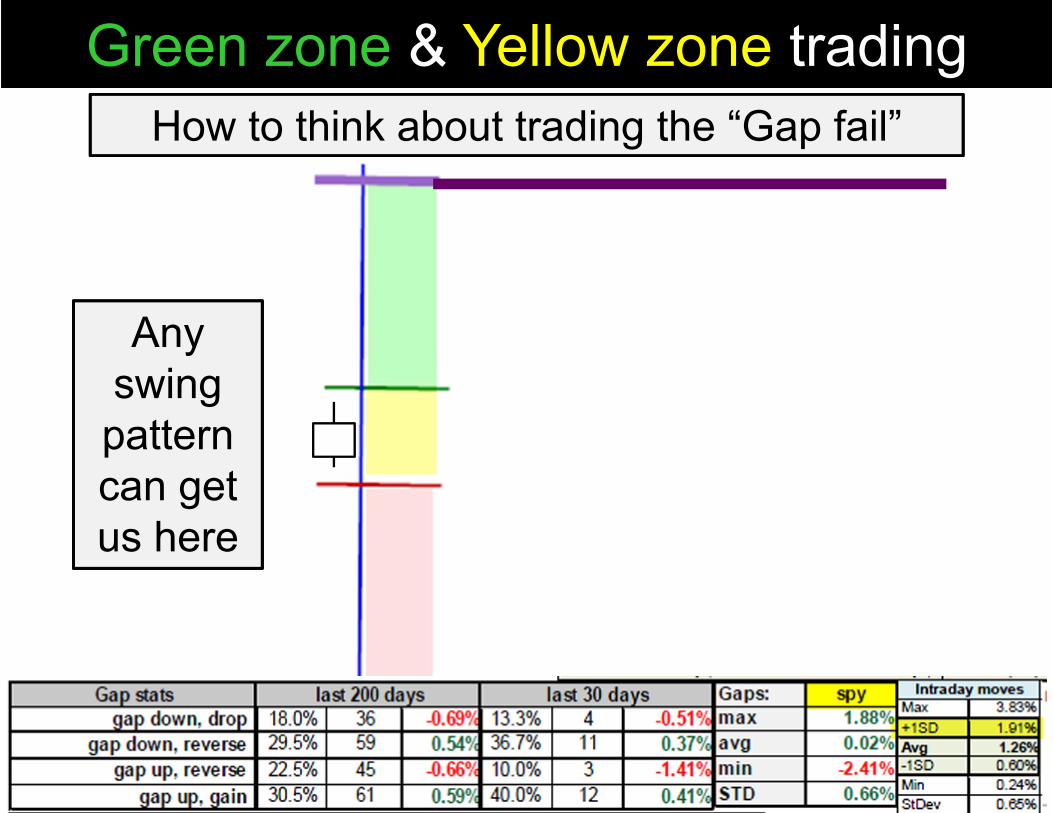
Any swing pattern can get us here
How to think about trading the “Gap fail”

Monthly Rebalancing
Exercise
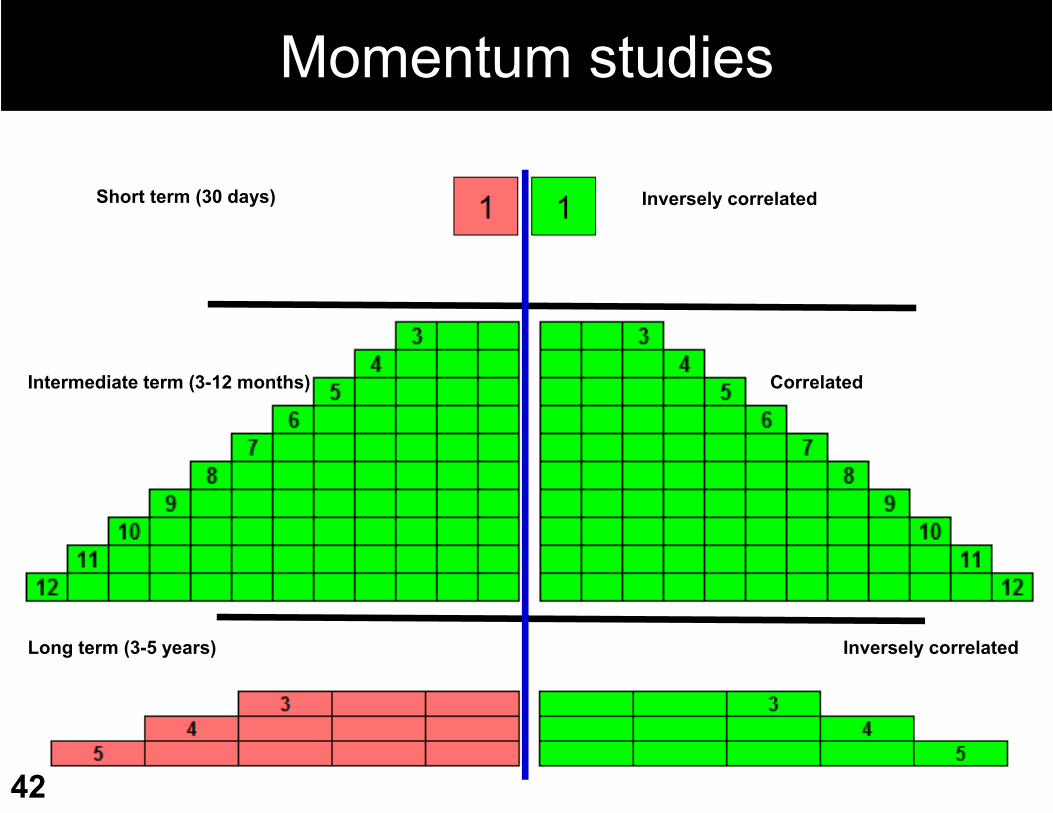
Momentum studies
42
Short term (30 days)
Intermediate term (3-12 months)
Long term (3-5 years)
Inversely correlated
Correlated
Inversely correlated
43
44
45
46
47
48
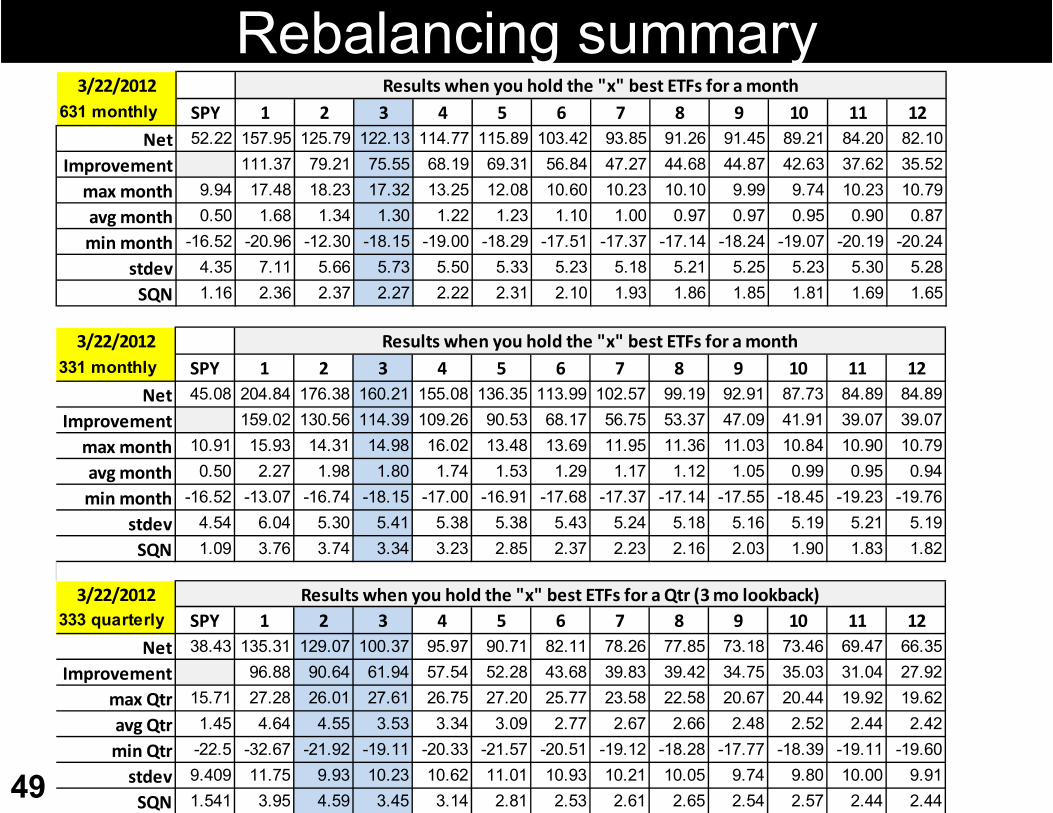
Rebalancing summary
49
3/22/2012631 monthly SPY 1 2 3 4 5 6 7 8 9 10 11 12
Net 52.22 157.95 125.79 122.13 114.77 115.89 103.42 93.85 91.26 91.45 89.21 84.20 82.10Improvement 111.37 79.21 75.55 68.19 69.31 56.84 47.27 44.68 44.87 42.63 37.62 35.52
max month 9.94 17.48 18.23 17.32 13.25 12.08 10.60 10.23 10.10 9.99 9.74 10.23 10.79avg month 0.50 1.68 1.34 1.30 1.22 1.23 1.10 1.00 0.97 0.97 0.95 0.90 0.87min month -16.52 -20.96 -12.30 -18.15 -19.00 -18.29 -17.51 -17.37 -17.14 -18.24 -19.07 -20.19 -20.24
stdev 4.35 7.11 5.66 5.73 5.50 5.33 5.23 5.18 5.21 5.25 5.23 5.30 5.28SQN 1.16 2.36 2.37 2.27 2.22 2.31 2.10 1.93 1.86 1.85 1.81 1.69 1.65
Results when you hold the "x" best ETFs for a month
3/22/2012331 monthly SPY 1 2 3 4 5 6 7 8 9 10 11 12
Net 45.08 204.84 176.38 160.21 155.08 136.35 113.99 102.57 99.19 92.91 87.73 84.89 84.89Improvement 159.02 130.56 114.39 109.26 90.53 68.17 56.75 53.37 47.09 41.91 39.07 39.07
max month 10.91 15.93 14.31 14.98 16.02 13.48 13.69 11.95 11.36 11.03 10.84 10.90 10.79avg month 0.50 2.27 1.98 1.80 1.74 1.53 1.29 1.17 1.12 1.05 0.99 0.95 0.94min month -16.52 -13.07 -16.74 -18.15 -17.00 -16.91 -17.68 -17.37 -17.14 -17.55 -18.45 -19.23 -19.76
stdev 4.54 6.04 5.30 5.41 5.38 5.38 5.43 5.24 5.18 5.16 5.19 5.21 5.19SQN 1.09 3.76 3.74 3.34 3.23 2.85 2.37 2.23 2.16 2.03 1.90 1.83 1.82
Results when you hold the "x" best ETFs for a month
3/22/2012333 quarterly SPY 1 2 3 4 5 6 7 8 9 10 11 12
Net 38.43 135.31 129.07 100.37 95.97 90.71 82.11 78.26 77.85 73.18 73.46 69.47 66.35Improvement 96.88 90.64 61.94 57.54 52.28 43.68 39.83 39.42 34.75 35.03 31.04 27.92
max Qtr 15.71 27.28 26.01 27.61 26.75 27.20 25.77 23.58 22.58 20.67 20.44 19.92 19.62avg Qtr 1.45 4.64 4.55 3.53 3.34 3.09 2.77 2.67 2.66 2.48 2.52 2.44 2.42min Qtr -22.5 -32.67 -21.92 -19.11 -20.33 -21.57 -20.51 -19.12 -18.28 -17.77 -18.39 -19.11 -19.60stdev 9.409 11.75 9.93 10.23 10.62 11.01 10.93 10.21 10.05 9.74 9.80 10.00 9.91SQN 1.541 3.95 4.59 3.45 3.14 2.81 2.53 2.61 2.65 2.54 2.57 2.44 2.44
Results when you hold the "x" best ETFs for a Qtr (3 mo lookback)
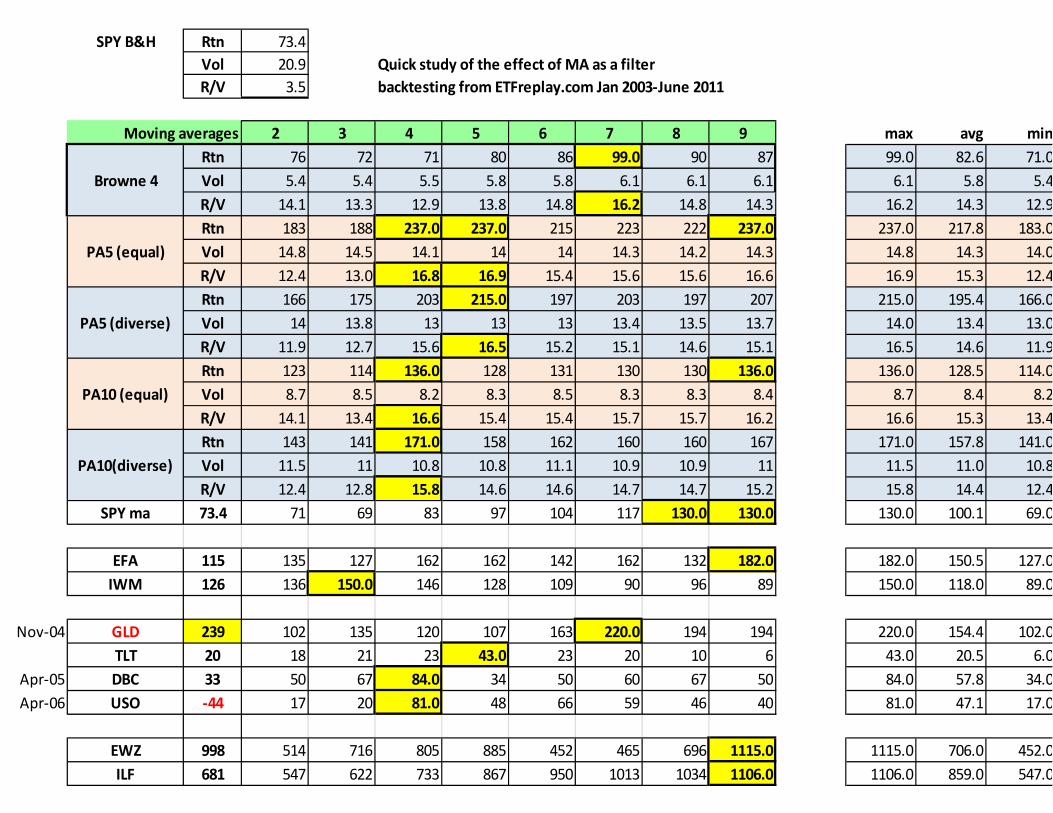
SPY B&H Rtn 73.4Vol 20.9 Quick study of the effect of MA as a filterR/V 3.5 backtesting from ETFreplay.com Jan 2003‐June 2011
2 3 4 5 6 7 8 9 max avg minRtn 76 72 71 80 86 99.0 90 87 99.0 82.6 71.0Vol 5.4 5.4 5.5 5.8 5.8 6.1 6.1 6.1 6.1 5.8 5.4R/V 14.1 13.3 12.9 13.8 14.8 16.2 14.8 14.3 16.2 14.3 12.9Rtn 183 188 237.0 237.0 215 223 222 237.0 237.0 217.8 183.0Vol 14.8 14.5 14.1 14 14 14.3 14.2 14.3 14.8 14.3 14.0R/V 12.4 13.0 16.8 16.9 15.4 15.6 15.6 16.6 16.9 15.3 12.4Rtn 166 175 203 215.0 197 203 197 207 215.0 195.4 166.0Vol 14 13.8 13 13 13 13.4 13.5 13.7 14.0 13.4 13.0R/V 11.9 12.7 15.6 16.5 15.2 15.1 14.6 15.1 16.5 14.6 11.9Rtn 123 114 136.0 128 131 130 130 136.0 136.0 128.5 114.0Vol 8.7 8.5 8.2 8.3 8.5 8.3 8.3 8.4 8.7 8.4 8.2R/V 14.1 13.4 16.6 15.4 15.4 15.7 15.7 16.2 16.6 15.3 13.4Rtn 143 141 171.0 158 162 160 160 167 171.0 157.8 141.0Vol 11.5 11 10.8 10.8 11.1 10.9 10.9 11 11.5 11.0 10.8R/V 12.4 12.8 15.8 14.6 14.6 14.7 14.7 15.2 15.8 14.4 12.4
SPY ma 73.4 71 69 83 97 104 117 130.0 130.0 130.0 100.1 69.0
EFA 115 135 127 162 162 142 162 132 182.0 182.0 150.5 127.0IWM 126 136 150.0 146 128 109 90 96 89 150.0 118.0 89.0
Nov‐04 GLD 239 102 135 120 107 163 220.0 194 194 220.0 154.4 102.0TLT 20 18 21 23 43.0 23 20 10 6 43.0 20.5 6.0
Apr‐05 DBC 33 50 67 84.0 34 50 60 67 50 84.0 57.8 34.0Apr‐06 USO ‐44 17 20 81.0 48 66 59 46 40 81.0 47.1 17.0
EWZ 998 514 716 805 885 452 465 696 1115.0 1115.0 706.0 452.0ILF 681 547 622 733 867 950 1013 1034 1106.0 1106.0 859.0 547.0
PA5 (diverse)
PA10 (equal)
PA10(diverse)
Moving averages
Browne 4
PA5 (equal)

Sample portfolio summaries
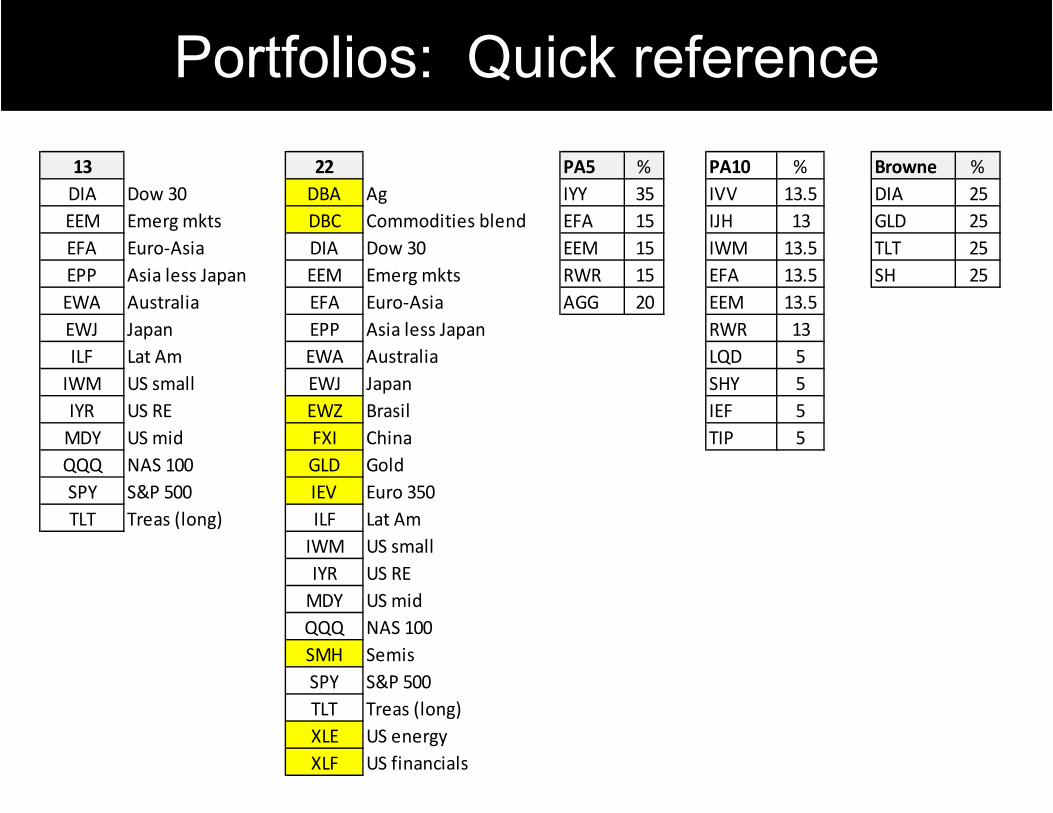
Portfolios: Quick reference
52
13 22 PA5 % PA10 % Browne %DIA Dow 30 DBA Ag IYY 35 IVV 13.5 DIA 25EEM Emerg mkts DBC Commodities blend EFA 15 IJH 13 GLD 25EFA Euro‐Asia DIA Dow 30 EEM 15 IWM 13.5 TLT 25EPP Asia less Japan EEM Emerg mkts RWR 15 EFA 13.5 SH 25EWA Australia EFA Euro‐Asia AGG 20 EEM 13.5EWJ Japan EPP Asia less Japan RWR 13ILF Lat Am EWA Australia LQD 5IWM US small EWJ Japan SHY 5IYR US RE EWZ Brasil IEF 5MDY US mid FXI China TIP 5QQQ NAS 100 GLD GoldSPY S&P 500 IEV Euro 350TLT Treas (long) ILF Lat Am
IWM US smallIYR US REMDY US midQQQ NAS 100SMH SemisSPY S&P 500TLT Treas (long)XLE US energyXLF US financials

ETF 2
53

“I got 3% return,is that any good?”
55
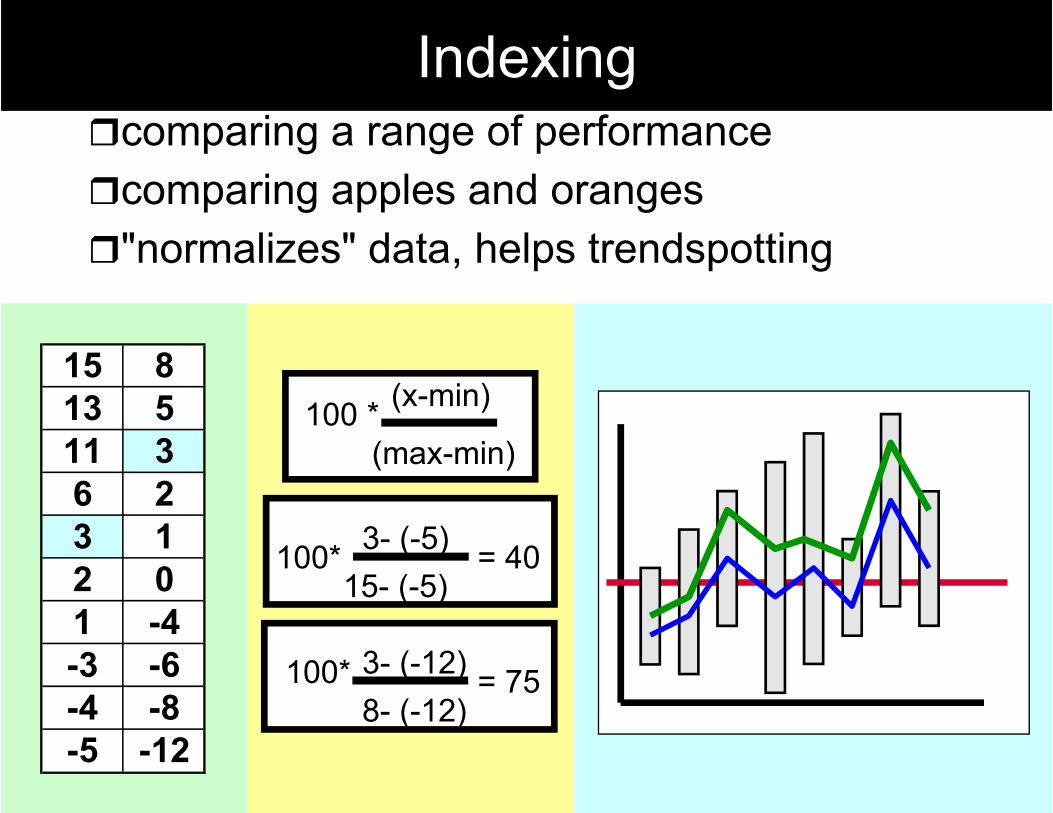
comparing a range of performancecomparing apples and oranges"normalizes" data, helps trendspotting
(x-min)
(max-min)100 *
3- (-5)15- (-5)
= 40100*
3- (-12)8- (-12)
= 75100*
Indexing
15 813 511 36 23 12 01 -4-3 -6-4 -8-5 -12
56
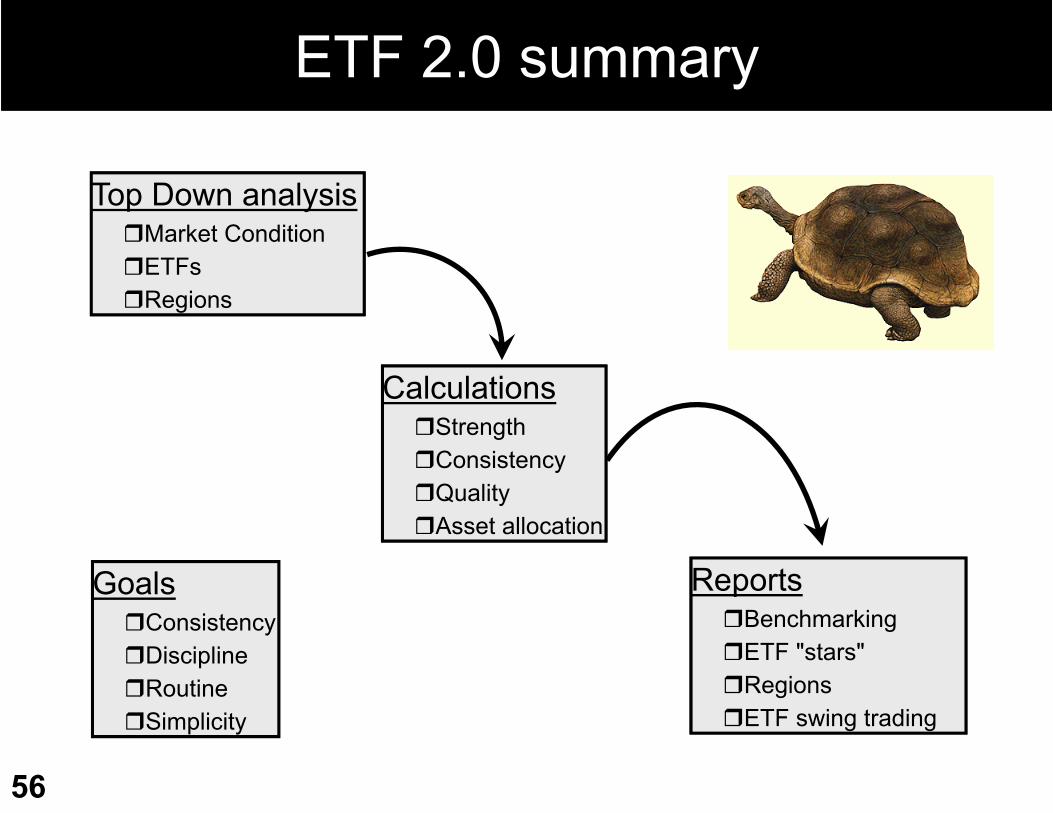
Top Down analysisMarket ConditionETFsRegions
CalculationsStrengthConsistencyQualityAsset allocation
ReportsBenchmarkingETF "stars"RegionsETF swing trading
GoalsConsistencyDisciplineRoutineSimplicity
ETF 2.0 summary
57
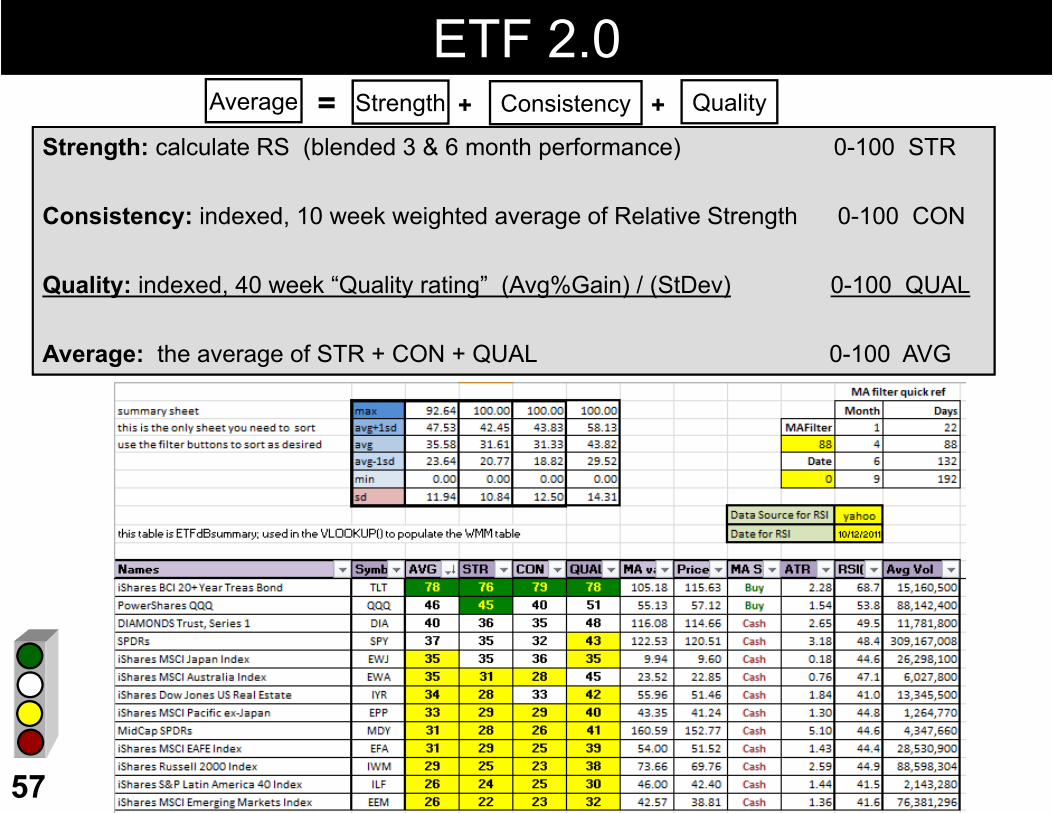
ETF 2.0StrengthAverage QualityConsistency ++=
Strength: calculate RS (blended 3 & 6 month performance) 0-100 STR
Consistency: indexed, 10 week weighted average of Relative Strength 0-100 CON
Quality: indexed, 40 week “Quality rating” (Avg%Gain) / (StDev) 0-100 QUAL
Average: the average of STR + CON + QUAL 0-100 AVG
58
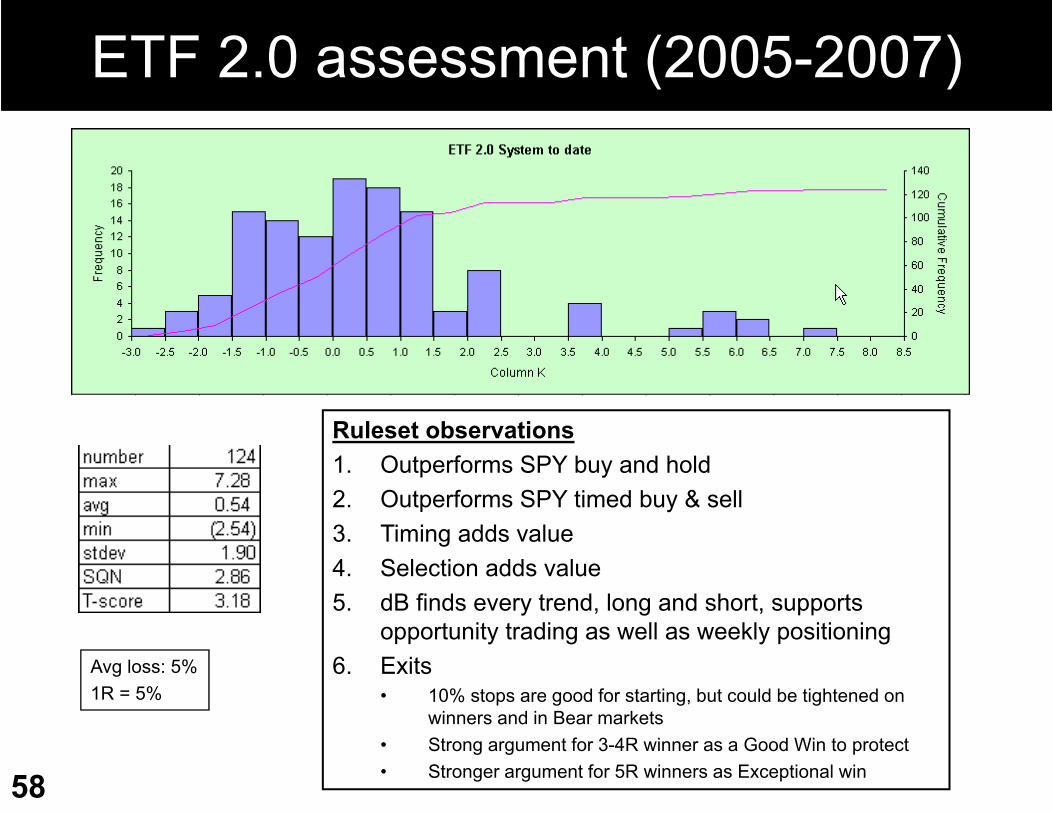
ETF 2.0 assessment (2005-2007)
Ruleset observations1. Outperforms SPY buy and hold2. Outperforms SPY timed buy & sell3. Timing adds value4. Selection adds value5. dB finds every trend, long and short, supports
opportunity trading as well as weekly positioning6. Exits
• 10% stops are good for starting, but could be tightened on winners and in Bear markets
• Strong argument for 3-4R winner as a Good Win to protect• Stronger argument for 5R winners as Exceptional win
Avg loss: 5%1R = 5%
59
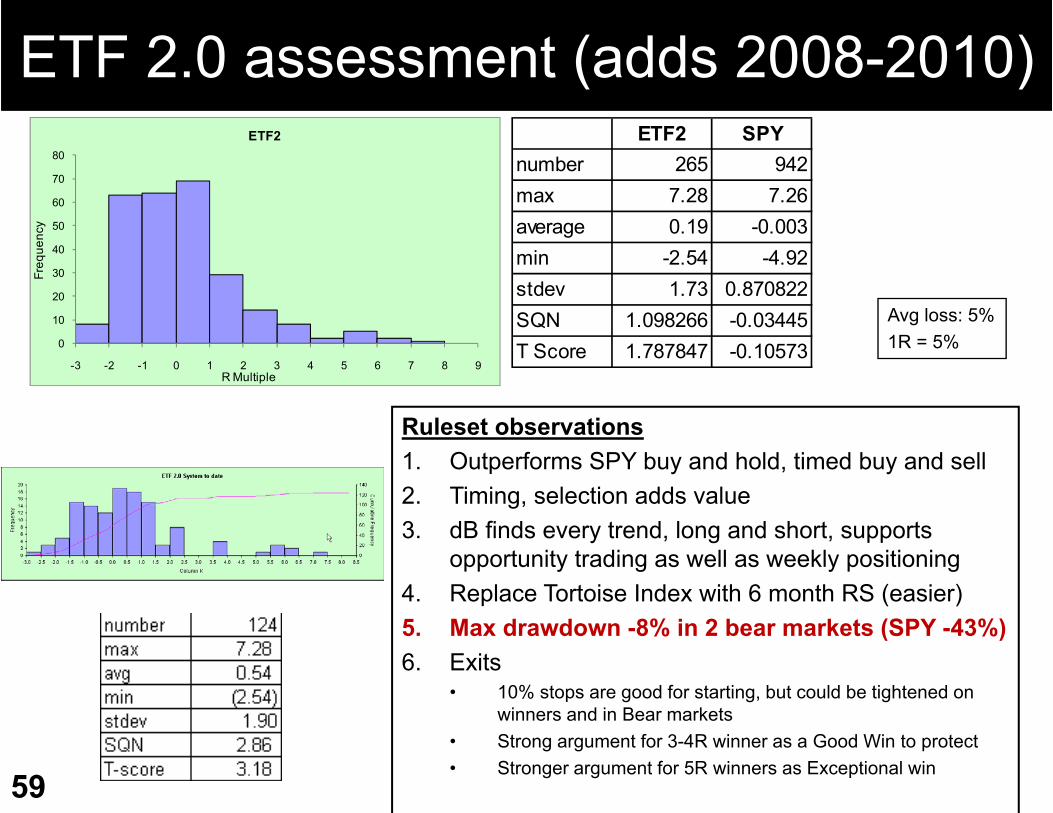
ETF 2.0 assessment (adds 2008-2010)
Ruleset observations1. Outperforms SPY buy and hold, timed buy and sell2. Timing, selection adds value3. dB finds every trend, long and short, supports
opportunity trading as well as weekly positioning4. Replace Tortoise Index with 6 month RS (easier)5. Max drawdown -8% in 2 bear markets (SPY -43%)6. Exits
• 10% stops are good for starting, but could be tightened on winners and in Bear markets
• Strong argument for 3-4R winner as a Good Win to protect• Stronger argument for 5R winners as Exceptional win
Avg loss: 5%1R = 5%
-3 -2 -1 0 1 2 3 4 5 6 7 8 9
0
10
20
30
40
50
60
70
80
Freq
uenc
y
R Multiple
ETF2 ETF2 SPYnumber 265 942max 7.28 7.26average 0.19 -0.003min -2.54 -4.92stdev 1.73 0.870822SQN 1.098266 -0.03445T Score 1.787847 -0.10573
Index Overreaction
61
Index Overreaction
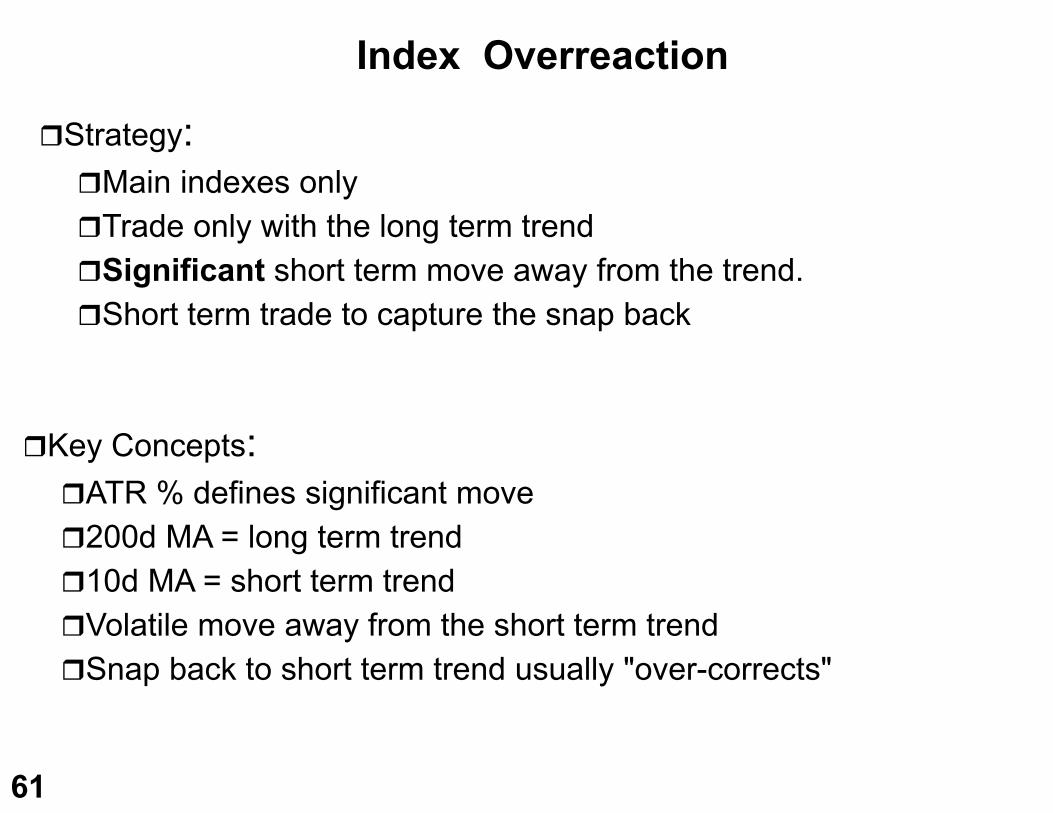
Strategy: Main indexes only Trade only with the long term trendSignificant short term move away from the trend.Short term trade to capture the snap back
Key Concepts: ATR % defines significant move200d MA = long term trend10d MA = short term trendVolatile move away from the short term trendSnap back to short term trend usually "over-corrects"
62
Index overreactionProfitable every year from 1994 to 2004SPY, QQQQ, MDY, IWM, SMH
Made money in both bull and bear marketsSimple to trade and easy to learnmechanical systemConsistent money maker on long & short sideOutperformed buy and holdA few simple rules, 5 minutes a day or less to implementStatistics based entry, based on volatility (dynamic)
Concept: the market corrects after a significant overreaction away from the trend
63
Overreaction: Buys
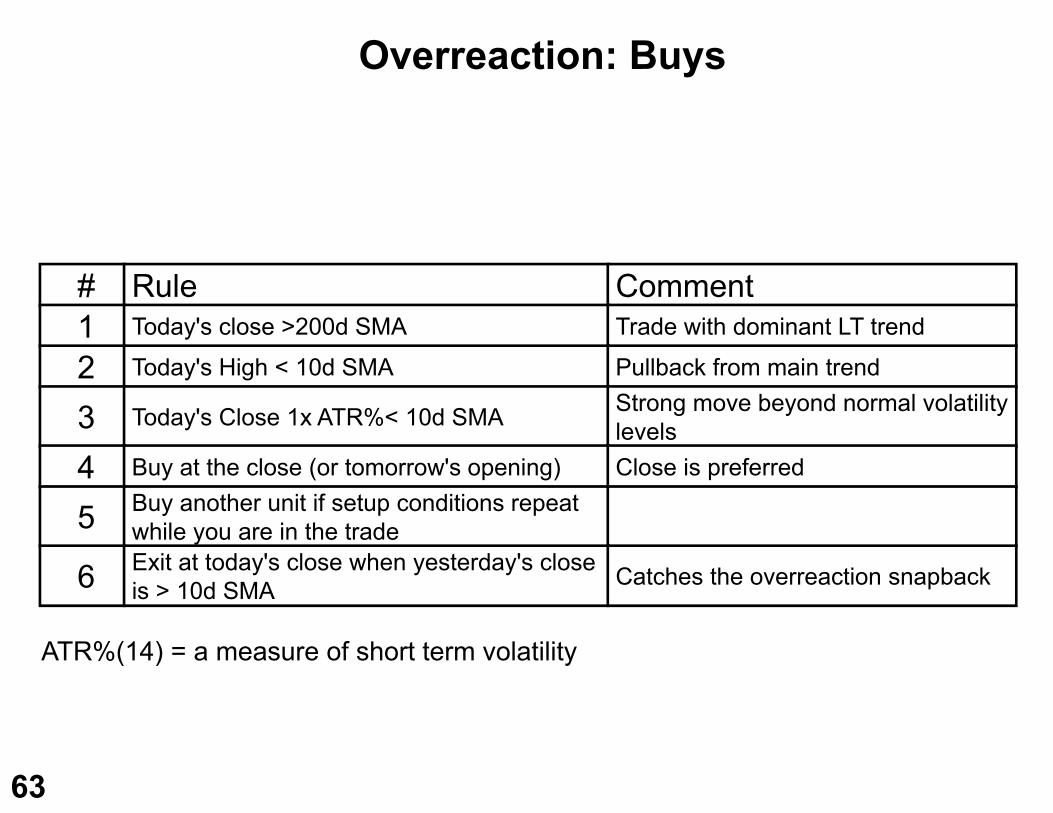
# Rule Comment1 Today's close >200d SMA Trade with dominant LT trend
2 Today's High < 10d SMA Pullback from main trend
3 Today's Close 1x ATR%< 10d SMA Strong move beyond normal volatility levels
4 Buy at the close (or tomorrow's opening) Close is preferred
5 Buy another unit if setup conditions repeat while you are in the trade
6 Exit at today's close when yesterday's close is > 10d SMA Catches the overreaction snapback
ATR%(14) = a measure of short term volatility
64
Overreaction System Rules: Sells
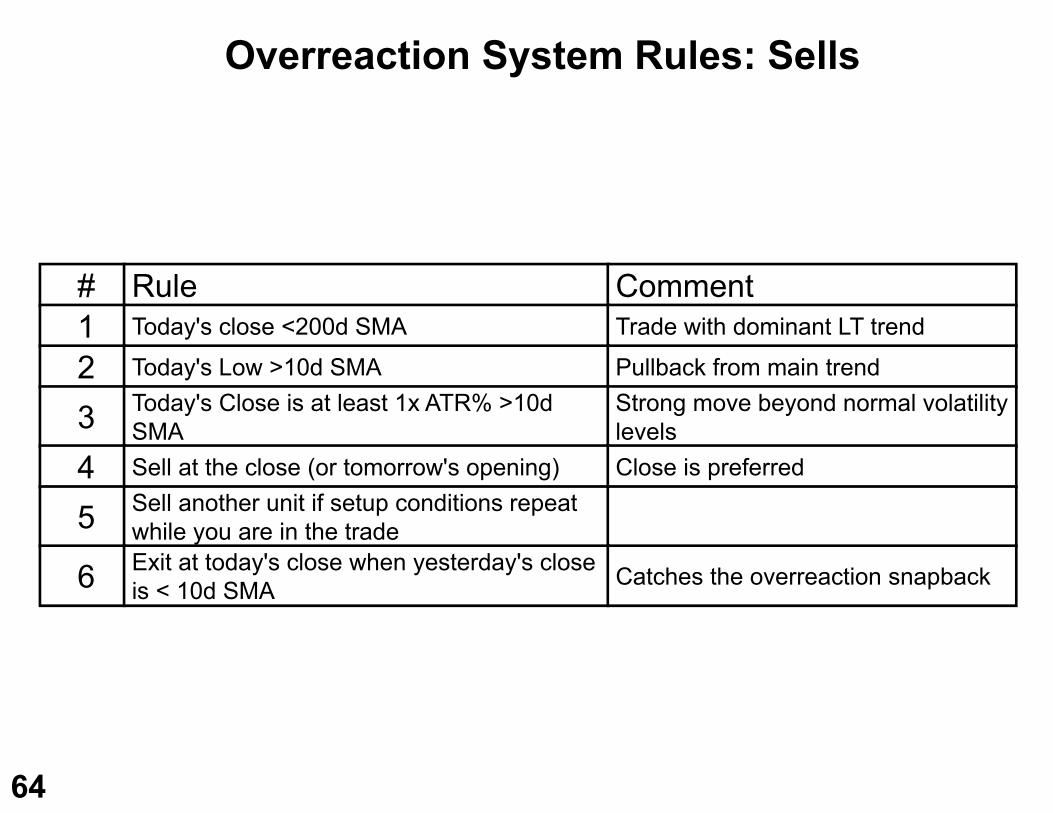
# Rule Comment1 Today's close <200d SMA Trade with dominant LT trend
2 Today's Low >10d SMA Pullback from main trend
3 Today's Close is at least 1x ATR% >10d SMA
Strong move beyond normal volatility levels
4 Sell at the close (or tomorrow's opening) Close is preferred
5 Sell another unit if setup conditions repeat while you are in the trade
6 Exit at today's close when yesterday's close is < 10d SMA Catches the overreaction snapback
65
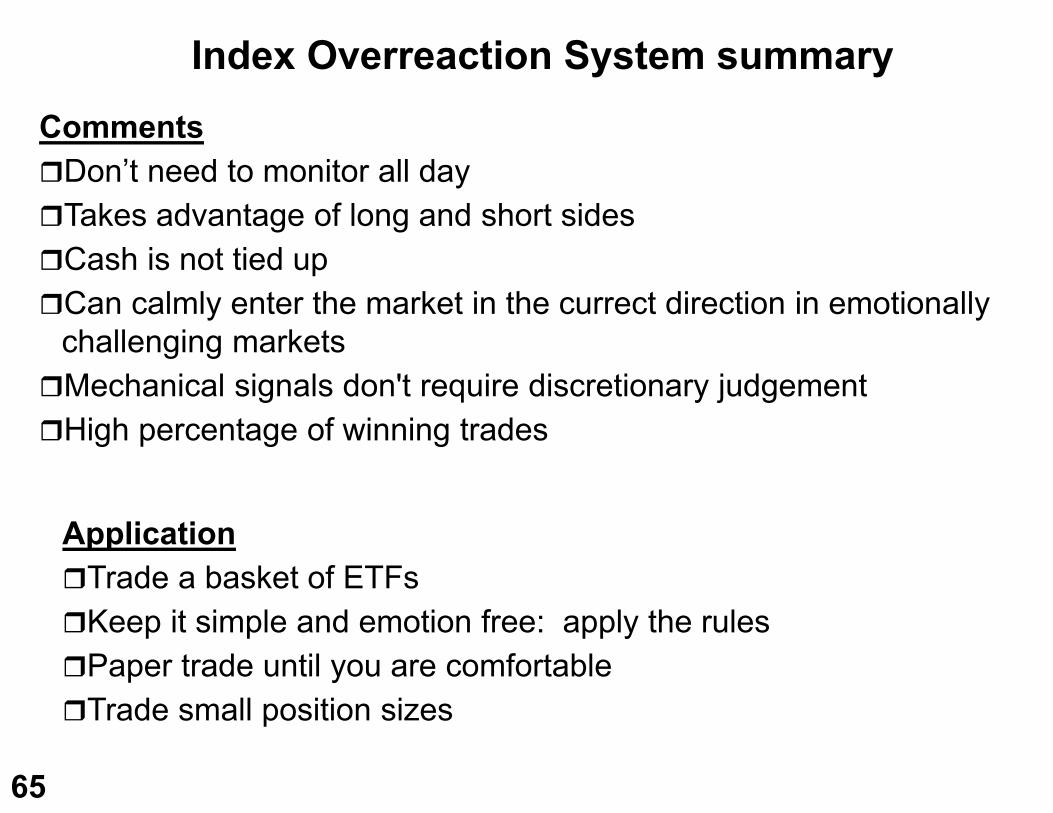
Index Overreaction System summaryCommentsDon’t need to monitor all dayTakes advantage of long and short sidesCash is not tied upCan calmly enter the market in the currect direction in emotionally
challenging marketsMechanical signals don't require discretionary judgementHigh percentage of winning trades
ApplicationTrade a basket of ETFsKeep it simple and emotion free: apply the rulesPaper trade until you are comfortableTrade small position sizes

Index Channeling
67
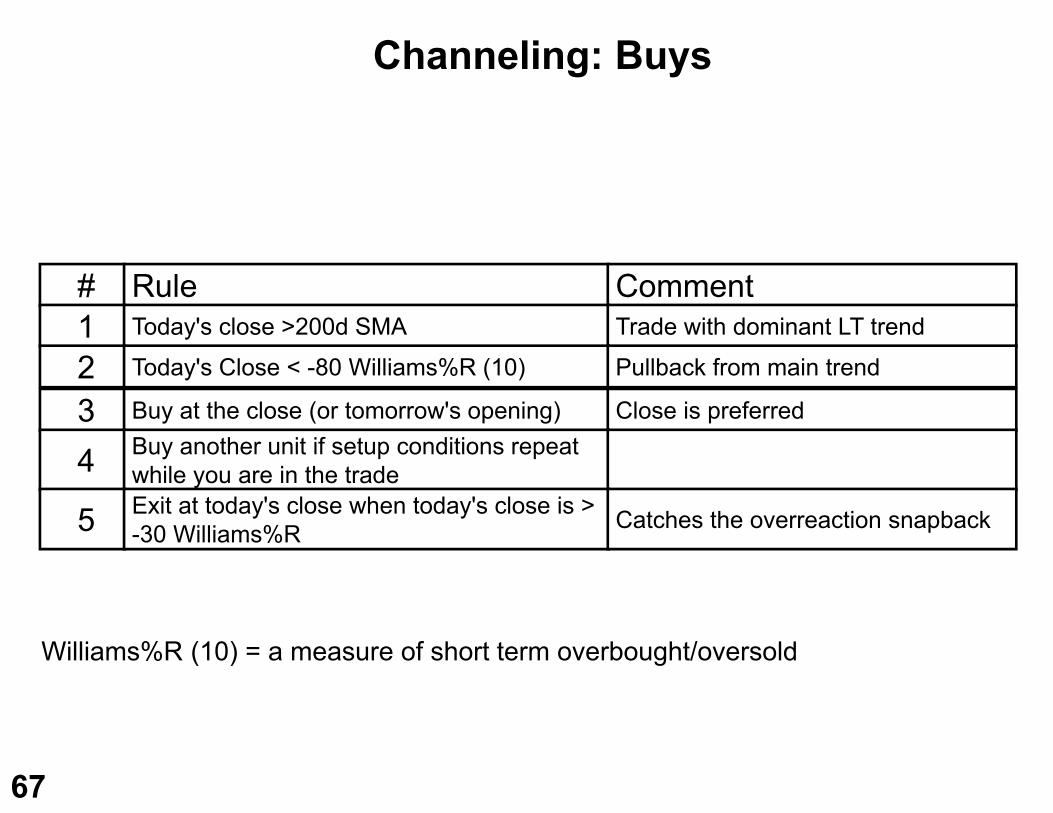
Channeling: Buys
# Rule Comment1 Today's close >200d SMA Trade with dominant LT trend
2 Today's Close < -80 Williams%R (10) Pullback from main trend
3 Buy at the close (or tomorrow's opening) Close is preferred
4 Buy another unit if setup conditions repeat while you are in the trade
5 Exit at today's close when today's close is > -30 Williams%R Catches the overreaction snapback
Williams%R (10) = a measure of short term overbought/oversold
68
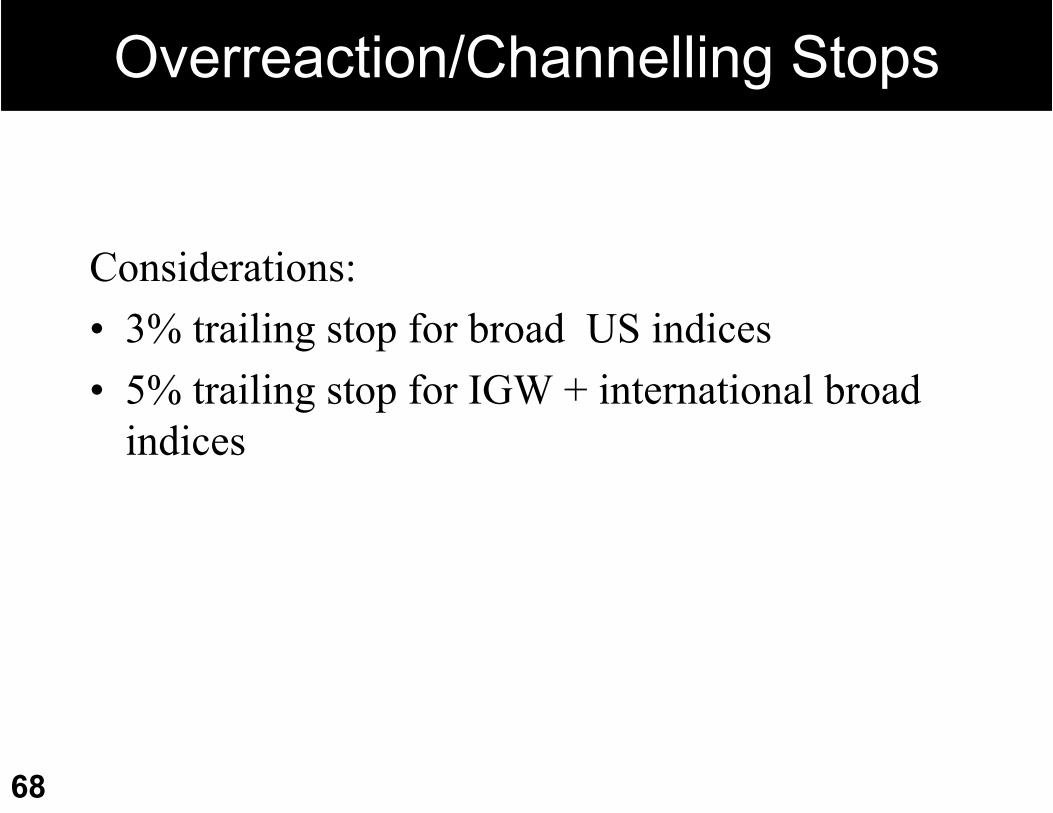
Overreaction/Channelling Stops
Considerations:• 3% trailing stop for broad US indices• 5% trailing stop for IGW + international broad
indices
69

5 days down(5DD)
70
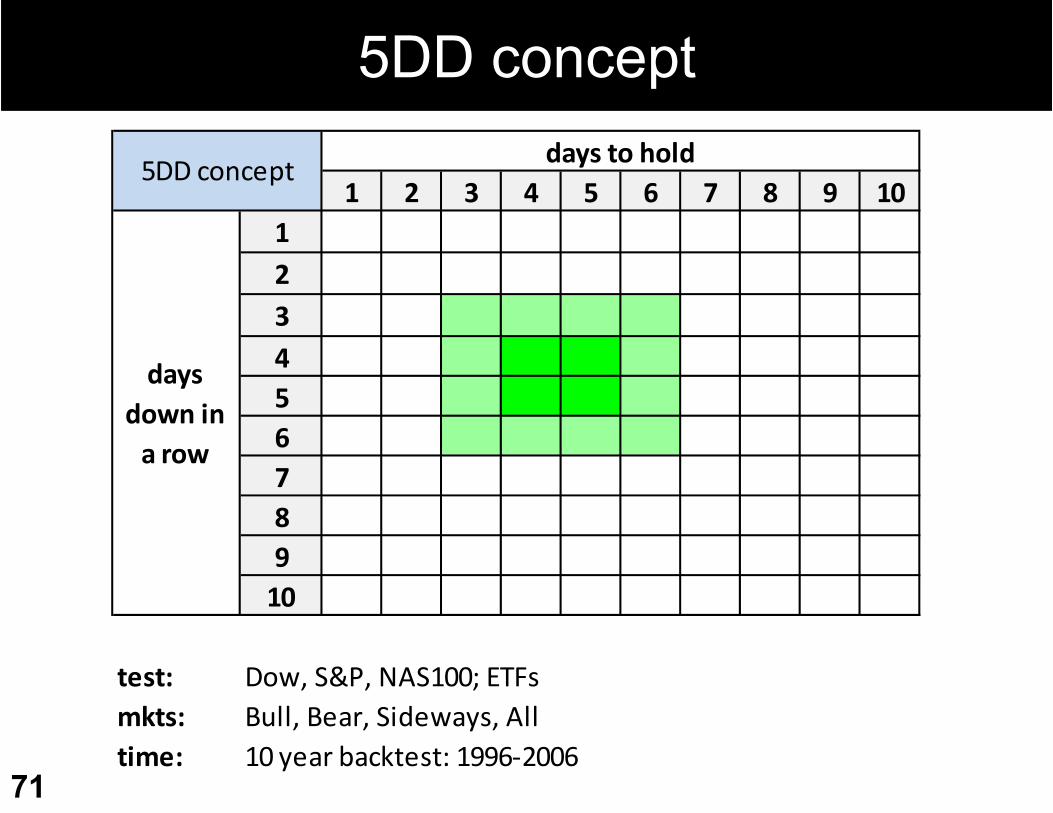
5DD concept
71
1 2 3 4 5 6 7 8 9 1012345678910
test:mkts:time: 10 year backtest: 1996‐2006
days to hold
days down in a row
5DD concept
Dow, S&P, NAS100; ETFsBull, Bear, Sideways, All

551w
72
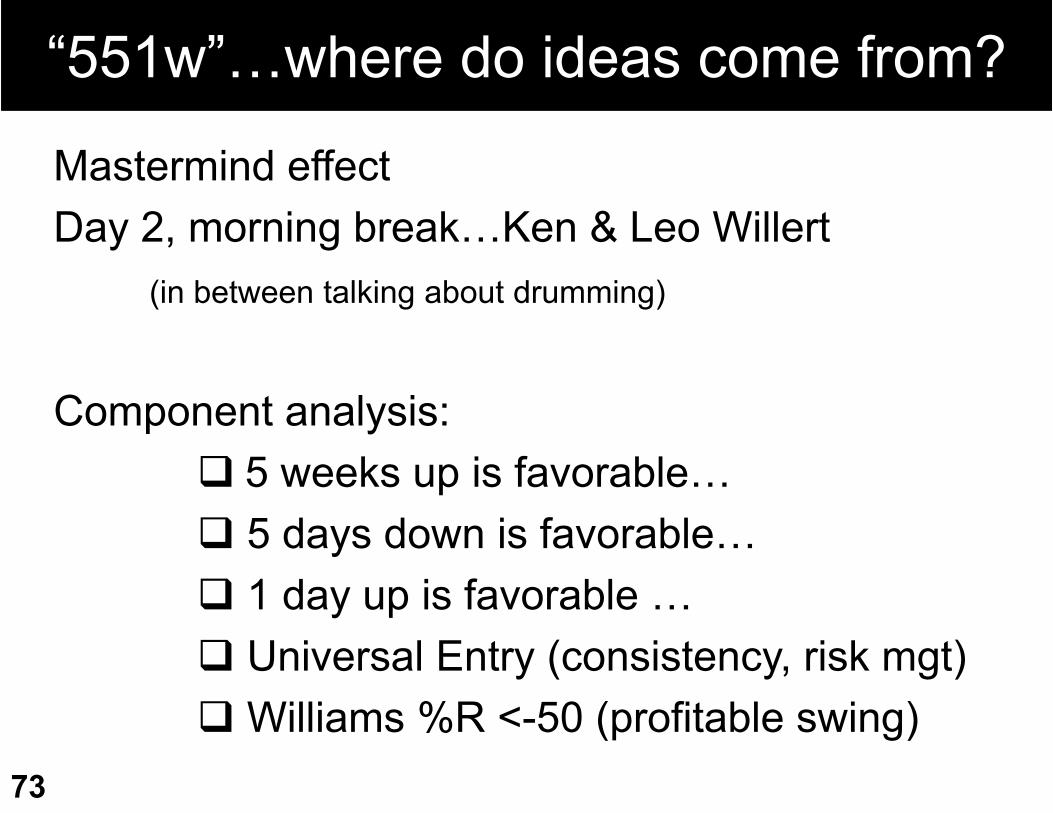
“551w”…where do ideas come from?
73
Mastermind effectDay 2, morning break…Ken & Leo Willert
(in between talking about drumming)
Component analysis: 5 weeks up is favorable… 5 days down is favorable… 1 day up is favorable … Universal Entry (consistency, risk mgt)Williams %R <-50 (profitable swing)
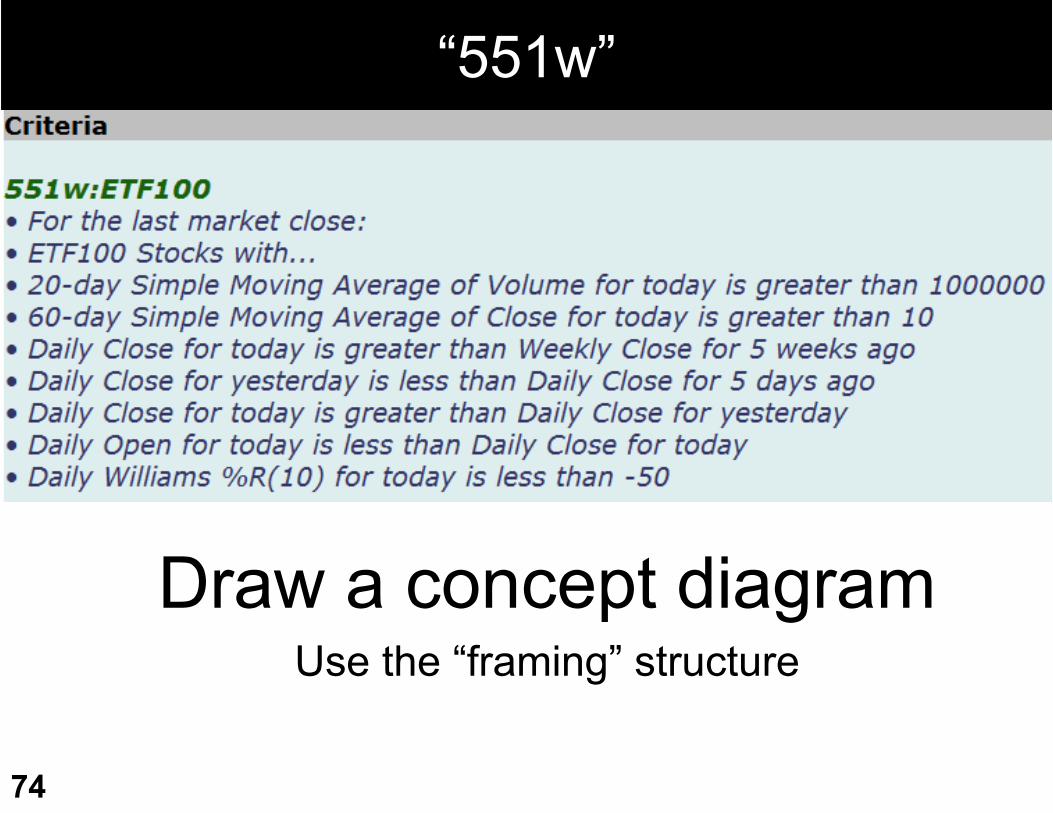
“551w”
74
Draw a concept diagramUse the “framing” structure
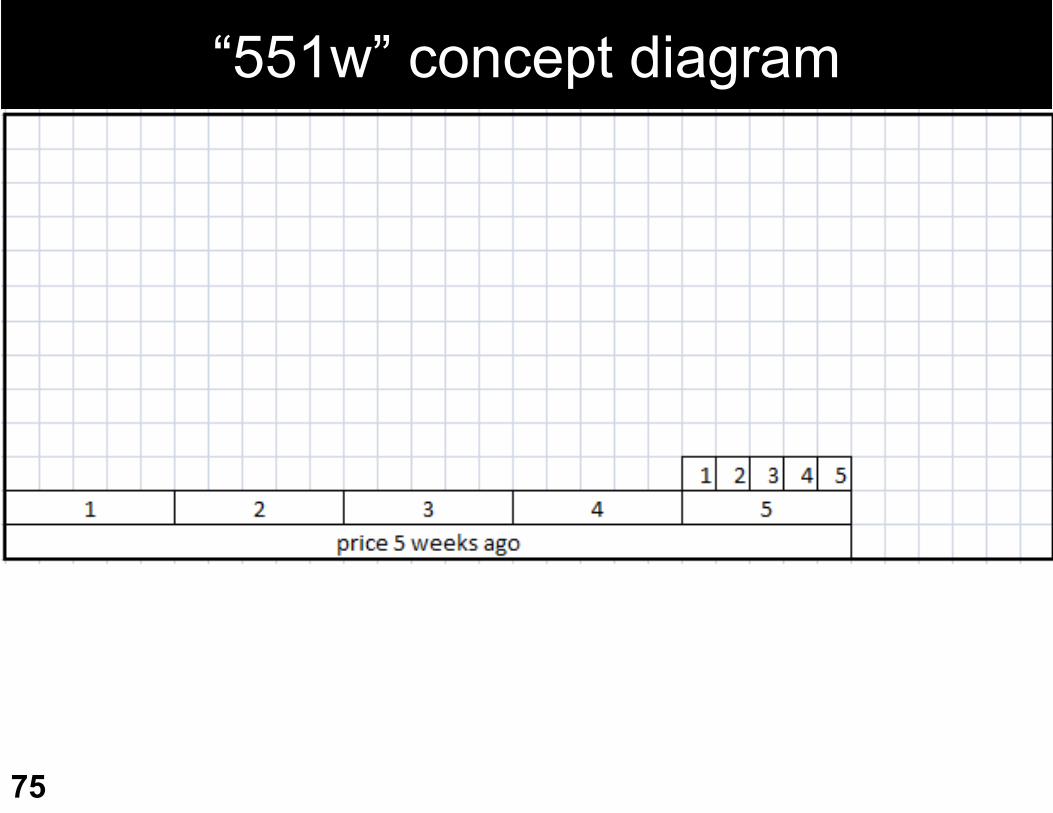
“551w” concept diagram
75
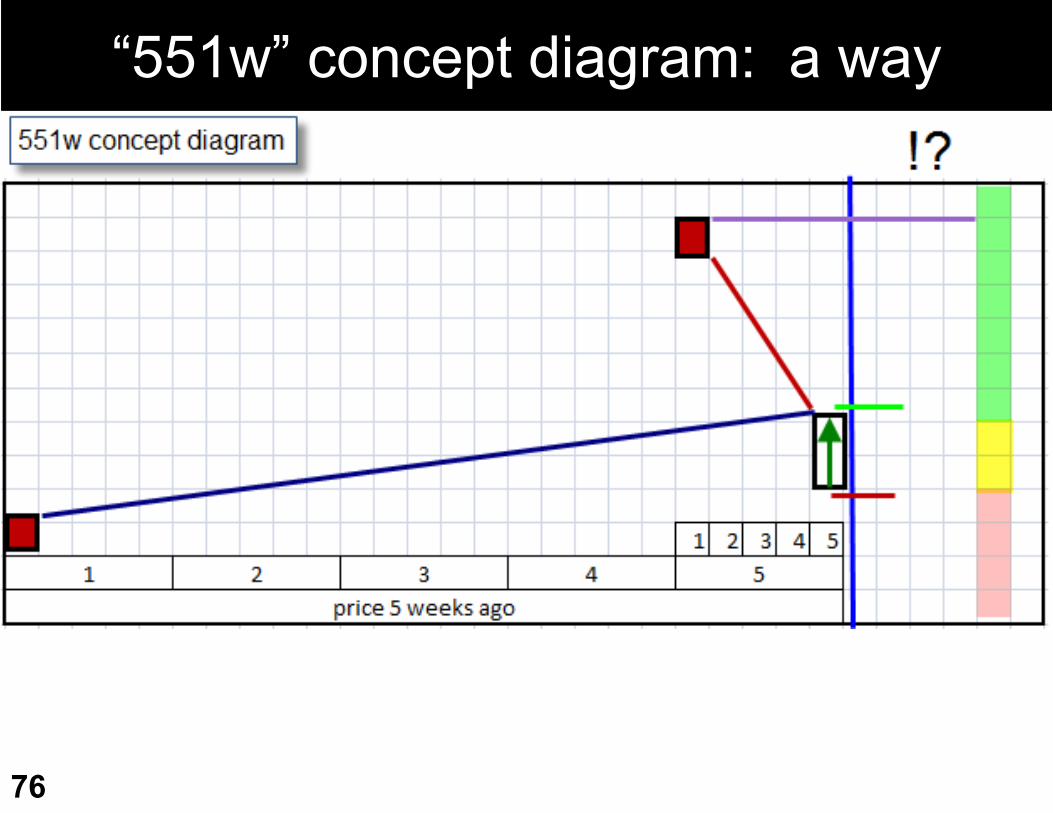
“551w” concept diagram: a way
76

Washout
77
78
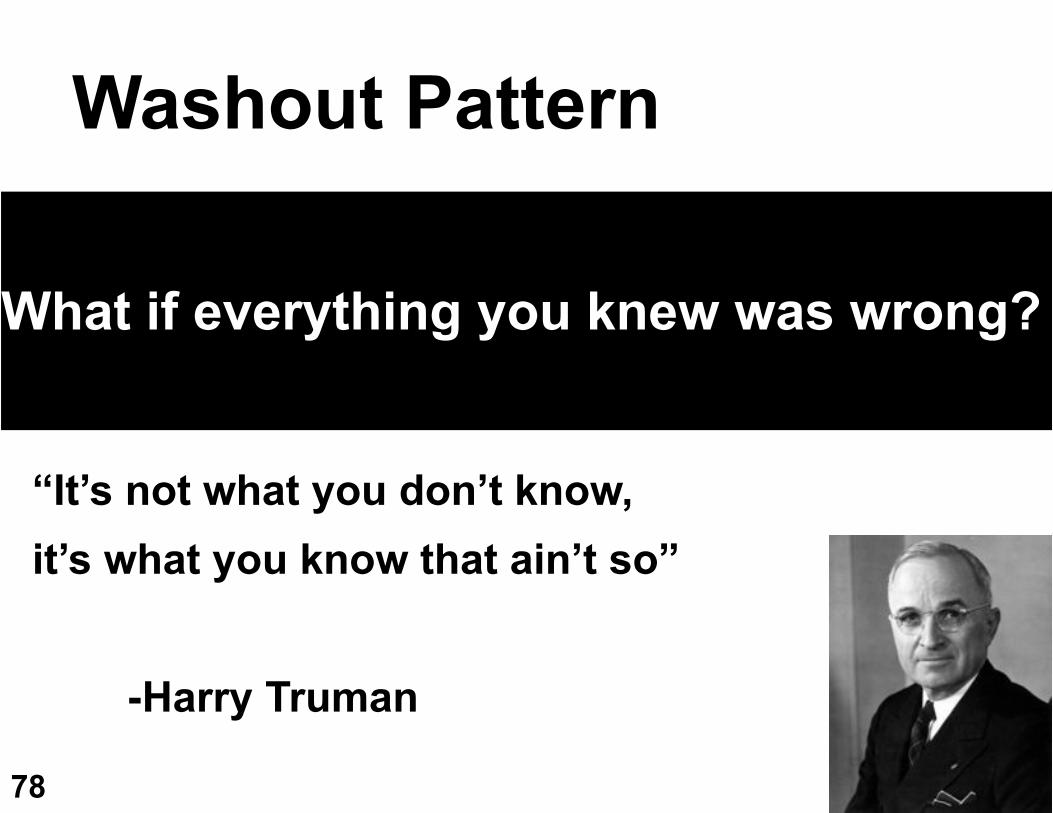
Washout Pattern
What if everything you knew was wrong?
“It’s not what you don’t know, it’s what you know that ain’t so”
-Harry Truman
79
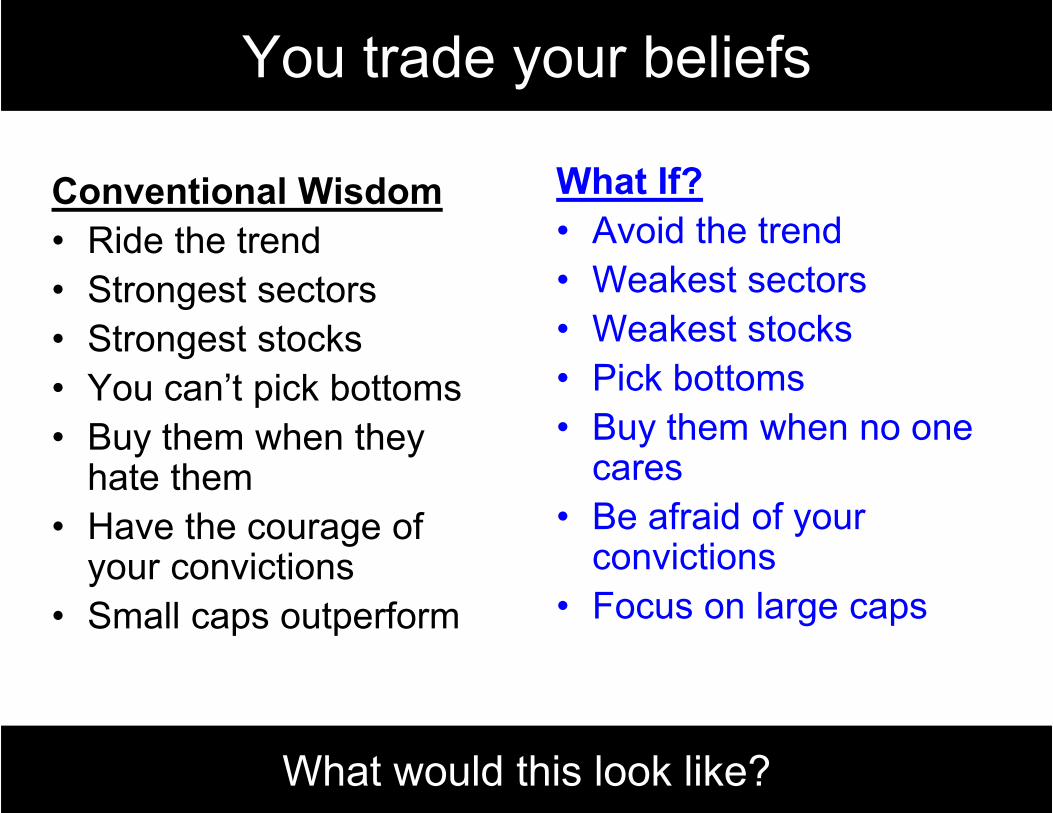
You trade your beliefs
Conventional Wisdom• Ride the trend• Strongest sectors• Strongest stocks• You can’t pick bottoms• Buy them when they
hate them• Have the courage of
your convictions• Small caps outperform
What If?• Avoid the trend• Weakest sectors• Weakest stocks• Pick bottoms• Buy them when no one
cares• Be afraid of your
convictions• Focus on large caps
What would this look like?
80
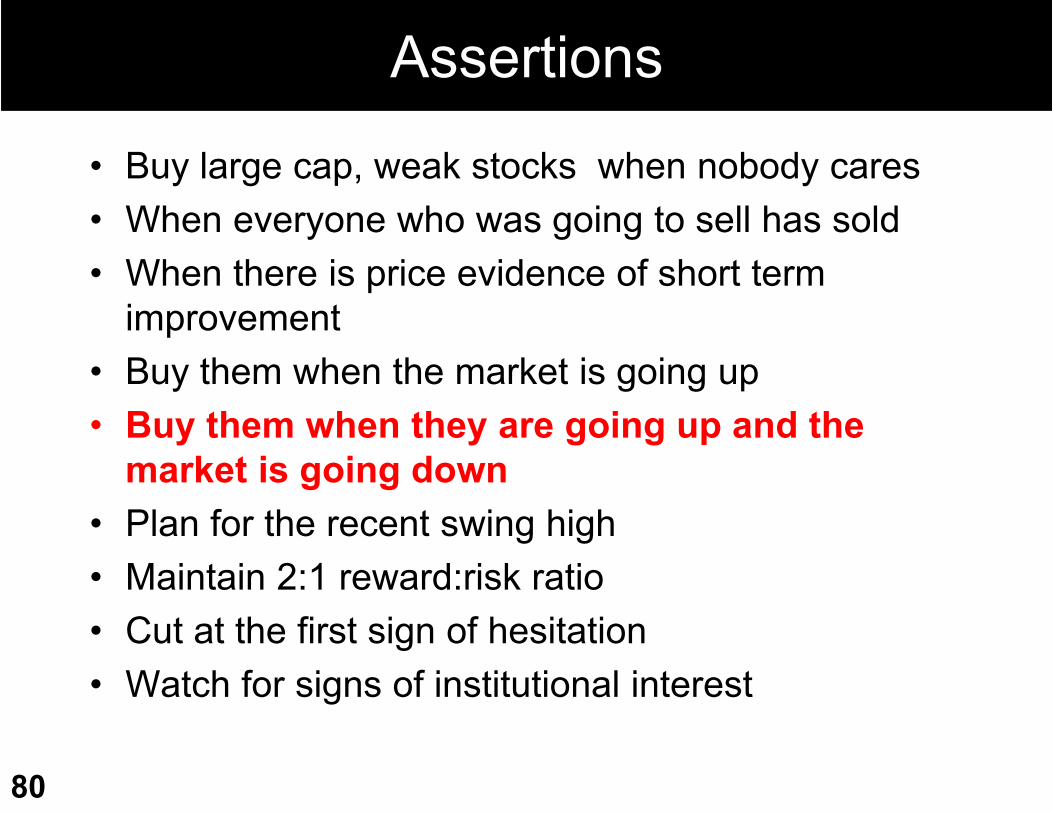
Assertions
• Buy large cap, weak stocks when nobody cares• When everyone who was going to sell has sold• When there is price evidence of short term
improvement• Buy them when the market is going up• Buy them when they are going up and the
market is going down• Plan for the recent swing high• Maintain 2:1 reward:risk ratio• Cut at the first sign of hesitation • Watch for signs of institutional interest
81
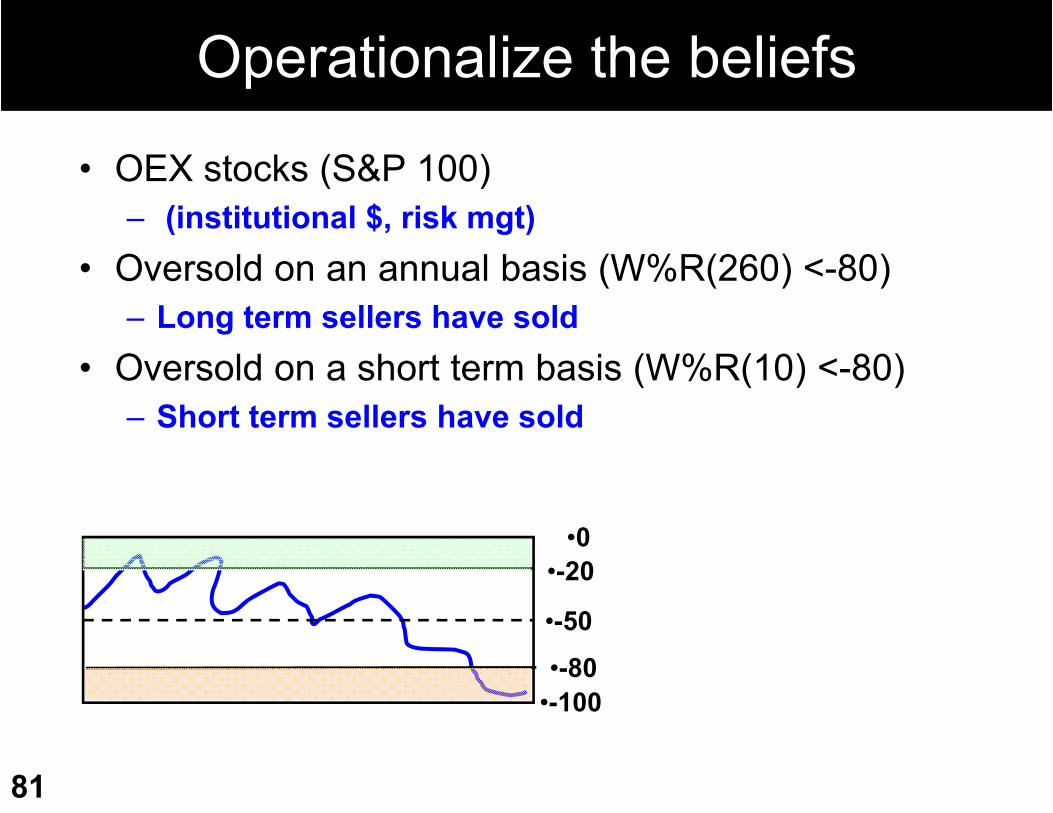
Operationalize the beliefs
• OEX stocks (S&P 100)– (institutional $, risk mgt)
• Oversold on an annual basis (W%R(260) <-80)– Long term sellers have sold
• Oversold on a short term basis (W%R(10) <-80)– Short term sellers have sold
•0•-20
•-50•-80
•-100
82
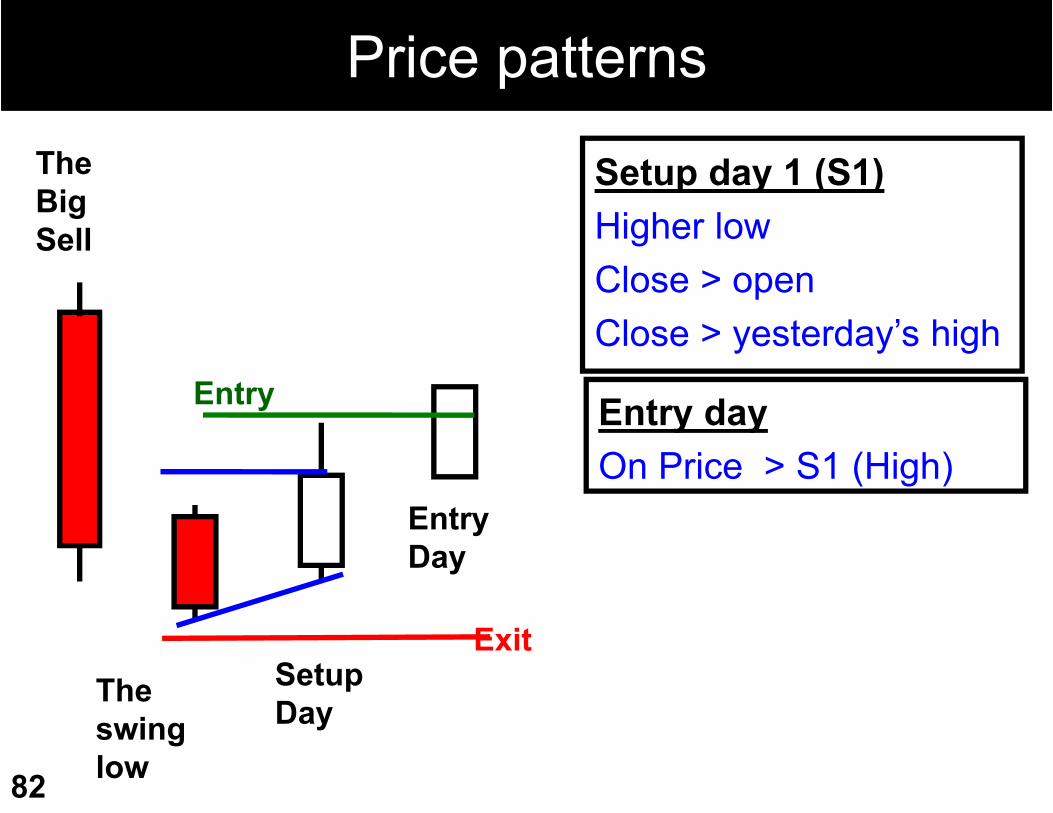
Price patternsThe Big Sell
The swing low
Setup day 1 (S1)Higher lowClose > openClose > yesterday’s high
Entry dayOn Price > S1 (High)
Setup Day
EntryDay
Exit
Entry
83
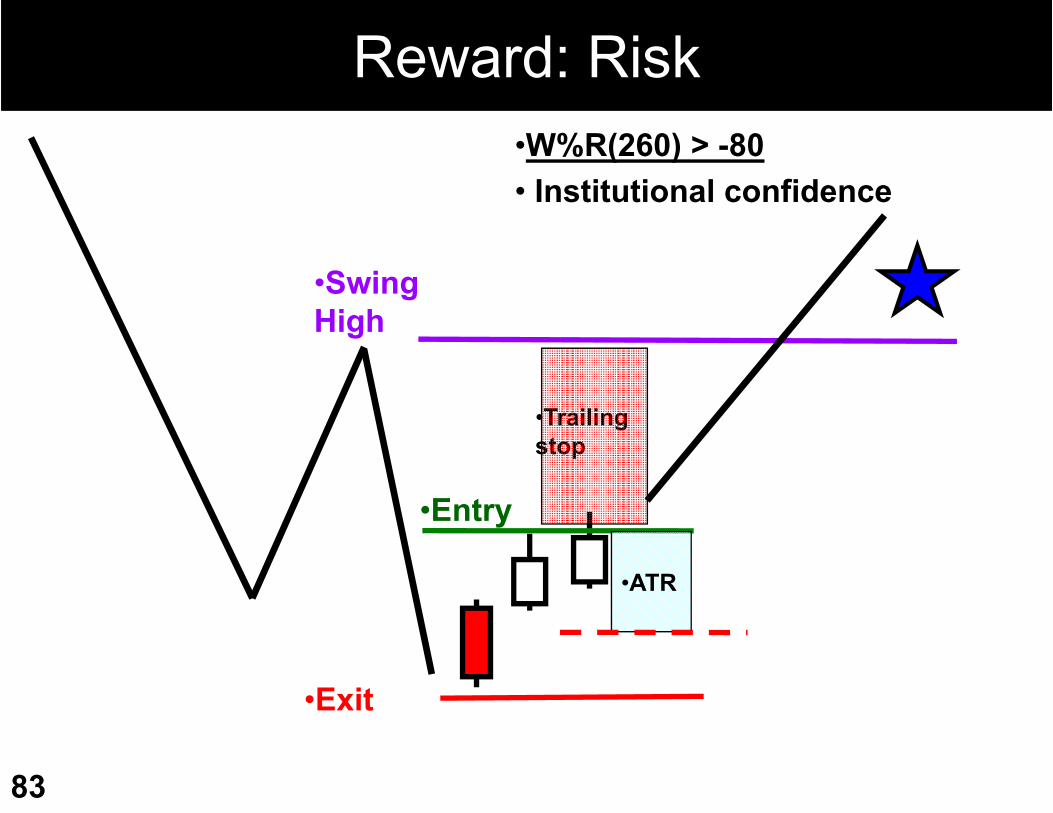
Reward: Risk
•Swing High
•Entry
•Exit
•ATR
•Trailing stop
•W%R(260) > -80• Institutional confidence
84
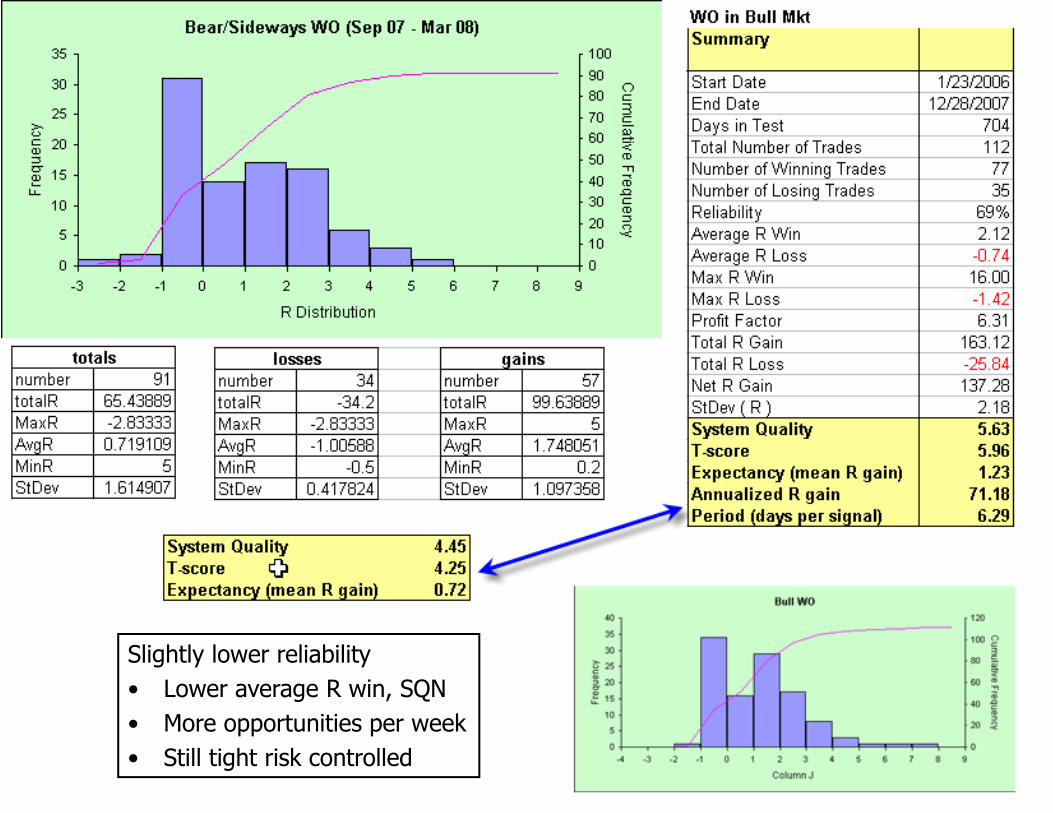
Slightly lower reliability• Lower average R win, SQN• More opportunities per week• Still tight risk controlled

Triple Screen SystemTriple Screen
Systemvariation on Dr Alexander Elder's system
86
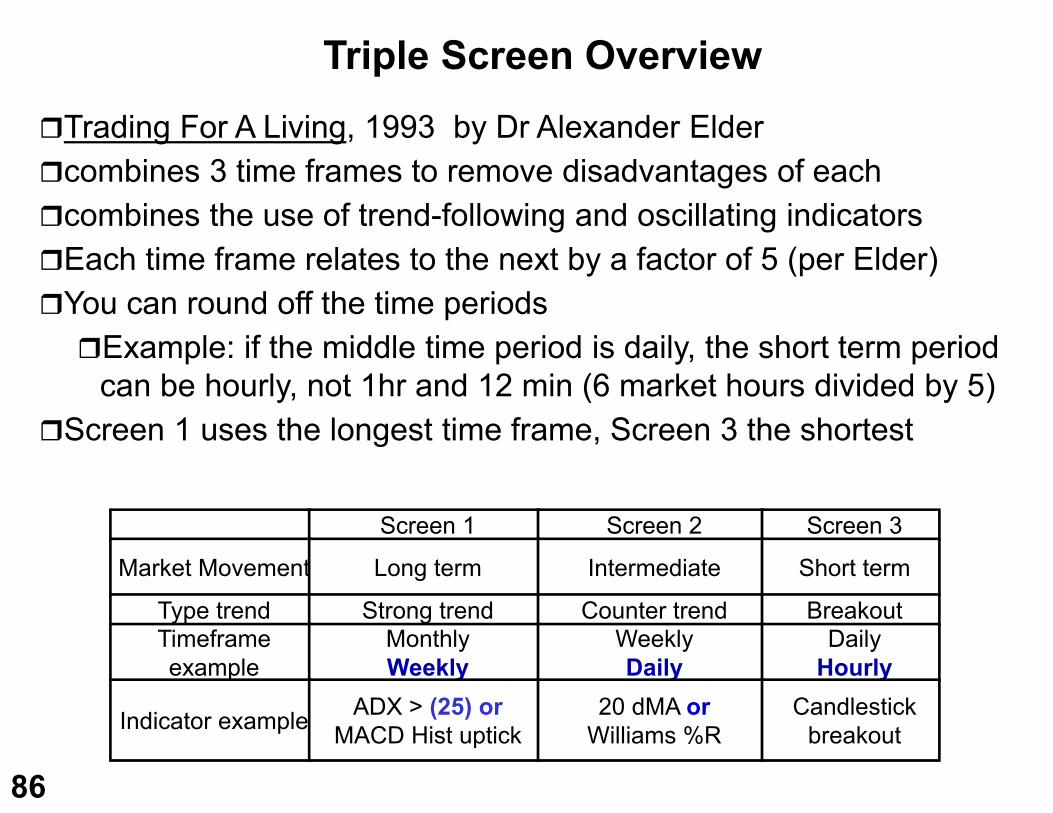
Triple Screen OverviewTrading For A Living, 1993 by Dr Alexander Eldercombines 3 time frames to remove disadvantages of eachcombines the use of trend-following and oscillating indicatorsEach time frame relates to the next by a factor of 5 (per Elder)You can round off the time periodsExample: if the middle time period is daily, the short term period
can be hourly, not 1hr and 12 min (6 market hours divided by 5)Screen 1 uses the longest time frame, Screen 3 the shortest
Screen 1 Screen 2 Screen 3
Market Movement Long term Intermediate Short term
Type trend Strong trend Counter trend BreakoutTimeframe example
MonthlyWeekly
WeeklyDaily
DailyHourly
Indicator example ADX > (25) orMACD Hist uptick
20 dMA orWilliams %R
Candlestick breakout
87
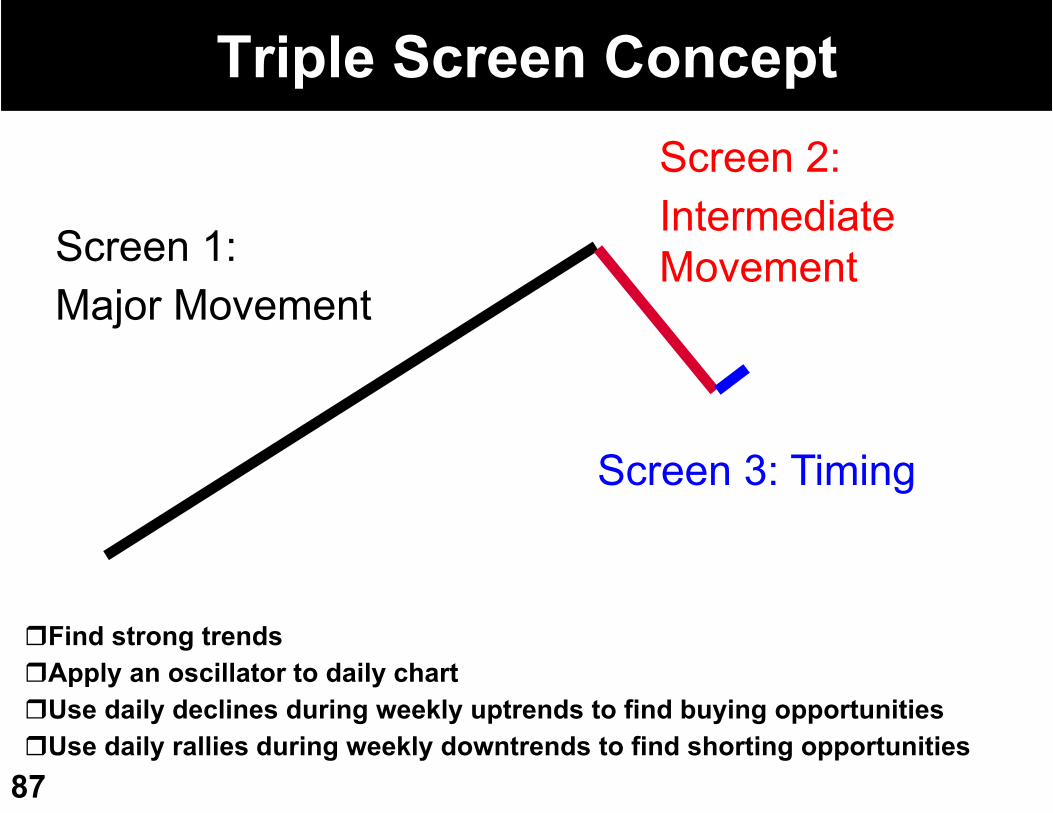
Screen 1: Major Movement
Screen 2: Intermediate Movement
Screen 3: Timing
Find strong trendsApply an oscillator to daily chartUse daily declines during weekly uptrends to find buying opportunitiesUse daily rallies during weekly downtrends to find shorting opportunities
Triple Screen Concept
88
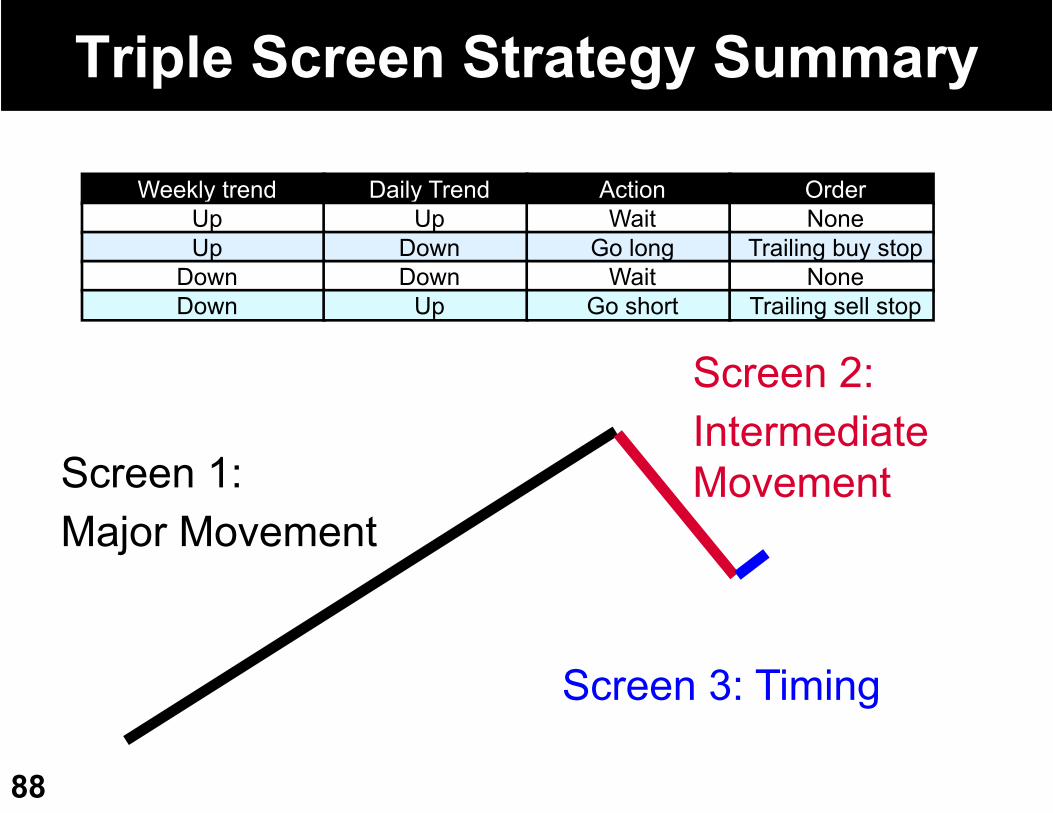
Weekly trend Daily Trend Action OrderUp Up Wait NoneUp Down Go long Trailing buy stop
Down Down Wait NoneDown Up Go short Trailing sell stop
Screen 1: Major Movement
Screen 2: Intermediate Movement
Screen 3: Timing
Triple Screen Strategy Summary
89
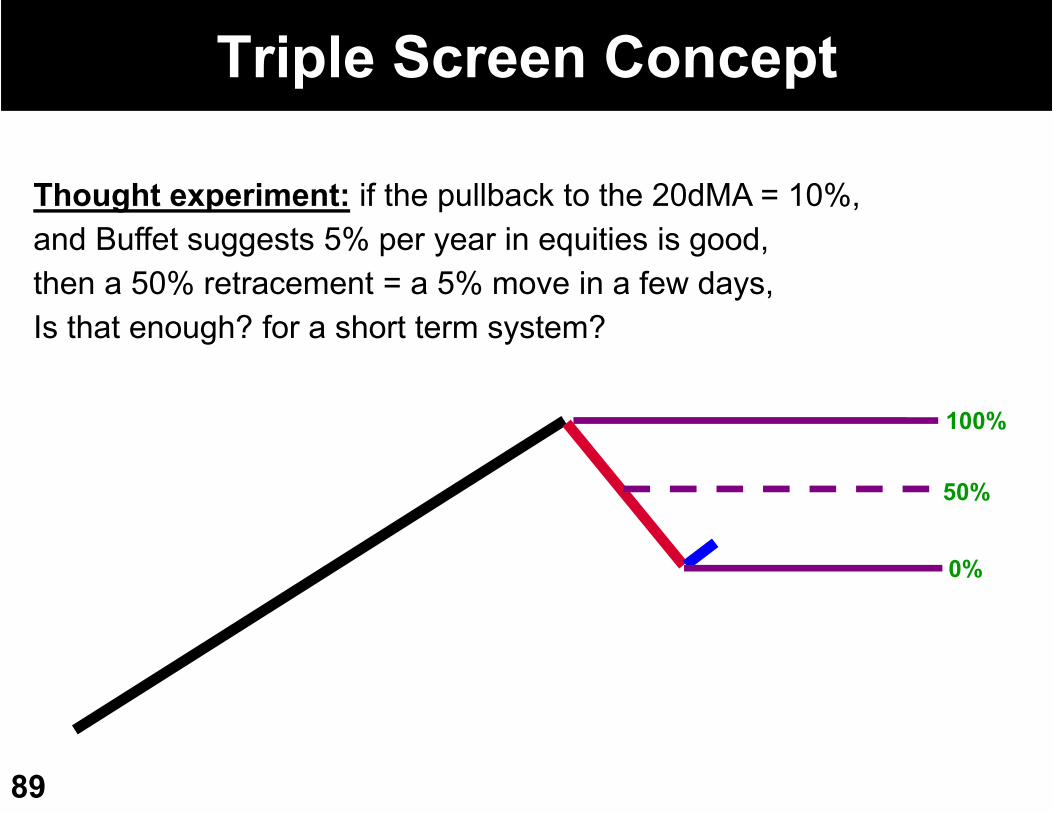
0%
100%
50%
Thought experiment: if the pullback to the 20dMA = 10%,and Buffet suggests 5% per year in equities is good,then a 50% retracement = a 5% move in a few days,Is that enough? for a short term system?
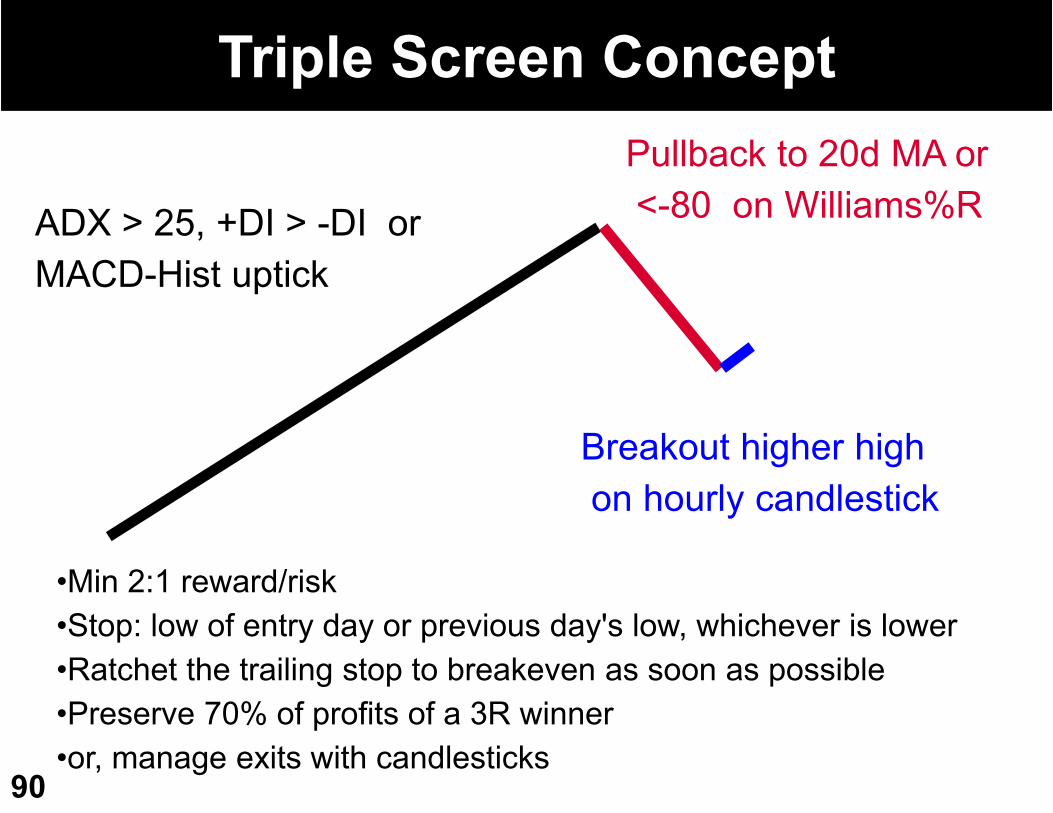
Triple Screen Concept
90
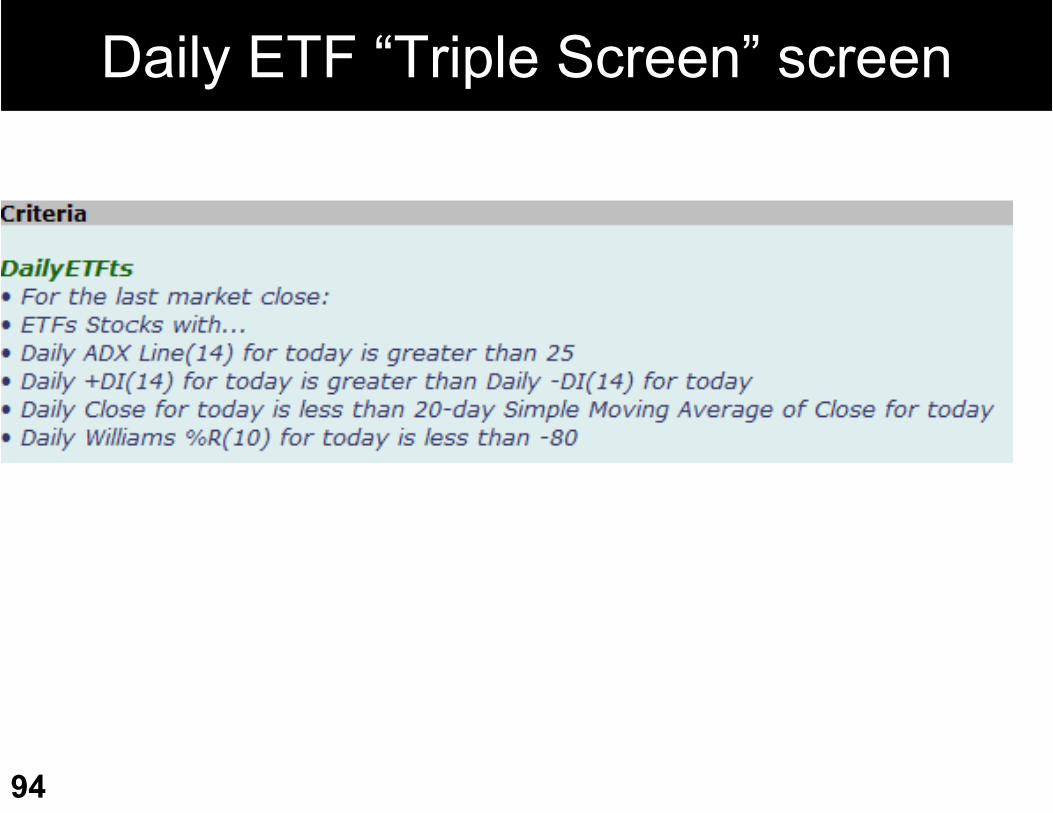
ADX > 25, +DI > -DI orMACD-Hist uptick
Pullback to 20d MA or<-80 on Williams%R
Breakout higher highon hourly candlestick
•Min 2:1 reward/risk•Stop: low of entry day or previous day's low, whichever is lower•Ratchet the trailing stop to breakeven as soon as possible•Preserve 70% of profits of a 3R winner•or, manage exits with candlesticks
Triple Screen Concept
91
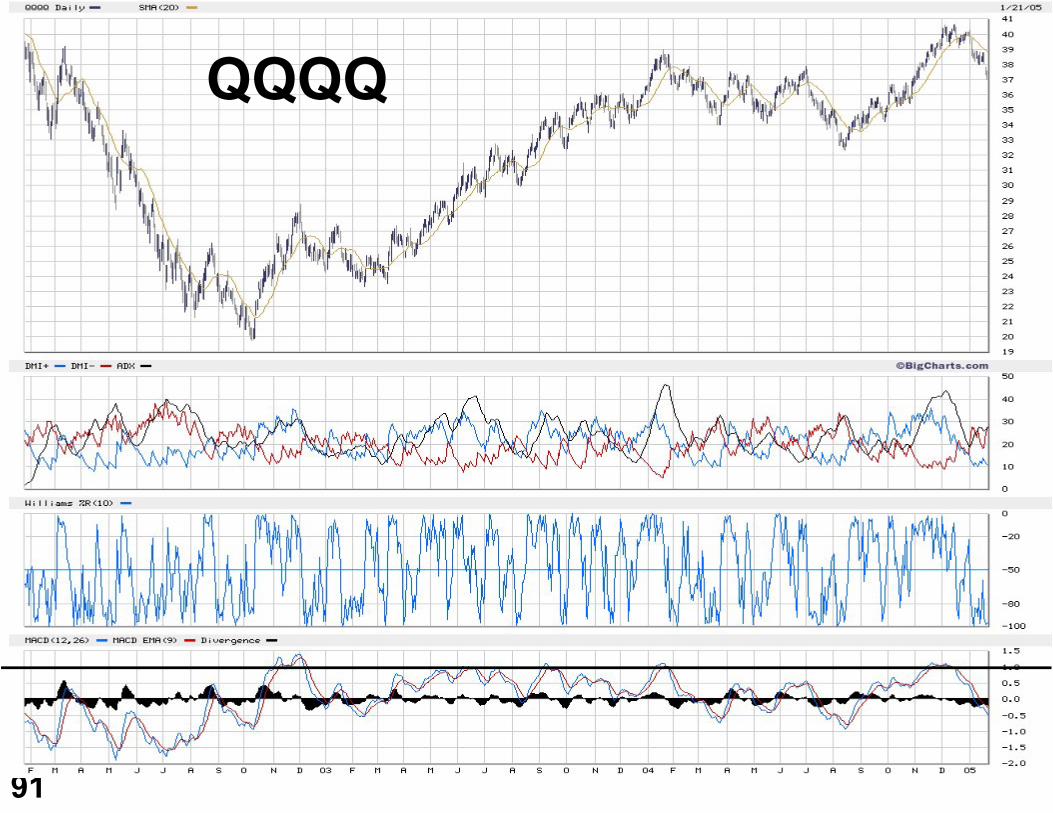
QQQQ
92
93
94
Daily ETF “Triple Screen” screen

Mastermind Insights
95
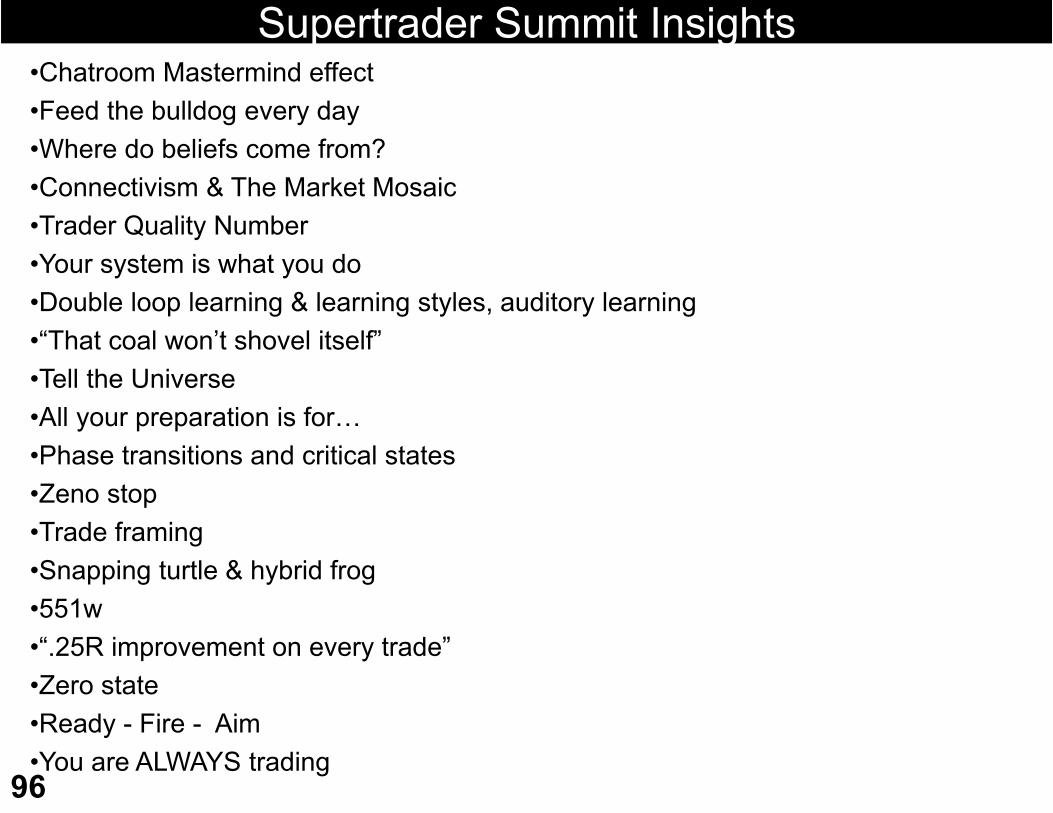
Supertrader Summit Insights
96
•Chatroom Mastermind effect•Feed the bulldog every day•Where do beliefs come from?•Connectivism & The Market Mosaic•Trader Quality Number•Your system is what you do•Double loop learning & learning styles, auditory learning•“That coal won’t shovel itself”•Tell the Universe•All your preparation is for…•Phase transitions and critical states•Zeno stop•Trade framing•Snapping turtle & hybrid frog•551w•“.25R improvement on every trade”•Zero state•Ready - Fire - Aim•You are ALWAYS trading
97
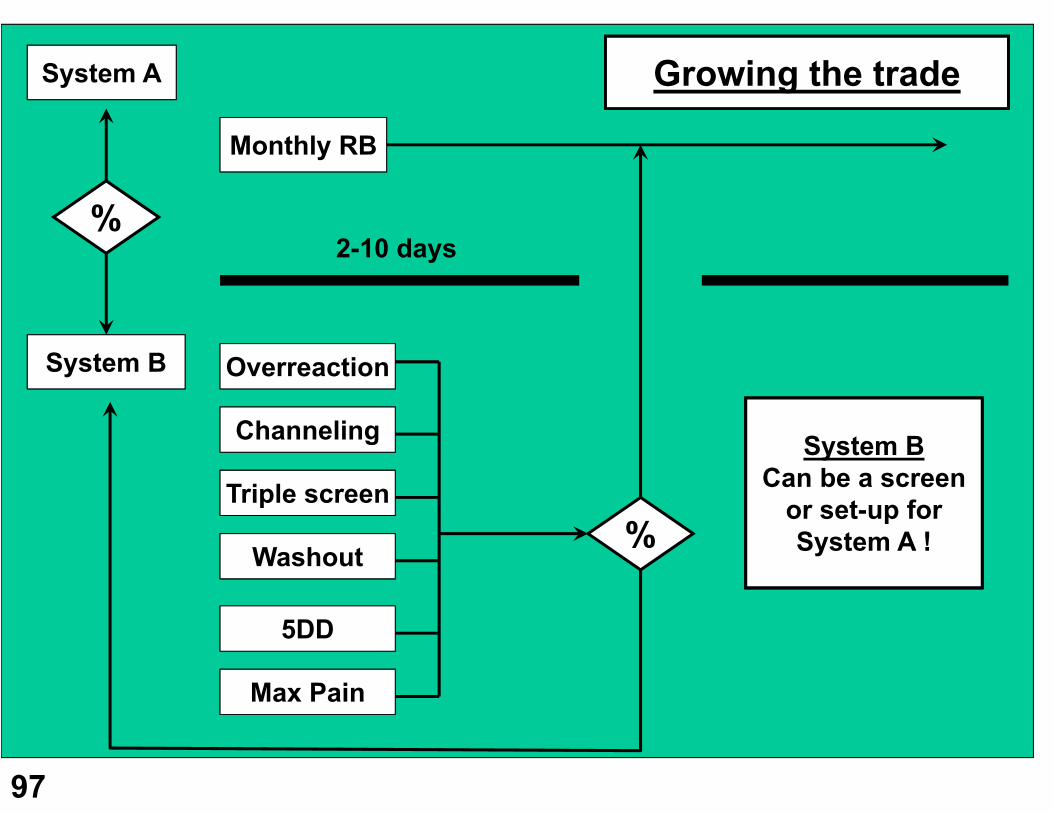
System A
System B
Monthly RB
Overreaction
5DD
Max Pain
Triple screen
Washout
Channeling
%
%
System BCan be a screen
or set-up for System A !
Growing the trade
2-10 days
Trade Index
Analysis
99
The LeBeau Stop Quality Index
• From the Systems seminar 1996:• Time in trade = t• Find best price in time = 2t• Your exit / Best Possible exit• A number between 0 and 1• .5 is really good• My refinement: consider time value of money• Spreadsheet implementation with XLQ
100
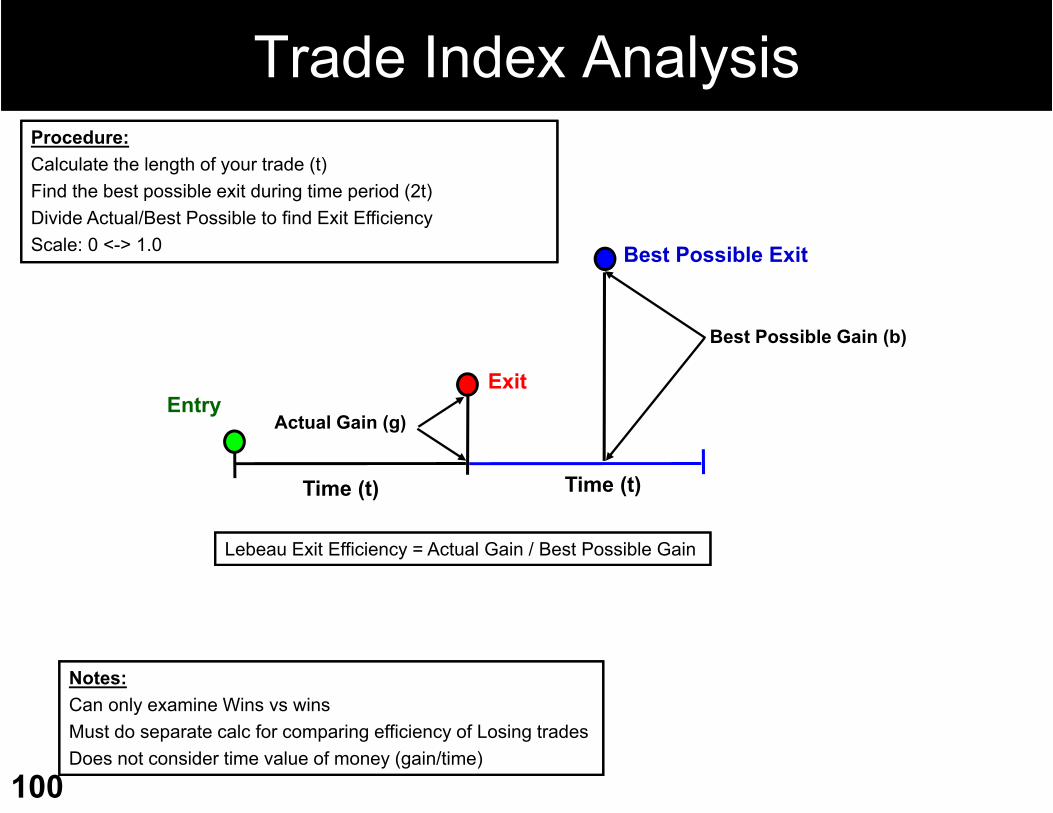
Trade Index AnalysisProcedure:Calculate the length of your trade (t)Find the best possible exit during time period (2t)Divide Actual/Best Possible to find Exit EfficiencyScale: 0 <-> 1.0
Notes:Can only examine Wins vs winsMust do separate calc for comparing efficiency of Losing tradesDoes not consider time value of money (gain/time)
Entry
Time (t)
Exit
Actual Gain (g)
Best Possible Exit
Best Possible Gain (b)
Time (t)
Lebeau Exit Efficiency = Actual Gain / Best Possible Gain
101
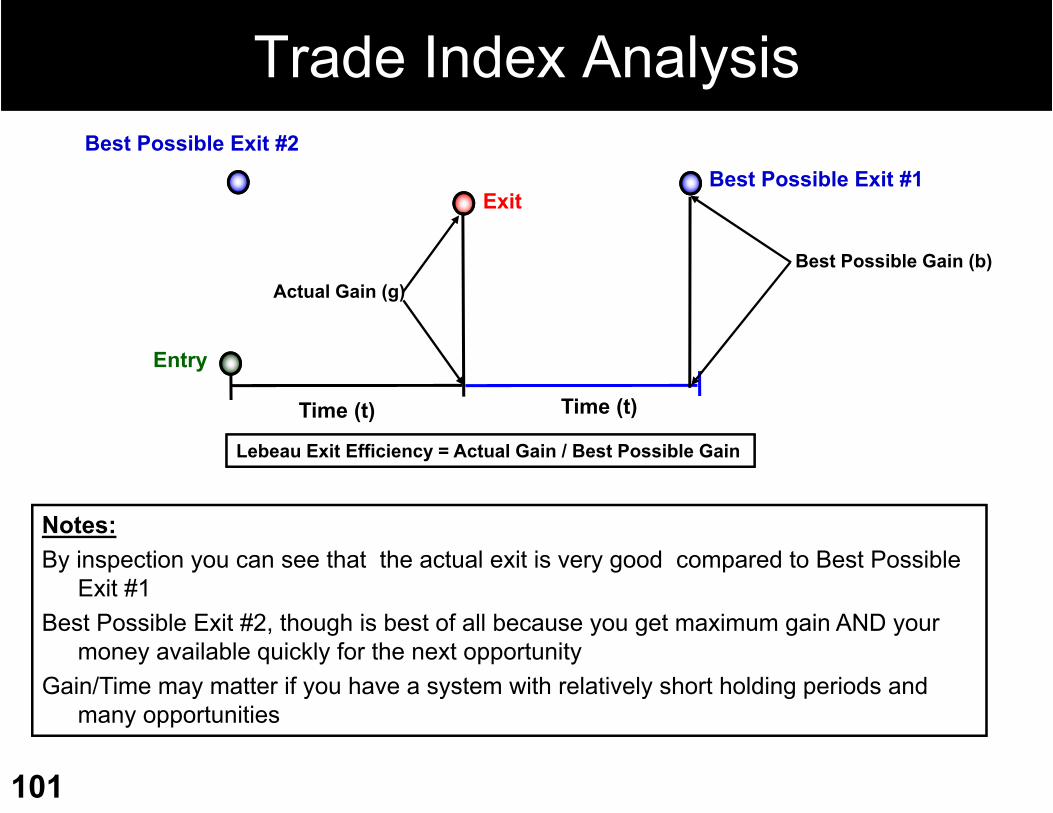
Trade Index Analysis
Notes: By inspection you can see that the actual exit is very good compared to Best Possible
Exit #1Best Possible Exit #2, though is best of all because you get maximum gain AND your
money available quickly for the next opportunityGain/Time may matter if you have a system with relatively short holding periods and
many opportunities
Entry
Time (t)
Exit
Actual Gain (g)
Best Possible Exit #1
Best Possible Gain (b)
Time (t)
Lebeau Exit Efficiency = Actual Gain / Best Possible Gain
Best Possible Exit #2
102
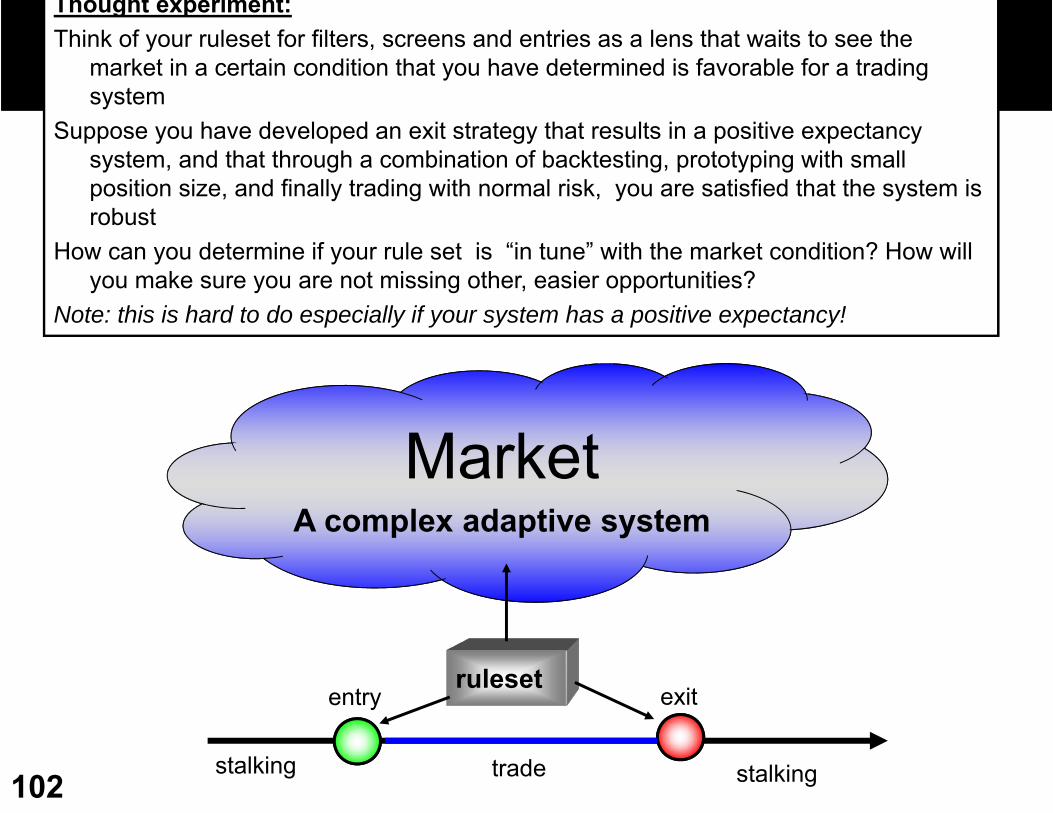
Trade Index AnalysisThought experiment: Think of your ruleset for filters, screens and entries as a lens that waits to see the
market in a certain condition that you have determined is favorable for a trading system
Suppose you have developed an exit strategy that results in a positive expectancy system, and that through a combination of backtesting, prototyping with small position size, and finally trading with normal risk, you are satisfied that the system is robust
How can you determine if your rule set is “in tune” with the market condition? How will you make sure you are not missing other, easier opportunities?
Note: this is hard to do especially if your system has a positive expectancy!
MarketA complex adaptive system
stalking stalkingtrade
entry exitruleset
103
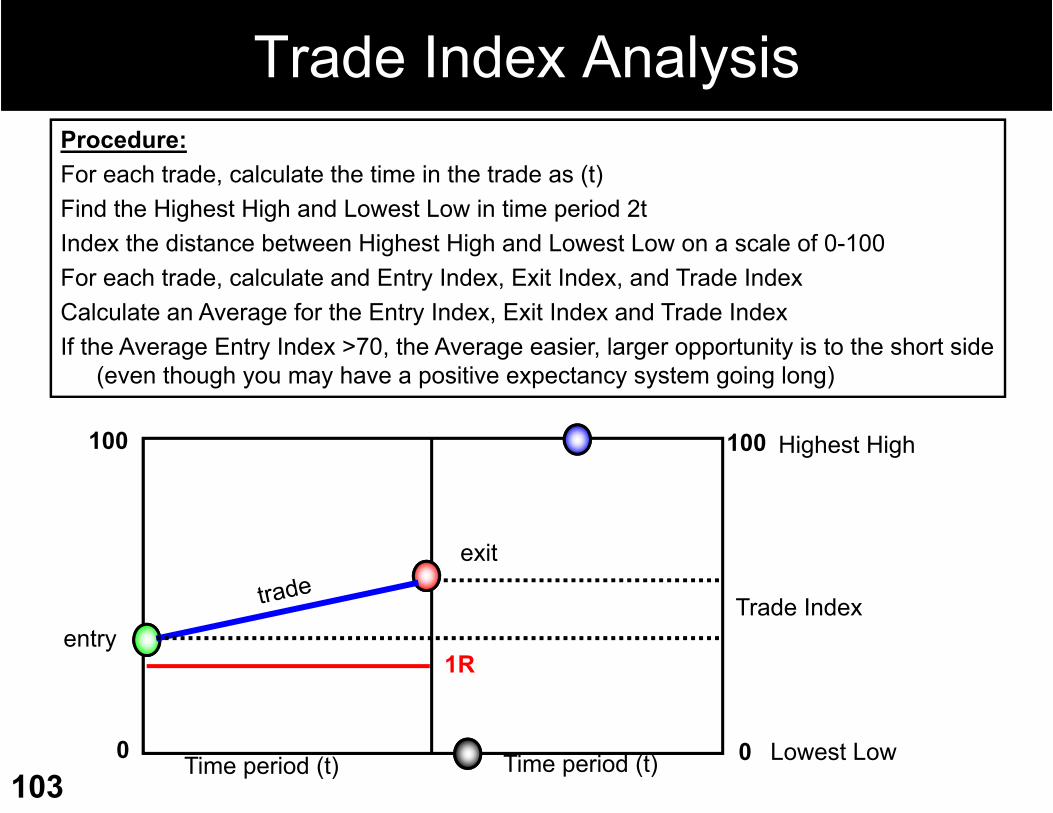
Trade Index AnalysisProcedure: For each trade, calculate the time in the trade as (t)Find the Highest High and Lowest Low in time period 2tIndex the distance between Highest High and Lowest Low on a scale of 0-100For each trade, calculate and Entry Index, Exit Index, and Trade IndexCalculate an Average for the Entry Index, Exit Index and Trade IndexIf the Average Entry Index >70, the Average easier, larger opportunity is to the short side
(even though you may have a positive expectancy system going long)
Highest High
Lowest Low
entry
exit
100
0 0
100
Trade Index
1R
Time period (t)Time period (t)
104
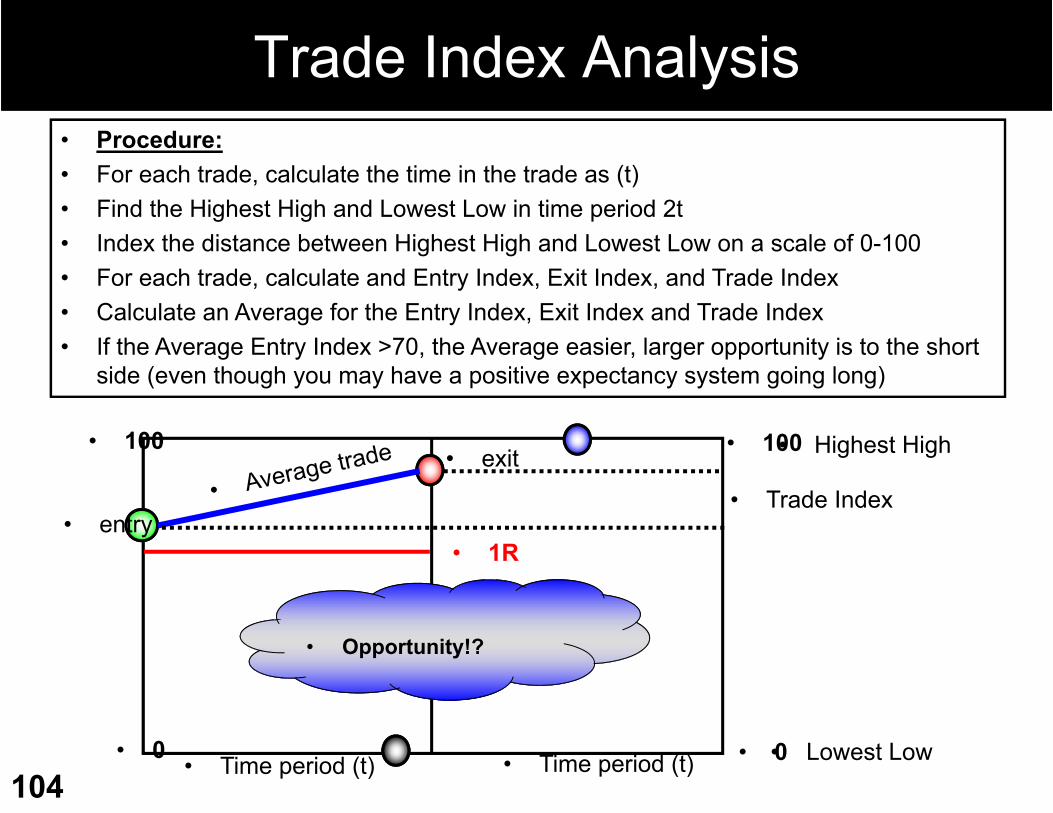
Trade Index Analysis• Procedure: • For each trade, calculate the time in the trade as (t)• Find the Highest High and Lowest Low in time period 2t• Index the distance between Highest High and Lowest Low on a scale of 0-100• For each trade, calculate and Entry Index, Exit Index, and Trade Index• Calculate an Average for the Entry Index, Exit Index and Trade Index• If the Average Entry Index >70, the Average easier, larger opportunity is to the short
side (even though you may have a positive expectancy system going long)
• Highest High
• Lowest Low
• entry
• exit• 100
• 0 • 0
• 100
• Trade Index
• 1R
• Time period (t)• Time period (t)
• Opportunity!?
105
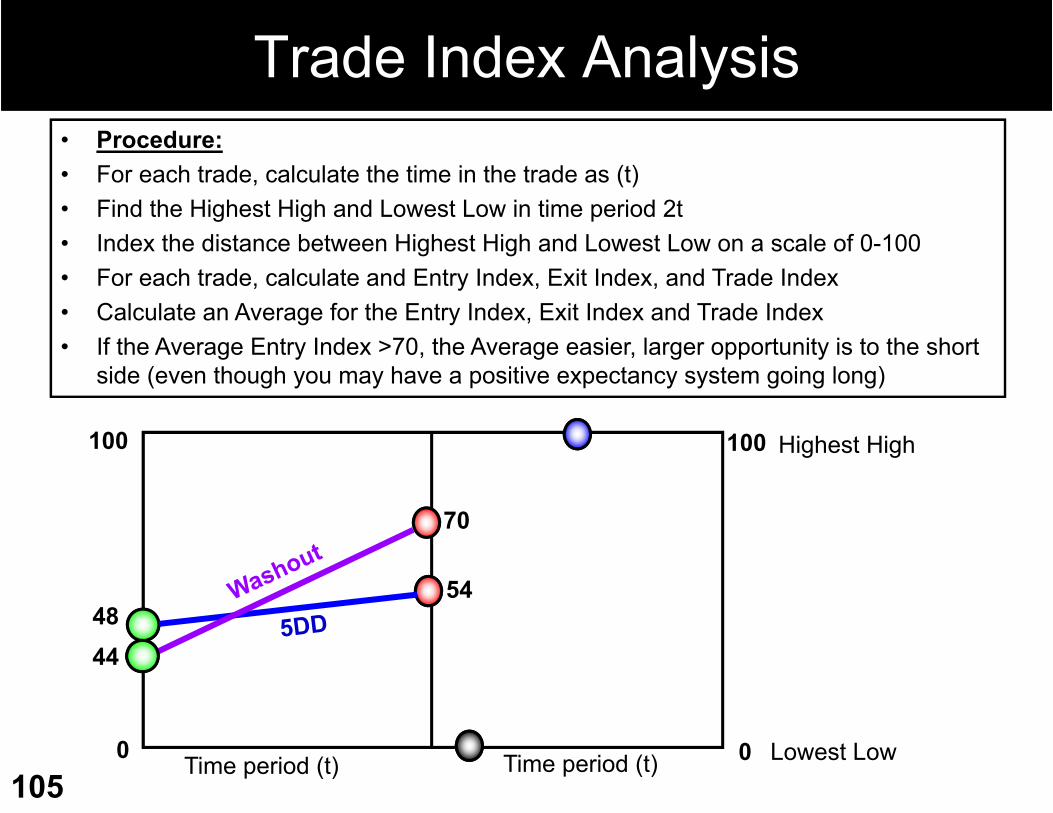
Trade Index Analysis• Procedure: • For each trade, calculate the time in the trade as (t)• Find the Highest High and Lowest Low in time period 2t• Index the distance between Highest High and Lowest Low on a scale of 0-100• For each trade, calculate and Entry Index, Exit Index, and Trade Index• Calculate an Average for the Entry Index, Exit Index and Trade Index• If the Average Entry Index >70, the Average easier, larger opportunity is to the short
side (even though you may have a positive expectancy system going long)
Highest High
Lowest Low
100
0 0
100
Time period (t)Time period (t)
4854
70
44
106
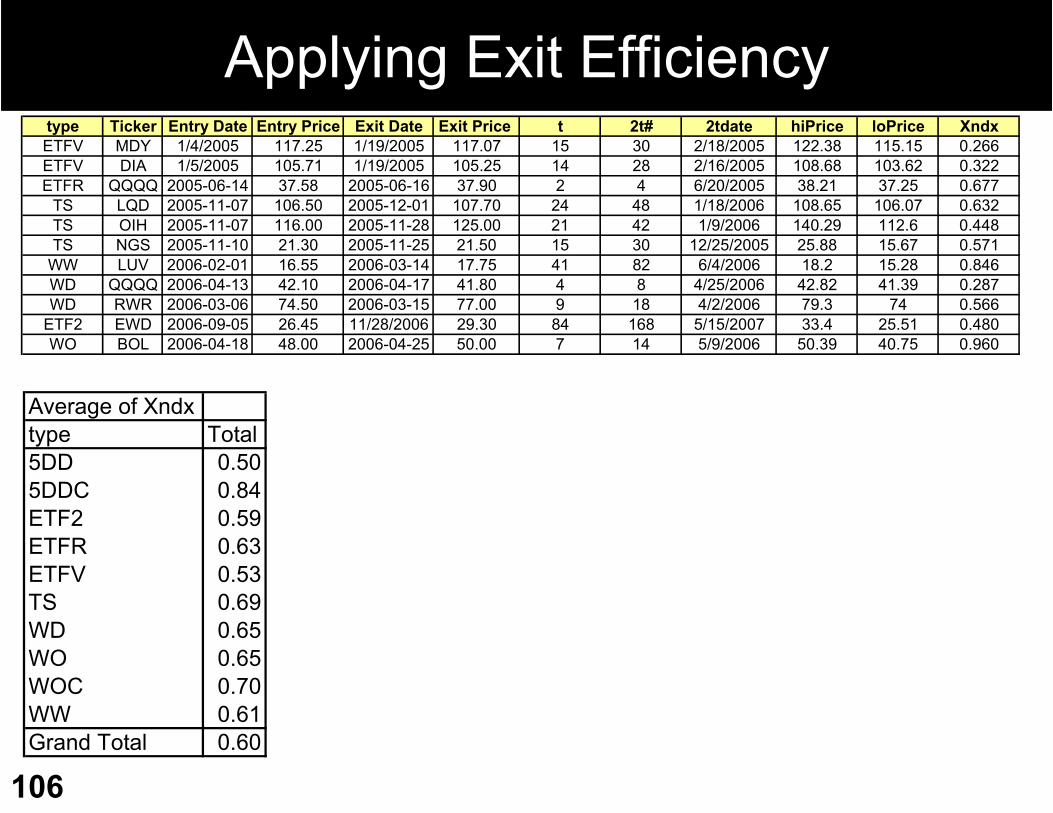
Applying Exit Efficiency
Average of Xndxtype Total5DD 0.505DDC 0.84ETF2 0.59ETFR 0.63ETFV 0.53TS 0.69WD 0.65WO 0.65WOC 0.70WW 0.61Grand Total 0.60
type Ticker Entry Date Entry Price Exit Date Exit Price t 2t# 2tdate hiPrice loPrice XndxETFV MDY 1/4/2005 117.25 1/19/2005 117.07 15 30 2/18/2005 122.38 115.15 0.266ETFV DIA 1/5/2005 105.71 1/19/2005 105.25 14 28 2/16/2005 108.68 103.62 0.322ETFR QQQQ 2005-06-14 37.58 2005-06-16 37.90 2 4 6/20/2005 38.21 37.25 0.677
TS LQD 2005-11-07 106.50 2005-12-01 107.70 24 48 1/18/2006 108.65 106.07 0.632TS OIH 2005-11-07 116.00 2005-11-28 125.00 21 42 1/9/2006 140.29 112.6 0.448TS NGS 2005-11-10 21.30 2005-11-25 21.50 15 30 12/25/2005 25.88 15.67 0.571
WW LUV 2006-02-01 16.55 2006-03-14 17.75 41 82 6/4/2006 18.2 15.28 0.846WD QQQQ 2006-04-13 42.10 2006-04-17 41.80 4 8 4/25/2006 42.82 41.39 0.287WD RWR 2006-03-06 74.50 2006-03-15 77.00 9 18 4/2/2006 79.3 74 0.566
ETF2 EWD 2006-09-05 26.45 11/28/2006 29.30 84 168 5/15/2007 33.4 25.51 0.480WO BOL 2006-04-18 48.00 2006-04-25 50.00 7 14 5/9/2006 50.39 40.75 0.960

107
Technique
108
109
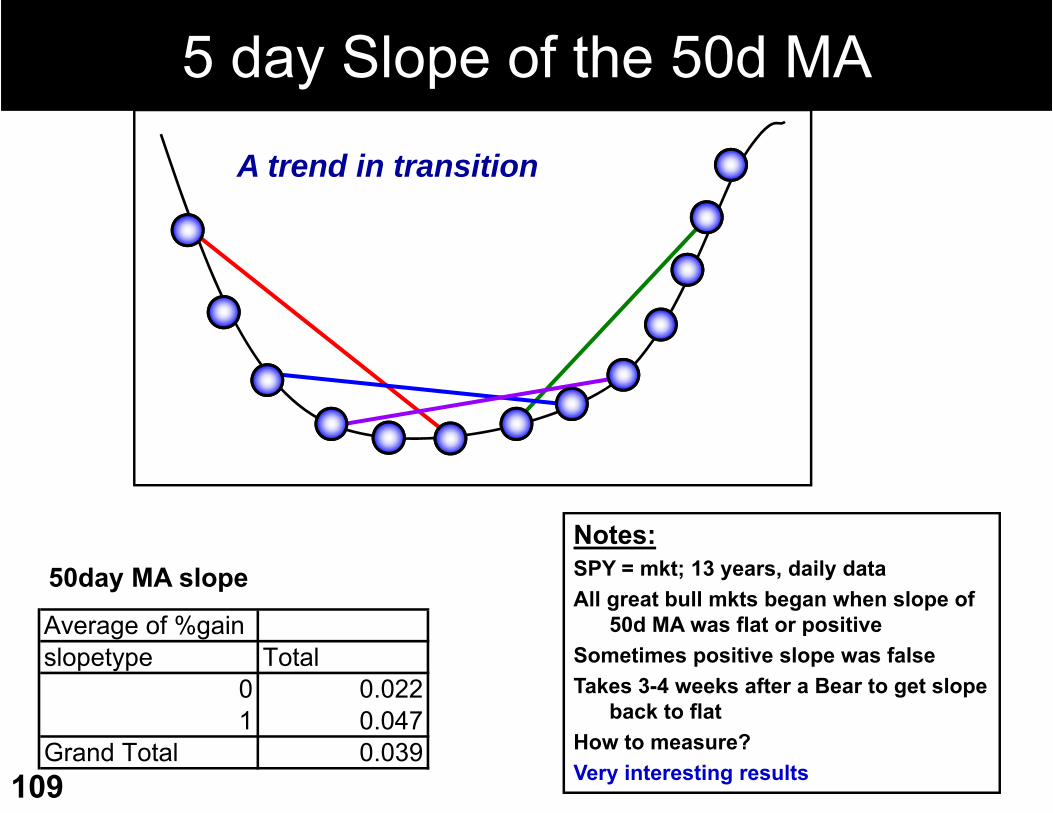
5 day Slope of the 50d MA
Average of %gainslopetype Total
0 0.0221 0.047
Grand Total 0.039
Notes:SPY = mkt; 13 years, daily dataAll great bull mkts began when slope of
50d MA was flat or positiveSometimes positive slope was falseTakes 3-4 weeks after a Bear to get slope
back to flatHow to measure?Very interesting results
50day MA slope
A trend in transition
110
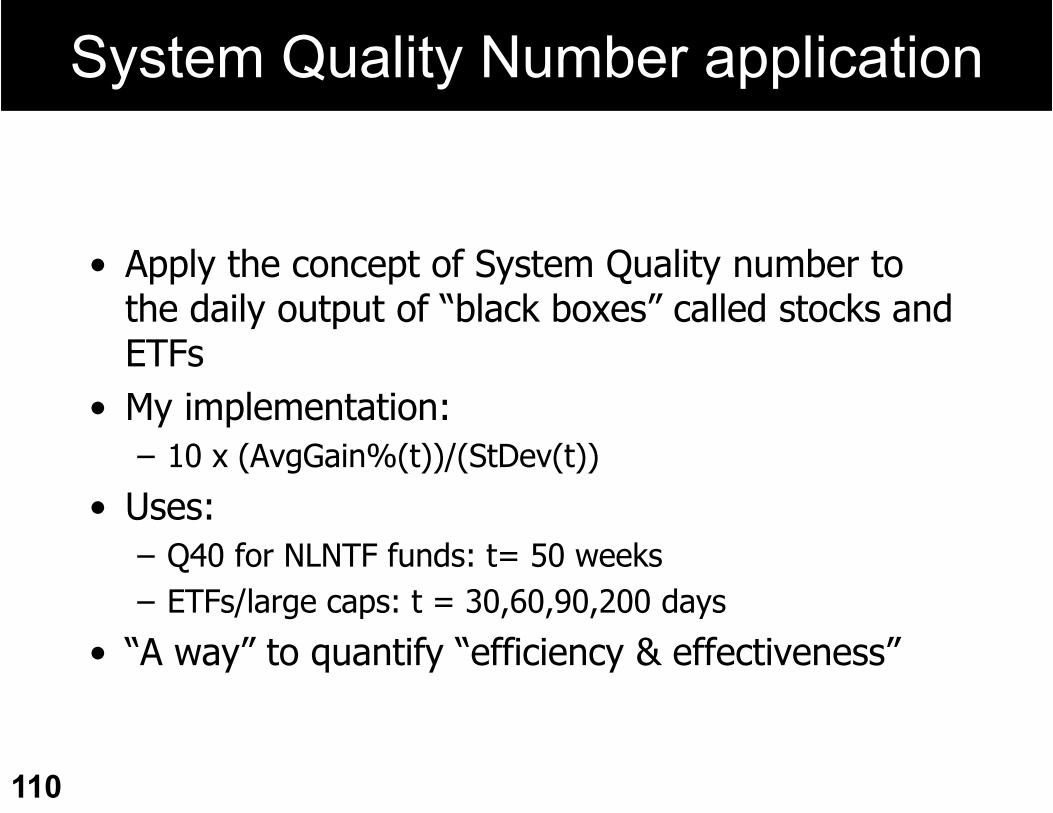
System Quality Number application
• Apply the concept of System Quality number to the daily output of “black boxes” called stocks and ETFs
• My implementation:– 10 x (AvgGain%(t))/(StDev(t))
• Uses:– Q40 for NLNTF funds: t= 50 weeks– ETFs/large caps: t = 30,60,90,200 days
• “A way” to quantify “efficiency & effectiveness”
111
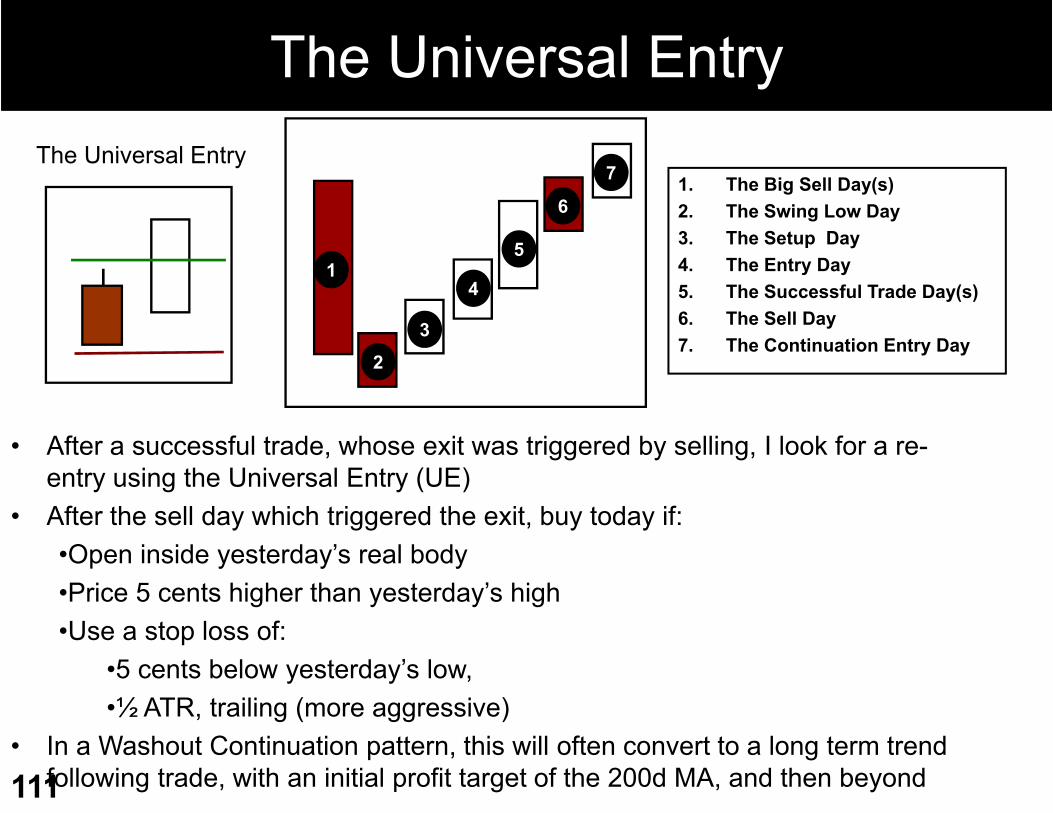
The Universal Entry
• After a successful trade, whose exit was triggered by selling, I look for a re-entry using the Universal Entry (UE)
• After the sell day which triggered the exit, buy today if:•Open inside yesterday’s real body•Price 5 cents higher than yesterday’s high•Use a stop loss of:
•5 cents below yesterday’s low, •½ ATR, trailing (more aggressive)
• In a Washout Continuation pattern, this will often convert to a long term trend following trade, with an initial profit target of the 200d MA, and then beyond
1. The Big Sell Day(s)2. The Swing Low Day3. The Setup Day4. The Entry Day5. The Successful Trade Day(s)6. The Sell Day7. The Continuation Entry Day
1
2
6
4
3
7
5
The Universal Entry

112
Risk Management
113
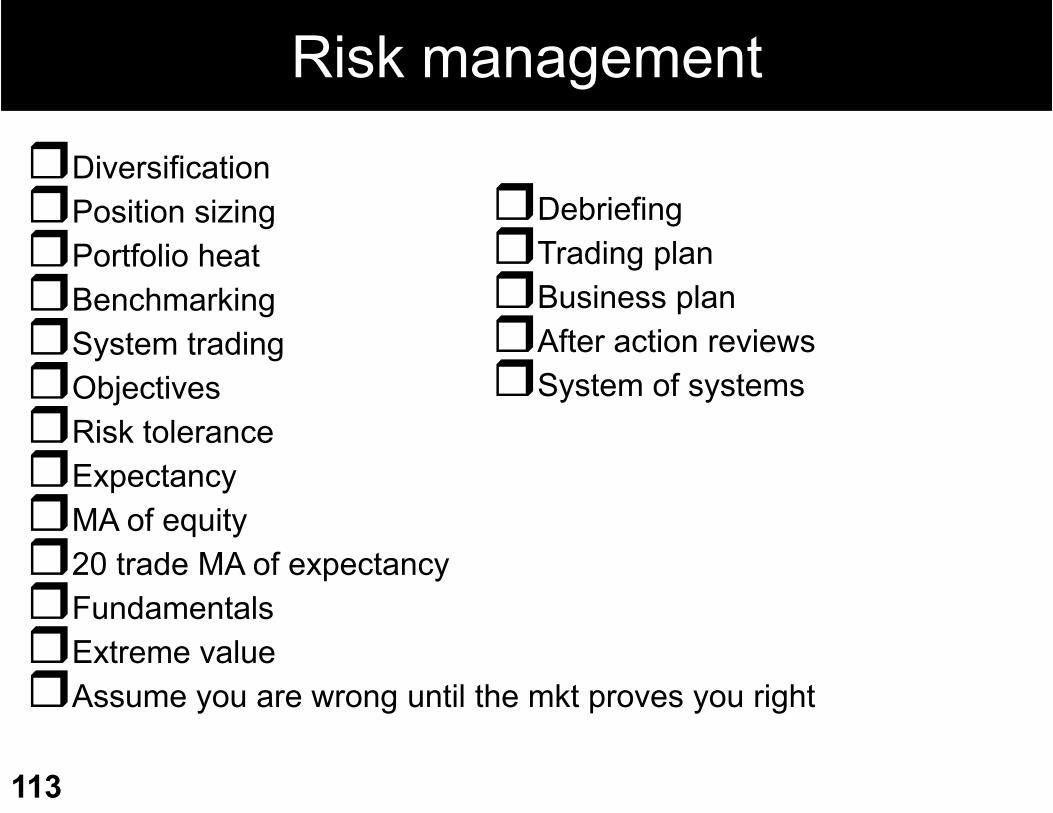
DiversificationPosition sizingPortfolio heatBenchmarkingSystem tradingObjectivesRisk toleranceExpectancyMA of equity20 trade MA of expectancyFundamentalsExtreme valueAssume you are wrong until the mkt proves you right
DebriefingTrading planBusiness planAfter action reviewsSystem of systems
Risk management
114
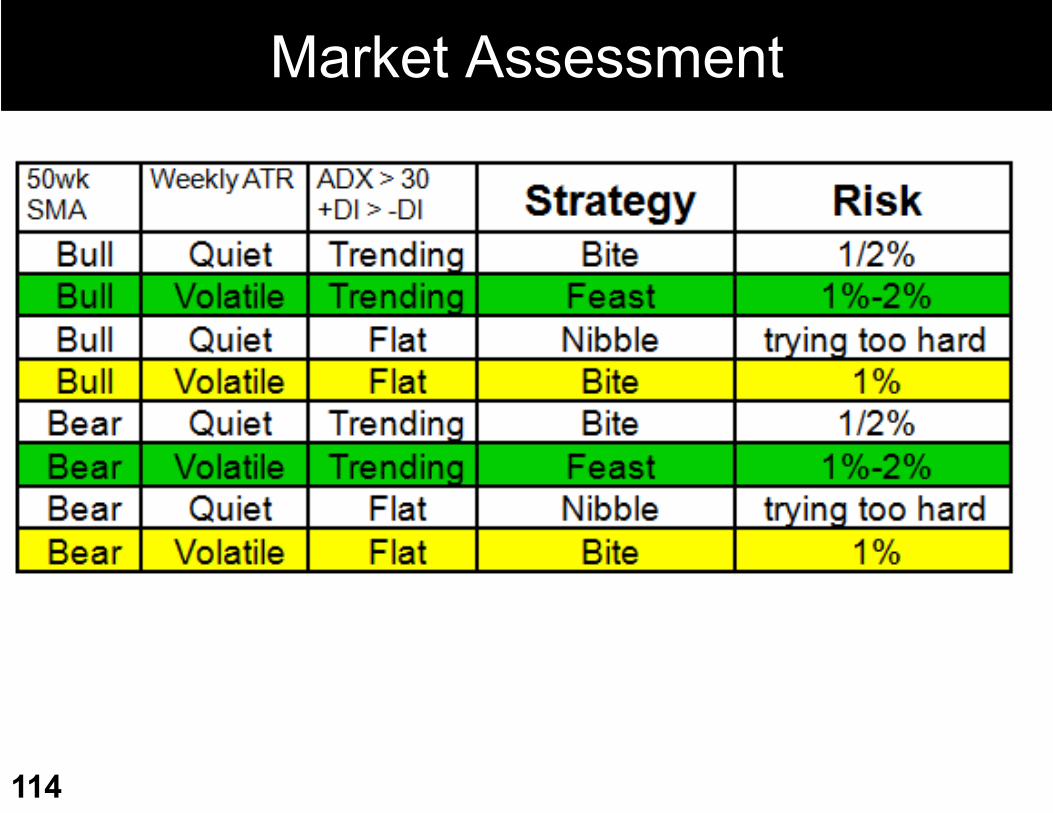
Market Assessment
115
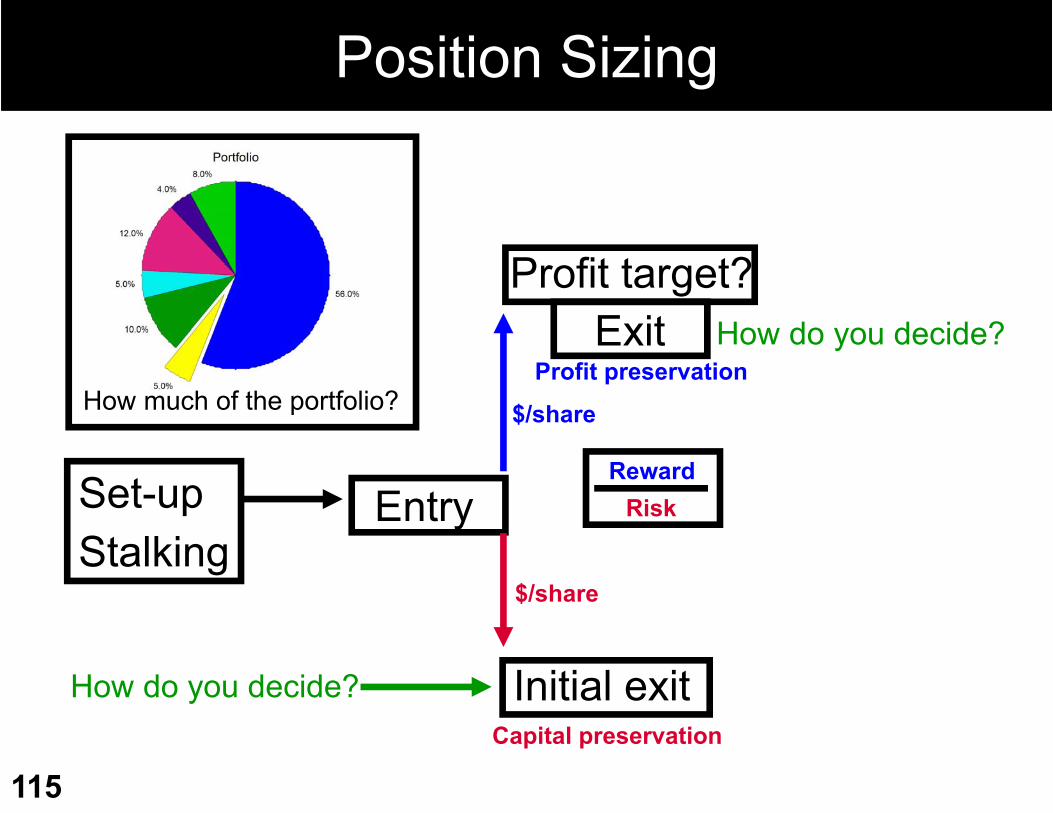
How much of the portfolio?
Set-upStalking
Entry
Initial exitCapital preservation
Profit preservationExit
Profit target?
$/share
$/share
RewardRisk
How do you decide?
How do you decide?
Position Sizing

Exercises
116
117
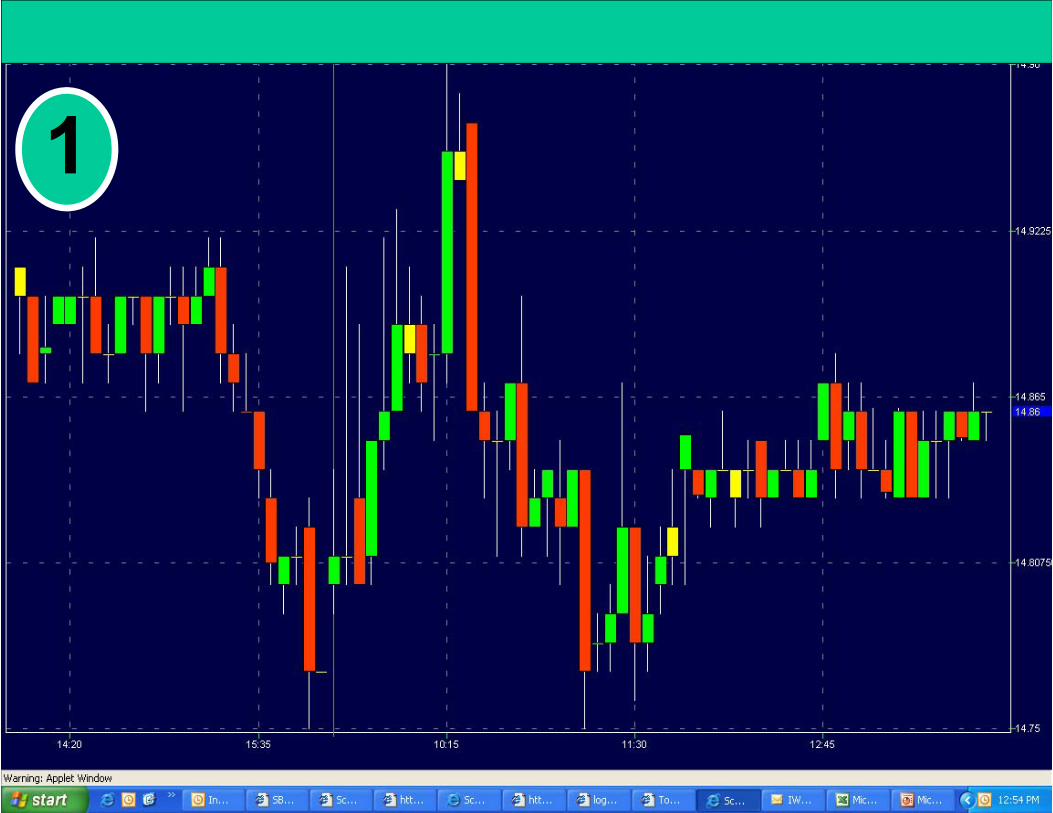
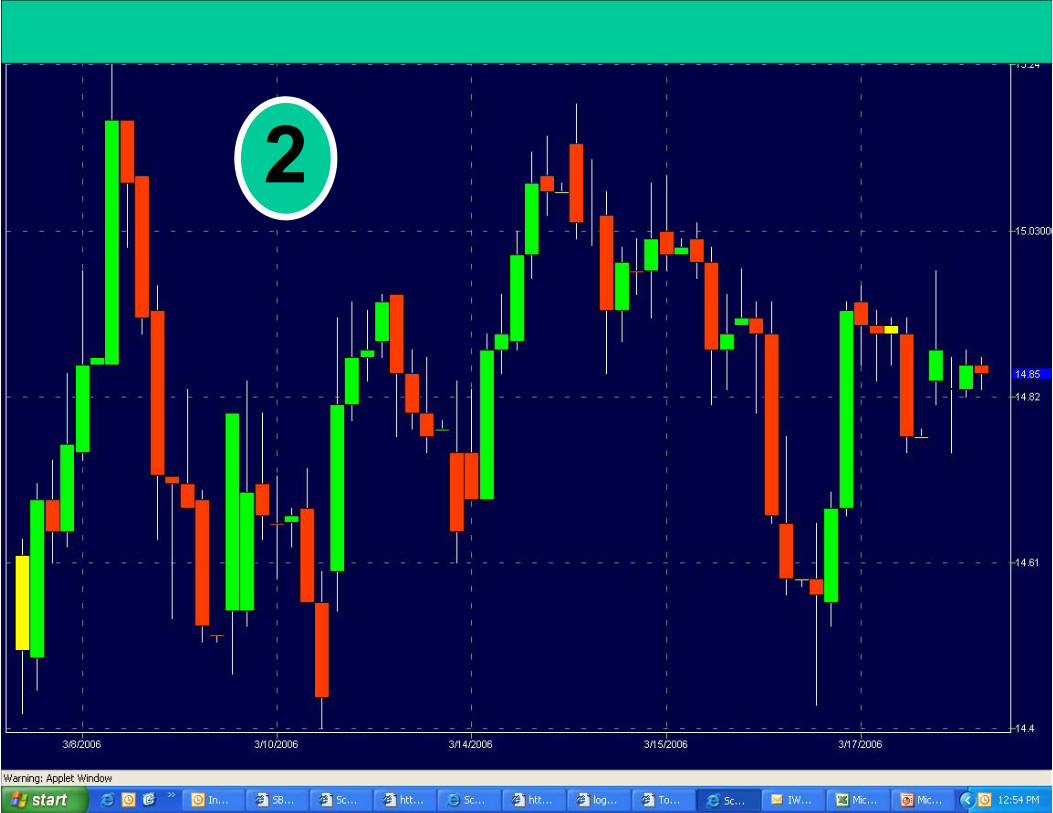
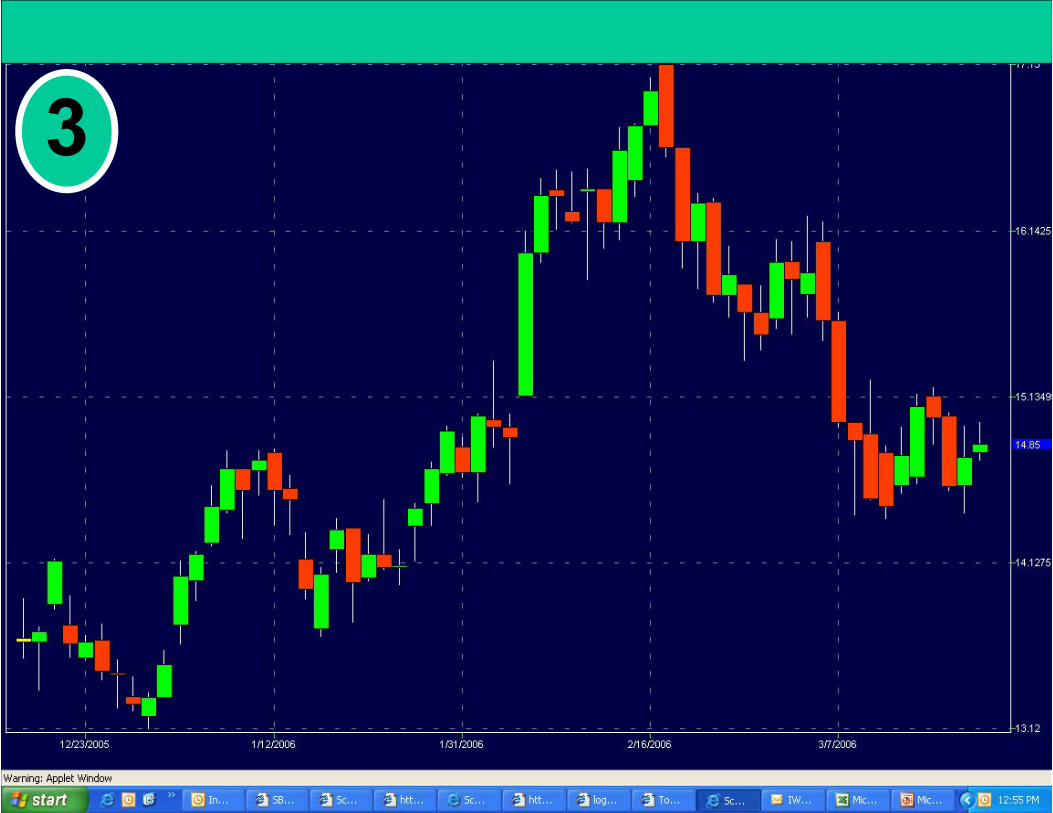
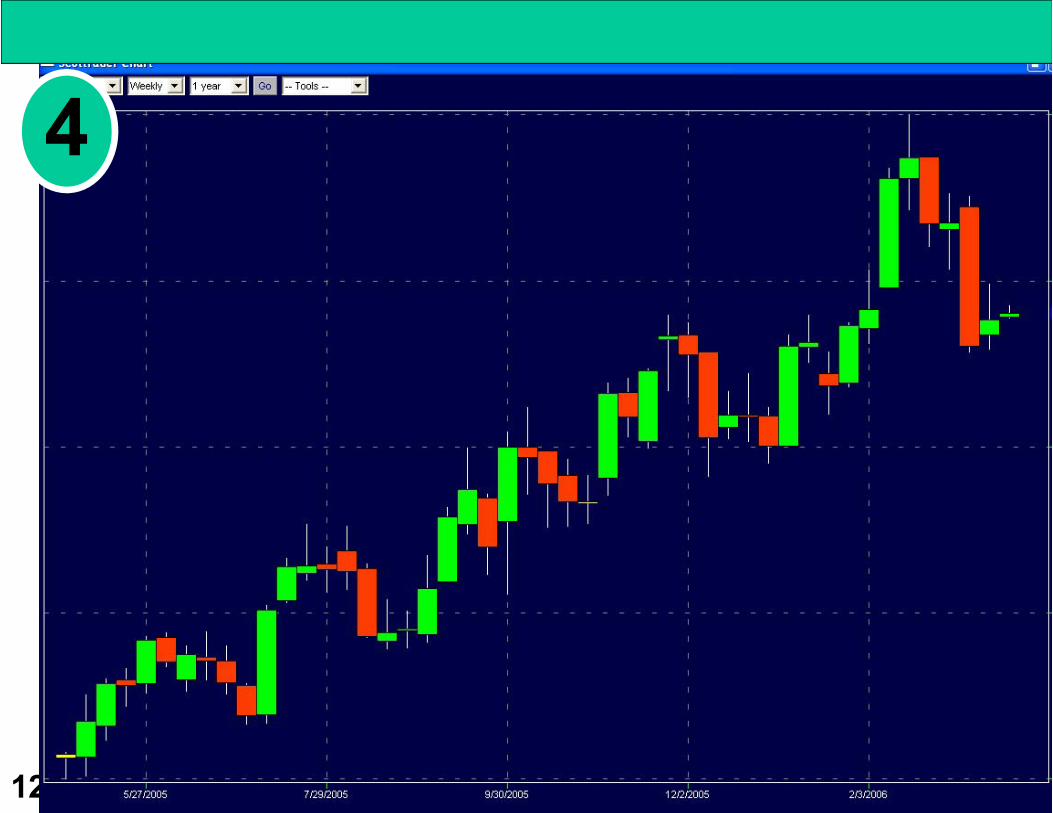
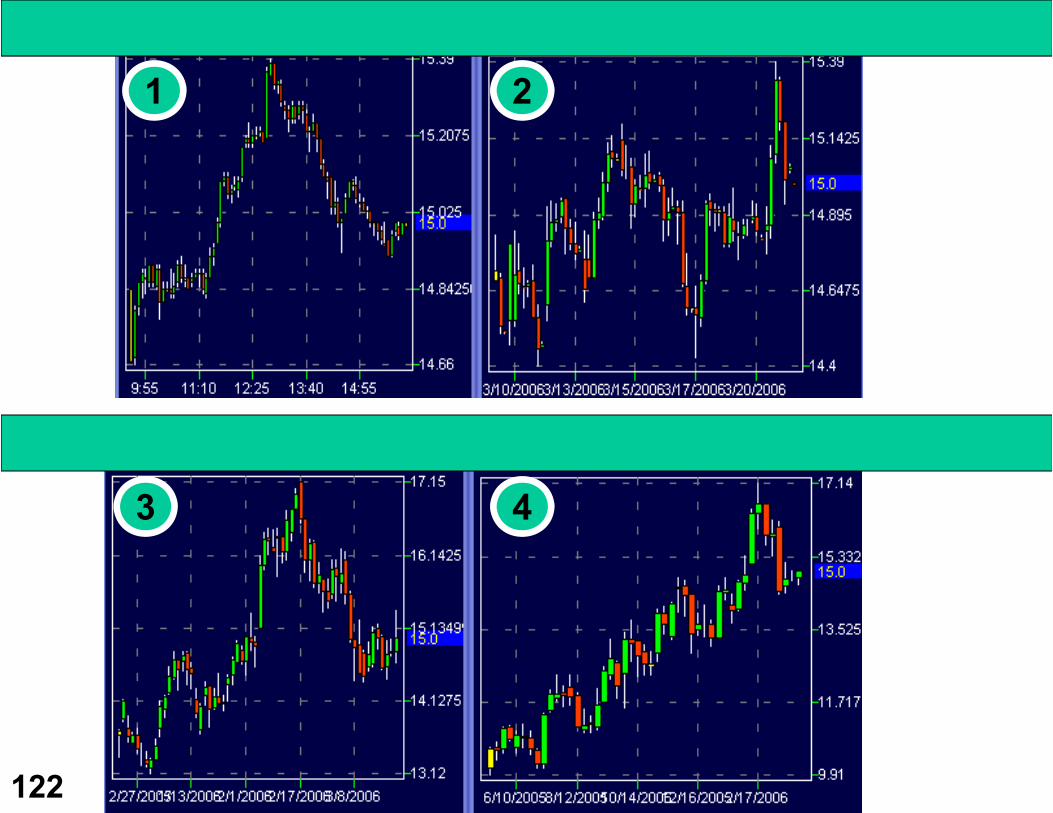
How do you feel about these charts?
• Like/dislike?• Long vs Short vs Stand Aside?• What will it do next?
118
1
119
2
120
3
121
4
122
1
43
2
123
124
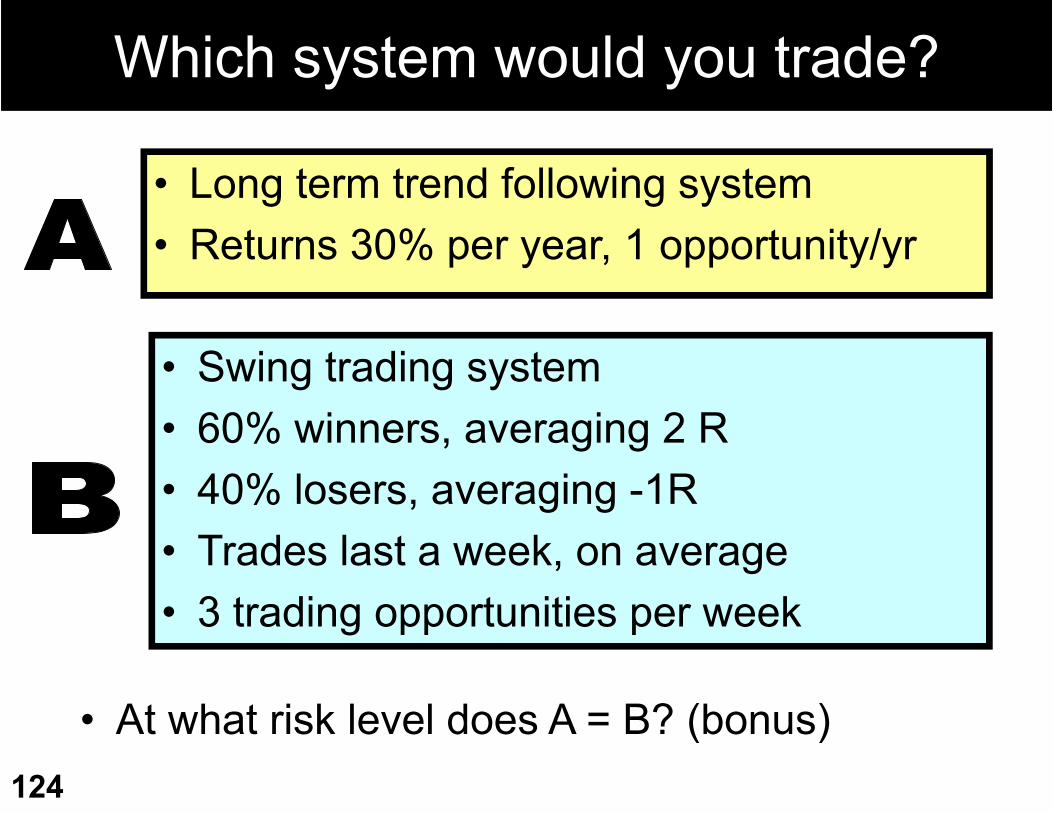
Which system would you trade?
• Long term trend following system• Returns 30% per year, 1 opportunity/yr
• Swing trading system• 60% winners, averaging 2 R• 40% losers, averaging -1R• Trades last a week, on average• 3 trading opportunities per week
• At what risk level does A = B? (bonus)

Range Stat
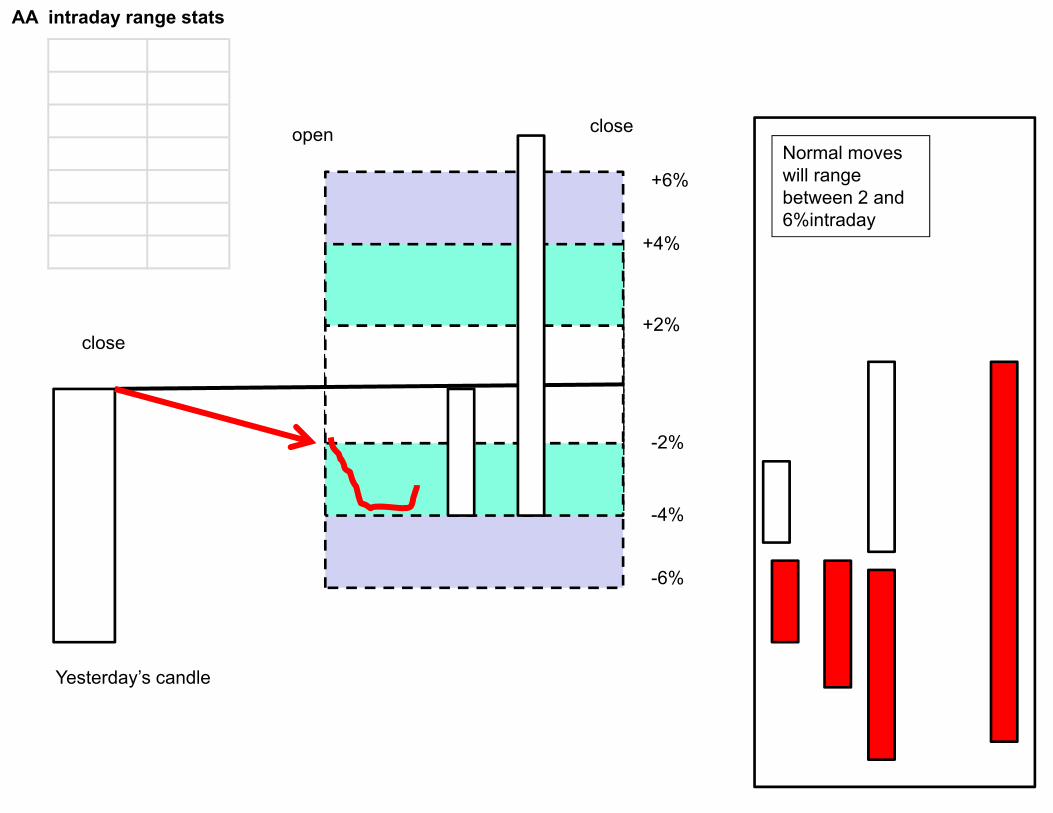
AA case study example of rangestat
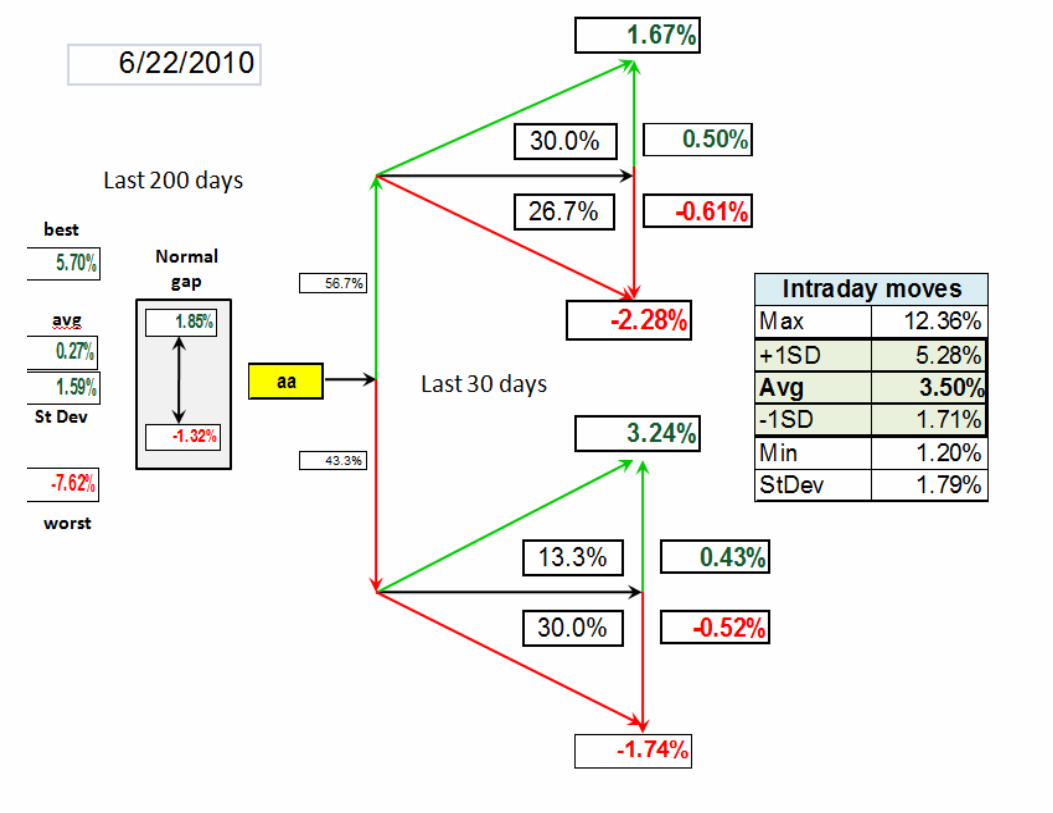
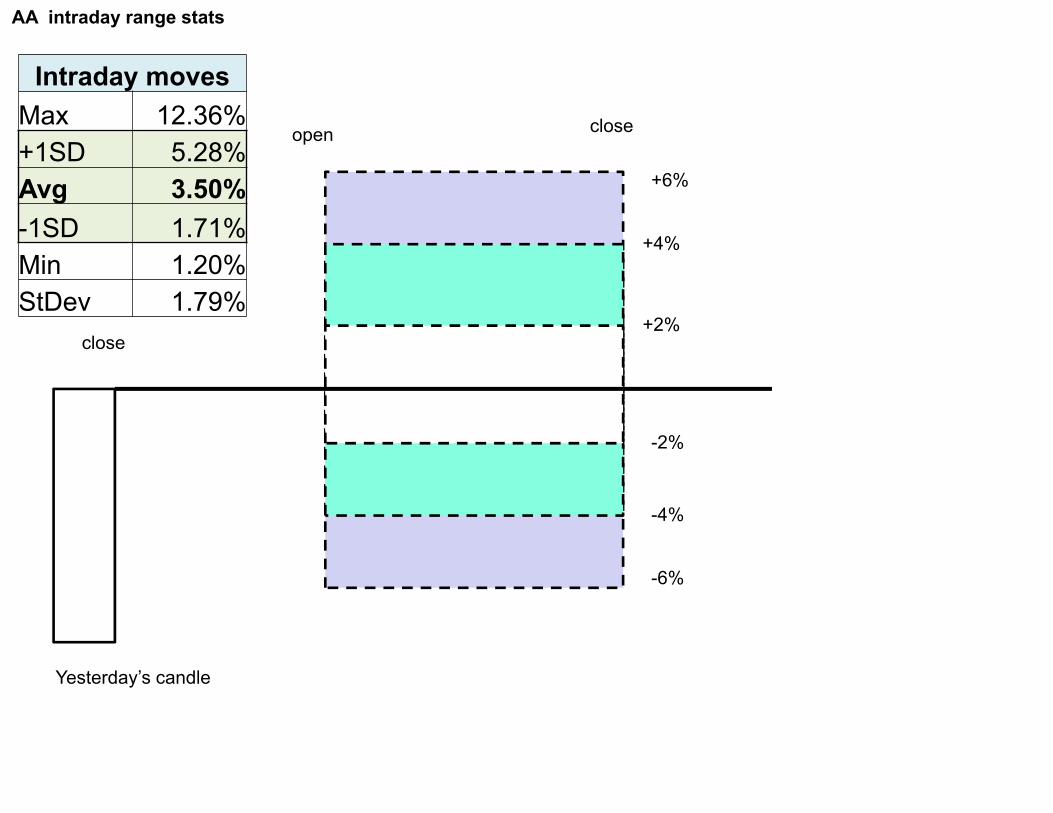
AA intraday range stats
+4%
+2%
+6%
-4%
-2%
-6%
closeopen
Yesterday’s candle
close
Intraday movesMax 12.36%+1SD 5.28%Avg 3.50%-1SD 1.71%Min 1.20%StDev 1.79%
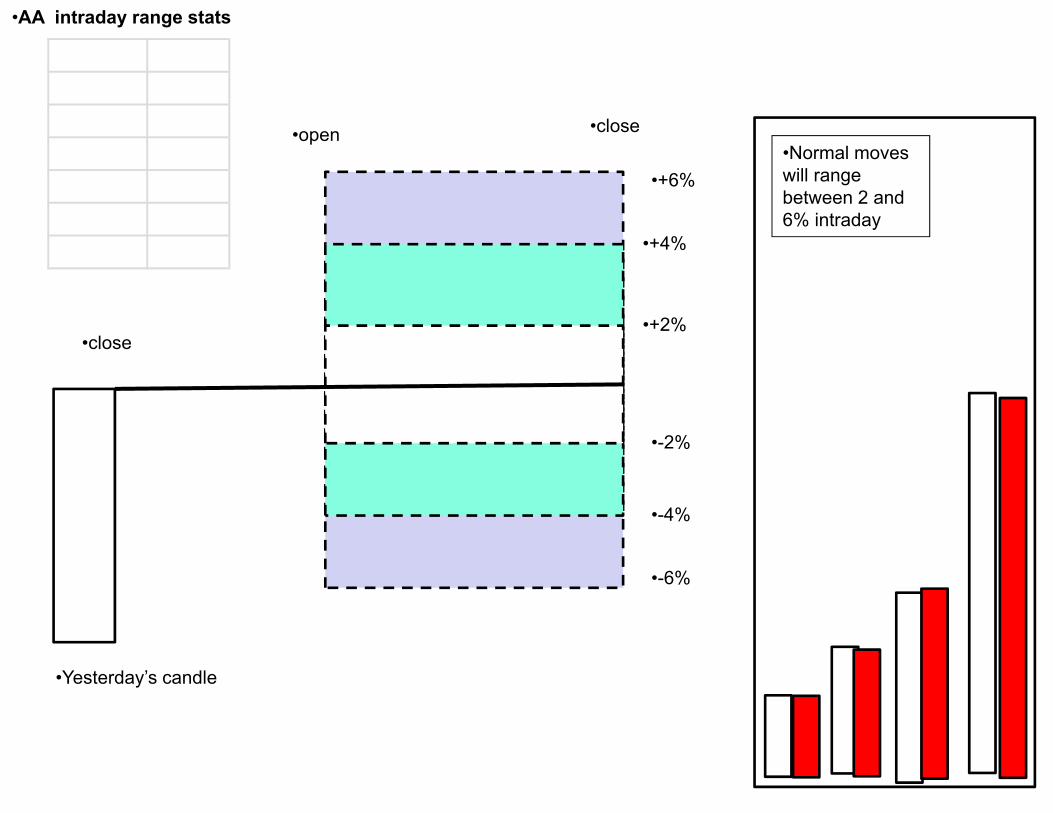
•AA intraday range stats
•+4%
•+2%
•+6%
•-4%
•-2%
•-6%
•close•open
•Yesterday’s candle
•close
•Normal moves will range between 2 and 6% intraday
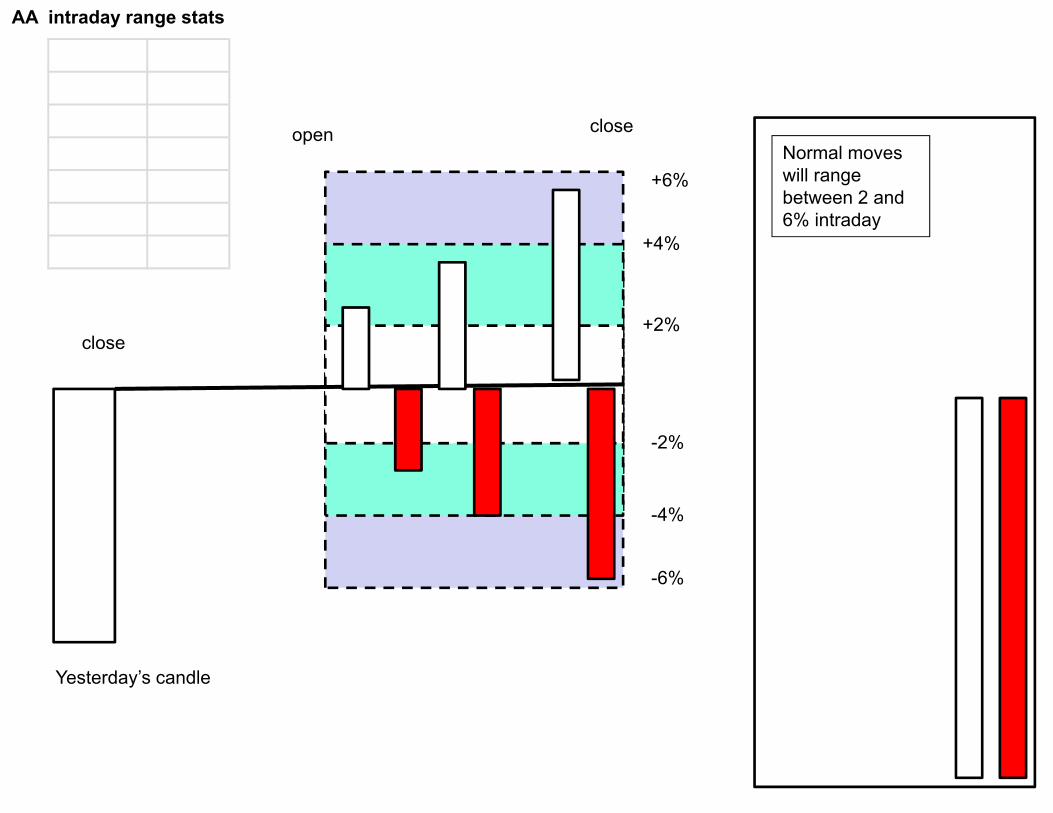
AA intraday range stats
+4%
+2%
+6%
-4%
-2%
-6%
closeopen
Yesterday’s candle
close
Normal moves will range between 2 and 6% intraday
AA intraday range stats
+4%
+2%
+6%
-4%
-2%
-6%
closeopen
Yesterday’s candle
close
Normal moves will range between 2 and 6%intraday
AA intraday range stats
+4%
+2%
+6%
-4%
-2%
-6%
closeopen
Yesterday’s candle
close
Normal moves will range between 2 and 6%intraday
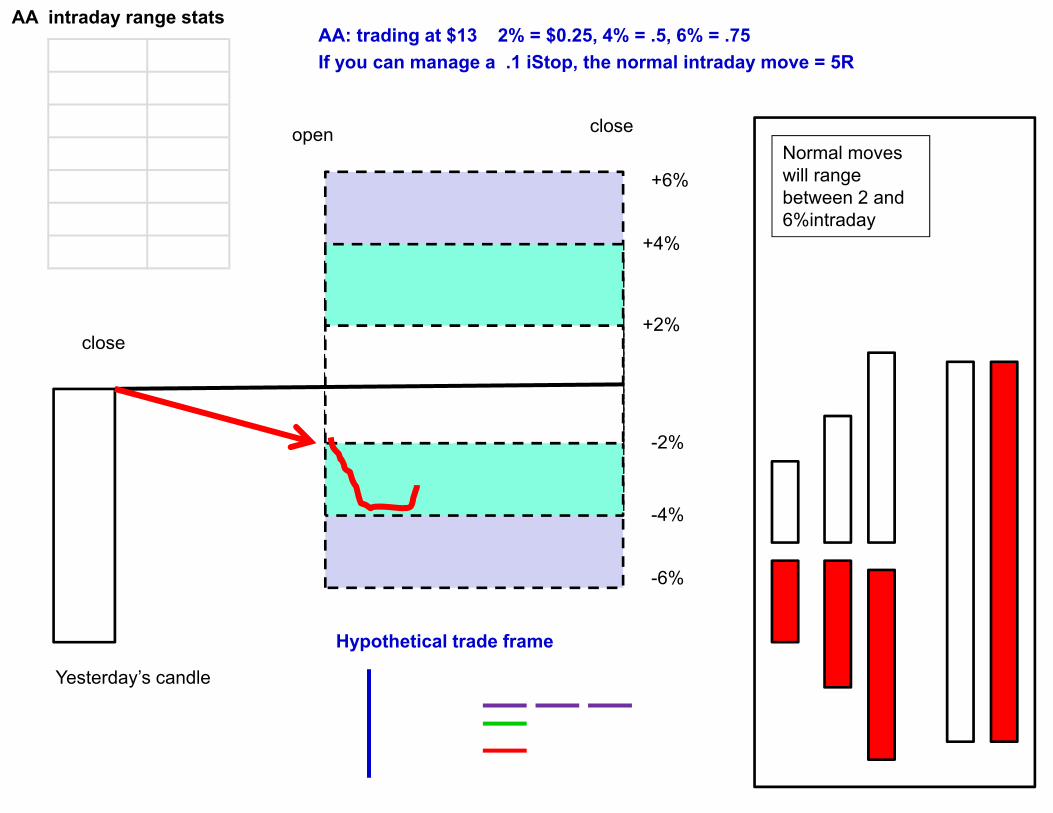
AA: trading at $13 2% = $0.25, 4% = .5, 6% = .75If you can manage a .1 iStop, the normal intraday move = 5R
Hypothetical trade frame
•AA intraday range stats
•+4%
•+2%
•+6%
•-4%
•-2%
•-6%
•close•open
•Yesterday’s candle
•close
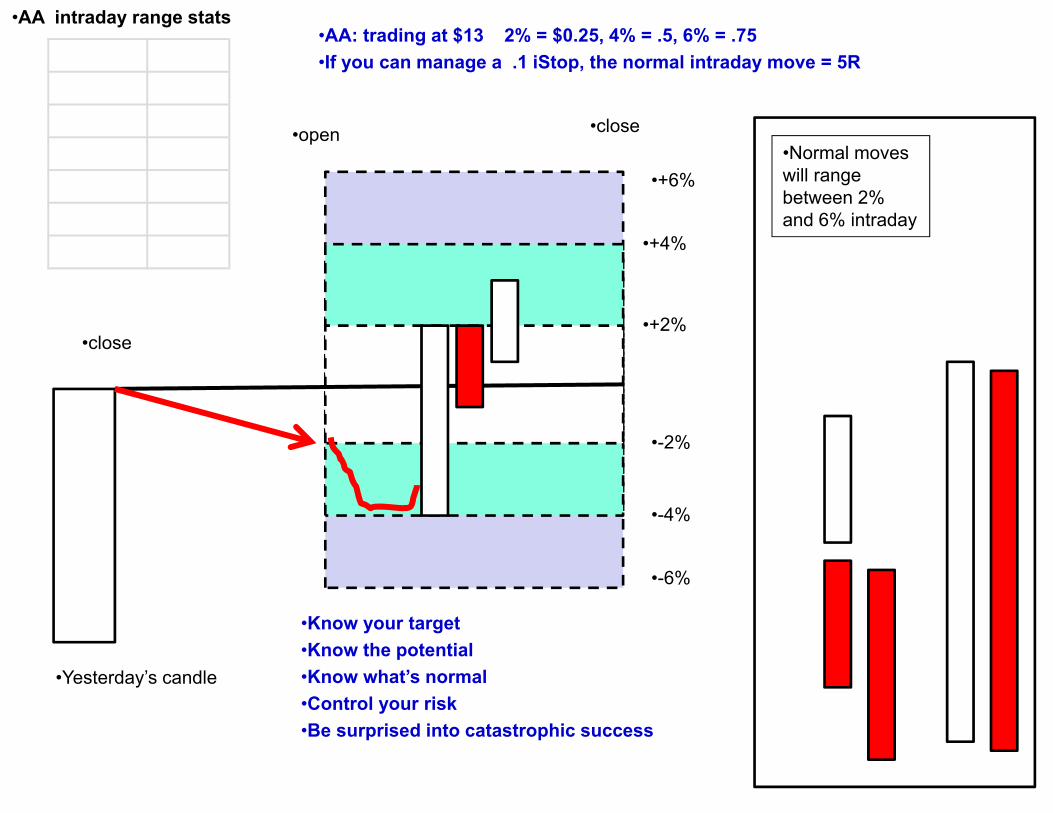
•Normal moves will range between 2% and 6% intraday
•AA: trading at $13 2% = $0.25, 4% = .5, 6% = .75•If you can manage a .1 iStop, the normal intraday move = 5R
•Know your target•Know the potential•Know what’s normal•Control your risk•Be surprised into catastrophic success
134
•Who are you?•What are you trading today?•Finalize your trading plan•Brief overview of your strategy for the day
•Use your trade log, document trades•Take screen shots of frames/entries/decisions/exits (case study)•1 member of the group monitor SPY//try to trade SPY (virtually)•“Attention on Deck” if you see something or have an observation•Every 30 minutes we will summarize
Logic chain
135
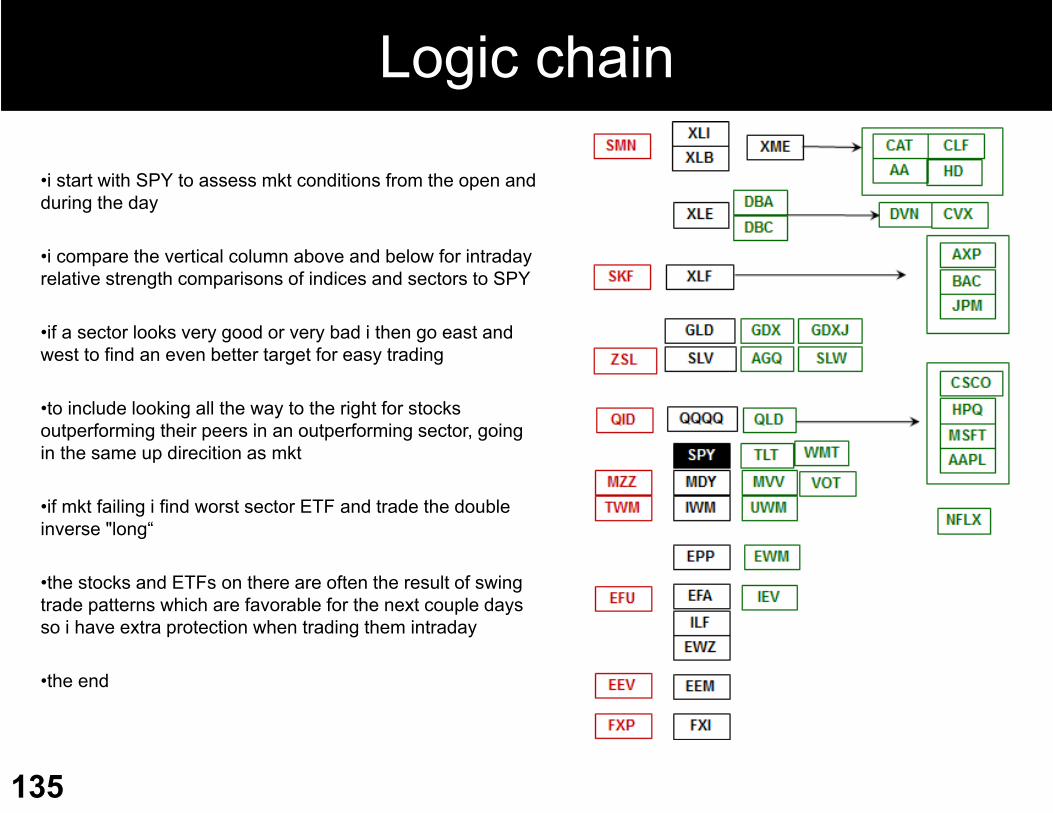
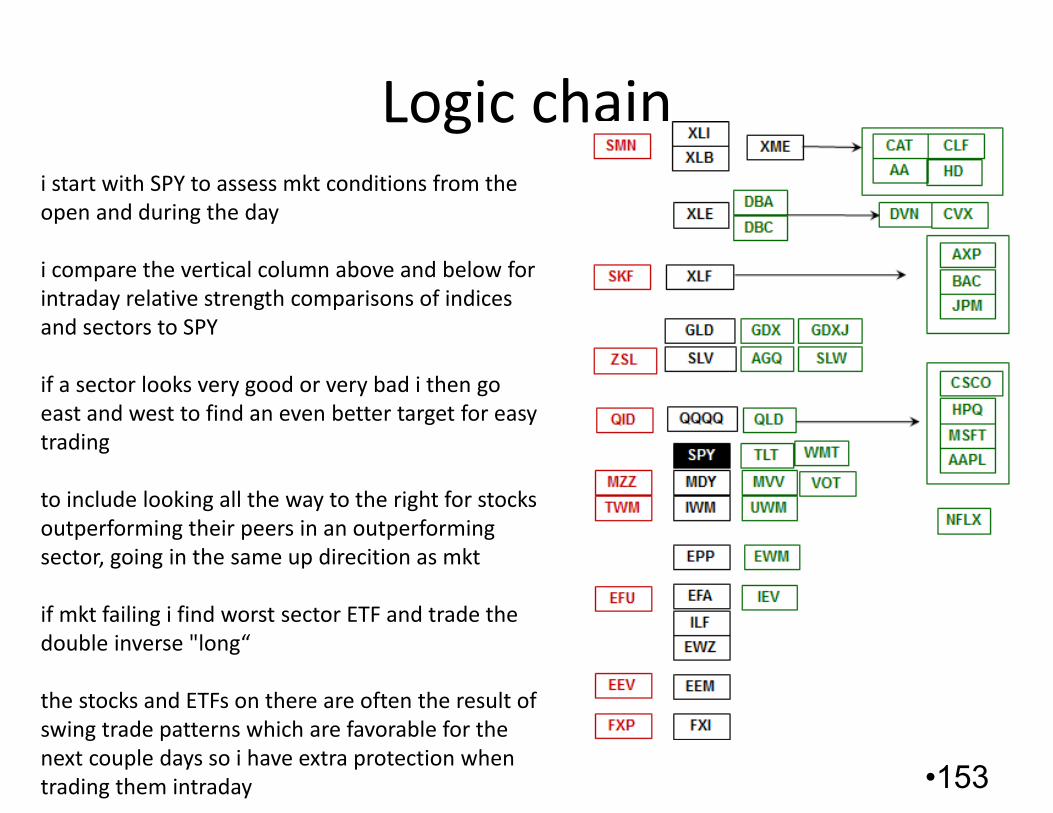
•i start with SPY to assess mkt conditions from the open and during the day
•i compare the vertical column above and below for intraday relative strength comparisons of indices and sectors to SPY
•if a sector looks very good or very bad i then go east and west to find an even better target for easy trading
•to include looking all the way to the right for stocks outperforming their peers in an outperforming sector, going in the same up direcition as mkt
•if mkt failing i find worst sector ETF and trade the double inverse "long“
•the stocks and ETFs on there are often the result of swing trade patterns which are favorable for the next couple days so i have extra protection when trading them intraday
•the end

136
Research Program
137
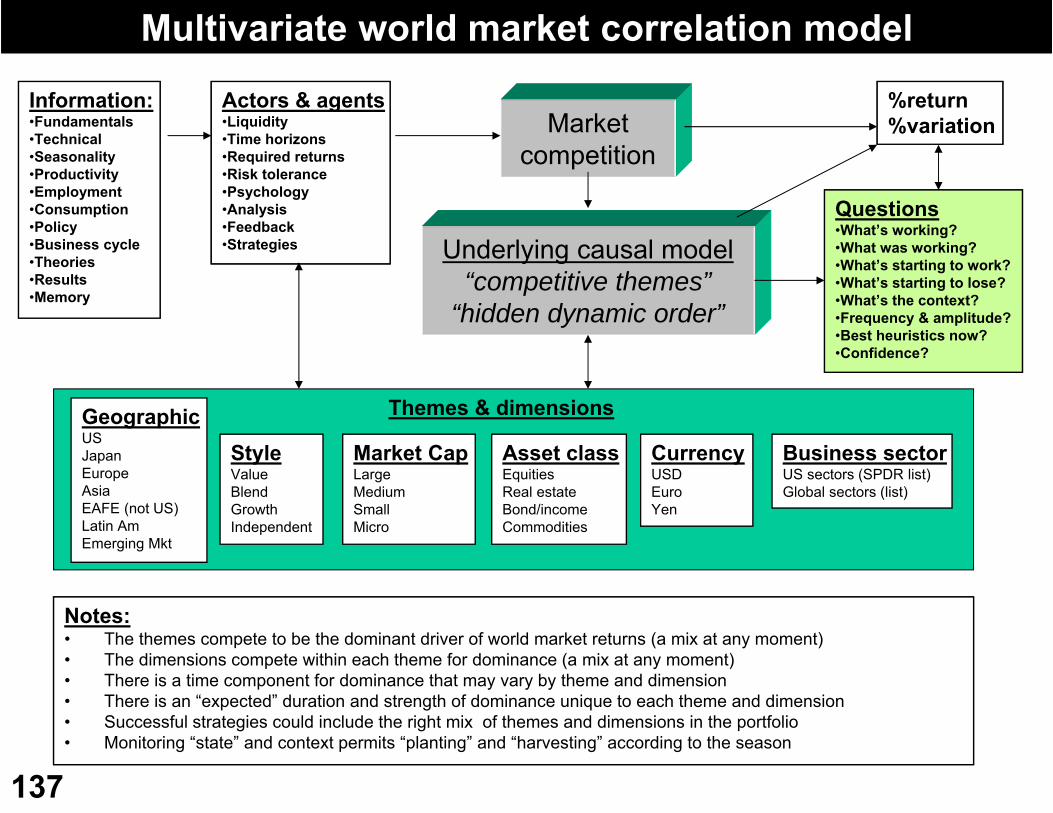
Multivariate world market correlation model
Underlying causal model“competitive themes”
“hidden dynamic order”
GeographicUSJapanEuropeAsiaEAFE (not US)Latin AmEmerging Mkt
Business sectorUS sectors (SPDR list)Global sectors (list)
StyleValueBlendGrowthIndependent
Market CapLargeMediumSmallMicro
Asset classEquitiesReal estateBond/incomeCommodities
CurrencyUSDEuroYen
Themes & dimensions
Notes:• The themes compete to be the dominant driver of world market returns (a mix at any moment)• The dimensions compete within each theme for dominance (a mix at any moment)• There is a time component for dominance that may vary by theme and dimension • There is an “expected” duration and strength of dominance unique to each theme and dimension• Successful strategies could include the right mix of themes and dimensions in the portfolio• Monitoring “state” and context permits “planting” and “harvesting” according to the season
%return%variation
Information:•Fundamentals•Technical•Seasonality•Productivity•Employment•Consumption•Policy•Business cycle•Theories•Results•Memory
Actors & agents•Liquidity•Time horizons•Required returns•Risk tolerance•Psychology•Analysis•Feedback•Strategies
Market competition
Questions•What’s working?•What was working?•What’s starting to work?•What’s starting to lose?•What’s the context?•Frequency & amplitude?•Best heuristics now?•Confidence?
138
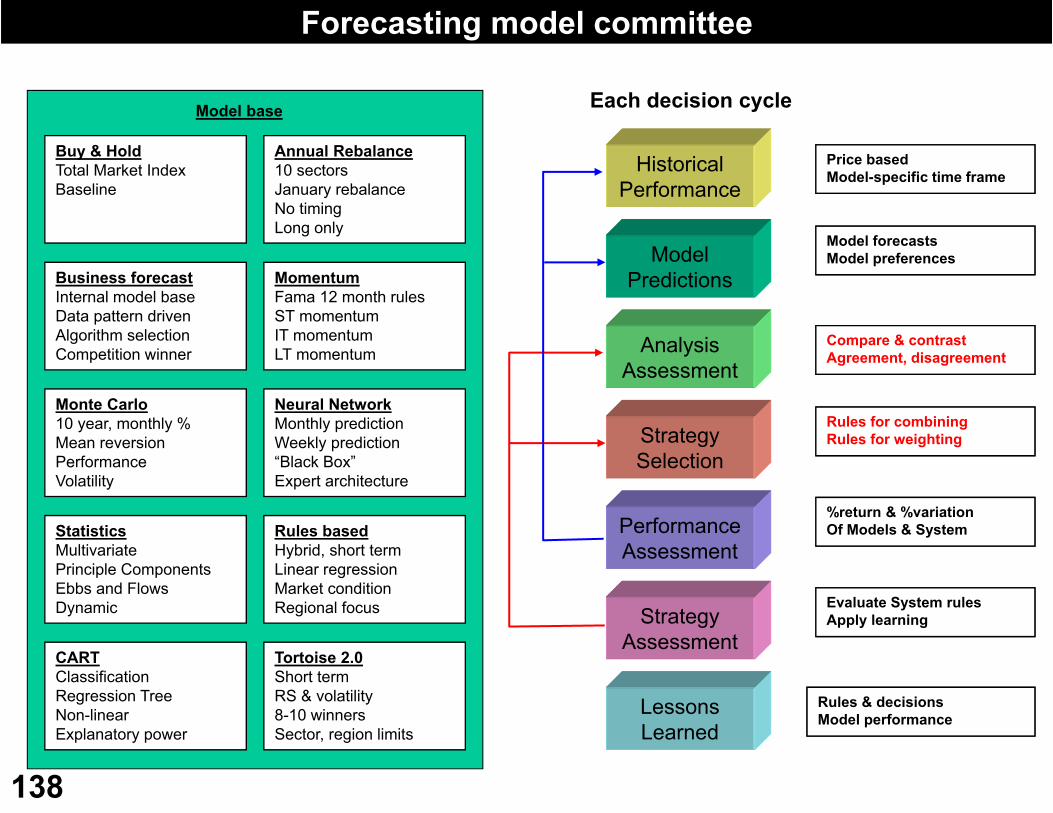
Forecasting model committee
StatisticsMultivariatePrinciple ComponentsEbbs and FlowsDynamic
Model base
Tortoise 2.0Short termRS & volatility8-10 winnersSector, region limits
Business forecast Internal model baseData pattern drivenAlgorithm selectionCompetition winner
Monte Carlo 10 year, monthly %Mean reversionPerformanceVolatility
Rules basedHybrid, short termLinear regressionMarket conditionRegional focus
Neural Network Monthly predictionWeekly prediction“Black Box”Expert architecture
CART ClassificationRegression TreeNon-linearExplanatory power
Momentum Fama 12 month rulesST momentumIT momentumLT momentum
Annual Rebalance10 sectorsJanuary rebalanceNo timingLong only
Buy & HoldTotal Market IndexBaseline
Model Predictions
HistoricalPerformance
AnalysisAssessment
Strategy Selection
PerformanceAssessment
StrategyAssessment
Lessons Learned
%return & %variationOf Models & System
Model forecasts Model preferences
Price basedModel-specific time frame
Rules for combining Rules for weighting
Compare & contrastAgreement, disagreement
Rules & decisionsModel performance
Evaluate System rulesApply learning
Each decision cycle
139
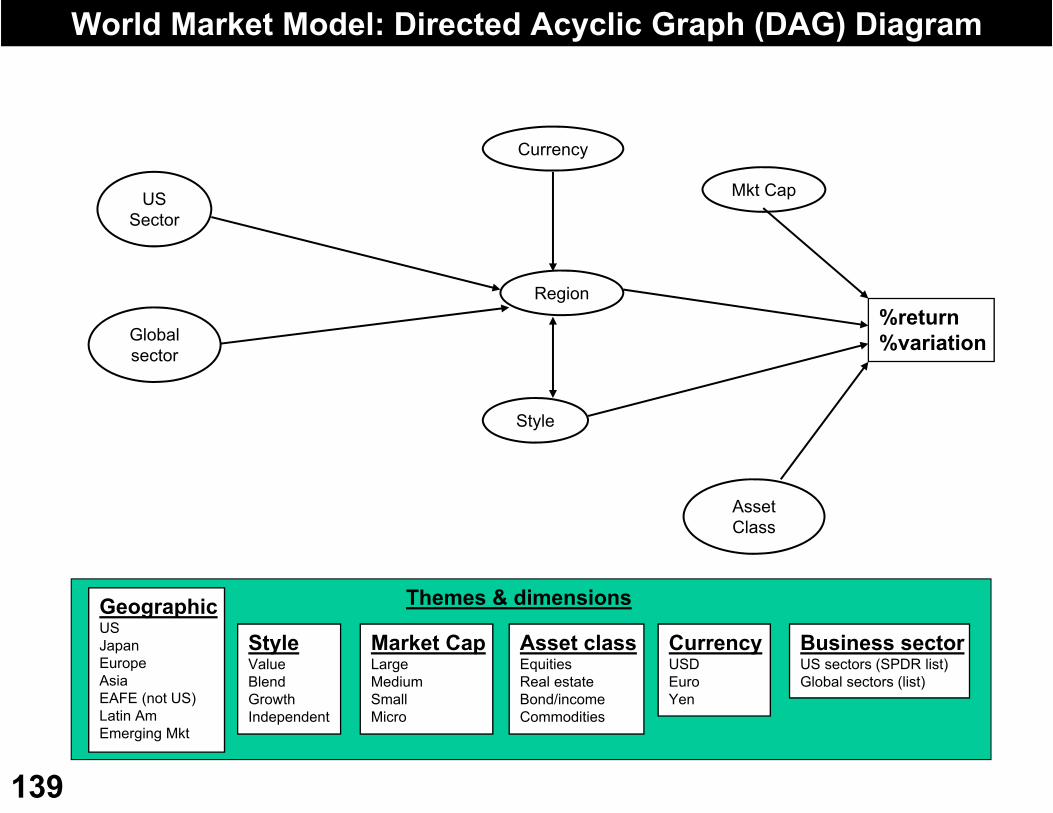
World Market Model: Directed Acyclic Graph (DAG) Diagram
%return%variation
Region
GeographicUSJapanEuropeAsiaEAFE (not US)Latin AmEmerging Mkt
Business sectorUS sectors (SPDR list)Global sectors (list)
StyleValueBlendGrowthIndependent
Market CapLargeMediumSmallMicro
Asset classEquitiesReal estateBond/incomeCommodities
CurrencyUSDEuroYen
Themes & dimensions
Currency
Global sector
Style
Mkt Cap
Asset Class
US Sector
140
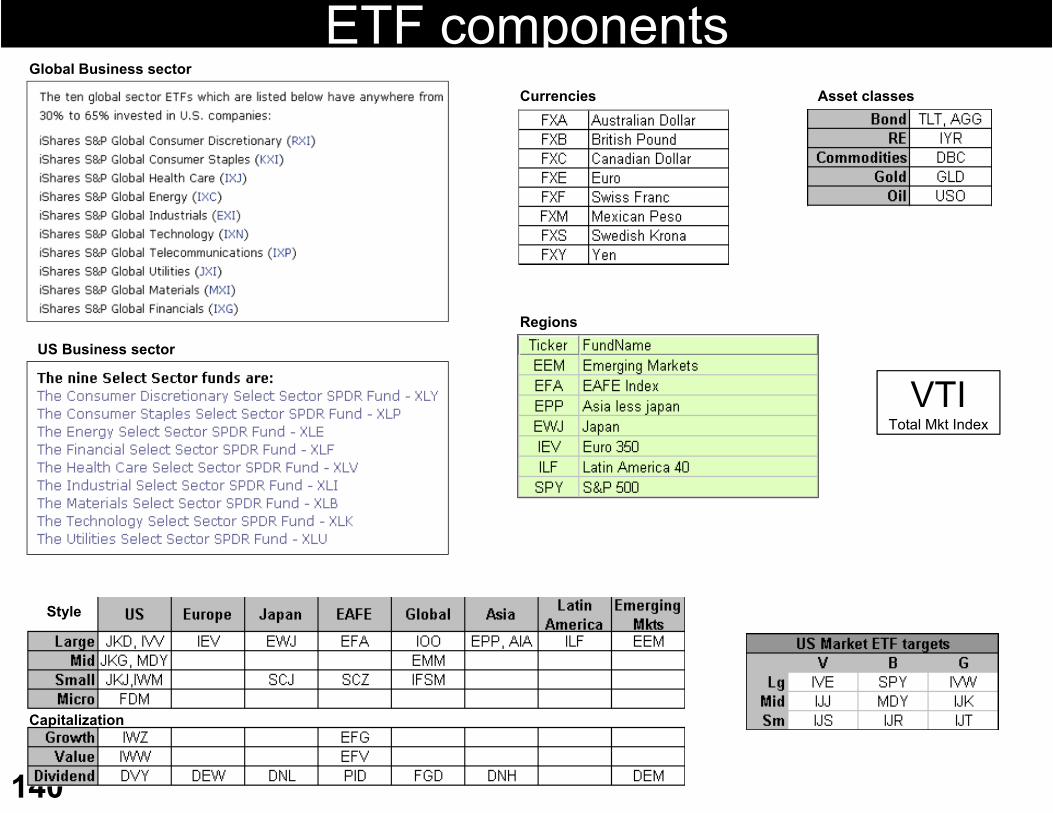
ETF components
VTITotal Mkt Index
US Business sector
Global Business sector
Asset classes
Regions
Currencies
Style
Capitalization
Live Trading
Stats
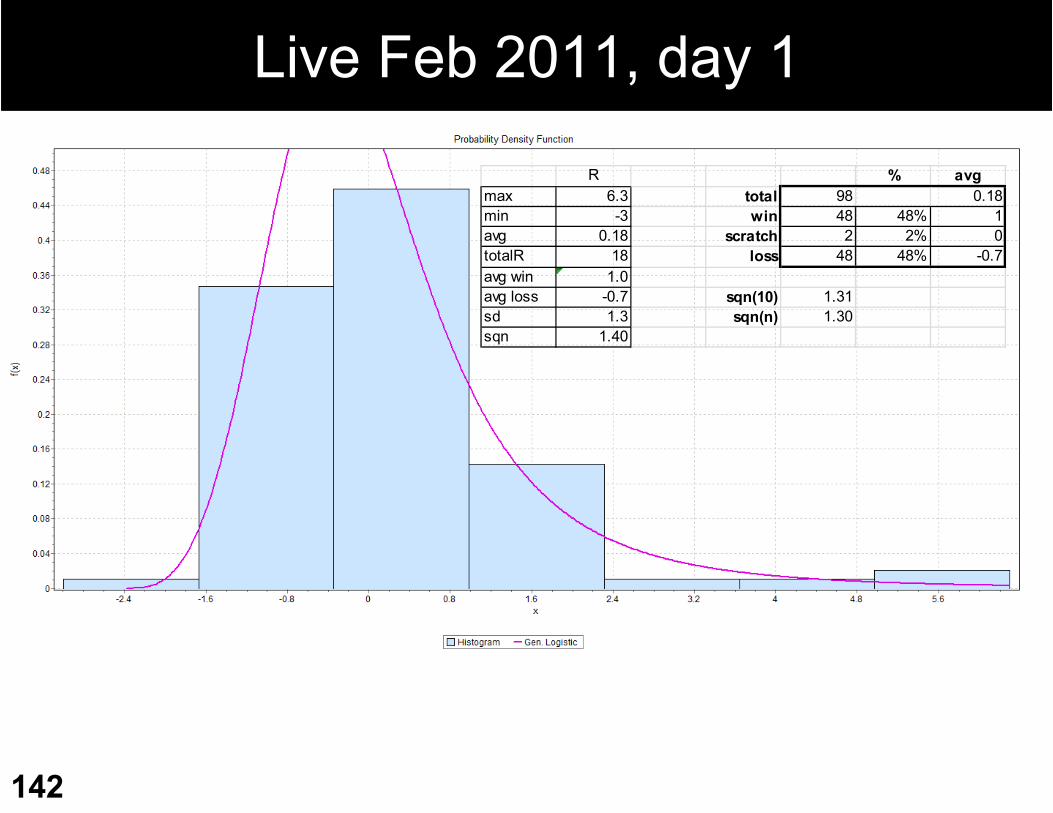
Live Feb 2011, day 1
142
R % avgmax 6.3 total 98 0.18min -3 win 48 48% 1avg 0.18 scratch 2 2% 0totalR 18 loss 48 48% -0.7avg win 1.0avg loss -0.7 sqn(10) 1.31sd 1.3 sqn(n) 1.30sqn 1.40
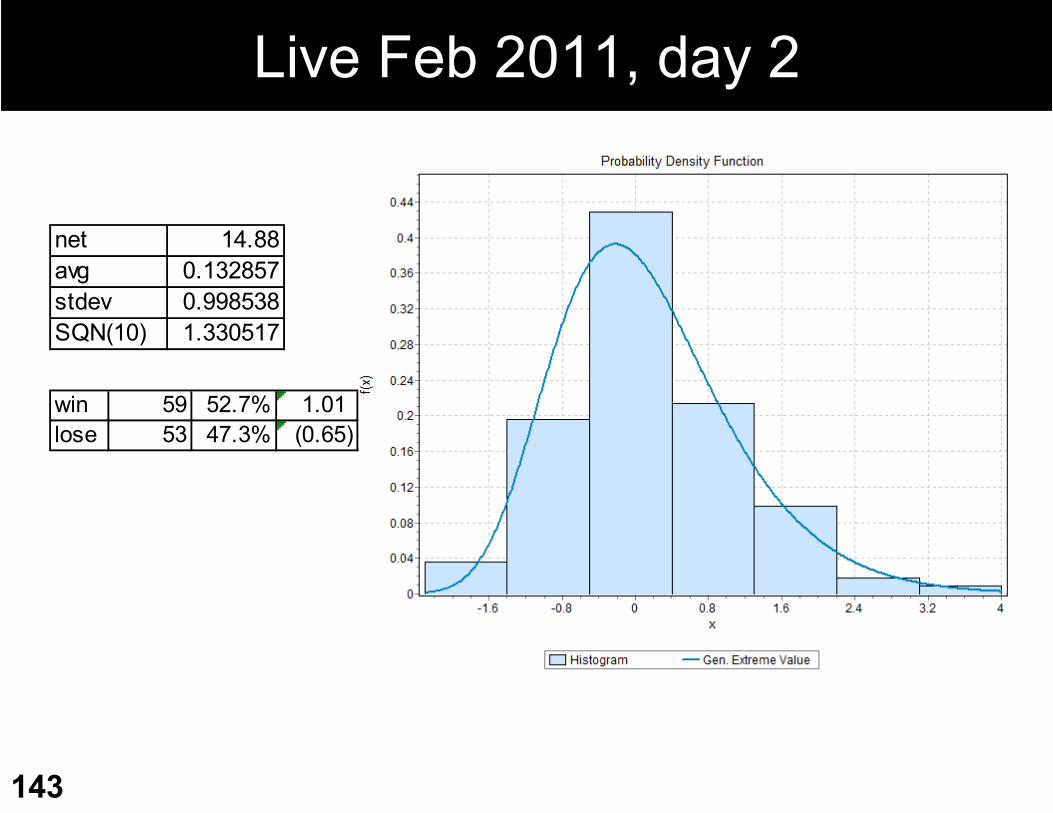
Live Feb 2011, day 2
143
net 14.88avg 0.132857stdev 0.998538SQN(10) 1.330517
win 59 52.7% 1.01 lose 53 47.3% (0.65)
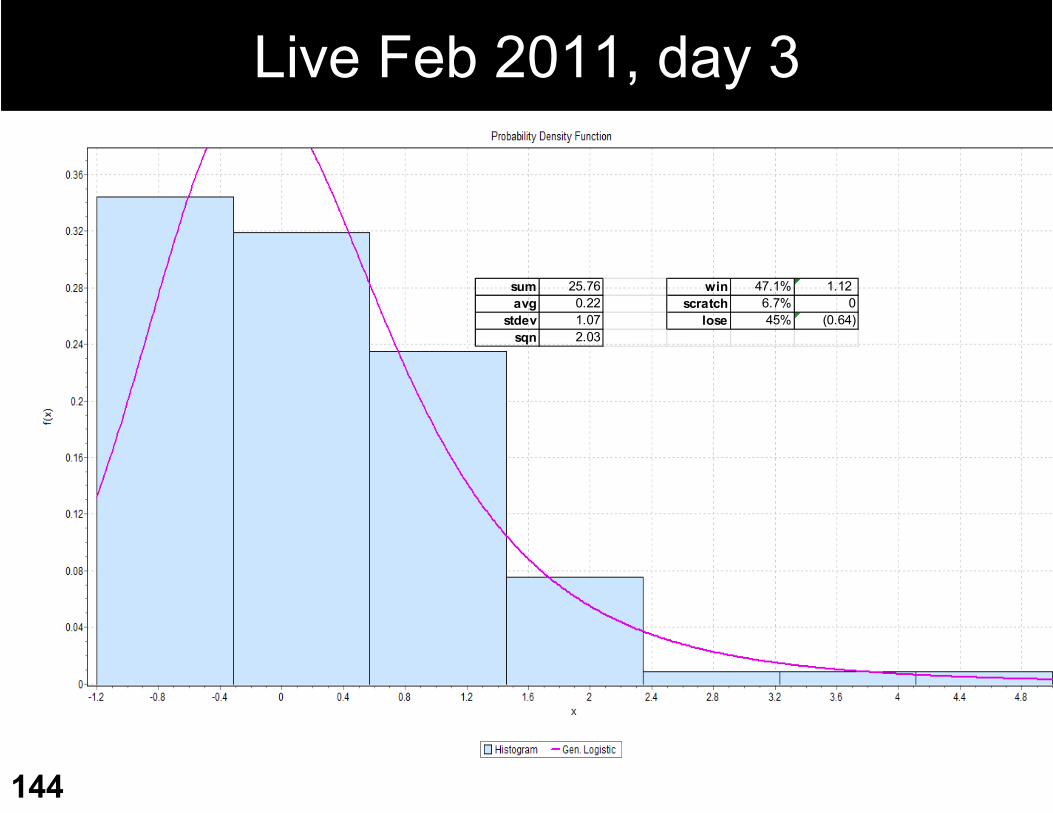
Live Feb 2011, day 3
144
sum 25.76 win 47.1% 1.12 avg 0.22 scratch 6.7% 0
stdev 1.07 lose 45% (0.64) sqn 2.03
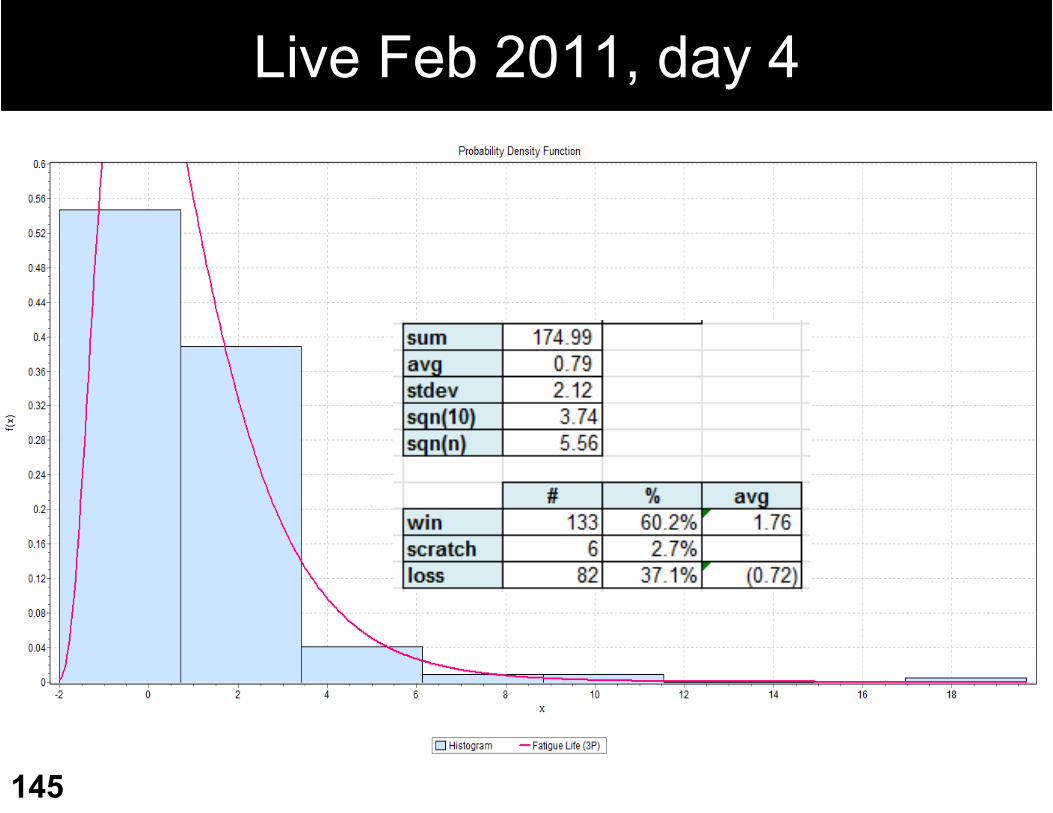
Live Feb 2011, day 4
145
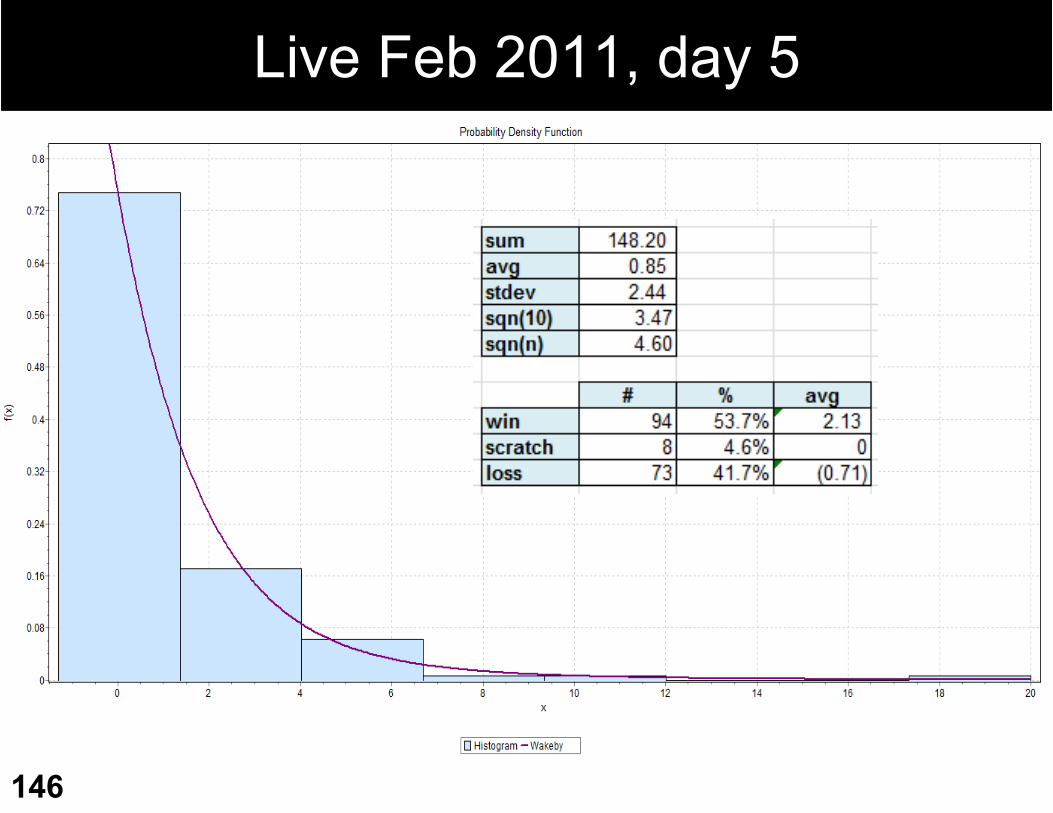
Live Feb 2011, day 5
146

Live Trading
Prep

Example of Green & Yellow Zone
148
Mechanical entry for the swing trade
Profit target for the swing trade
Standard frame
Initial stop for the swing tradeYellow zone
Red zone
When the swing trade pattern fired
Green zoneI want to be long in the swing trade position
I can try to front run a green zone trade if I can see to the one inside yesterdays range
I am out of the swing trade or I am going short, because it’s failing
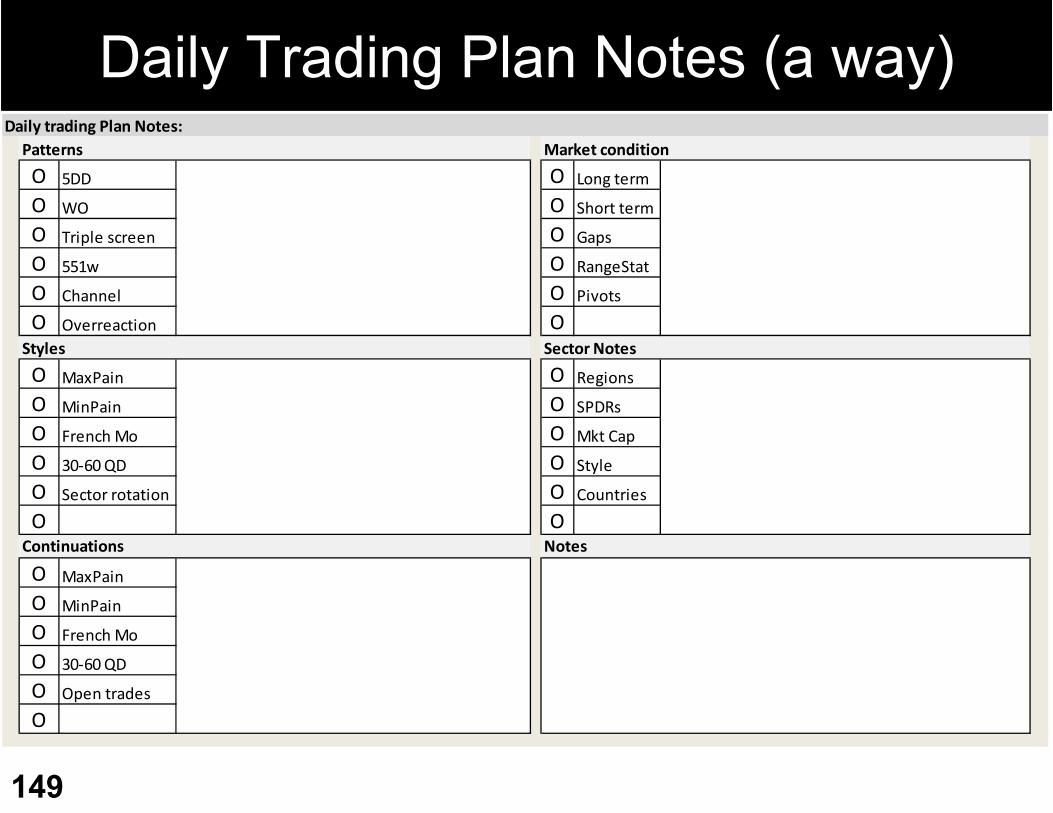
Daily Trading Plan Notes (a way)
149
O 5DD O Long term
O WO O Short term
O Triple screen O Gaps
O 551w O RangeStat
O Channel O Pivots
O Overreaction O
O MaxPain O Regions
O MinPain O SPDRs
O French Mo O Mkt Cap
O 30‐60 QD O Style
O Sector rotation O Countries
O O
O MaxPain
O MinPain
O French Mo
O 30‐60 QD
O Open trades
O
Daily trading Plan Notes:
Sector Notes
Market condition
Notes
Styles
Continuations
Patterns
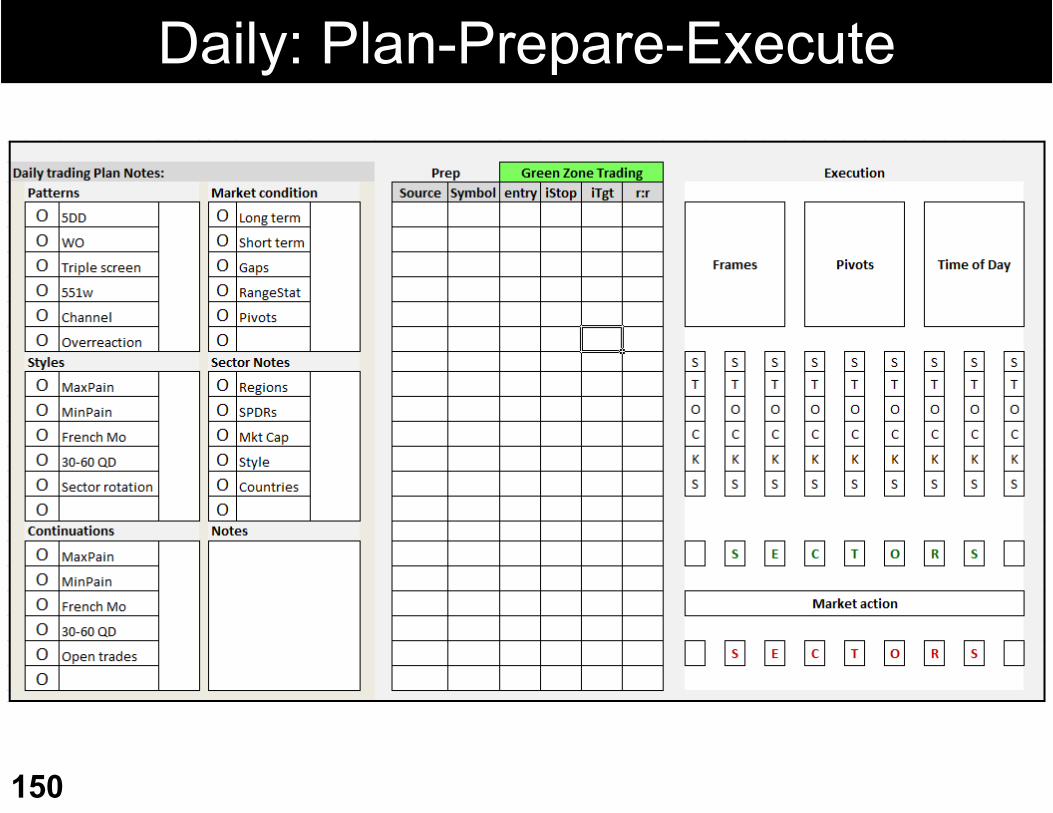
Daily: Plan-Prepare-Execute
150
151
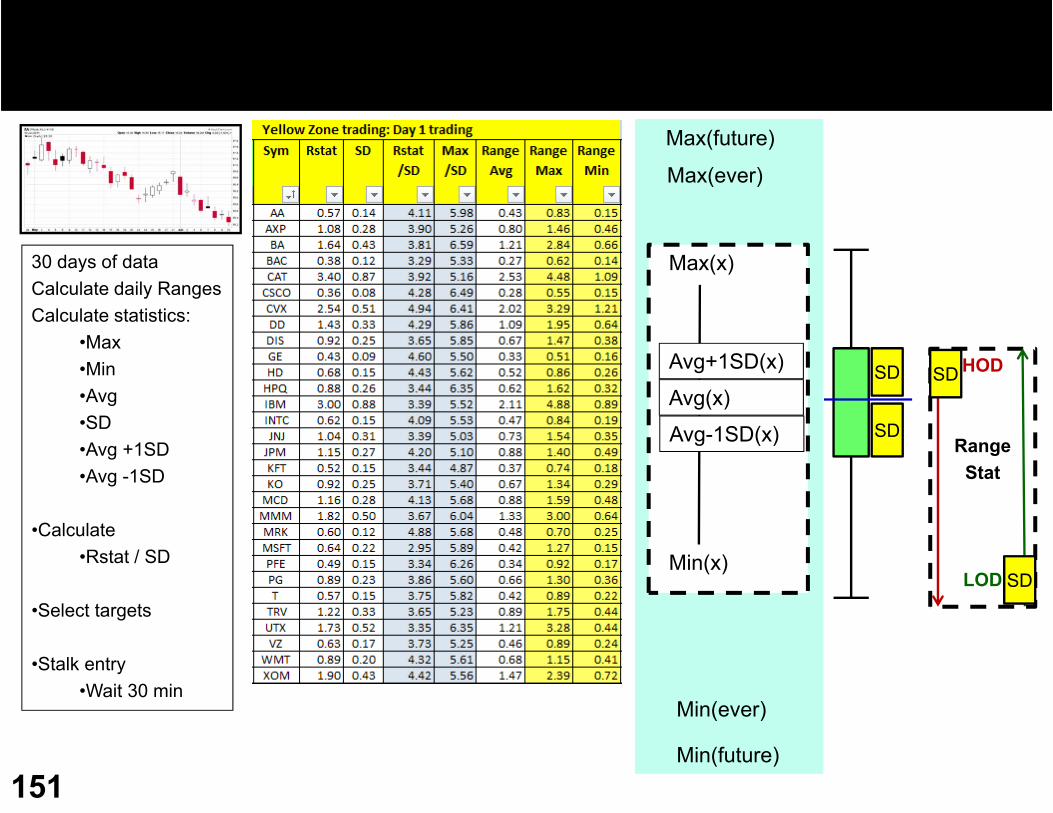
Max(ever)
Min(ever)
Min(future)
Max(future)
Max(x)
Min(x)
Avg(x)
Avg+1SD(x)
Avg-1SD(x)
SD
SD
30 days of dataCalculate daily RangesCalculate statistics:
•Max•Min•Avg•SD•Avg +1SD•Avg -1SD
•Calculate•Rstat / SD
•Select targets
•Stalk entry•Wait 30 min
HOD
RangeStat
LOD
SD
SD
•152
SPY
EFA
QQQQ
MDY
XLE
EWZILF
EPP
MVVMZZ
UWM
QLD
IWM
QID
TWM
EEMEEV
FXP FXI
EFU IEV
XLB
XLF
XLI
SKF
SMN
BAC
AXP
JPM
VOT
HPQ
CSCO
MSFTAAPL
CLF
GLD
AA
SLV AGQ SLWZSL
GDX GDXJ
CVX
CAT
HD
EWM
XME
NFLX
DBADBC
WMTTLT
DVN
Logic chain
•153
i start with SPY to assess mkt conditions from the open and during the day
i compare the vertical column above and below for intraday relative strength comparisons of indices and sectors to SPY
if a sector looks very good or very bad i then go east and west to find an even better target for easy trading
to include looking all the way to the right for stocks outperforming their peers in an outperforming sector, going in the same up direcition as mkt
if mkt failing i find worst sector ETF and trade the double inverse "long“
the stocks and ETFs on there are often the result of swing trade patterns which are favorable for the next couple days so i have extra protection when trading them intraday

The Curve
155
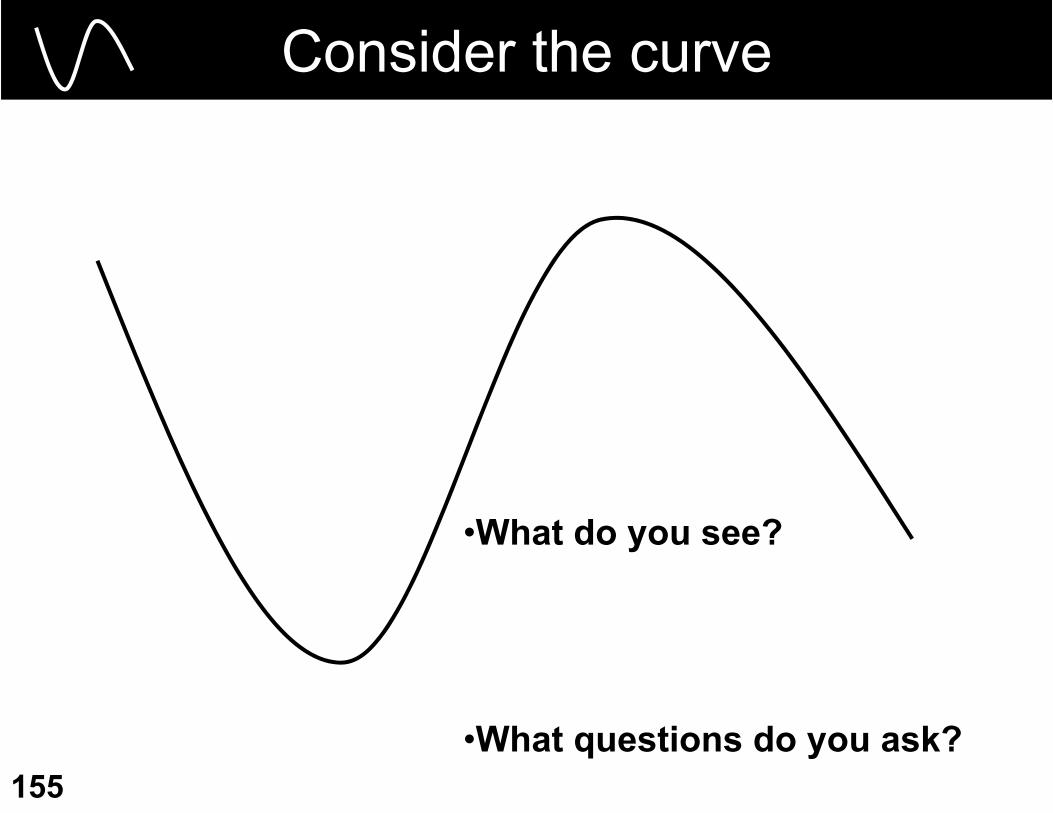
Consider the curve
•What do you see?
•What questions do you ask?
156
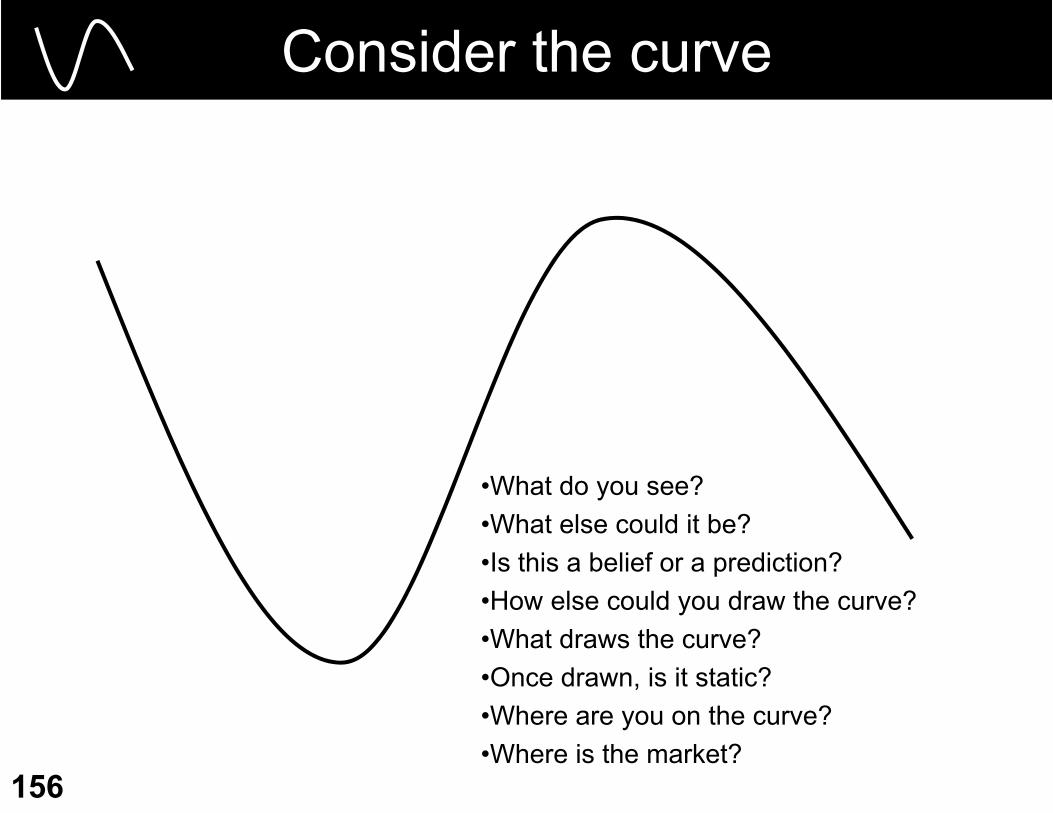
Consider the curve
•What do you see?•What else could it be?•Is this a belief or a prediction?•How else could you draw the curve?•What draws the curve?•Once drawn, is it static?•Where are you on the curve?•Where is the market?
157
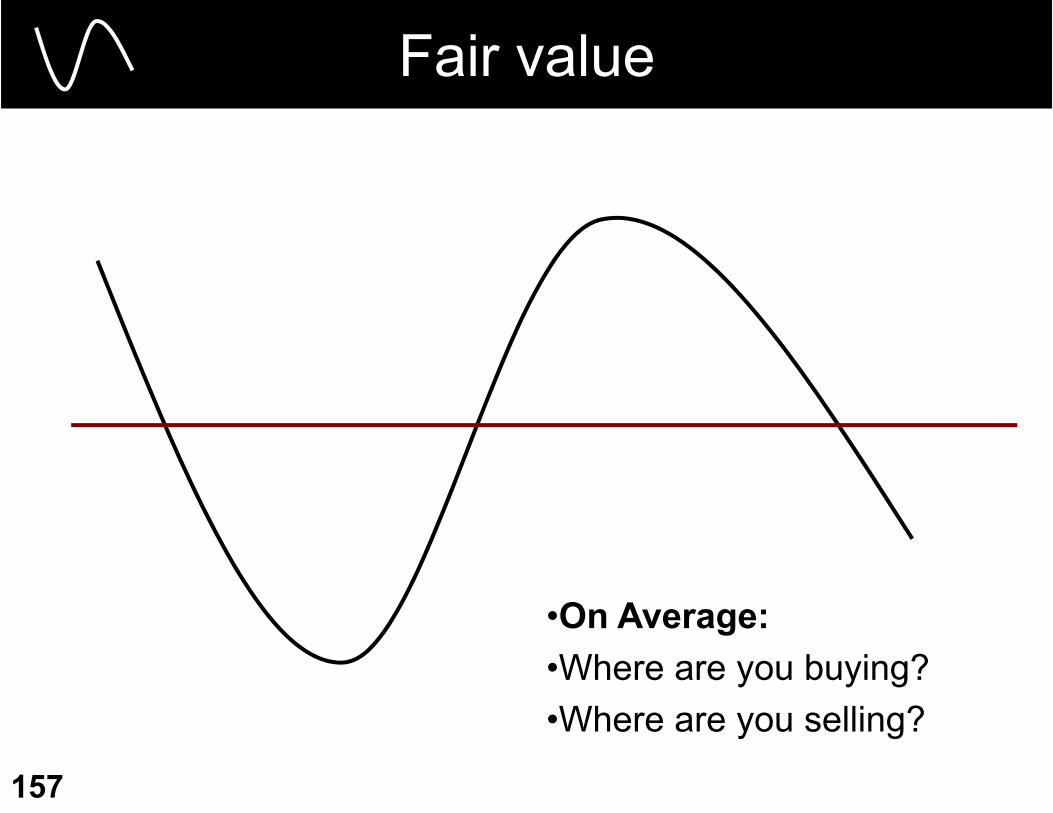
Fair value
•On Average:•Where are you buying?•Where are you selling?
158
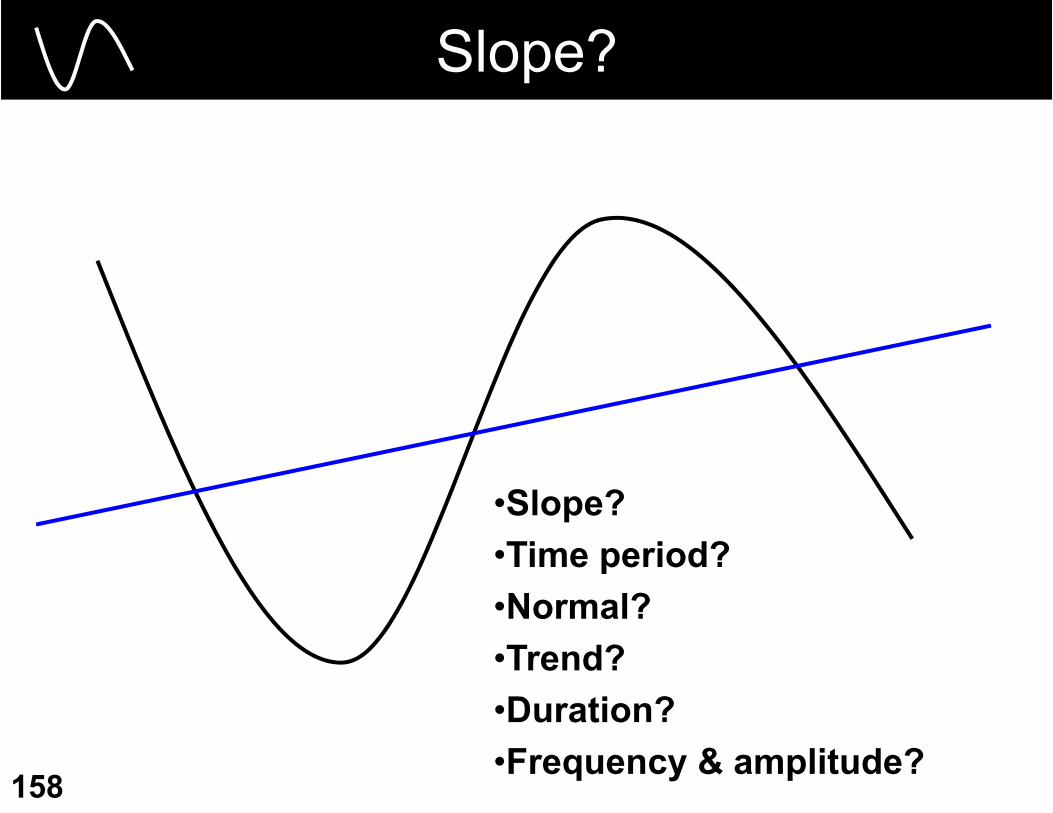
Slope?
•Slope?•Time period?•Normal?•Trend?•Duration?•Frequency & amplitude?
159
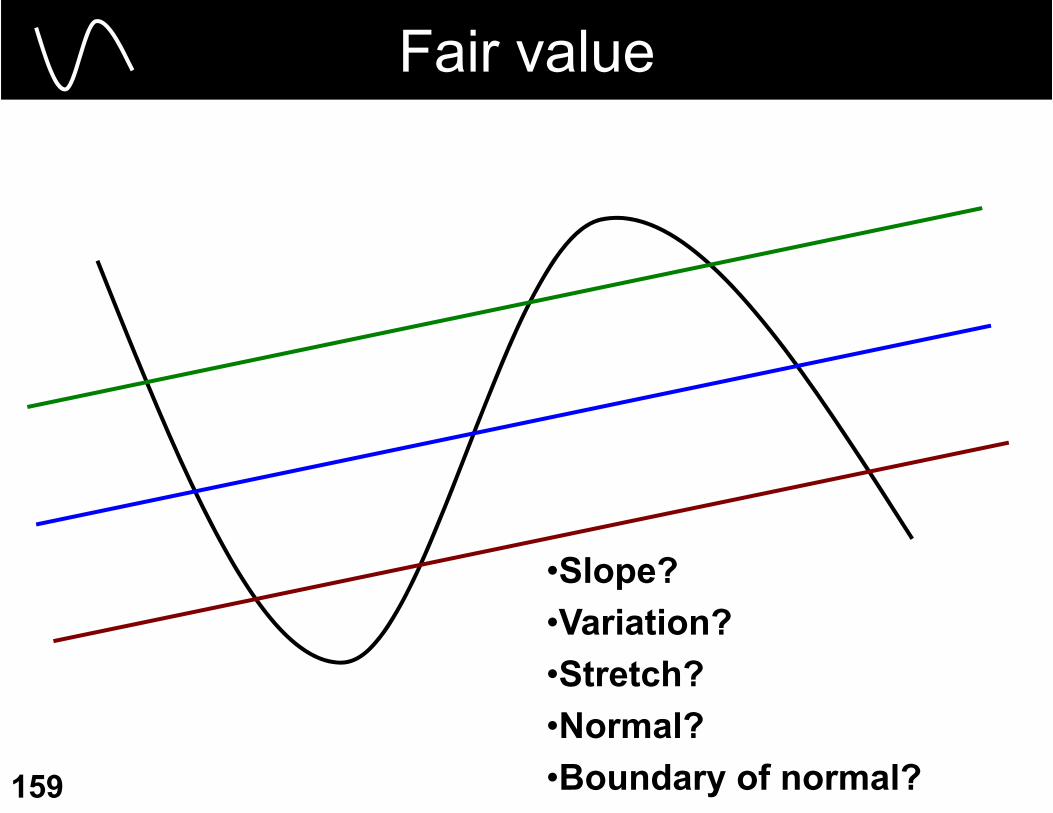
Fair value
•Slope?•Variation?•Stretch?•Normal?•Boundary of normal?
160
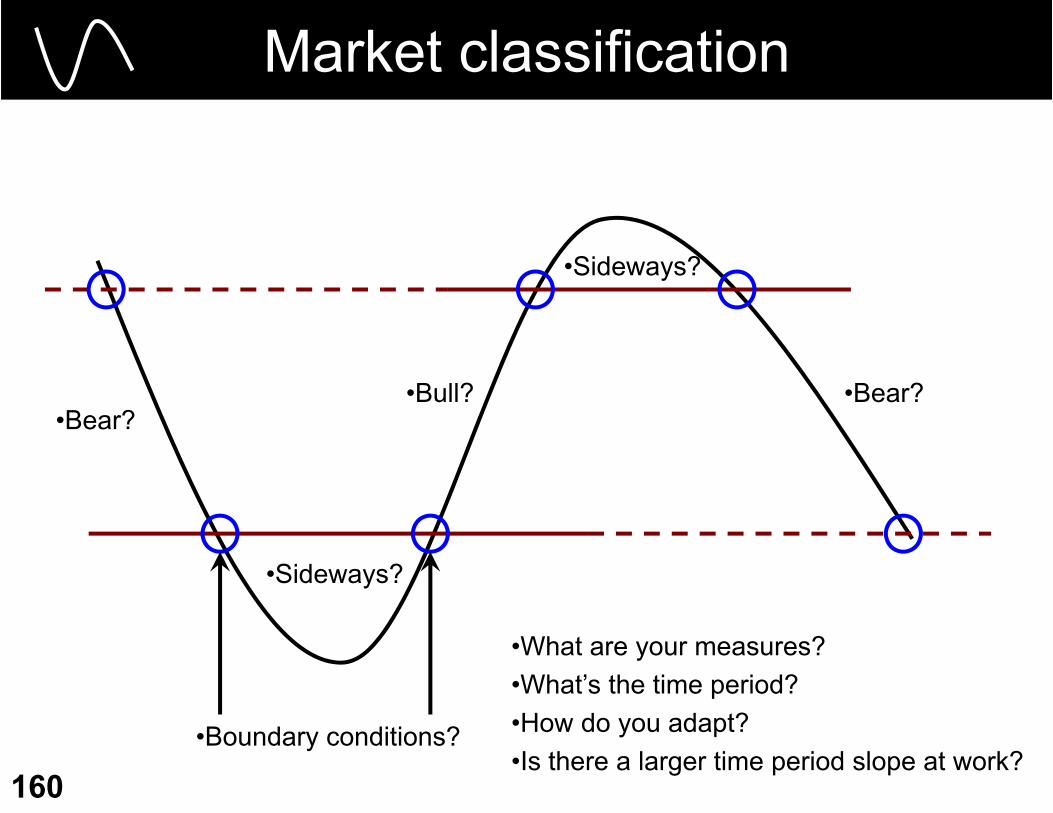
Market classification
•What are your measures?•What’s the time period?•How do you adapt?•Is there a larger time period slope at work?
•Bear?•Bear?
•Sideways?
•Sideways?
•Bull?
•Boundary conditions?
161
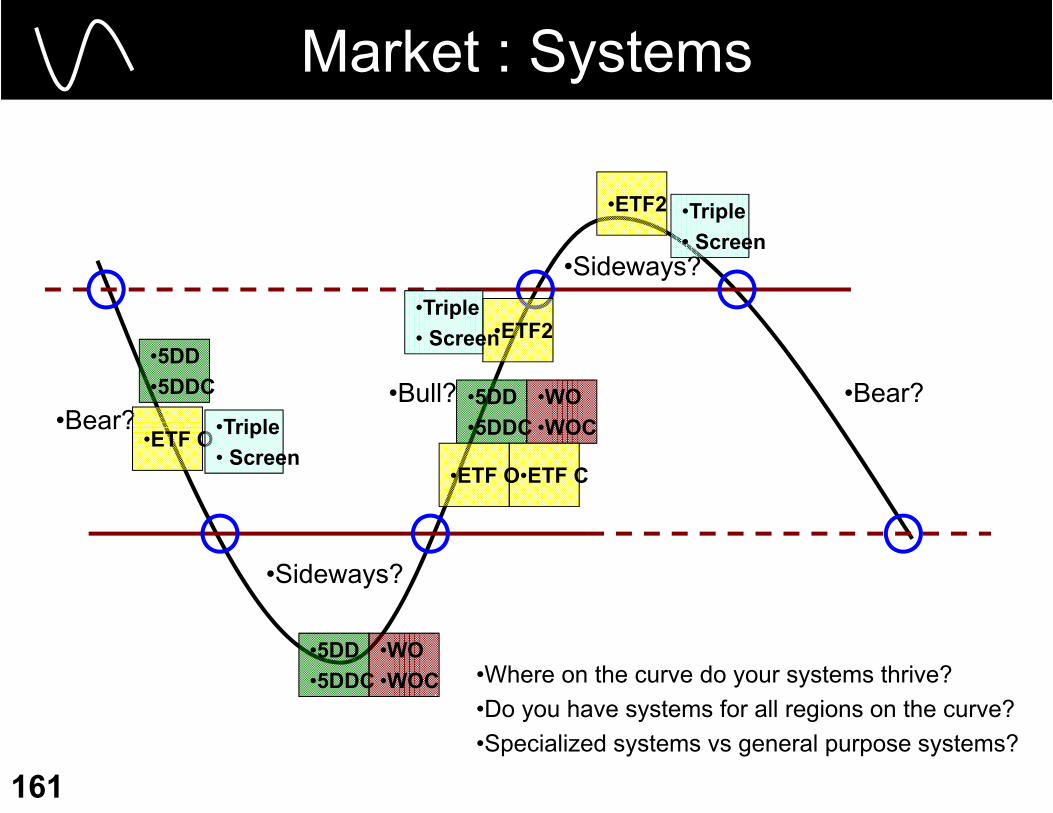
Market : Systems
•Where on the curve do your systems thrive?•Do you have systems for all regions on the curve?•Specialized systems vs general purpose systems?
•Bear?•Bear?
•Sideways?
•Sideways?
•Bull?•5DD•5DDC •5DD
•5DDC
•5DD•5DDC
•ETF2
•WO•WOC
•WO•WOC
•ETF2
•ETF O•ETF C•ETF O
•Triple• Screen
•Triple• Screen
•Triple• Screen

162
Attitude Checks
163
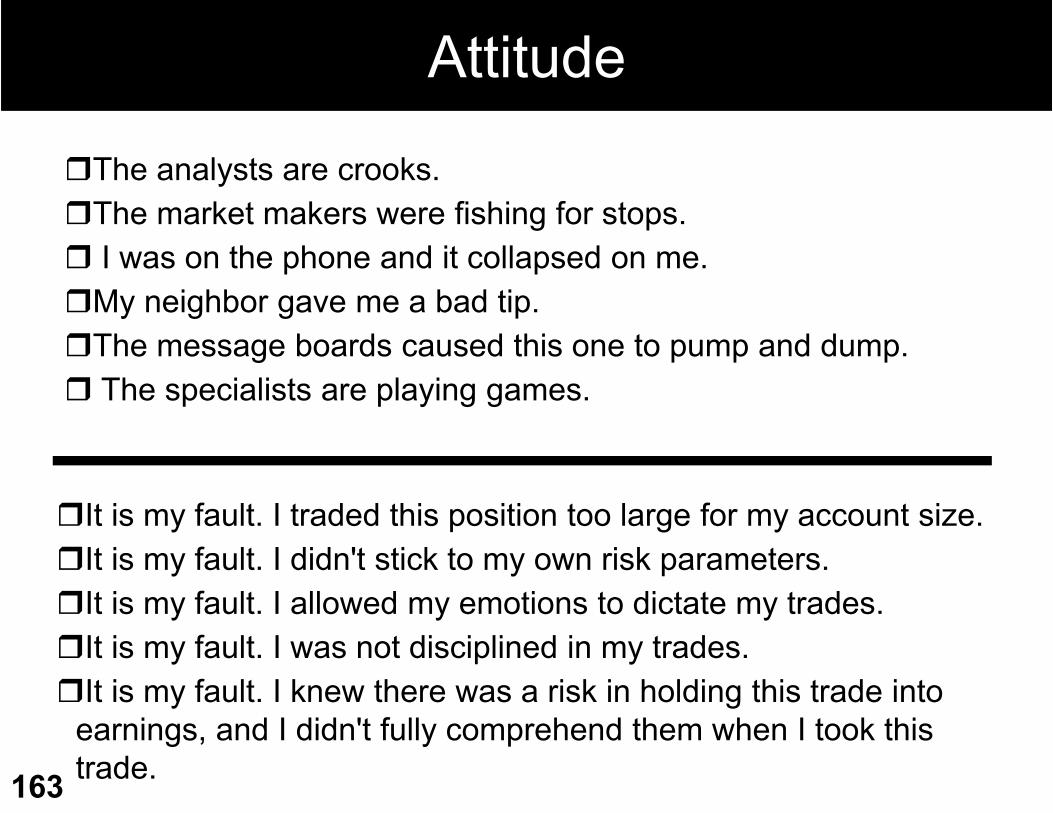
The analysts are crooks.The market makers were fishing for stops. I was on the phone and it collapsed on me.My neighbor gave me a bad tip.The message boards caused this one to pump and dump. The specialists are playing games.
It is my fault. I traded this position too large for my account size.It is my fault. I didn't stick to my own risk parameters.It is my fault. I allowed my emotions to dictate my trades.It is my fault. I was not disciplined in my trades.It is my fault. I knew there was a risk in holding this trade into
earnings, and I didn't fully comprehend them when I took this trade.
Attitude
164
Covey’s 7 Habits…for traders?!
• Be proactive• Begin with the end in mind• Do first things first• Think “Win/Win”• Understand, then seek to be understood• Synergize
• “Sharpen the saw”
• Continuous improvement
What is your totem animal?
165
•What does it mean to trade like a _______?•What qualities does __________?•What emotions? •What are the risks?•Where does it come from?•What does it represent?•How useful?
166
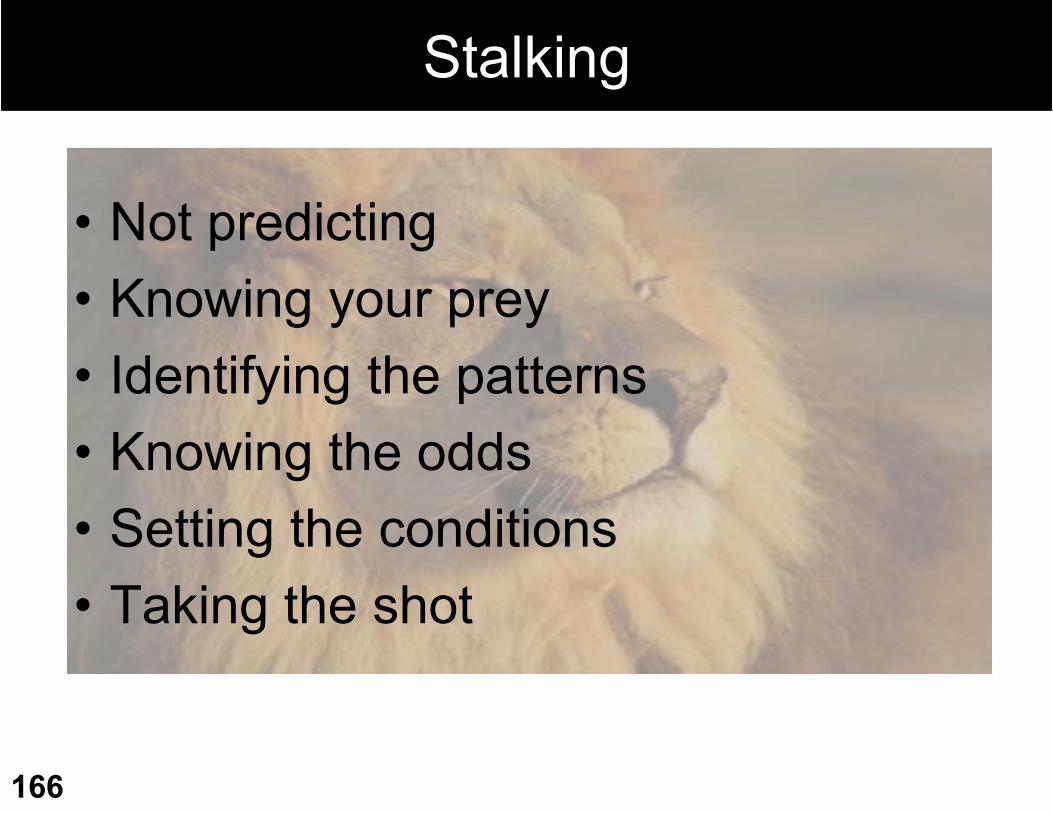
Stalking
• Not predicting• Knowing your prey• Identifying the patterns• Knowing the odds• Setting the conditions• Taking the shot

167
Bears go fishing

168
Lions await the herd

169
“YOU DON’T KNOW NOTHING”
170
Professional feelings• Calmness• Relaxation• a gentle pleasant humming in the background (Bach-like fugues)• crystal clarity on risk reward and my betting strategy• instant recognition of my strategy given my starting cards• an effortless ability to fold without regret• satisfaction with playing correctly when i call or raise and lose the hand
based on pot odds and strength of hand• there is an interesting feeling when i go all in for the right reason (based o
the odds and percent portfolio risk)• there is the same feeling (it feels like an octave lower, but still very
satisfying) when i make the right bet and the right play but for less than all in
• it is satisfying to have the feeling and the realization that i am in it for the long haul, and that i know i will endure by applying my rules, while acknowledging that sometimes you dont get the cards, but also knowing that risk management/position sizing will keep me in the game.

171
Let the course pick your club
• Master your tools• Pack your bag• Groove your swing• Know the course• Keep good score• Hit buckets of balls• Play your game• Breathe deeply• Enjoy the game• Leave it on the course
Technical Analysis
172
173
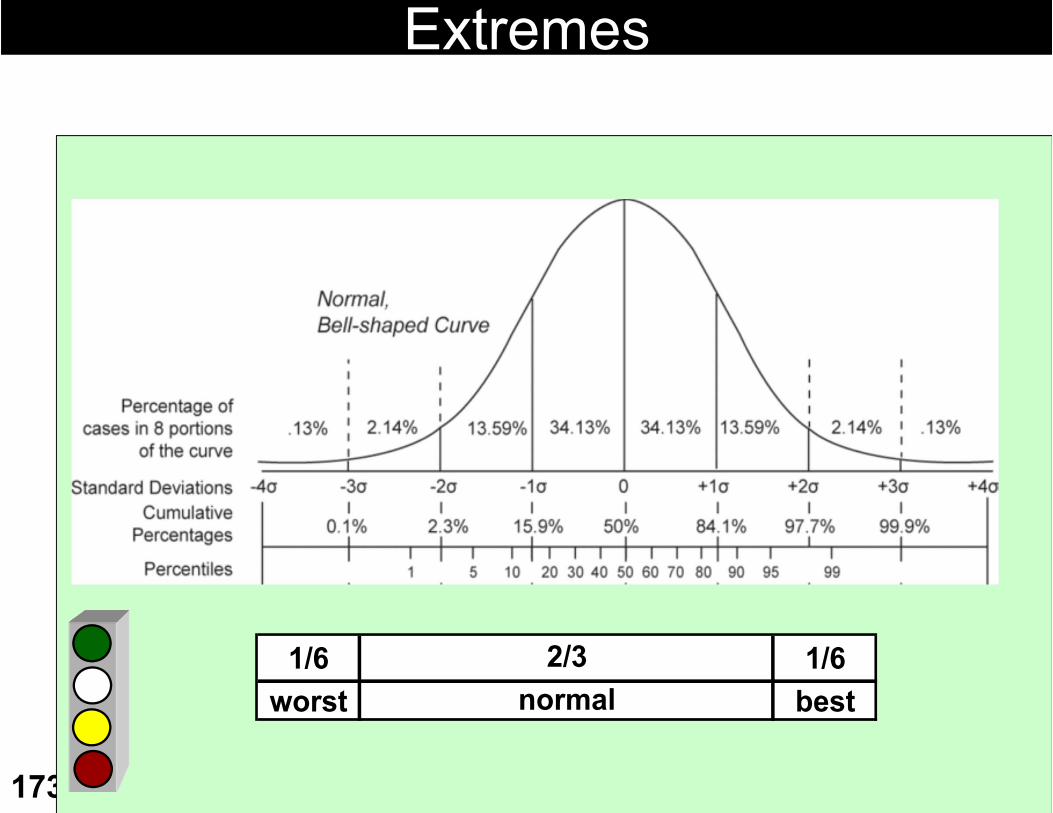
Extremes
1/6 1/6worst best
2/3normal

174
Traffic lighting with statistics
Average
+1 St Dev
-1 StDev
AdaptiveTime period mattersCurrent stateChanging stateTime series
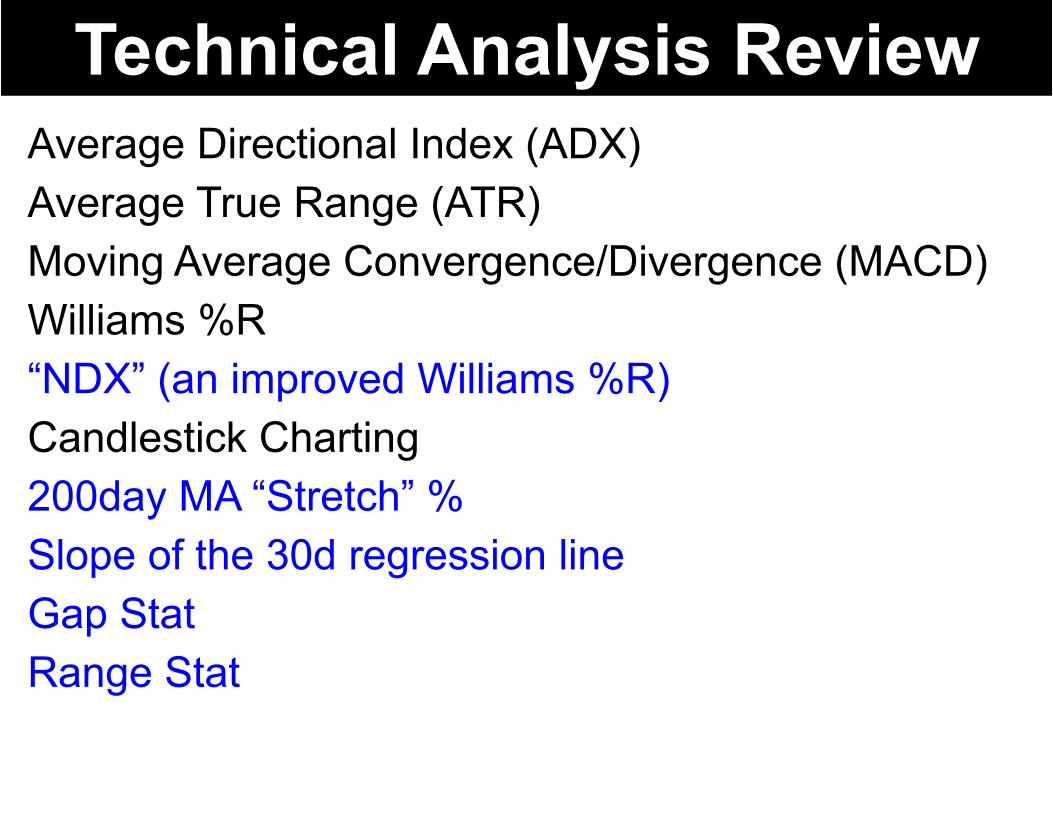
Technical Analysis ReviewAverage Directional Index (ADX)Average True Range (ATR)Moving Average Convergence/Divergence (MACD)Williams %R“NDX” (an improved Williams %R)Candlestick Charting200day MA “Stretch” %Slope of the 30d regression lineGap StatRange Stat
176
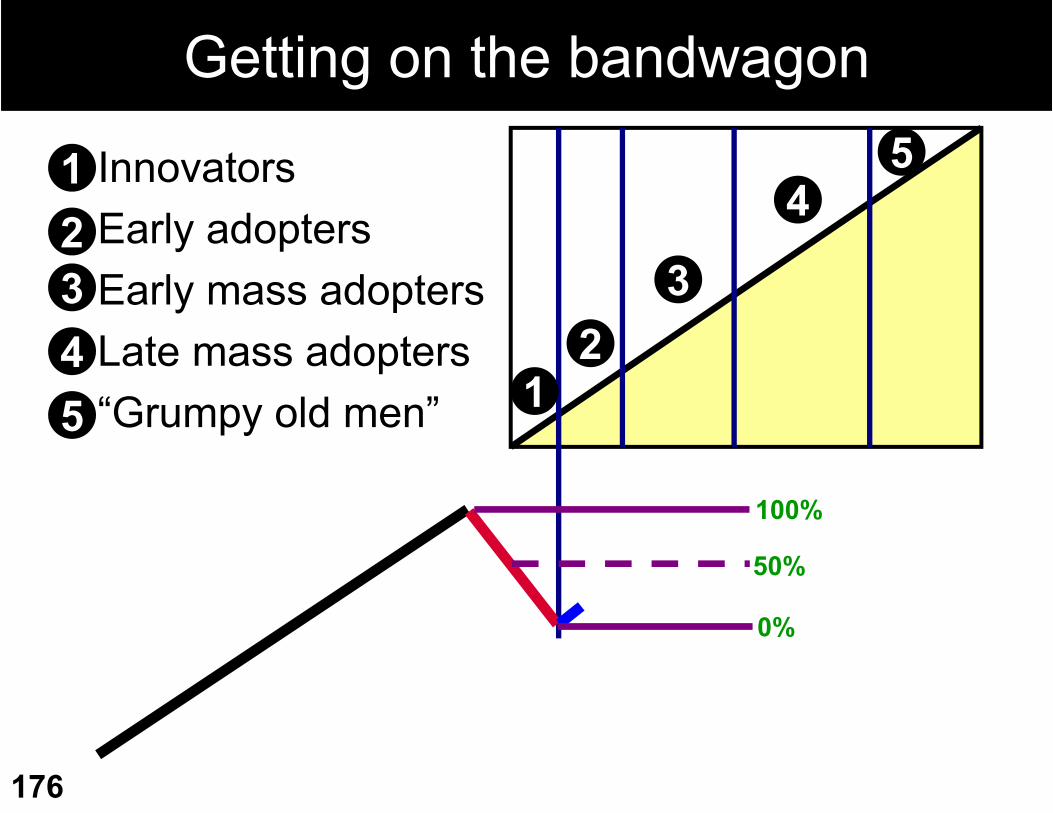
Getting on the bandwagon
InnovatorsEarly adoptersEarly mass adoptersLate mass adopters“Grumpy old men”
12
43
5 12
4
3
5
0%
100%
50%
177
Average Directional Index (ADX)(strength of trend)
Invented by Welles Wildermeasures strength of trendsimple but complex calculations measured on a scale of 0 – 100low ADX value (generally less than 20) can indicate a non-
trending market with low volumesa cross above 20 may indicate the start of a trend (either up or
down). If the ADX is over 40 and begins to fall, it can indicate the
slowdown of a current trend.Can also be used to identify non-trending markets or a
deterioration of an ongoing trend. Although market direction is important in its calculation, the ADX
is not a directional indicator.
178
ADX (continued)Normal calculation: 14 day period with end of day dataADX >30 indicates there is a strong trendMomentum precedes price. When using ADX in your studies,
note that when ADX forms a top and begins to turn down, you should look for a retracement that causes the price to move toward it’s 20 day moving average (SMA). In an up trending market, the technician will buy when the price
falls to or near the 20 unit SMA, and in a down trending market, one should look to sell when the price rises to or near its 20 unit SMA.ADX does not function well as a trigger. Prices will always move
faster than the Average Directional Index, as there is too much of a smoothing factor, which causes it to lag the price movement.If ADX goes below both DI lines, stop using trend following
systems, as the market is choppyADX has been used in trading systems using +DI and -DI
crossovers
179
ADX Caution
“Imagine that we have a nice long base. We jump on board when ADX starts rising from a low level. We successfully carry this trade all the way up to a high ADX level, somewhere above 30, and then the market turns down. The ADX will start to decline showing an absence of trending direction, but the price does not have an absence of direction, it is moving down!”
- Chuck LeBeau
180
ADX: the Formula
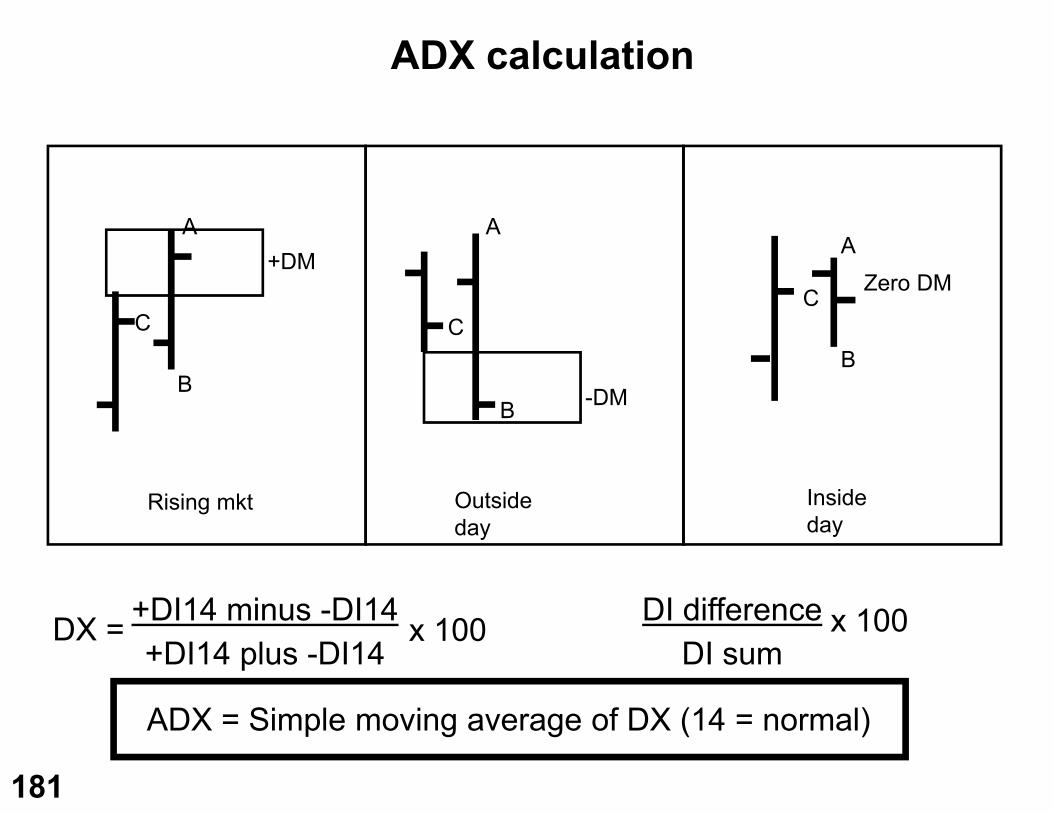
Calculating ADX is a two-step process. First, the difference of +DI and -DI is divided by the sum of +DI and -DI, and the quotient is multiplied by 100; the result is known as DX. Second, ADX is calculated by taking a modified moving average of DX.
Formula:DX = [ ABS( (+DI) - (-DI) ) ] / ( (+DI) + (-DI) )
ADX = modified moving average of DX
Where:n = number of periods+DI = current positive directional index-DI = current negative directional indexDX = current DX
181
ADX calculation
DX = +DI14 minus -DI14+DI14 plus -DI14
x 100 DI differenceDI sum
x 100
ADX = Simple moving average of DX (14 = normal)
Inside day
Rising mkt
A
B
C
+DM
Outside day
A
C
B -DM
A
C
B
Zero DM
182
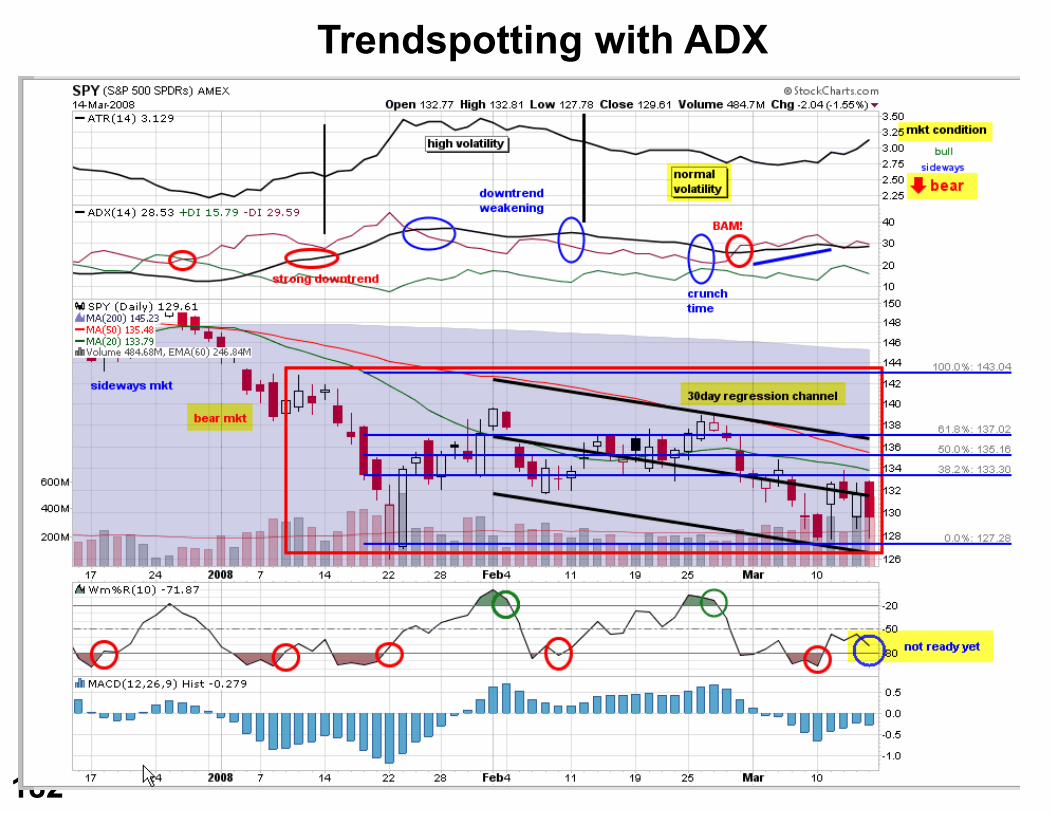
Trendspotting with ADX
183
Average True Range (ATR)(measuring volatility)
Average True Range ("ATR") is a measure of volatility. Introduced by Wilder in New Concepts in Technical Trading
SystemsCommon component of many indicators and trading systems.
Interpretation
High ATR values often occur at market bottoms following a "panic" sell-off. Low Average True Range values are often found during extended
sideways periods, such as those found at tops and after consolidation periods
184
ATR calculation
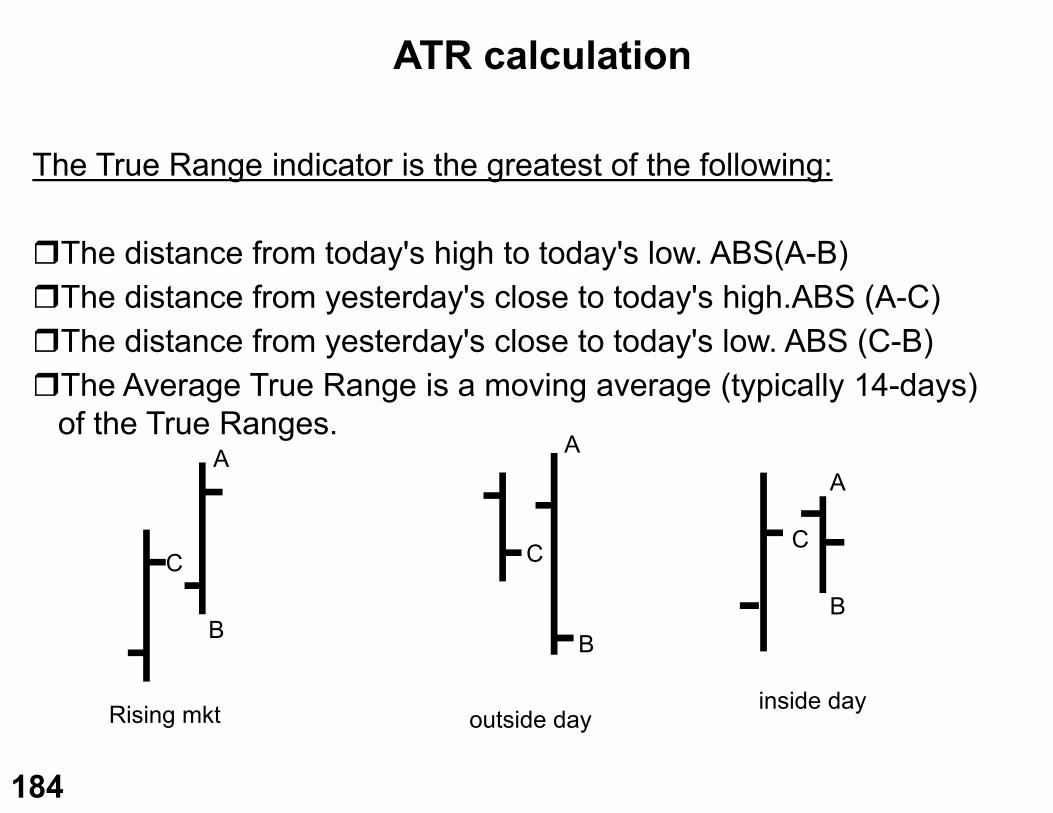
The True Range indicator is the greatest of the following:
The distance from today's high to today's low. ABS(A-B)The distance from yesterday's close to today's high.ABS (A-C)The distance from yesterday's close to today's low. ABS (C-B)The Average True Range is a moving average (typically 14-days)
of the True Ranges.
Rising mkt outside dayinside day
A
B
C
AA
CC
BB
185
MACD(Moving Average Convergence Divergence)
The MACD ("Moving Average Convergence/Divergence") is a trend following momentum indicator that shows the relationship between two moving averages of prices. The MACD was developed by Gerald Appel, publisher of Systems and Forecasts.
The MACD is the difference between a 26-day and 12-day exponential moving average. A 9-day exponential moving average, called the "signal" (or "trigger") line is plotted on top of the MACD to show buy/sell opportunities.
186
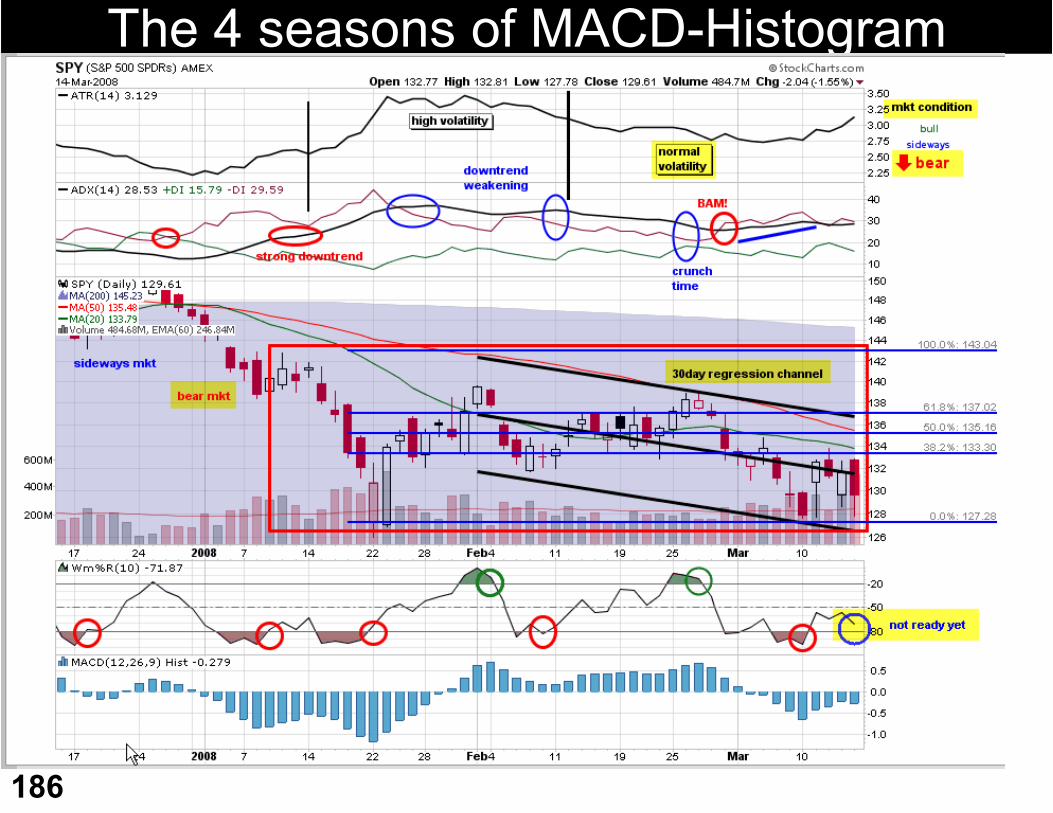
The 4 seasons of MACD-Histogram
187
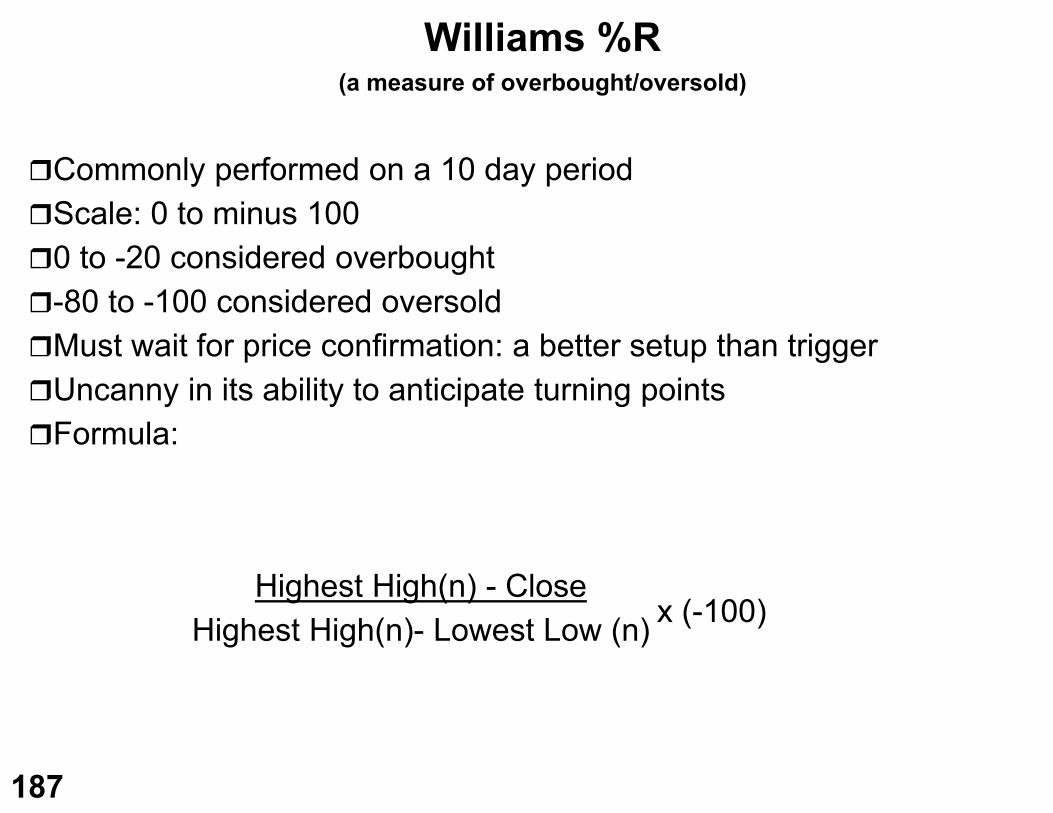
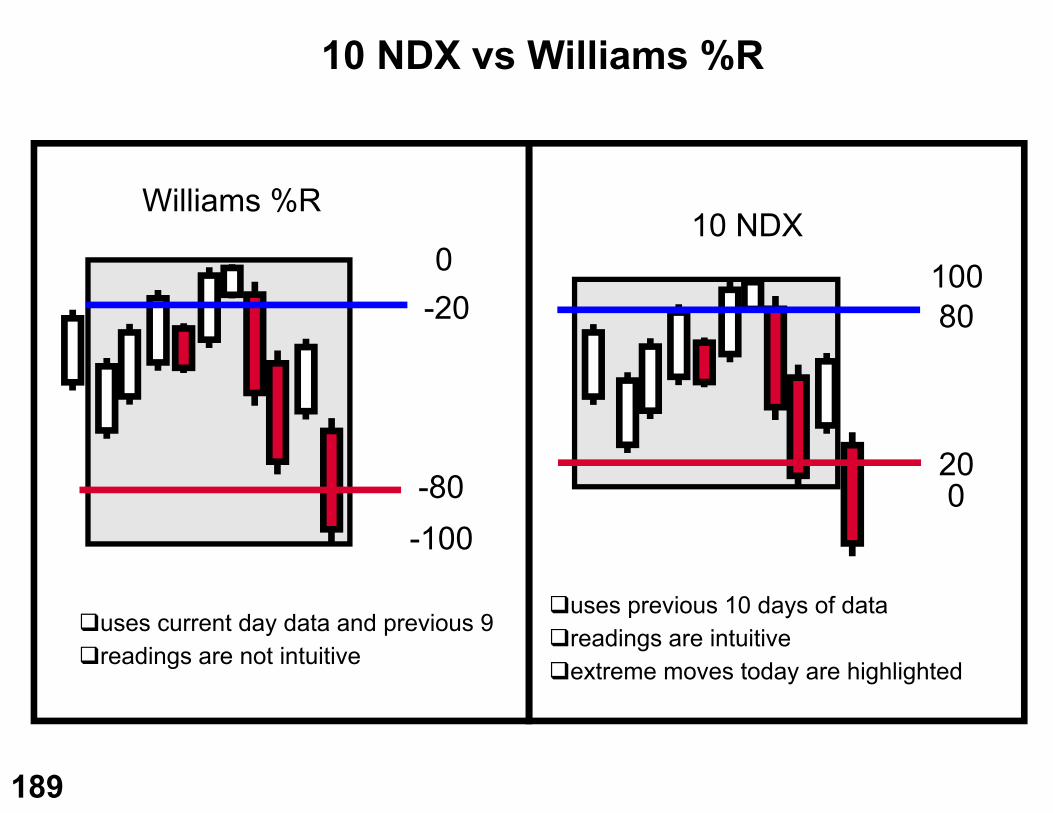
Williams %R(a measure of overbought/oversold)
Commonly performed on a 10 day periodScale: 0 to minus 100 0 to -20 considered overbought-80 to -100 considered oversoldMust wait for price confirmation: a better setup than triggerUncanny in its ability to anticipate turning pointsFormula:
Highest High(n) - CloseHighest High(n)- Lowest Low (n) x (-100)
188
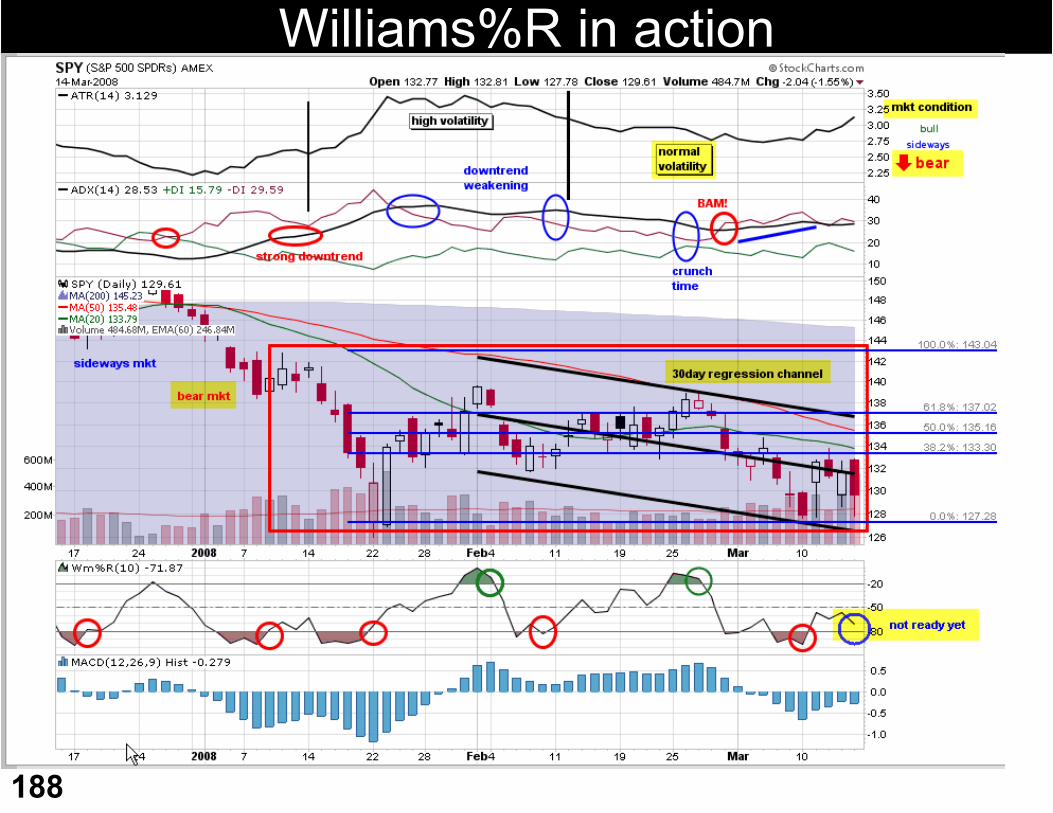
Williams%R in action
189
10 NDX vs Williams %R
Williams %R10 NDX
0-20
-80-100
10080
200
uses current day data and previous 9readings are not intuitive
uses previous 10 days of datareadings are intuitiveextreme moves today are highlighted
190
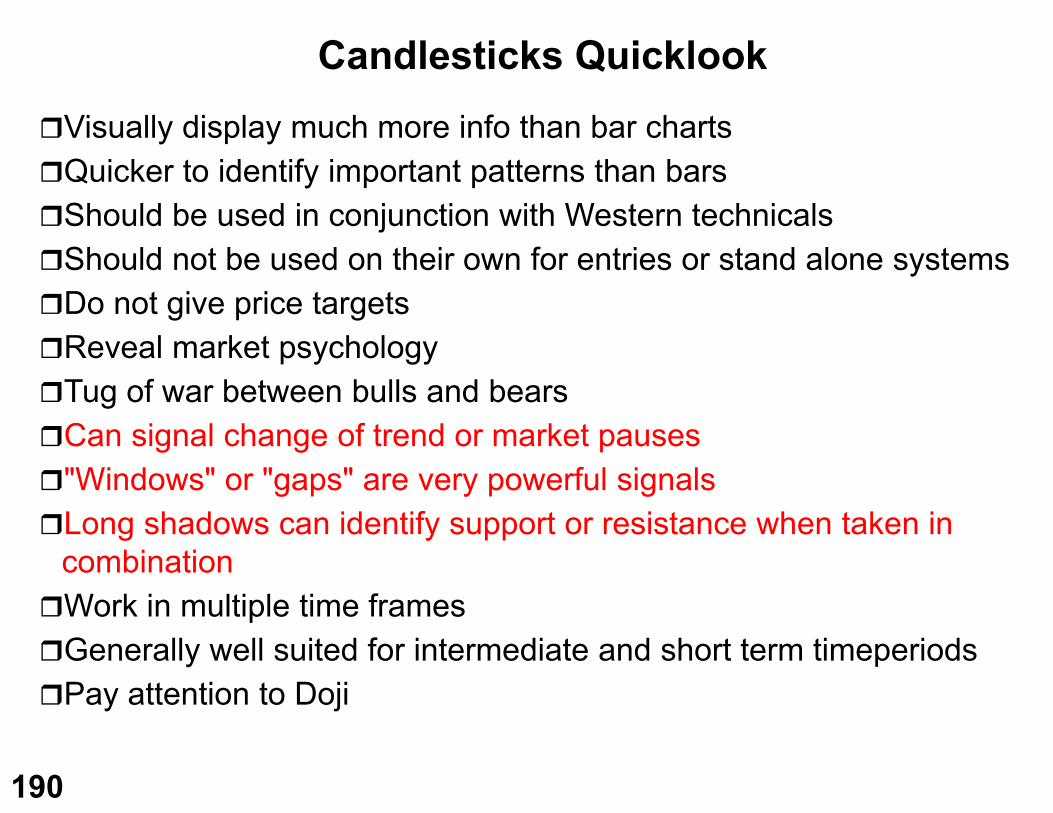
Candlesticks QuicklookVisually display much more info than bar chartsQuicker to identify important patterns than barsShould be used in conjunction with Western technicalsShould not be used on their own for entries or stand alone systemsDo not give price targetsReveal market psychology Tug of war between bulls and bearsCan signal change of trend or market pauses"Windows" or "gaps" are very powerful signalsLong shadows can identify support or resistance when taken in
combinationWork in multiple time framesGenerally well suited for intermediate and short term timeperiodsPay attention to Doji
191
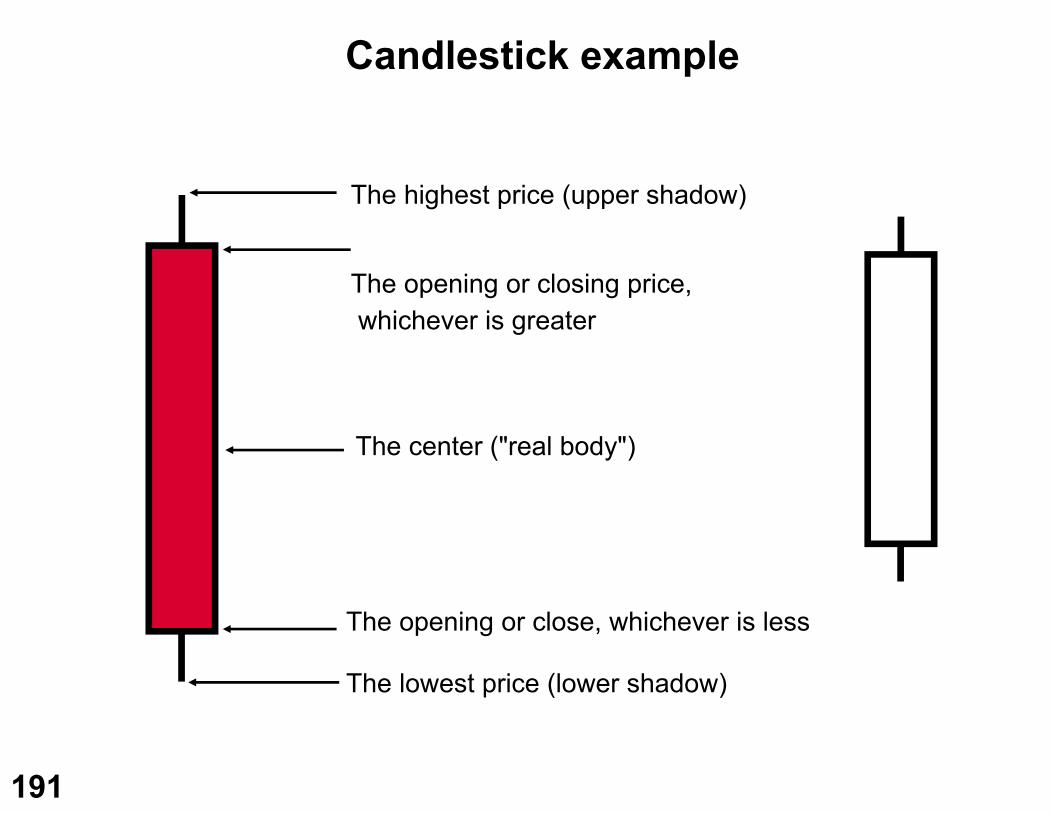
Candlestick example
The highest price (upper shadow)
The opening or closing price,whichever is greater
The center ("real body")
The opening or close, whichever is less
The lowest price (lower shadow)
192
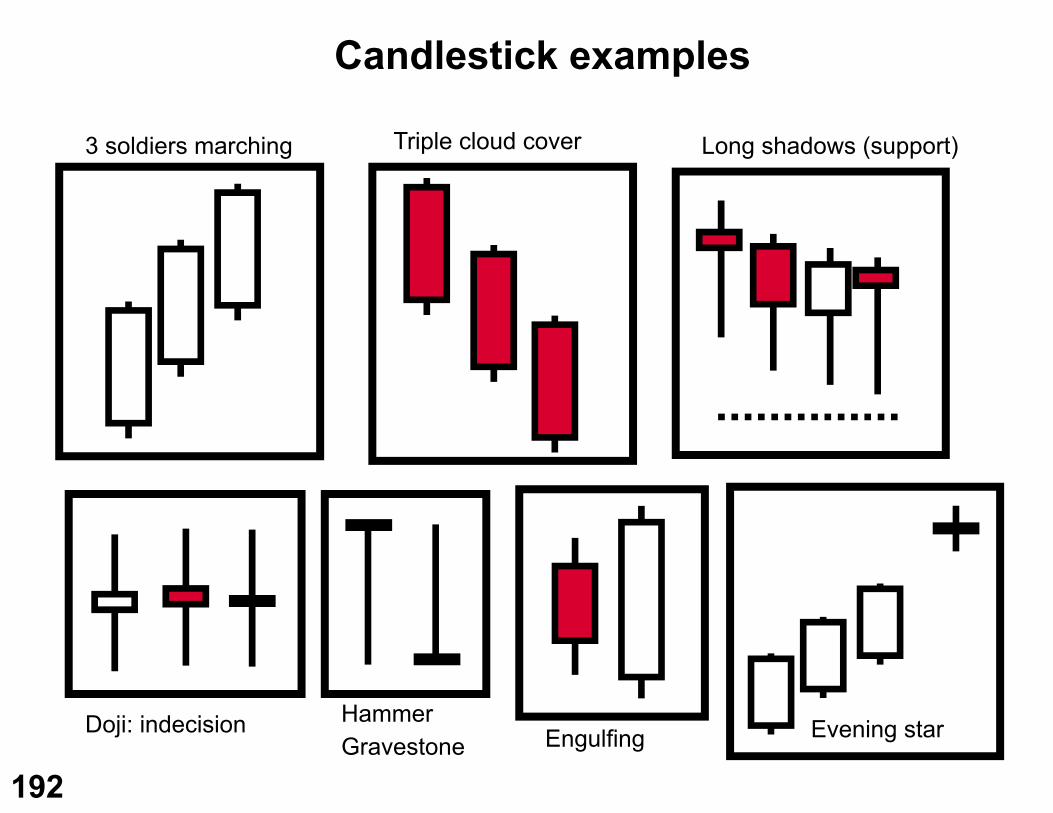
Candlestick examples
3 soldiers marching Long shadows (support)Triple cloud cover
HammerGravestone
Doji: indecision Engulfing Evening star
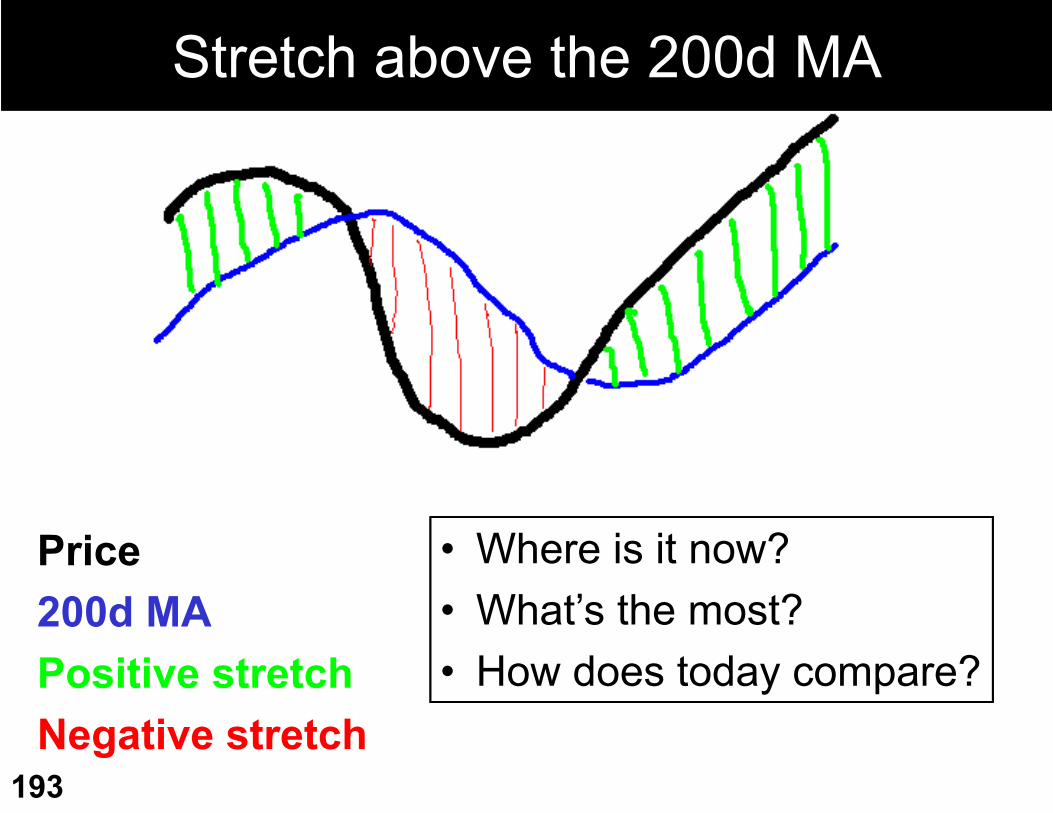
193
Stretch above the 200d MA
Price200d MAPositive stretchNegative stretch
• Where is it now?• What’s the most?• How does today compare?
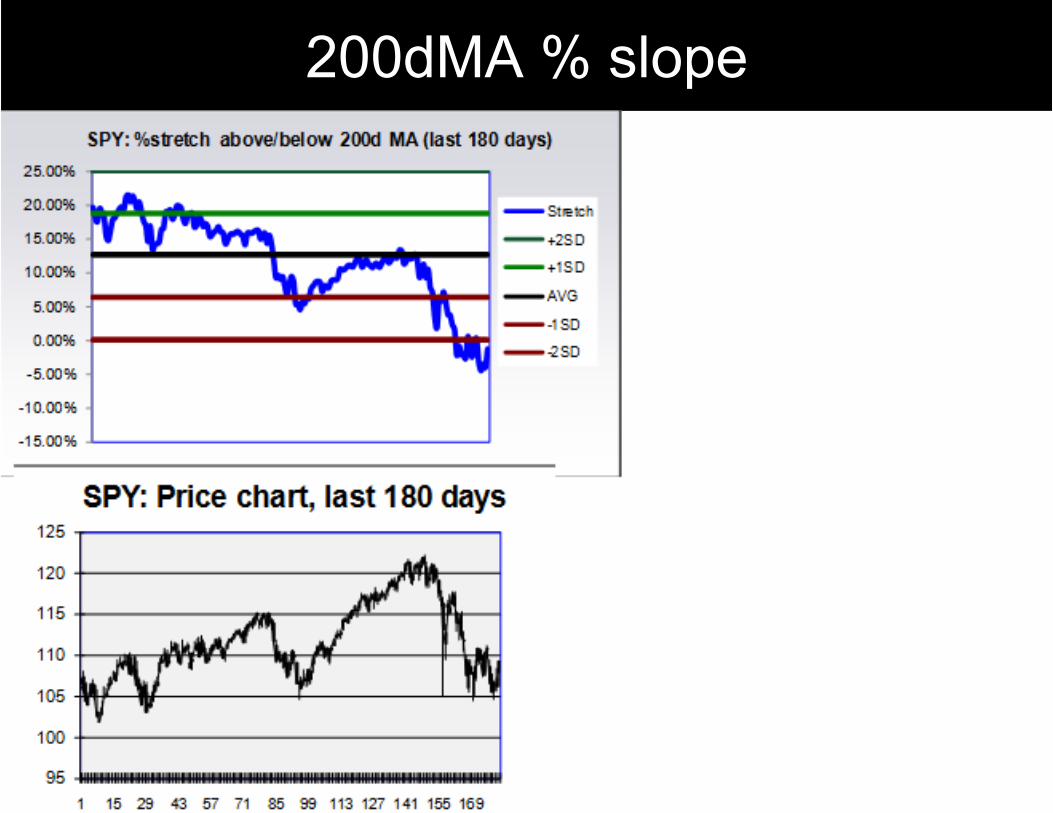
200dMA % slope
194
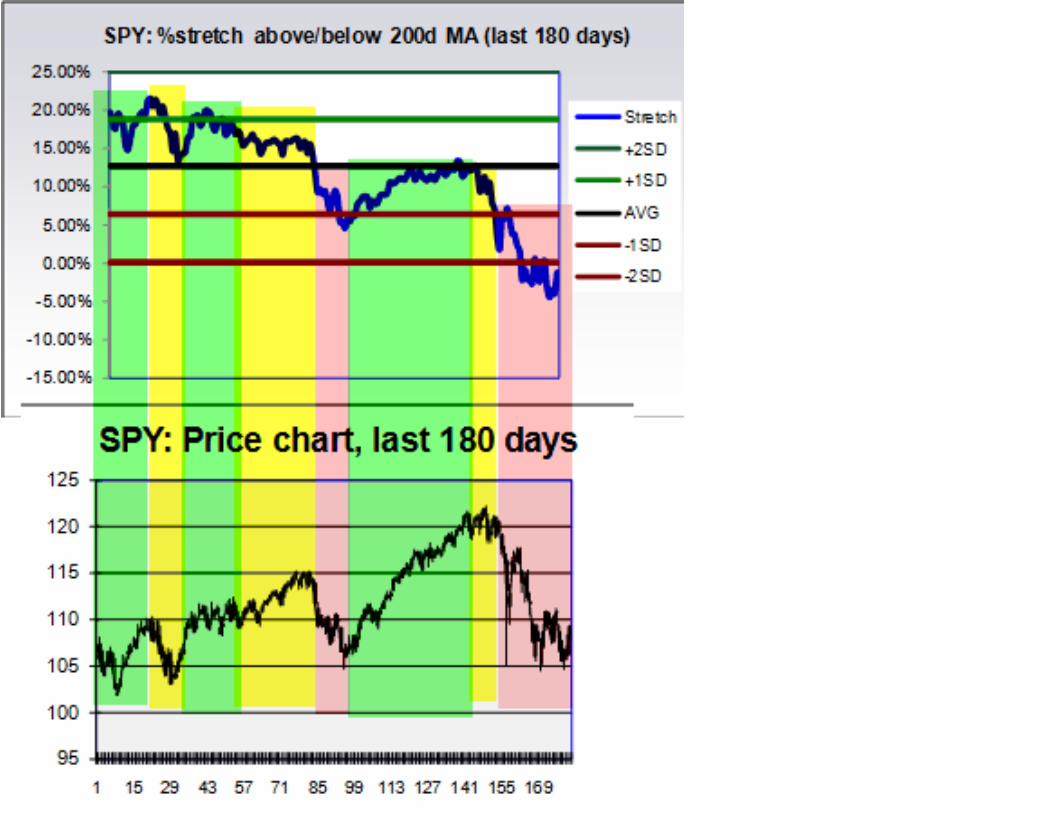
195
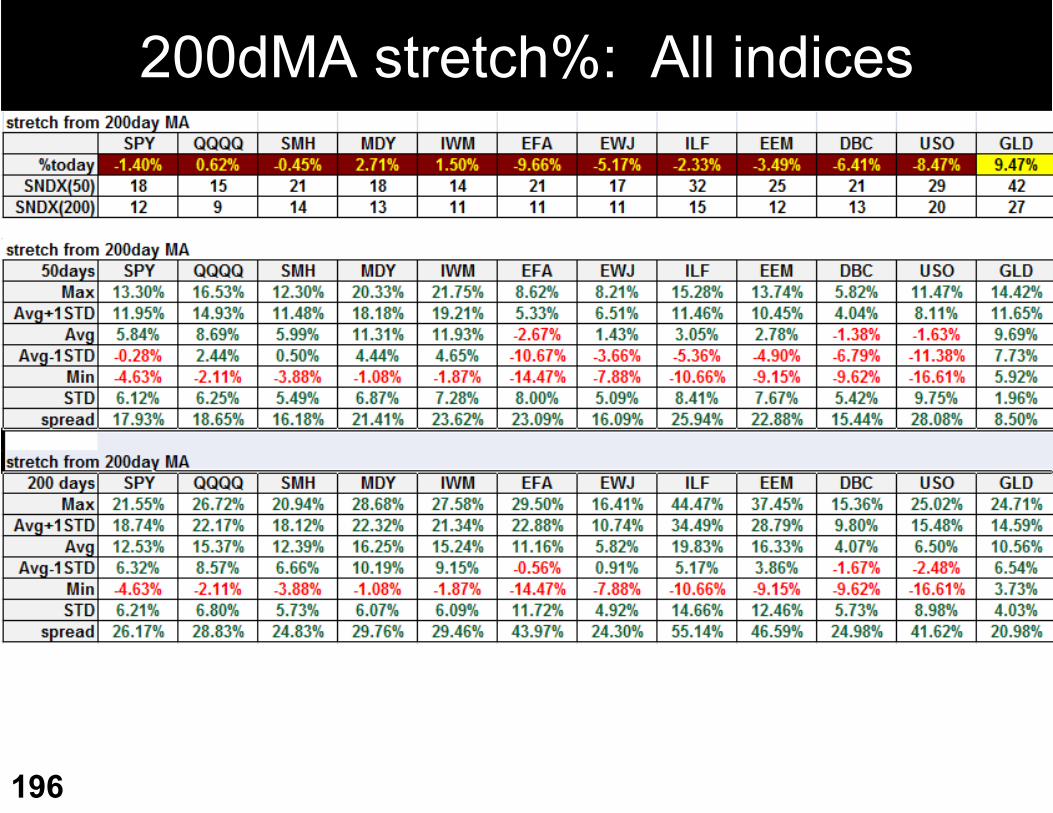
200dMA stretch%: All indices
196
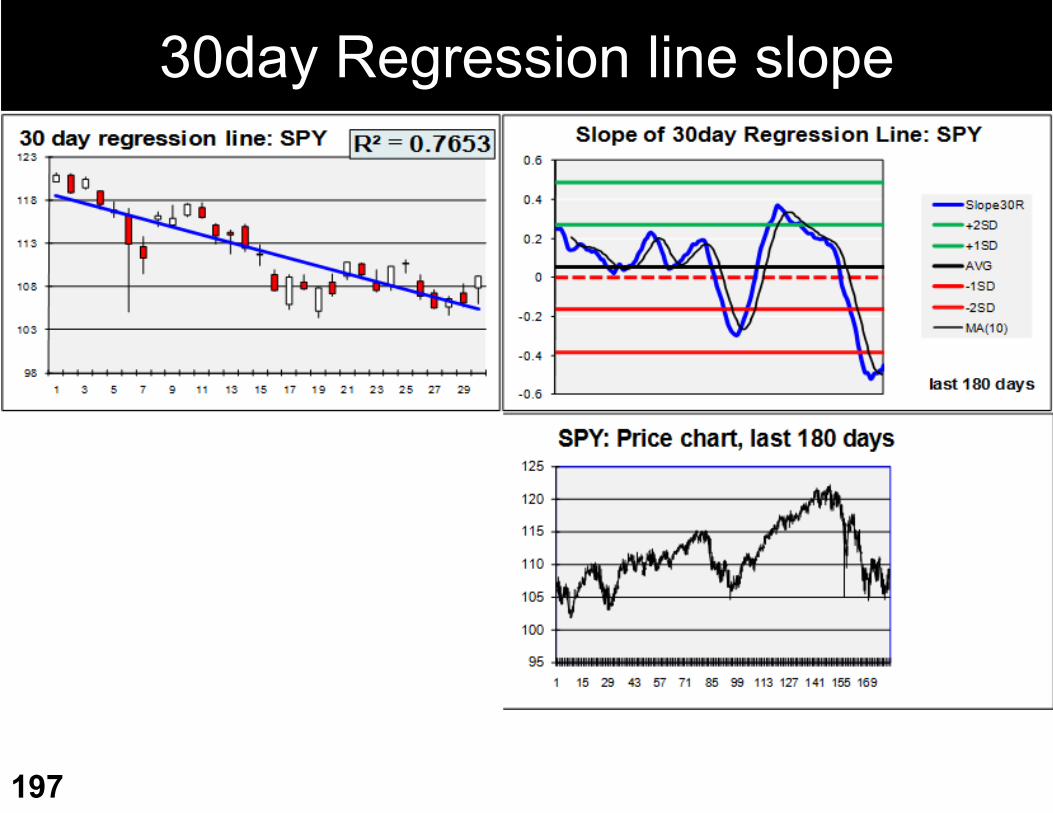
30day Regression line slope
197
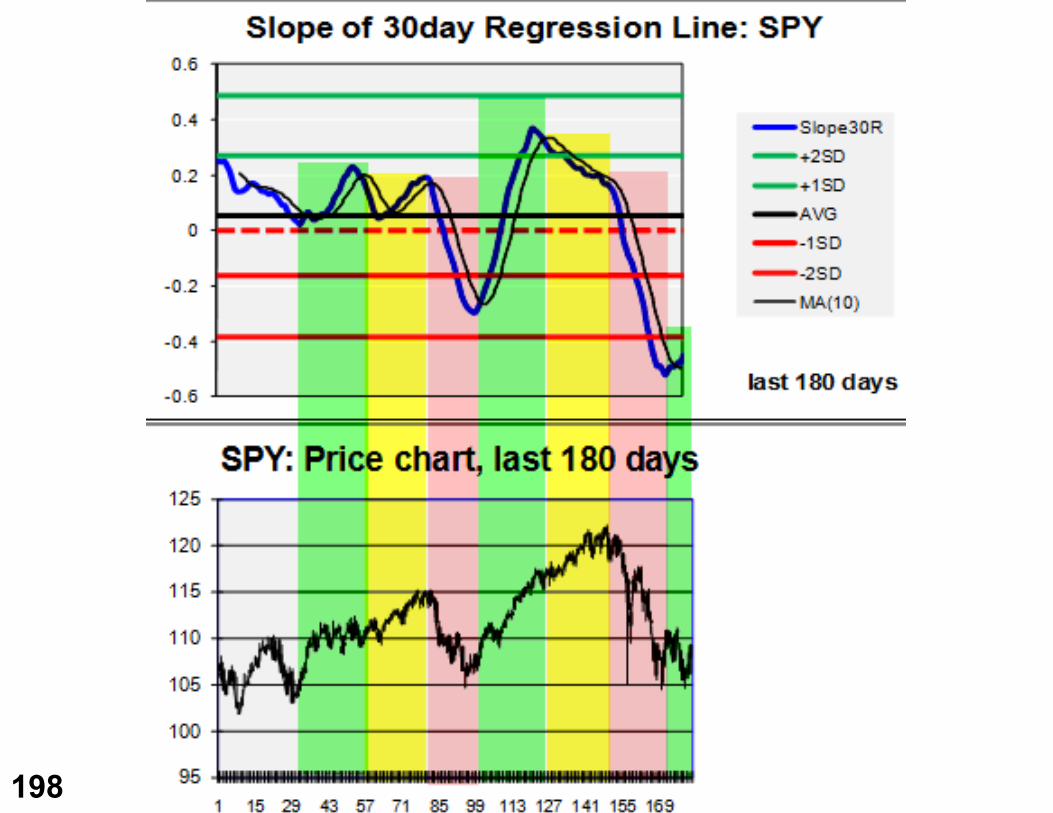
198
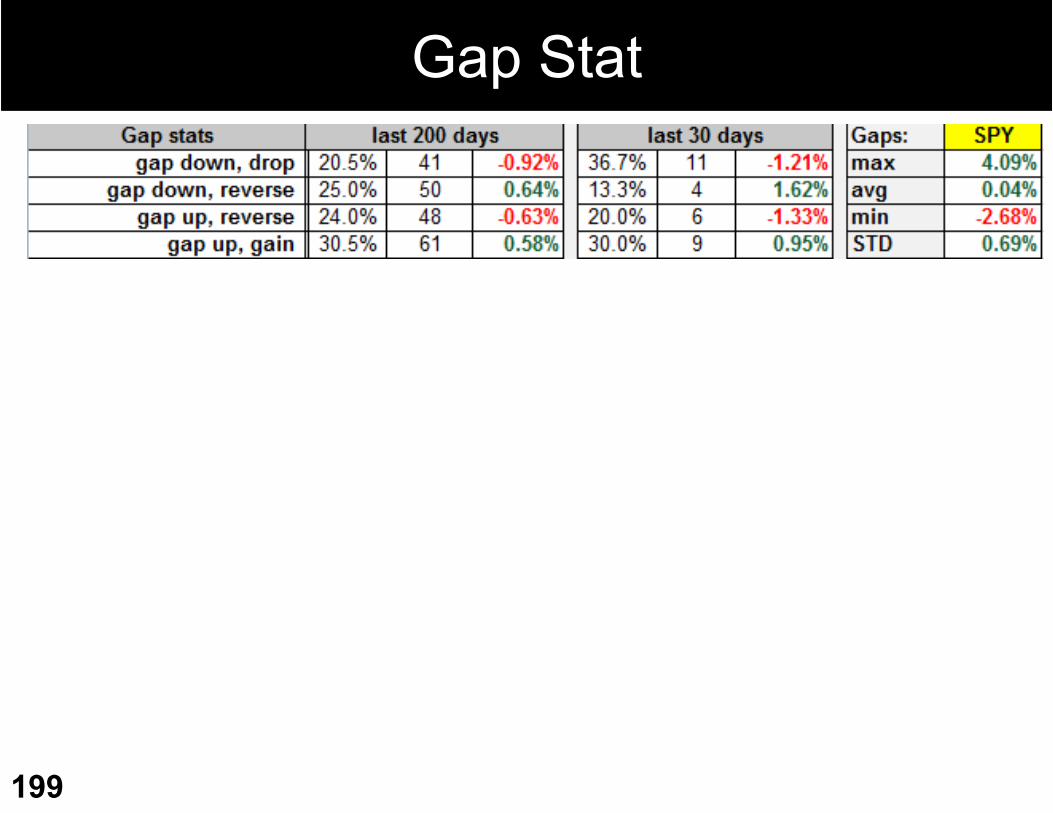
Gap Stat
199
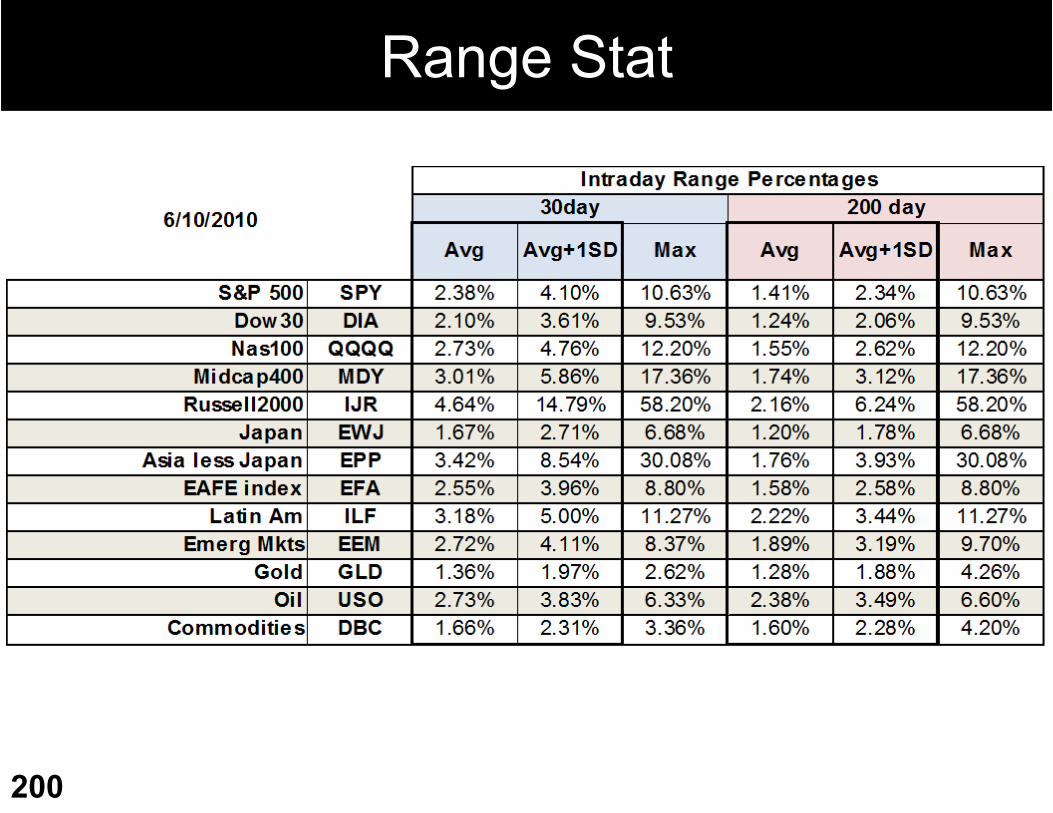
Range Stat
200
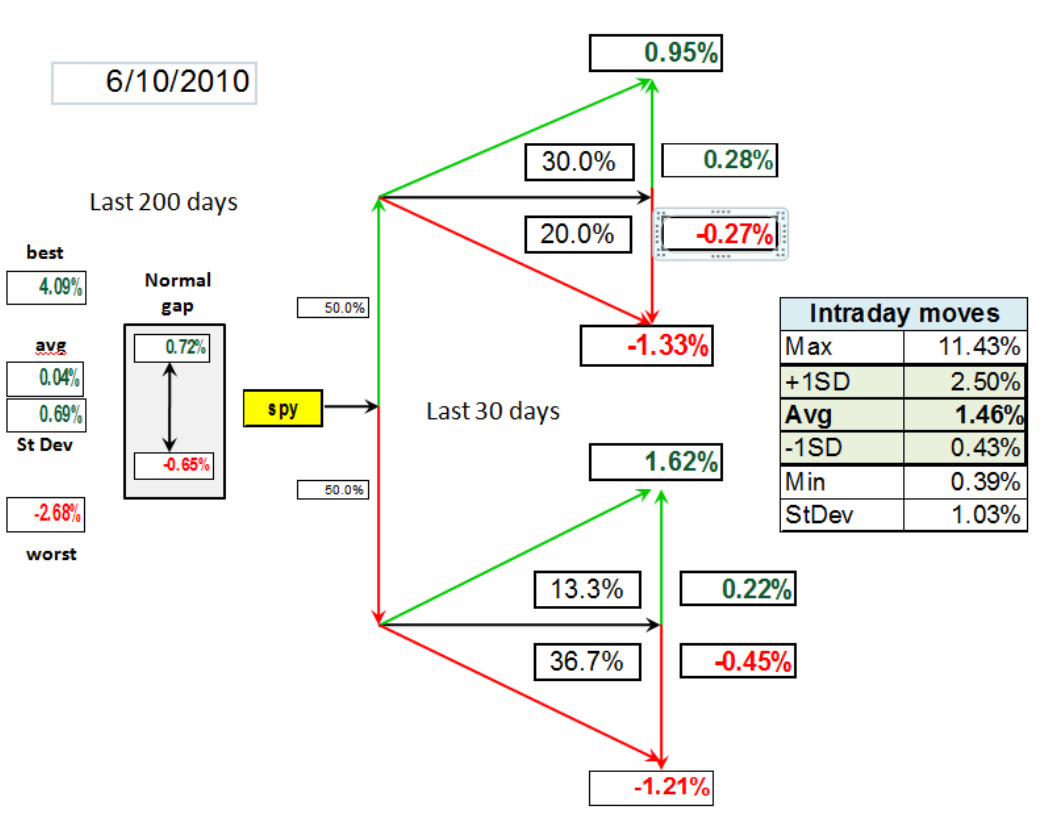
201


