64
Introduction to demography. Presentation and calculation of basic demographic indicators
Introduction to demography. Presentation
and calculation of basic demographic
indicators

Public health I.
• Course Requirements
• Homepage: http://semmelweis.hu/nepegeszsegtan/en/
Head of the department:
Prof. Dr. Károly Cseh
English tutor:
Dr. András Terebessy
Room: XIII. floor 1307.
Tel: 56184 ext.
Mobile: 20 825 0591
Email: [email protected]

Demography
The study of populations, especially with reference to size and density, fertility, mortality, growth, age distribution, migration, and vital statistics and the integration of all these with social and economic conditions. (Last)

Demography
Structure
(point of time)
Dynamism
(period of time)
Status of population(number, structure)
• age• sex• education level• income• households, family• urbanisation• public utilities• information on the home and
it’s facilities• ethnicity
Numerical changes of population (time-frame, place)
Vital statistics
• births (natality)• fertility• deaths (mortality)• reproduction• marital status (marriage,
divorce)
Migration
• Emigration• Commuters• Immigration

Sources of demographic dataSources of demographic dataSources of demographic dataSources of demographic data
Structure:
• Census
• Calculation
• Microcensus (intercensussurveys)
Population dynamic:
• Registration of births and deaths(civil registration
• Location of residence registry
• Immigration registry
• Causes of death – deathcertificate (ICD)
KSH = Hungarian Central Statistical Office
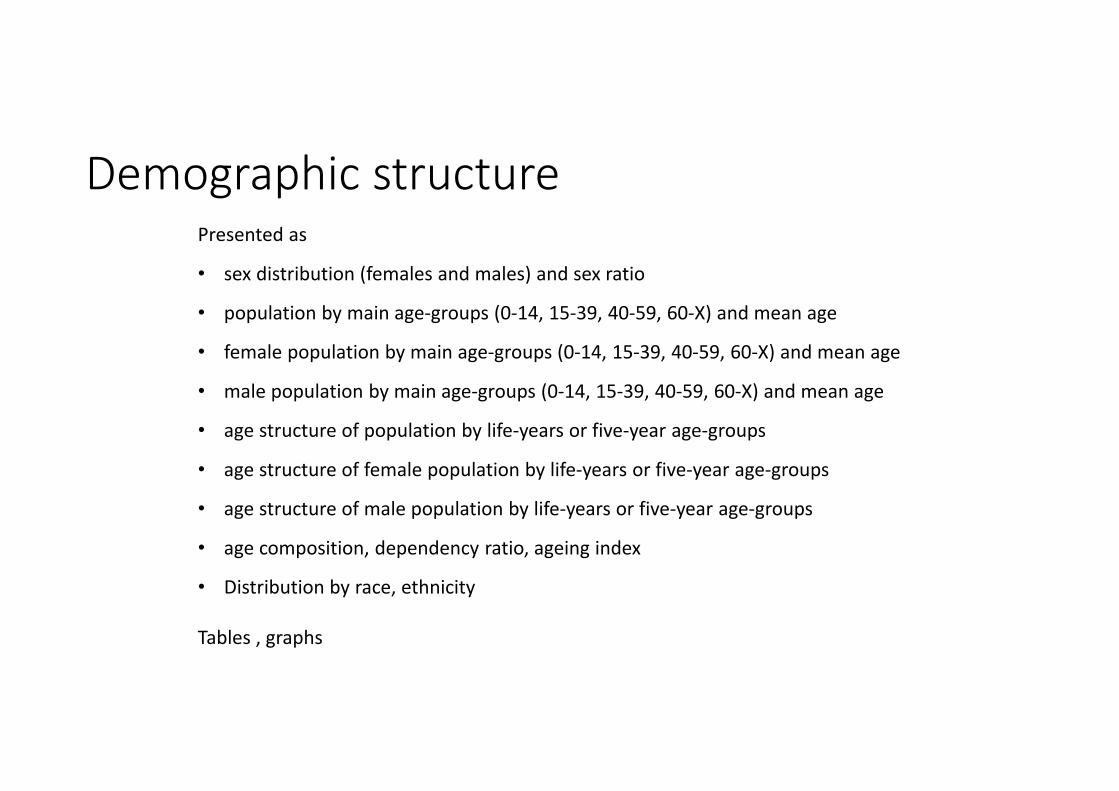
Demographic structurePresented as
• sex distribution (females and males) and sex ratio
• population by main age-groups (0-14, 15-39, 40-59, 60-X) and mean age
• female population by main age-groups (0-14, 15-39, 40-59, 60-X) and mean age
• male population by main age-groups (0-14, 15-39, 40-59, 60-X) and mean age
• age structure of population by life-years or five-year age-groups
• age structure of female population by life-years or five-year age-groups
• age structure of male population by life-years or five-year age-groups
• age composition, dependency ratio, ageing index
• Distribution by race, ethnicity
Tables , graphs

male female total male female total
31 December 1869 2 482 090 2 529 220 5 011 310 49,5 50,5 100,0 1 019
31 December 1880 2 618 954 2 710 237 5 329 191 49,1 50,9 100,0 1 035
31 December 1890 2 965 069 3 044 282 6 009 351 49,3 50,7 100,0 1 027
31 December 1900 3 418 016 3 436 399 6 854 415 49,9 50,1 100,0 1 005
31 December 1910 3 792 344 3 819 770 7 612 114 49,8 50,2 100,0 1 007
31 December 1920 3 874 111 4 112 764 7 986 875 48,5 51,5 100,0 1 062
31 December 1930 4 248 452 4 436 657 8 685 109 48,9 51,1 100,0 1 044
31 January 1941 4 560 875 4 755 199 9 316 074 49,0 51,0 100,0 1 043
01 January 1949 4 423 420 4 781 379 9 204 799 48,1 51,9 100,0 1 081
01 January 1960 4 804 043 5 157 001 9 961 044 48,2 51,8 100,0 1 073
01 January 1970 5 003 651 5 318 448 10 322 099 48,5 51,5 100,0 1 063
01 January 1980 5 188 709 5 520 754 10 709 463 48,4 51,6 100,0 1 064
01 January 1990 4 984 904 5 389 919 10 374 823 48,0 52,0 100,0 1 081
01 February 2001 4 851 012 5 349 286 10 200 298 47,6 52,4 100,0 1 103
01 January 2002 4 836 980 5 337 873 10 174 853 47,5 52,5 100,0 1 104
01 January 2003 4 818 456 5 323 906 10 142 362 47,5 52,5 100,0 1 105
03 January 2004 4 804 113 5 312 629 10 116 742 47,5 52,5 100,0 1 106
01 January 2005 4 793 115 5 304 434 10 097 549 47,5 52,5 100,0 1 107
01 January 2006 4 784 579 5 292 002 10 076 581 47,5 52,5 100,0 1 106
01 January 2007 4 779 078 5 287 080 10 066 158 47,5 52,5 100,0 1 106
01 January 2008 4 769 562 5 275 839 10 045 401 47,5 52,5 100,0 1 106
01 January 2009 4 763 050 5 267 925 10 030 975 47,5 52,5 100,0 1 106
01 January 2010 4 756 900 5 257 424 10 014 324 47,5 52,5 100,0 1 105
01 January 2011 4 743 901 5 241 821 9 985 722 47,5 52,5 100,0 1 105
Year, day , month
Population number Population distribution, % Number of
females per
thousand
males

Age-sex pyramidDemonstration of the demographic structure of the society.
Horizontal x-axes: the life years of women and men alike. The basic unit of this category may be a single year or groups of more years.
Vertical (value) y-axes: the number of persons of each age group.
Changing the axes: the vertical one will show the age categories.
Females are traditionally on the right males on the left side.

Types of age-sex pyramid
Four general types :1. stage 1 of expanding (rapid growth)2. stage 2 of expanding (balanced growth)3. stage 3 stationary (growing older population)4. stage 4 contracting (decreasing population)

Age-sex pyramid of the EU-27 countries: changes
between 1991 and 2011

Projected changes 2011-2060 of the EU-27 countries

Population pyramid8580757065605550454035302520151050
2000 2100 1900
020000400006000080000100000 0 20000 40000 60000 80000 100000


Population dynamics• Diversities in demographic situations across countries and regions, as well as within
countries. • There are two driving forces behind these evolving demographic changes• bio-social phenomena
• birth = natality if related to neonates, fertility if related to mothers • death = mortality (in scientific terms)
• social phenomena (internal and international migration)

Natality
Birth (by WHO definition 1950) as a natality event means live birth (contrasted to the stillbirth) that occurs when a foetus exits the maternal body and subsequently shows any signs of life as• heartbeat,• pulsation of the umbilical cord,• any voluntary movement
Complete birth is the infant’s entire separation from the maternal body (by cutting of the umbilical cord) after 42 completed weeks (294 days) of gestation.Birth in demographic terms may be• Singleton: one offspring produced in the same gestation period• Multiple: two or more offspring produced in the same gestation period• Preterm (PTB): birth of an infant before 37 completed weeks (259 days) of
gestation• Low weight (LBW): the infant’s weight is <2500 gram

Natality
Crude birth rate is the number of live births in a year per 1000 of the population.First the total number of live birth is divided by the mid-year population of the referred territorial unit (e.g. Hungary) and the outcome has to be multiplied by 1000.

Natality
Preterm birth (PTB) rate is the number of preterm born infants per 100 live births in a year.
Low birth weight (LBW) rate is the number of substandard (<2500 gram) weight infants per 100 live births in a year.
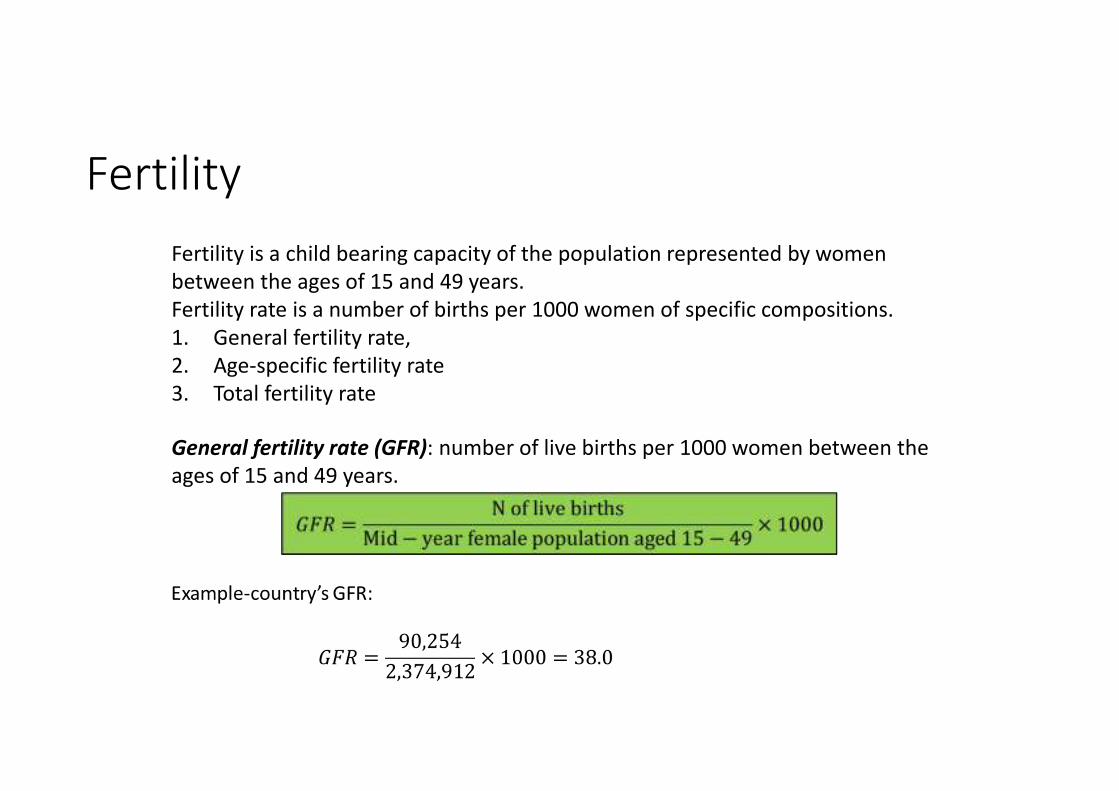
Fertility
Fertility is a child bearing capacity of the population represented by women between the ages of 15 and 49 years.Fertility rate is a number of births per 1000 women of specific compositions.1. General fertility rate,2. Age-specific fertility rate3. Total fertility rate
General fertility rate (GFR): number of live births per 1000 women between the ages of 15 and 49 years.

Fertility
Age-specific fertility rate: number of births to women of a particular age (a year or age group). E.g. females in the age group 20-24 years.

Fertility
Total fertility rate (TFR): average number of children a woman would bear during her reproductive lifetime (15-49 years), assuming her childbearing conforms to her age-specific fertility rate every year of her childbearing years.
Computation of total fertility rate, based on Hungary’s 2010 data:Life year categories
15-19 20-24 25-29 30-34 35-39 40-44 45-49
N. of children 5 220 12 668 25 090 31 489 13 438 2 271 78
N. of women 287 568 314 375 335 856 401 619 388 074 346 058 301 362
Fertility rate 0,02 0,04 0,07 0,08 0,03 0,01 0,00 N. of children/women in five years
0,10 0,20 0,35 0,40 0,15 0,05 0,00
From biological point of view (without concerning migration and at a stable level of mortality) TFR indicates clearly the trend of the human reproduction. The cut value is TRF=2, which means that mother and father in the family will be replaced by 2 children.
TFR greater than 2 means growing population
TFR less than 2 means decreasing number of the population

A world map showing countries by TFR, from 7-8 children to 0-1 children
The colour bar indicates TFR 7-8 at the top and TFR 0-1 at the bottom.


Reproduction ratios
Gross reproduction rate (GRR): The sum of the age-specific female fertility rates (births of daughters), for all reproductive age groups for a particular period (usually a year) conventionally expressed per woman. The GRR indicates how many daughters a woman would have if, throughout her reproductive life, she had children at the age-specific rates prevalent in the specified year of period. The GRR can be calculated either by summing female age specific fertility rates, (relating to births of daughters rather than all births) or using the formula
GRR = TFR × Proportion of female births
The proportion of female births can be taken as 0.488 (100/205) in the absence of more detailed information.
Net reproduction rate (NRR): The average number of daughters that would be borne, according to specified rates of mortality and of bearing daughters, by a woman subject through life to these rates. The NRR employs the same fertility data as the GRR, but also takes into account the effects of mortality. An NRR of 1 indicates that a population's fertility and mortality levels would result in exact replacement of mothers by daughters.


Mortality
Mortality is a relationship of death cases to the whole population. Two basic types of mortality:1. General (crude) mortality rate or death rate2. Specific mortality rates
• Age and sex related (special rates: infant mortality and foetal losses)• Cause related (diseases, injuries, suicide, homicide) • Life expectancy (sex and age related)
Crude death rate (or mortality rate) is the number of death cases in a year per 1000 of the population.

MortalityAge and sex related mortality rate: CMRs can be computed for both genders and age groups. The age group under 1 year is separately treated (the infant mortality).
General population between 40-49 years:

Mortality

Frequency of deaths by age

MortalityInfant mortality rate: is the number of deaths of infants under one year (365 days) old in a given year per 1,000 live births occurred in the same year. This rate is divided up for 4 subgroups and often used as an indicator of the level of health in a country.
Indicators of the level of health in
a country{

MortalityGeneral infant mortality rate
Perinatal mortality rate: Separated perinatal mortality (first 24 hours) does not include stillbirths:

MortalityPostnatal mortality rate:
Neonatal mortality rate:
Postneonatal mortality rate:

Infant mortality rateInfant mortality rateInfant mortality rateInfant mortality rate
• neonatal (0-27 days)
early (0-6 days)
late (7-27 days)
• Post-neonatal (from day 28 – to 1 year)

Infant mortality rate

World map of infant mortality rates in 2008
Infant mortality rate in Hungary, 2013: 5,1

Infant mortality rate

Infant mortality rate by GDR per
capita
1 Angola 182.31
2 Sierra Leone 156.48
3 Afghanistan 154.67
4 Liberia 143.89
5 Niger 115.42
218 Iceland 3.25
219 Hong Kong 2.93
220 Japan 2.80
221 Sweden 2.75
222 Singapore 2.30
Hungary (2007): 5,9

0 7 28 1 year
days
neonatal post-neonatal
+perinatal mortality
0-6 7-27
conception 24th week stillbirth livebirth
Foetal losses(intrauterin deaths)
Infant deaths(extrauterin deaths)
induced abortions
early and midterm foetal deaths
stillbirths(late foetal deaths)

MortalityFoetal loss is defined as a total sum of foetal death cases and induced abortions.
Foetal death cases may be related to the number of live birth or the number of fertile female population.
Abortion is the termination of pregnancy either spontaneous or induced.In demography abortion means induced and legally regulated procedure for termination of pregnancy irrespective of medical or other legal reasons.


0
20 000
40 000
60 000
80 000
100 000
120 000
140 000
160 000
180 000
200 000
1957. 1960. 1965. 1970. 1975. 1980. 1985. 1990. 1995. 2000. 2001. 2002. 2003. 2004. 2005. 2006. 2007. 2008. 2009. 2010. 2011.
Induced abortion in Hungary, 1957-2011


0
50 000
100 000
150 000
200 000
250 000
1950 1955 1960 1965 1970 1975 1980 1985 1990 1995 2000 20050,0
50,0
100,0
150,0
200,0
250,0
300,0
350,0
Terhesség-megszakítások száma 100 élveszületésreÉlveszületések számaTerhességmegszakítások száma
Number of induced abortions per hundred live birthsNumber of live birthsNumber of induced abortions

FoetalFoetalFoetalFoetal losseslosseslosseslosses, , , , 2013.2013.2013.2013.
Number of foetal deaths per hundred live births: 18,6
Number of induced abortions: 34891
Number of induced abortions per hundred live births: 39,3
Total number of foetal losses: 51388
Number of foetal losses per hundred live births: 57,9
Number of deaths: 126778

Mortality
Maternal mortality
• special case of sex-related mortality.
• Represents death cases of women who die during pregnancy and childbirth inclusive the first 42 days after the delivery (WHO definition).
• The number per year is relatively small (developed countries), thus maternal mortality rate is computed per 100,000 live births.
• ~ 11/100,000 in the developed countries.

Mortality
Cause related mortality
Demography is concerning only the main types of diseases, motor vehicle accidents and suicide (homicide).


Causes of death

Causes of death

Life expectancy
Life Life Life Life expectancyexpectancyexpectancyexpectancy::::
the average number of years an individual of a given age is
expected to live if current age-specific mortality rates continue to
apply. Every cohort had different experiences in its earlier life thatmight have influenced its mortality rate in a given year.
Life Life Life Life expectancyexpectancyexpectancyexpectancy atatatat birthbirthbirthbirth::::
Average number of years a newborn is expected to live if current
mortality structure persists throughout its life.
Because of the gender difference, life expectancy is calculated alsoseparately for men and women.Life expectancy is a hypothetical measure and indicator of current
health and mortality conditions.

Life expectancy data at birth in the 27 EU member countries and non-member countries from 1980 to 2011

Life expectancy

Life expectancy

Population growth


Main demographic dataMain demographic dataMain demographic dataMain demographic data
2009 2011 2013Per 1000
Live births 9,6 8,8 9,0Deaths 13,0 12,9 12,8
Marriage 3,7 3,6 3,7Divorce 2,4 2,3 2,0Infant mortality rate(per 1000 live births) 5,1 4,9 5,1Total fertility rate 1,33 1,24 1,34Life expectancy at birth 74,03 74,67 75,37Male 70,05 70,93 72,01Female 77,89 78,23 78,73

Demographic data 2013.
Population(1000
people)Live births Deaths
Populationgrowth
Crude birthrates
Crudedeathrates
Populationgrowth (1000
people)
Total fertilityrate
9 908 88 689 126 778 -38 089 9.0 12.8 -3.8 1,34
Life expectancy: women (78,73), men (72,01)
Infant mortality rate: 5,1
Induced abortions: 34 891 (2012: 36 118, 2011: 38441)

Causes of death in Hungary, 2013.(ICD.)
Cancer 32 748
AMI 6 519
Other ischaemic heart disease 25 585
Cerebrovascular diseases 12 828
Respiratory diseases 5 291
Hepatic diseases 3 324
Suicide 2 093
Összhalálozás 126 778


