journa l homepage: www.elsev ier .com/ locate /eco lmodel
nvasive species distribution modeling (iSDM): Are absence data and ispersal constraints needed to predict actual distributions?
omᡠ∗, Ross K. Meentemeyer s Václavík
enter for Applied Geographic Information Science (CAGIS), Department of Geography and Earth Sciences, niversity of North Carolina at Charlotte, 9201 University City Blvd, Charlotte, NC 28223, USA
r t i c l e i n f o a b s t r a c t
rticle history: eceived 22 May 2009 eceived in revised form 12 August 2009 ccepted 14 August 2009 vailable online 9 September 2009
eywords: pecies distribution model nvasive species seudo-absence data ispersal odel assessment
patial prediction udden oak death
Species distribution models (SDMs) based on statistical relationships between occurrence data and underlying environmental conditions are increasingly used to predict spatial patterns of biological invasions and prioritize locations for early detection and control of invasion outbreaks. However, invasive species distribution models (iSDMs) face special challenges because (i) they typically violate SDM’s assumption that the organism is in equilibrium with its environment, and (ii) species absence data are often unavailable or believed to be too difficult to interpret. This often leads researchers to generate pseudo-absences for model training or utilize presence-only methods, and to confuse the distinction between predictions of potential vs. actual distribution. We examined the hypothesis that true-absence data, when accompanied by dispersal constraints, improve prediction accuracy and ecological understanding of iSDMs that aim to predict the actual distribution of biological invasions. We evaluated the impact of presence-only, true-absence and pseudo-absence data on model accuracy using an extensive dataset on the distribution of the invasive forest pathogen Phytophthora ramorum in California. Two traditional presence/absence models (generalized linear model and classification trees) and two alternative presence-only models (ecological niche factor analysis and maximum entropy) were developed based on 890 field plots of pathogen occurrence and several climatic, topographic, host vegetation and dispersal variables. The effects of all three possible types of occurrence data on model performance were evaluated with receiver operating characteristic (ROC) and omission/commission error rates. Results show that pre
diction of actual distribution was less accurate when we ignored true-absences and dispersal constraints. Presence-only models and models without dispersal information tended to over-predict the actual range of invasions. Models based on pseudo-absence data exhibited similar accuracies as presence-only models but produced spatially less feasible predictions. We suggest that true-absence data are a critical ingredient not only for accurate calibration but also for ecologically meaningful assessment of iSDMs that focus on predictions of actual distributions.
. Introduction
Scientists have long sought a predictive understanding of theeographical distribution of ecological entities (species, popuations, ecosystems). Species distribution models (SDMs) haverovided a popular analytical framework for predicting species disributions by relating geo-located observations of occurrence tonvironmental variables that contribute to a species’ survival and
ropagation (Franklin, 1995; Guisan and Zimmermann, 2000). This elation is based on statistically or theoretically derived response unctions that characterize the environmental conditions associted with the ecological niche of a given organism (Austin, 2007).
When applied in a geographic information system (GIS), SDMs can produce spatial predictions of occurrence likelihood at locations where information on species distribution was previously unavailable. Recent advancements in geospatial and statistical modeling methodologies along with growing availability of species data have enabled SDMs to increasingly tackle a range of pressing ecological problems, such as managing rare and endangered species and predicting species’ responses to climate change and human modifications of habitat structure (Guisan and Thuiller, 2005). Due to globalization and extensive land transformations that facilitate the transfer and establishment of non-native organisms, SDM meth
ods are also being increasingly used to predict spatial patterns of biological invasions and prioritize locations for early detection and control of invasion outbreaks (Peterson and Vieglais, 2001; Fonseca et al., 2006; Lippitt et al., 2008; Meentemeyer et al., 2008; Strubbe and Matthysen, 2009).
t c it v a al bt a on gt an de p t L a a a p u g c L t i s o
tt i e L Pbfco
T. Václavík, R.K. Meentemeyer / Eco
Invasive species distribution models (iSDMs) face two specialhallenges because the ecological theory and assumptions underying SDMs typically do not apply to invasive species. The firsthallenge is that, by definition, the assumption of equilibriumetween organisms and their environment is violated, and potenial dispersal limitations of the invader are often ignored. As mostDMs implicitly rely on ecological niche concepts (Grinnell, 1917;utchinson, 1957), they assume that species occur at all locationshere the environmental conditions are favorable and that disersal is not a limiting factor (Jeschke and Strayer, 2008). However,
nvasive species are often absent at particular locations not becausef low habitat quality but because the species has not dispersed tohat site due to stochastic events, geographical barriers and disersal constraints (Higgins et al., 1999; Araujo and Pearson, 2005;raujo and Guisan, 2006). Although dispersal limitations, more
han biotic interactions, stochastic events or abiotic factors, arenown to play a major role in the spread of invasions (Hastingst al., 2005; Soberon and Peterson, 2005; Araujo and Guisan, 2006),ew studies to date have tested empirically the benefits of includingispersal constraints in iSDMs (Meentemeyer et al., 2008).
The second challenge is that absence data are typically not usedo develop or evaluate iSDMs. In practice, absence data are oftenited as unavailable or they are ignored due to a perceived difficultynterpreting the meaning of absences at presumably suitable habiats. To overcome the obstacle of lacking data on species absence, aariety of presence-only profile techniques have been introducednd tested comprehensively for a number of native taxa (Seguradond Araujo, 2004; Elith et al., 2006; Tsoar et al., 2007). Nevertheess, application of presence-only techniques to iSDM is complexecause the environmental space profiling tends to predict potenial distribution of invasion rather than actual distribution (Guo etl., 2005; Jimenez-Valverde et al., 2008); and rigorous evaluationf distribution predictions is limited when the absence compoent is missing (Hirzel et al., 2006). Alternatively, modelers oftenenerate pseudo-absence data by sampling environmental condiions at locations where the organism is not recorded (Lutolf etl., 2006), but there is always the possibility of introducing false-egative errors into a model. To avoid collecting pseudo-absenceata in potentially suitable locations where the species of interst may actually occur, methods have been proposed which utilizeseudo-absences that are heuristically determined to be outsidehe organism’s ecological domain (Engler et al., 2004; Chefaoui andobo, 2008). However, information on the absence of an organismt favorable sites can be useful in iSDMs when dispersal parametersre incorporated and the goal is to predict the actual distribution ofn invader (Meentemeyer et al., 2008). A further limitation of theseudo-absence approach is that pseudo-absence data are typicallysed in both model calibration and evaluation, thus verifying theoodness of fit of the training data, rather than the true predictiveapability of the model (Zaniewski et al., 2002; Engler et al., 2004;utolf et al., 2006; Chefaoui and Lobo, 2008). To our knowledge,he assumptions of using presence-only and pseudo-absence datan iSDMs have never been tested with extensive true-absence data;uch information is needed to advance ecological conceptualizationf SDMs for biological invasions.
As a consequence of ignoring equilibrium assumptions andrue-absence data in SDMs, we believe that the conceptualizaion of the potential versus actual distribution is often confusedn the practice of species distribution modeling in general, butspecially for biological invasions (Soberon, 2007; Hirzel and Leay, 2008; Jimenez-Valverde et al., 2008; Peterson et al., 2008;
hillips, 2008). Here, we emphasize that a clear distinction should e drawn between the potential and actual distribution in the iSDM ramework. While the potential distribution is a hypothetical conept that refers to locations where an invader could exist based n suitable environmental factors, the actual distribution refers
3249l Modelling 220 (2009) 3248–3258
to locations where the invader actually exists at a specific time, as constrained by environmental and dispersal limitations. This distinction is relevant because SDMs of invasive organisms often assume the potential distribution is being modeled (Peterson et al., 2003; Davis, 2004; Guo et al., 2005; Chen et al., 2007; Giovanelli et al., 2008; Lopez-Darias et al., 2008; Rodder et al., 2008; Strubbe and Matthysen, 2009), although it has been argued that all SDMs de facto quantify the actual distribution, as calibration data represent samples of the current range constrained by biotic, geographic and dispersal limitations (Guisan and Thuiller, 2005; Phillips et al., 2006). The applicability of models that aim to predict potential distribution of invasions is wide, including projections of geographical distribution of species under climate change (Berry et al., 2002; Thomas et al., 2004; Pearson, 2006; Engler et al., 2009) or understanding the behavior of invaders in novel landscapes (Peterson, 2003; Peterson et al., 2003; Sutherst and Bourne, 2009). However, a growing number of publications used SDMs to predict the actual distribution of biological invasions (e.g., Havel et al., 2002; Meentemeyer et al., 2008). The issue of iSDM became an interesting frontier in ecological modeling due to its ability to predict extant consequences of an invasion at unsampled locations. Here, we use the framework defined by Meentemeyer et al. (2008) and apply iSDMs to model the actual invasive distribution which can be used to target locations for early detection surveillance and invasion control, and to quantify the current extent of invasion spread.
In this study, we examine the hypothesis that true-absence data, when accompanied by dispersal information, improves the accuracy and ecological meaning of models designed to predict the actual distribution of a biological invasion. We use an extensive dataset on the occurrence of the invasive forest pathogen Phytophthora ramorum in California to evaluate two questions that address the impact of ignoring absence data and dispersal in iSDMs: (1) Do models calibrated with presence-only, true-absence or pseudo-absence data significantly differ in their performance? (2) Does incorporation of dispersal constraints improve model accuracy? We focus on the capability of iSDMs to predict the actual distribution of invasion because we believe it provides the best analytical framework for early detection and control of invasion outbreaks; and because predictions of actual distribution can be assessed using presence/absence observation data, whereas predictions of potential distribution cannot. To assess how the choice of different types of occurrence data affects prediction accuracy, we compared the performance of two common presence/absence modeling methods (using both true-absence and randomly generated pseudo-absence data) with two common presence-only methods. We further assessed the degree to which incorporating ‘force of invasion’ dispersal kernels influences performance of each model type (Hastings et al., 2005; Allouche et al., 2008; Meentemeyer et al., 2008). All models were evaluated based on presence and true-absence data using k-fold cross-validation, area under the curve (AUC), and commission/omission error rates. Research addressing the effects of including absence data and dispersal constraints on model performance is needed to improve spatial predictions of biological invasions and advance ecological conceptualization of species distribution modeling.
2. Methods
2.1. Target species and presence/absence data
We focused on modeling the actual distribution of the invasive pathogen P. ramorum, a generalist pathogen (Oomycota) causing the emerging infectious forest disease known as sudden oak death. Since its introduction in 1990s, the pathogen has reached epidemic levels in coastal forests of California and south-western Oregon,
3 logica
kp t o ( ib d a ( ra u l 2 o a a b
m fitMad
Fs
250 T. Václavík, R.K. Meentemeyer / Eco
illing large numbers of oak (Quercus sp.) and tanoak (Lithocarus densiflorus) trees (Rizzo and Garbelotto, 2003). The disease ishought to be primarily transmitted via infective spores formedn the leaves of foliar hosts, such as the evergreen tree bay laurelUmbellularia californica), which are passively dispersed to nearbyndividuals via rain splash and from stand to stand via windlown rain (Rizzo and Garbelotto, 2003; Davidson et al., 2005). Toate, spread of the pathogen has been patchily distributed acrosspproximately 10% of its geographical host range in CaliforniaMeentemeyer et al., 2008) with considerable forest area facingisk of infection due to widespread host availability and presumbly suitable habitat conditions (Rizzo et al., 2005). A predictivenderstanding of P. ramorum distribution is needed to prioritize
ocations for early detection and control of invasion (Rizzo et al.,005; Meentemeyer et al., 2008). P. ramorum is an ideal targetrganism for our modeling purpose in this study because it isctively invading native habitats, it is moderately dispersal limited,nd there are numerous susceptible habitats in California that areoth close and far in distance to known sources of inoculum.
To obtain reliable occurrence data for calibration and assessent of our predictive models, we surveyed 890 early detection
eld plots for the presence and absence of P. ramorum over he summers of 2003, 2004, and 2005 (Fig. 1; described in
eentemeyer et al., 2008). Field plot locations were distributed in stratified-random manner across five levels of habitat suitability efined by Meentemeyer et al. (2004), with variable proximities
ig. 1. Map of 890 field plots surveyed for the presence of Phythopthora ramorum in Cusceptible forest across a range of environmental conditions.
l Modelling 220 (2009) 3248–3258
to infected sites previously confirmed by the California Department of Food and Agriculture (CDFA). A minimum distance of 400 m between individual plots was enforced to avoid sampling within the scale at which the disease is known to be clustered (Kelly and Meentemeyer, 2002).
At each plot location, we established two 50 m × 10 m “L-shaped” transects to determine the occurrence of P. ramorum. Along each transect up to 25 necrotic leaves were collected from five of the most visually symptomatic individuals from over a dozen foliar host species (Meentemeyer et al., 2008). Symptomatic samples were processed and cultured in the laboratory on a selective media for Phytophthora species (Hayden et al., 2004) and as an additional test any negative cases were resampled with a polymerase chain reaction (PCR)-based molecular assay, using primers designed to amplify P. ramorum DNA (Ivors et al., 2004). The pathogen was only considered absent at a location if there was no positive culture isolation and no PCR detection of pathogen DNA in the leaf samples. This sampling design enabled the collection and discrimination of reliable presence (n = 78) and true-absence (n = 812) data on P. ramorum invasion across the entire state of California.
To examine the effect of pseudo-absence data on model per
formance, we randomly selected 812 pseudo-absence locations from the same range of susceptible host vegetation as used for the real plot data described above, not allowing the locations to occur within 400 m of one another and the plots (Fig. 1). We generated the same number of pseudo-absences as true-absences to
alifornia and distribution of 812 pseudo-absence points randomly generated in
logica
a t s w 2 m 2 a m
2
h i k ds 8 p 3 r 2 v it mm ct e im t b 2 m
2
d i a t e
F
w o t l ( a lw 2 p d (
fiH
T. Václavík, R.K. Meentemeyer / Eco
void potential bias caused by different levels of prevalence inhe presence/absence datasets (Manel et al., 2001). Although sometudies suggest that pseudo-absence data should be limited to areasith clearly unsuitable environmental conditions (Zaniewski et al.,
002; Engler et al., 2004), invasive species are inherently absent atany environmentally favorable locations (Pulliam, 2000; Austin,
002). Therefore, we purposely distributed pseudo-absence datacross all levels of environmental suitability in an effort to produceodels reflecting the actual distribution of the invasion.
.2. Environmental predictor variables
We calculated a set of eight environmental variables that weypothesized would predict the actual distribution of P. ramorum
n California. To characterize moisture and temperature conditionsnown to affect foliar plant pathogens (Woods et al., 2005), weerived four climate variables from the parameter elevation regresion on independent slopes model (PRISM; Daly et al., 2001) at00 m spatial resolution. Maximum and minimum temperature,recipitation and relative humidity were aggregated to provide0-year monthly average values between December and May, theeproductive season for P. ramorum in California (Davidson et al.,005). We also mapped elevation and derived two topographicariables, solar insolation index (SII) and topographic moisturendex (TMI), using a U.S. Geological Survey 90-m digital elevaion model. The SII was calculated for each cell as the potential
ean solar radiation in the rainy season using the cosine of illuination angle on slope equation (Dubayah, 1994). The TMI was
alculated as the natural log of the ratio between the upslope conributing drainage area and the slope gradient of a grid cell (Mooret al., 1991). Finally, we mapped the spatial distribution of the keynfectious host bay laurel (Umbellularia californica) using data sum
arized in Meentemeyer et al. (2004). This species is consideredo be the most epidemiologically important host for P. ramorumecause it produces large amounts of inoculum (Davidson et al.,005; Anacker et al., 2008) and it is associated with oak and tanoakortality (Kelly and Meentemeyer, 2002; Maloney et al., 2005).
.3. Dispersal constraints
To incorporate the effect of dispersal constraints on the actualistribution of P. ramorum, we quantified the potential force of
nvasion on each field plot (Hastings et al., 2005; Meentemeyer etl., 2008) and included it as an additional predictor variable intohe models. The force of invasion (Fi) was calculated as a negativexponential dispersal kernel:
N ( −dik )
i = exp (1)a
k=1
here dik is the Euclidean distance between each potential sourcef invasion k and target plot i. The parameter a modifies the form ofhe dispersal kernel where low values of a indicate high dispersalimitation and high values of a indicate low dispersal limitationHavel et al., 2002; Meentemeyer et al., 2008). The optimal value of was selected based on the goodness of fit of the best generalizedinear model based on true-presence/true-absence data, to which Fi
ith varied values of a was iteratively added (Meentemeyer et al.,008). We used the negative exponential dispersal kernel becauserevious research has shown that this kernel adequately describesispersal characteristics of rain splash dispersed plant pathogens
McCartney and Fitt, 1985; Fitt et al., 1989).
Empirically calculating negative exponential dispersal kernel rom distribution data is a common method to represent force of nvasion in models of spatial spread of invasions (Havel et al., 2002; astings et al., 2005; Meentemeyer et al., 2008). However, it can be
3251l Modelling 220 (2009) 3248–3258
used only when data allow it. Since true-absence species data are required to fit the optimal form of the dispersal kernel, the negative exponential dispersal kernel was only applied in true-absence data models. For the presence-only and pseudo-absence data models, we implemented prevailing best practice conditions and necessarily used a simplified version of force of invasion according to a method suggested by Allouche et al. (2008). Here, we calculated acumulative distance metric that incorporates dispersal limitationsin iSDMs without explicitly estimating the dispersal characteristicsof the organism (Allouche et al., 2008). The cumulative distance (Di) sums the inverse of the squared Euclidean distances dik between each potential source of invasion k and target plot i:
N 1 Di = (2)
(dik)2k=1
We calculated both force of invasion terms based on negative exponential dispersal kernel and inverse cumulative distance using the distance from our early detection sample plots to all sources of inoculum confirmed by the California Department of Food and Agriculture in 2005. These reference data maintained by the California Oak Mortality Task Force (COMTF; Kelly and Tuxen, 2003) are independent from our sample plots used to calibrate the models.
2.4. Models
We used four commonly applied modeling methods to evaluate the impact of presence-only, true-absence and pseudo-absence data on prediction of the actual distribution of P. ramorum in California. For each of the three data assumption types, we used both parametric and non-parametric techniques to model the relative likelihood of pathogen occurrence, in order to account for variations between different algorithm families (Elith and Burgman, 2003; Elith et al., 2006). To evaluate each model under normal practice conditions, model calibration and variable selection were conducted on an individual basis. To test the importance of dispersal limitation, we developed models based on: (i) the environmental variables only, and (ii) the combination of environmental variables and dispersal constraints (hybrid models).
2.5. Presence-only models
2.5.1. Ecological niche factor analysis (ENFA) In the multidimensional space of ecological variables, ENFA
compares the distribution of locations where the focal species was identified to a reference set describing the whole study area (Hirzel et al., 2002). Similar to principal component analysis (PCA), it computes uncorrelated factors that explain a major part of the ecological distribution of the species. Two types of factors with biological significance are extracted: (i) marginality describes how the species optimum differs from the global mean of environmental conditions in the study area; (ii) specialization (tolerance) factors sorted by decreasing amount of explained variance describe how species variance compares to the global variance. Using the BIOMAPPER software (Hirzel et al., 2007) version 4.0, we calculated correlations between variables prior ENFA analyses and removed predictors with correlation coefficients greater than 0.5. The number of retained factors was determined based on their eigenvalues compared to the “broken-stick” distribution (McArthur, 1957), and
ranged between 2 and 4 factors with 91–95% of explained variability. We computed the final prediction maps using the Medians algorithm. Recommended Box–Cox transformation of predictor variables produced poorer results than raw data and was thus not used in the final models.
3 logica
2
b m t tp e oi a 3 as (
2
2
a a mt (a Il s
l
w o t m p cfi O cp a f e
2
pt v F u 2 “a t l ( aoesd
error rates, we report the total area predicted by each model to illu
252 T. Václavík, R.K. Meentemeyer / Eco
.5.2. Maximum entropy (MAXENT) MAXENT is a machine-learning method that estimates distri
utions of organisms by finding the probability distribution ofaximum entropy (i.e., the most uniform) given the constraint
hat the expected value of each environmental predictor underhis estimated distribution matches the empirical average of samle locations (Phillips et al., 2006). We iteratively weighted eachnvironmental variable to maximize the likelihood to reach theptimum probability distribution, and then divided it by a scalng constant to ensure a predicted range between 0 and 1 (Elithnd Burgman, 2003). We utilized the MAXENT software version.2.1 using a maximum of 500 iterations and the logistic output,nd employing the regularization procedure in order to compenate for the tendency of the algorithm to overfit calibration dataPhillips et al., 2006).
.6. Presence/absence models
.6.1. Generalized linear model (GLM) GLM is an extension of common multiple regression that
llows for modeling non-normal response variables (McCullaghnd Nelder, 1989). Most frequently used for SDM is the logisticodel that employs a maximum likelihood parameter optimiza
ion technique to model the log odds of a binary response variableFranklin, 1995; Miller, 2005). Using both true-absence and pseudo-bsence species data, we fitted all models in JMP 7.0 (SAS Institutenc., Cary, NC) specifying a binomial error distribution and logitink function. The logit transformation of the probability (pi) that ausceptible plot becomes invaded was calculated as
8
ogit(pi) = log pi = ˇo + ˇjxj + ˇFi (3)
1 − pi j=1
here ˇ is the regression coefficient, x1, x2, . . ., x8 are the setf environmental variables, and Fi is the force of invasion. Weested all possible subsets of variables using the combination of
anual selection and stepwise regression with p-to-enter and/or-to-remove equal to 0.05 and 0.10. The best model selection wasonducted based on logit R2 (also known as the uncertainty coefcient U) and negative log-likelihood ratio test (LRT) (Johnson andmland, 2004). We focused on LRT over the Akaike’s informationriterion (AIC) because previous SDM studies showed that LRT outerformed AIC, producing more parsimonious models (Maggini etl., 2006; Austin, 2007). Pairwise interaction terms were also testedor significance; higher order combinations of variables were notxplored.
.6.2. Classification trees (CT) CT is a non-parametric, data-driven method that recursively
artitions data into homogeneous groups based on identificaion of a specific threshold for each environmental predictorariable (Franklin, 1995; De’ath and Fabricius, 2000; Miller andranklin, 2002). We produced a tree of hierarchical decision rulessing IDRISI 15 (The Andes Edition, Clark Labs/Clark University,006, Worcester, MA) to split data into “mostly present” andmostly absent” classes using both true-absence and pseudo-bsence species data. We used the Gini splitting rule that measureshe impurity of pixels at a given node and thus attempts to find theargest homogeneous class and isolate it from the rest of the datasetEastman, 2006). To avoid the likely overfit of calibration data, we
uto-pruned the final tree, eliminating leaves with pixel counts less r equal to 3%. The proportion of observations correctly classified at ach terminal node represents the approximate degree of memberhip of unsampled data associated with the same ecological factors efined by the node (Miller, 2005). This degree of membership is
l Modelling 220 (2009) 3248–3258
then analogous to the probability of occurrence defined by, e.g., a GLM model.
2.7. Assessment of model performance
For each of the four methods, we assessed spatial predictions of P. ramorum actual distribution with true-presence/true-absence data, using k-fold cross-validation technique, area under the curve (AUC) of the receiver operating characteristic (ROC), and simple threshold assessment based on the commission/omission errors minimizer. Although some SDM studies in the past applied resubstitution techniques (for review see, e.g., Araujo et al., 2005), in which the same data used for calibration are used to verify the models, an independent evaluation or data splitting is recommended to ensure a degree of independence from the events used to make the predictions (Guisan and Zimmermann, 2000; Araujo and Guisan, 2006; Jeschke and Strayer, 2008). We employed k-fold cross-validation, dividing the occurrence dataset into k independent partitions, using k-1 for model calibration and the left-out partition to evaluate the models with AUC, while repeating this procedure k times (Hirzel et al., 2006). Having a large dataset (n = 890) and 9 predictor variables, we used the heuristic recommended by Fielding and Bell (1997) that approximates the training (calibration) dataset to consist of 75% of samples, i.e., k = 4.
For each model, we calculated AUC of the ROC function to provide a threshold and prevalence independent measure of models’ performance (Fielding and Bell, 1997). ROC compares a rank map of predicted species occurrence against a boolean map of true occurrence and plots the true positive rate (sensitivity) as a function of false positive rate (1-specificity or commission error) at each possible threshold (Pontius and Schneider, 2001). The area under the plotted line is the AUC statistic that provides a single discrimination measure, equivalent to the non-parametric Wilcoxon test, across all possible ranges of thresholds (Lobo et al., 2008). In order to avoid rank ordering that can lead to locations of the same likelihood value being calculated at different thresholds and thus introducing potential bias in the ROC curve (Lippitt et al., 2008; Lobo et al., 2008), we also used simple threshold assessment based on model efficiency (Jimenez-Valverde and Lobo, 2007; Freeman and Moisen, 2008). Assuming equal weights being placed on presences and absences in iSDM, the only correct threshold needed to efficiently transform predicted probabilities to binary presence/absence predictions is the one that minimizes the difference between commission and omission error rates. We calculated the error minimizer for each possible threshold i as
Error minimizer = Min[xi − yi] (4)
where xi is the commission error rate at threshold i and yi is the omission error rate at threshold i. Neither commission nor omission errors were preferred because the aim was to model the actual distribution for the purpose of prioritizing areas for early detection and eradication, and to evaluate practicable current impacts rather than hypothetical potential surfaces. If the omission error rate was high, model prediction would result in overly conservative scenario, where positive sites go undetected. If the commission error rate was high, even marginally suitable areas far from current sources of infection would be predicted, resulting in increased costs of needless sampling and eradication efforts in the field (Meentemeyer et al., 2008). In addition to commission/omission
minate potential over- or under-prediction of actual distribution. Finally, we assessed all models developed with pseudo-absence locations using both true- and pseudo-absence data to investigate the degree of uncertainty introduced in the evaluation process when true-absence data are ignored.
Fig. 2. Thresholded maps of Phythopthora ramorum occurrence predicted by (a) presence-only models, (b) presence/true-absence models, and (c) presence/pseudo-absence models. Areas predicted with environment-only variables are depicted in red; areas predicted with combination of environmental variables and dispersal constraints are in yellow; areas predicted by both environment-only and hybrid models are in orange. Green color indicates susceptible host vegetation predicted as absence. (For interpretation of the references to color in this figure legend, the reader is referred to the web version of the article)
Table 1 Simple threshold assessment for the most efficient models showing: the best threshold, minimized commission/omission error rate for assessment with true-absences, error rate for pseudo-absence models assessed with pseudo-absences, and the total area predicted as presence.
Model group Model With dispersal constraints Environment-only models
Threshold Error rate Error rate (with PsAbs)
Area (km2) Threshold Error rate Error rate (with PsAbs)
Area (km2 )
Presence-only ENFA MAXENT
0.250 0.343
0.270 0.207
– –
8060 4388
0.390 0.357
0.290 0.231
– –
13,678 5,285
3
d (v d m pm C (e o pa ( G (om(
Fc
True-absence
Pseudo-absence
GLM CT GLM-PsAbs CT-PsAbs
0.206 0.051 0.161 0.034
0.192 0.135 0.308 0.230
– – 0.180 0.204
. Results
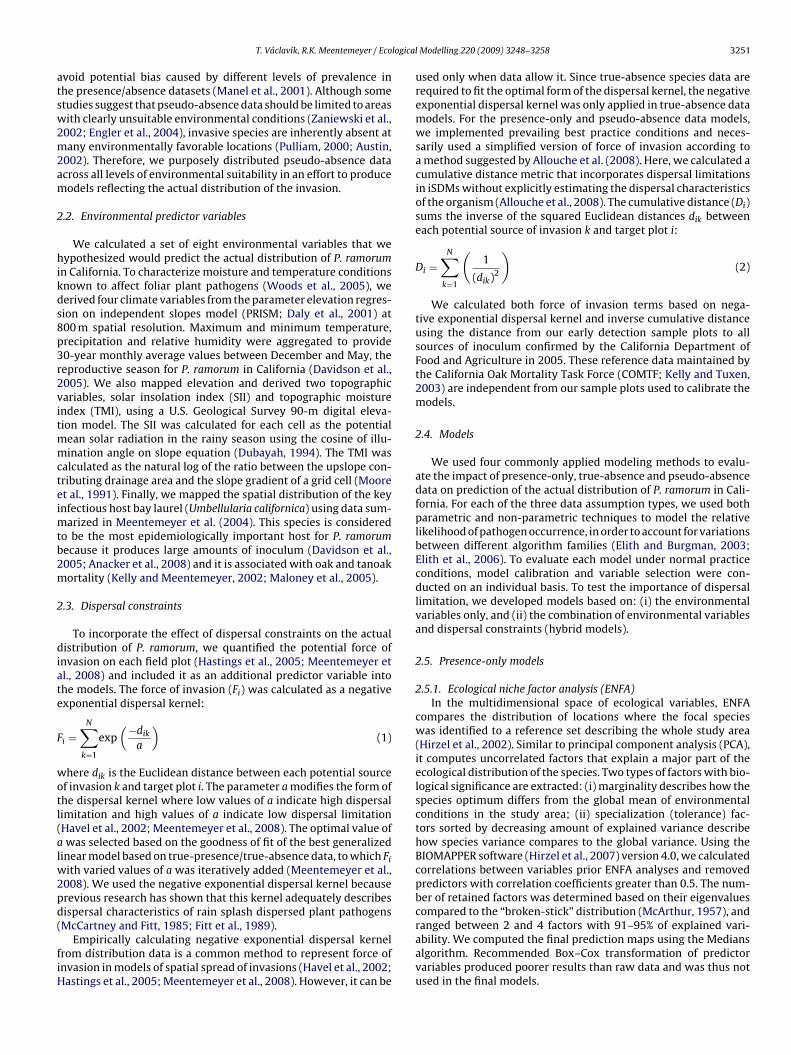
Application of each of the twelve models in the GIS prouced probability maps of actual P. ramorum distribution in 2005Fig. 2). The mean and variability of AUC values obtained via cross-alidation with true-presence/true-absence data showed markedifferences in models’ performances (Fig. 3). The most accurateodels were GLM (AUC = 0.90) and CT (AUC = 0.89) based on
resence/true-absence data with a combination of both environental factors and dispersal constraints. The least accurate were
T models based on environment-only factors with true-absenceAUC = 0.73) and pseudo-absence data (AUC = 0.65); all other modls exhibited accuracies over 0.78 of the AUC statistic. Conversionf the continuous probability maps to a binomial distribution ofredicted presence/absence also shows that models using true-bsences with dispersal constraints were the most efficient: CTcommission/omission error rate = 0.135 at 0.051 threshold) andLM (commission/omission error rate = 0.192 at 0.206 threshold)
Table 1). The highest error rates resulted from models based n pseudo-absences with environment-only variables: CT (comission/omission error rate = 0.346 at 0.034 threshold) and GLM
commission/omission error rate = 0.308 at 0.161 threshold). In
ig. 3. Model performances expressed by AUC for presence-only, presence/true-absenceross-validation runs using true occurrence data. The dot and number in box-plots is the
4471 4421 4925 3263
0.160 0.086 0.161 0.034
0.267 0.272 0.308 0.346
– – 0.180 0.204
8,861 3,724 4,925 8,322
addition, models that used true-absences for calibration had lower variability of AUC from cross-validation results (e.g. SD = 0.018 for GLM with dispersal constraints) than models based on presence-only data or pseudo-absences (e.g. SD = 0.083 for ENFA; SD = 0.089 for CT).
Incorporating dispersal constraints significantly increased the explanatory capacity of most models. Hybrid models were always more accurate than their corresponding environment-only equivalents, with the exception of GLM based on pseudo-absence data where the cumulative distance was not significant in any of the cross-validation runs and therefore not used for final prediction. However, the effect of dispersal constraints varied considerably for different types of modeling groups. When dispersal constraints were omitted, the overall accuracy of modeling groups decreased in the following order: presence-only models, presence/true-absence models, presence/pseudo-absence models. However, the presence-only models, on average, outperformed the models based on presence/absence data because of the good performance by MAX
ENT (AUC = 0.85; commission/omission error rate = 0.231 at 0.357 threshold), while ENFA had AUC = 0.78 and poorer efficiency (commission/omission error rate = 0.290 at 0.390 threshold) than both models using true-absences. In contrast, when dispersal constraints
, and presence/pseudo-absence models. Each box-plot represents the results of all mean AUC.
T. Václavík, R.K. Meentemeyer / Ecologica
F p r i
w w f p
m wm ae E a e c w
wv p t f dv t r C i c
4
t
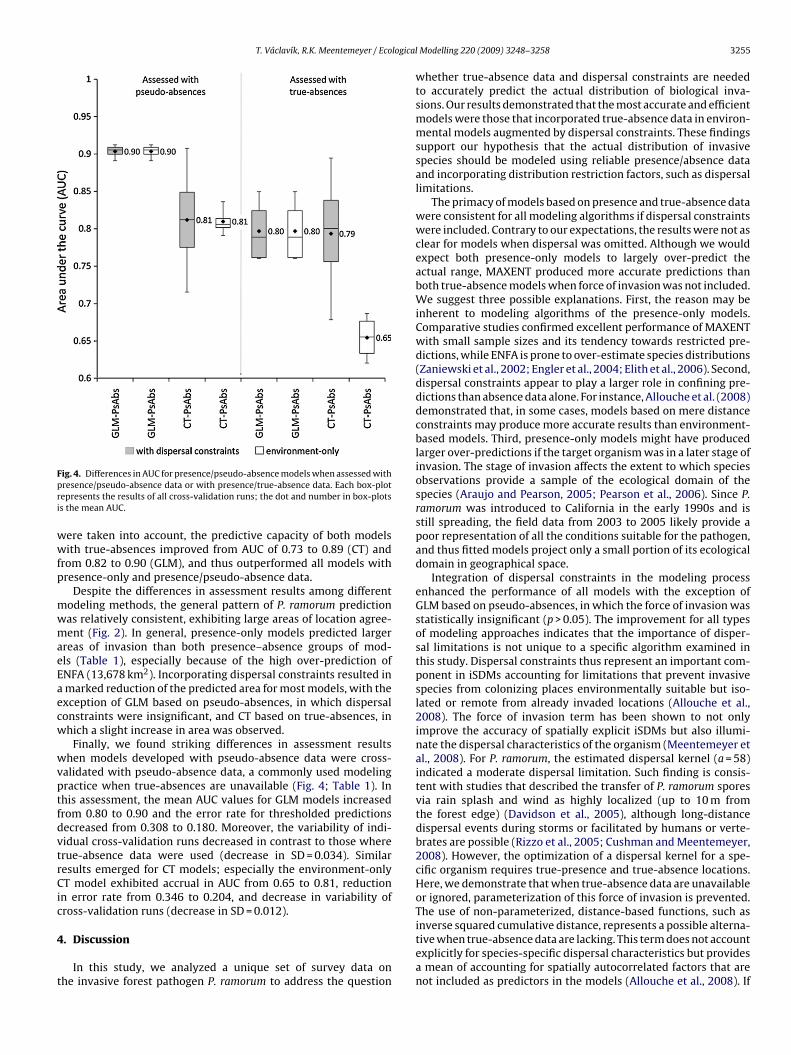
ig. 4. Differences in AUC for presence/pseudo-absence models when assessed withresence/pseudo-absence data or with presence/true-absence data. Each box-plotepresents the results of all cross-validation runs; the dot and number in box-plotss the mean AUC.
ere taken into account, the predictive capacity of both modelsith true-absences improved from AUC of 0.73 to 0.89 (CT) and
rom 0.82 to 0.90 (GLM), and thus outperformed all models withresence-only and presence/pseudo-absence data.
Despite the differences in assessment results among differentodeling methods, the general pattern of P. ramorum predictionas relatively consistent, exhibiting large areas of location agreeent (Fig. 2). In general, presence-only models predicted larger
reas of invasion than both presence–absence groups of modls (Table 1), especially because of the high over-prediction ofNFA (13,678 km2). Incorporating dispersal constraints resulted in marked reduction of the predicted area for most models, with thexception of GLM based on pseudo-absences, in which dispersalonstraints were insignificant, and CT based on true-absences, inhich a slight increase in area was observed.
Finally, we found striking differences in assessment resultshen models developed with pseudo-absence data were cross-
alidated with pseudo-absence data, a commonly used modelingractice when true-absences are unavailable (Fig. 4; Table 1). Inhis assessment, the mean AUC values for GLM models increasedrom 0.80 to 0.90 and the error rate for thresholded predictionsecreased from 0.308 to 0.180. Moreover, the variability of indiidual cross-validation runs decreased in contrast to those whererue-absence data were used (decrease in SD = 0.034). Similaresults emerged for CT models; especially the environment-onlyT model exhibited accrual in AUC from 0.65 to 0.81, reduction
n error rate from 0.346 to 0.204, and decrease in variability ofross-validation runs (decrease in SD = 0.012).
. Discussion
In this study, we analyzed a unique set of survey data on he invasive forest pathogen P. ramorum to address the question
3255l Modelling 220 (2009) 3248–3258
whether true-absence data and dispersal constraints are needed to accurately predict the actual distribution of biological invasions. Our results demonstrated that the most accurate and efficientmodels were those that incorporated true-absence data in environmental models augmented by dispersal constraints. These findingssupport our hypothesis that the actual distribution of invasivespecies should be modeled using reliable presence/absence dataand incorporating distribution restriction factors, such as dispersallimitations.
The primacy of models based on presence and true-absence datawere consistent for all modeling algorithms if dispersal constraintswere included. Contrary to our expectations, the results were not asclear for models when dispersal was omitted. Although we wouldexpect both presence-only models to largely over-predict theactual range, MAXENT produced more accurate predictions thanboth true-absence models when force of invasion was not included.We suggest three possible explanations. First, the reason may beinherent to modeling algorithms of the presence-only models.Comparative studies confirmed excellent performance of MAXENTwith small sample sizes and its tendency towards restricted predictions, while ENFA is prone to over-estimate species distributions(Zaniewski et al., 2002; Engler et al., 2004; Elith et al., 2006). Second,dispersal constraints appear to play a larger role in confining predictions than absence data alone. For instance, Allouche et al. (2008)demonstrated that, in some cases, models based on mere distance constraints may produce more accurate results than environment-based models. Third, presence-only models might have producedlarger over-predictions if the target organism was in a later stage ofinvasion. The stage of invasion affects the extent to which speciesobservations provide a sample of the ecological domain of thespecies (Araujo and Pearson, 2005; Pearson et al., 2006). Since P.ramorum was introduced to California in the early 1990s and isstill spreading, the field data from 2003 to 2005 likely provide apoor representation of all the conditions suitable for the pathogen,and thus fitted models project only a small portion of its ecologicaldomain in geographical space.
Integration of dispersal constraints in the modeling process enhanced the performance of all models with the exception of GLM based on pseudo-absences, in which the force of invasion was statistically insignificant (p > 0.05). The improvement for all types of modeling approaches indicates that the importance of dispersal limitations is not unique to a specific algorithm examined inthis study. Dispersal constraints thus represent an important component in iSDMs accounting for limitations that prevent invasivespecies from colonizing places environmentally suitable but isolated or remote from already invaded locations (Allouche et al.,2008). The force of invasion term has been shown to not onlyimprove the accuracy of spatially explicit iSDMs but also illuminate the dispersal characteristics of the organism (Meentemeyer etal., 2008). For P. ramorum, the estimated dispersal kernel (a = 58)indicated a moderate dispersal limitation. Such finding is consistent with studies that described the transfer of P. ramorum sporesvia rain splash and wind as highly localized (up to 10 m fromthe forest edge) (Davidson et al., 2005), although long-distancedispersal events during storms or facilitated by humans or vertebrates are possible (Rizzo et al., 2005; Cushman and Meentemeyer,2008). However, the optimization of a dispersal kernel for a specific organism requires true-presence and true-absence locations.Here, we demonstrate that when true-absence data are unavailableor ignored, parameterization of this force of invasion is prevented.The use of non-parameterized, distance-based functions, such as
inverse squared cumulative distance, represents a possible alternative when true-absence data are lacking. This term does not account explicitly for species-specific dispersal characteristics but provides a mean of accounting for spatially autocorrelated factors that are not included as predictors in the models (Allouche et al., 2008). If
3 logica
te d cf r pn pe d e I c d o
c p tg a u E a m a p a tt g n w b r ab w
t r u ad H t o St p c I m as l Md 2d Lf2rp
256 T. Václavík, R.K. Meentemeyer / Eco
he purpose of this research was to assess the performance of differnt modeling algorithms, the use of the same (non-parameterized)ispersal constraint for all models would provide more meaningfulomparison. Since the purpose of our study was to compare diferent modeling strategies (with and without true-absence data),ather than modeling algorithms, we implemented prevailing bestractice conditions and thus included the optimized dispersal kerel when data allowed it; otherwise the predictive capability of theresence–absence strategy would be artificially decreased. Howver, if potential bias in final predictions is to be avoided, it is highlyesirable to use data completely independent from calibration andvaluation datasets to calculate both types of dispersal constraints.n addition, it is important to note that both types of dispersalonstraints used in the study describe force of invasion based onistance metrics but do not explicitly integrate the effect of barriersr connectivity of landscape features on species dispersal.
Based on the accuracy statistics for pseudo-absence modelsomparable to those documented for ENFA, random selection ofseudo-absence data may be a valid approach for iSDMs whenrue-absence data are unavailable. Although previous studies sugested that more reliable pseudo-absence data can be derived fromreas with unsuitable environmental conditions identified with these of profile (presence-only) techniques (Zaniewski et al., 2002;ngler et al., 2004; Lutolf et al., 2006), this approach may only beppropriate under equilibrium conditions or when the goal is toodel the potential distribution of the focal organism (Svenning
nd Skov, 2004; Hirzel and Le Lay, 2008). Random selection ofseudo-absence data from geographical spaces that are both nearnd distant to the ecological domain of the organism producehe most constrained prediction that is closer to the actual disribution (Thuiller et al., 2004; Chefaoui and Lobo, 2008). If theoal is to achieve predictions closer to the potential distribution,ot only should pseudo-absence data be selected from locationsith unsuitable conditions, but also dispersal constraints should
e omitted, or profile techniques used, in order to avoid inevitableeduction of the predicted range (Svenning and Skov, 2004; Hirzelnd Le Lay, 2008; Lobo et al., 2008). However, the potential distriution is a hypothetical concept and cannot be rigorously assessedith the use of observational presence/absence data.
Although critical issues about AUC have been recently broughto attention in the species modeling context, the ROC functionemains a highly reliable technique for SDMs’ assessment, if it issed to compare models for the same species at the same extent,nd the measures of commission and omission errors and total preicted area are considered (Lobo et al., 2008; Peterson et al., 2008).owever, the weakness of single-number accuracy measures is
hat they do not provide information on the spatial arrangementf correctly and incorrectly predicted occurrences (Pontius andchneider, 2001; Lobo et al., 2008). Verification of predicted patern in final maps can render additional information about modelserformances. In this study, all maps showed pathogen’s invasiononsistently concentrated along the western coast of California.n general, predictions of models with dispersal constraints were
ore confined to the San Francisco Bay Area, Santa Cruz Countynd in Humboldt County. Models developed without dispersal contraints exhibited more dispersed ranges. ENFA and GLM predictedarge areas of invasions along the northern coast of California in
endocino and Humboldt Counties, where the invasion of suden oak death has been documented (COMTF; Kelly and Tuxen,003). The GLM and CT models based on pseudo-absences preicted invasions along the southern coast in Santa Barbara, Ventura,
os Angeles, Orange and San Diego Counties, more than 500 km rom the nearest documented invasion (COMTF; Kelly and Tuxen, 003). This finding suggests that notwithstanding the similar accuacies of presence-only and pseudo-absence methods, the latter roduced spatially less feasible predictions due to incorrect param
l Modelling 220 (2009) 3248–3258
eterization based on the spatial distribution of pseudo-absence data.
Although our analysis indicated that true-absences in combination with dispersal constraints enhance the performance of iSDMs, the acquisition of true-absence data may be desirable not only for model development. When models based on pseudo-absences were assessed with pseudo-absences, according to a common practice in SDM research (Zaniewski et al., 2002; Engler et al., 2004; Lutolf et al., 2006; Chefaoui and Lobo, 2008), they appeared to be significantly more accurate and stable than when true-absences were used for evaluation (difference in AUC = 0.16 for environment-only CT and 0.11 for GLM). If true-absences are missing, the accuracy measures can only indicate how well models discriminate data considered in the training process but reveals little about the real prediction capability. Therefore, we suggest that true-absence data are a critical ingredient not only for accurate calibration but also ecologically meaningful assessment of iSDMs that focus on predictions of actual distributions.
5. Conclusions
Despite the growing use of SDMs to predict current spatial patterns of biological invasions, the implications of ignoring absence data and dispersal limitations in iSDMs have been rarely taken into account. In this study, we assessed the effects of different types of occurrence data and incorporation of dispersal constraints on the accuracy of models predicting the actual distribution of the invasive pathogen P. ramorum in California. We provide empirical evidence that predictive models calibrated with true-absence data and augmented with dispersal information significantly improve their performance, and that true-absence data are also critically needed to meaningfully assess invasion predictions. Our results contribute to the broad ecological understanding and conceptualization of iSDMs and illustrate the procedures needed to increase the efficacy of spatial predictions of invasive organisms. If iSDMs should serve as effective tools for early detection and management of invasive species in conservation practice, their accuracy and correct interpretation is crucial to minimize the ecological impact and economic cost of biological invasions.
Acknowledgements
We thank J. Amaris, C. Boylen, K. Buja, M. Cooper, G. Garner, A. Gauthier, E. Gordon, R. Hunter, A. Jirka, M. Kennedy, S. King, M. Kozanitas, E. McCowan, L. Miller, S. Moyle, G. Neargarder, E. Sabo, H. Torpin, K. Ward, and K. Wells for assistance with field work; L. Bell, E. Lotz, and L. Fischer for logistical support in the field. We also thank C. Blomquist (CDFA) and J. Bienapfl (UC Davis) for pathogenidentification, B. Anacker, W. Mark, and D. Rizzo for their previouswork that made this study possible, and two anonymous reviewers as well as all members of the Center for Applied GIScience atUNC Charlotte for their helpful comments on the manuscript. Thisresearch was supported by grants from the National Science Foundation (EF-0622677) and USDA Forest Service (State and PrivateForestry–Pacific Southwest Region).
References
Allouche, O., Steinitz, O., Rotem, D., Rosenfeld, A., Kadmon, R., 2008. Incorporating distance constraints into species distribution models. J. Appl. Ecol. 45, 599–609.
Anacker, B.L., Rank, N.E., Huberli, D., Garbelotto, M., Gordon, S., Harnik, T., Whitkus, R., Meentemeyer, R., 2008. Susceptibility to Phytophthora ramorum in a key infectious host: landscape variation in host genotype, host phenotype, and environmental factors. New Phytol. 177, 756–766.
Araujo, M.B., Guisan, A., 2006. Five (or so) challenges for species distribution modelling. J. Biogeogr. 33, 1677–1688.
logica
A
A
A
A
B
C
C
C
D
D
D
D
D
E
E
E
E
E
F
F
F
F
F
G
G
G
G
G
H
H
H
H
T. Václavík, R.K. Meentemeyer / Eco
raujo, M.B., Pearson, R.G., 2005. Equilibrium of species’ distributions with climate.Ecography 28, 693–695.
raujo, M.B., Pearson, R.G., Thuiller, W., Erhard, M., 2005. Validation of species-climate impact models under climate change. Glob. Chang. Biol. 11, 1504–1513.
ustin, M., 2007. Species distribution models and ecological theory: a critical assessment and some possible new approaches. Ecol. Model. 200, 1–19.
ustin, M.P., 2002. Spatial prediction of species distribution: an interface betweenecological theory and statistical modeling. Ecol. Model. 157, 101–118.
erry, P.M., Dawson, T.P., Harrison, P.A., Pearson, R.G., 2002. Modelling potentialimpacts of climate change on the bioclimatic envelope of species in Britain andIreland. Glob. Ecol. Biogeogr. 11, 453–462.
hefaoui, R.M., Lobo, J.M., 2008. Assessing the effects of pseudo-absences on predictive distribution model performance. Ecol. Model. 210, 478–486.
hen, H., Chen, L.J., Albright, T.P., 2007. Predicting the potential distribution of invasive exotic species using GIS and information-theoretic approaches: a case ofragweed (Ambrosia artemisiifolia L.) distribution in China. Chin. Sci. Bull. 52,1223–1230.
ushman, J.H., Meentemeyer, R.K., 2008. Multi-scale patterns of human activity andthe incidence of an exotic forest pathogen. J. Ecol. 96, 766–776.
aly, C., Taylor, G.H., Gibson, W.P., Parzybok, T.W., Johnson, G.L., Pasteris, P., 2001.High-quality spatial climate data sets for the United States and beyond. Trans.ASAE 43, 1957–1962.
avidson, J.M., Wickland, A.C., Patterson, H.A., Falk, K.R., Rizzo, D.M., 2005. Transmission of Phytophthora ramorum in mixed-evergreen forest in California.Phytopathology 95, 587–596.
avis, E.C., 2004. Predicting potential distributions of invasive land snails via ecological niche modeling. Integr. Comp. Biol. 44, 687–1687.
e’ath, G., Fabricius, K.E., 2000. Classification and regression trees: a powerful yetsimple technique for ecological data analysis. Ecology 81, 3178–3192.
ubayah, R.C., 1994. Modeling a solar radiation topoclimatology for the Rio Granderiver basin. J. Veg. Sci. 5, 627–640.
astman, J.R., 2006. IDRISI Andes Guide to GIS and Image Processing. Clark Labs,Clark University, IDRISI Productions 1987–2006, Worcester, MA.
lith, J., Burgman, M.A., 2003. Habitat models for PVA. In: Brigham, C.A., Schwartz,M.W. (Eds.), Population Viability in Plants. Conservation, Management and Modeling of Rare Plants. Springer-Verlag, New York, pp. 203–235.
lith, J., Graham, C.H., Anderson, R.P., Dudik, M., Ferrier, S., Guisan, A., Hijmans, R.J.,Huettmann, F., Leathwick, J.R., Lehmann, A., Li, J., Lucia, G., Lohmann, Loiselle,B.A., Manion, G., Moritz, C., Nakamura, M., Nakazawa, Y., Jacob, McC., Over-ton, Peterson, A.T., Phillips, S.J., Richardson, K., Scachetti-Pereira, R., Robert, E.,Schapire, Soberon, J., Williams, S., Wisz, M.S., Zimmermann, N.E., 2006. Novelmethods improve prediction of species’ distributions from occurrence data.Ecography 29, 129–151.
ngler, R., Guisan, A., Rechsteiner, L., 2004. An improved approach for predictingthe distribution of rare and endangered species from occurrence and pseudo-absence data. J. Appl. Ecol. 41, 263–274.
ngler, R., Randin, C.F., Vittoz, P., Czaka, T., Beniston, M., Zimmermann, N.E., Guisan,A., 2009. Predicting future distributions of mountain plants under climatechange: does dispersal capacity matter? Ecography 32, 34–45.
ielding, A.H., Bell, J.F., 1997. A review of methods for the assessment of predictionerrors in conservation presence/absence models. Environ. Conserv. 24, 38–49.
itt, B.D.L., McCartney, H.A., Walklate, P.J., 1989. The role of rain in dispersal ofpathogen inoculum. Ann. Rev. Phytopathol. 27, 241–270.
onseca, R.L., Guimaraes, P.R., Morbiolo, S.R., Scachetti-Pereira, R., Peterson, A.T.,2006. Predicting invasive potential of smooth crotalaria (Crotalaria pallida) in Brazilian national parks based on African records. Weed Sci. 54,458–463.
ranklin, J., 1995. Predictive vegetation mapping: geographic modeling of biospatial patterns in relation to environmental gradients. Prog. Phys. Geogr. 19,474–499.
reeman, E.A., Moisen, G.G., 2008. A comparison of the performance of thresholdcriteria for binary classification in terms of predicted prevalence and kappa.Ecol. Model. 217, 48–58.
iovanelli, J.G.R., Haddad, C.F.B., Alexandrino, J., 2008. Predicting the potential distribution of the alien invasive American bullfrog (Lithobates catesbeianus) in Brazil.Biol. Invasions 10, 585–590.
rinnell, J., 1917. The niche-relationships of the California Thrasher. Auk 34,427–433.
uisan, A., Thuiller, W., 2005. Predicting species distribution: offering more thansimple habitat models? Ecol. Lett. 8, 993–1009.
uisan, A., Zimmermann, N.E., 2000. Predictive habitat distribution models in ecology. Ecol. Model. 135, 147–186.
uo, Q., Kelly, M., Graham, C.H., 2005. Support vector machines for predicting distribution of Sudden Oak Death in California. Ecol. Model. 182, 75–90.
astings, A., Cuddington, K., Davies, K.F., Dugaw, C.J., Elmendorf, S., Freestone, A.,Harrison, S., Holland, M., Lambrinos, J., Malvadkar, U., Melbourne, B.A., Moore, K.,Taylor, C., Thomson, D., 2005. The spatial spread of invasions: new developmentsin theory and evidence. Ecol. Lett. 8, 91–101.
avel, J.E., Shurin, J.B., Jones, J.R., 2002. Estimating dispersal from patterns of spread:spatial and local control of lake invasions. Ecology 83, 3306–3318.
ayden, K.J., Rizzo, D., Tse, J., Garbelotto, M., 2004. Detection and quantification of Phytophthora ramorum from California forests using a real-time polymerase chain reaction assay. Phytopathology 94, 1075–1083.
iggins, S.I., Richardson, D.M., Cowling, R.M., Trinder-Smith, T.H., 1999. Predicting the landscape-scale distribution of alien plants and their threat to plant diversity. Conserv. Biol. 30, 301–313.
3257l Modelling 220 (2009) 3248–3258
Hirzel, A.H., Hausser, J., Chessel, D., Perrin, N., 2002. Ecological-niche factor analysis: how to compute habitat-suitability maps without absence data? Ecology 83, 2027–2036.
Hirzel, A.H., Hausser, J., Perrin, N., 2007. Biomapper 4. 0. Laboratory for Conservation Biology, Department of Ecology and Evolution, University of Lausanne, Switzerland.
Hirzel, A.H., Le Lay, G., Helfer, V., Randin, C., Guisan, A., 2006. Evaluating the ability of habitat suitability models to predict species presence. Ecol. Model. 199, 142–152.
Hirzel, A.H., Le Lay, G., 2008. Habitat suitability modelling and niche theory. J. Appl. Ecol. 45, 1372–1381.
Ivors, K.L., Hayden, K.J., Bonants, P.J.M., Rizzo, D.M., Garbelotto, M., 2004. AFLP and phylogenetic analyses of North American and European populations of Phytophthora ramorum. Mycol. Res. 108, 378–392.
Jeschke, J.M., Strayer, D.L., 2008. Usefulness of bioclimatic models for studying climate change and invasive species. Ann. N.Y. Acad. Sci. 1134, 1–24.
Jimenez-Valverde, A., Lobo, J.M., 2007. Threshold criteria for conversion of probability of species presence to either-or presence–absence. Acta Oecol. 31, 361–369.
Jimenez-Valverde, A., Lobo, J.M., Hortal, J., 2008. Not as good as they seem: the importance of concepts in species distribution modelling. Divers. Distrib. 14, 885–890.
Johnson, J.B., Omland, K.S., 2004. Model selection in ecology and evolution. Trends Ecol. Evol. 19, 101–108.
Kelly, M., Meentemeyer, R.K., 2002. Landscape dynamics of the spread of sudden oak death. Photogramm. Eng. Remote Sens. 68, 1001–1009.
Kelly, N.M., Tuxen, K., 2003. WebGIS for monitoring “sudden oak death” in coastal California. Comput. Environ. Urban. Syst. 27, 549–1549.
Lippitt, C.D., Rogan, J., Toledano, J., Sangermano, F., Eastman, J.R., Mastro, V., Sawyer, A., 2008. Incorporating anthropogenic variables into a species distribution model to map gypsy moth risk. Ecol. Model. 210, 339–350.
Lobo, J.M., Jimenez-Valverde, A., Real, R., 2008. AUC: a misleading measure of the performance of predictive distribution models. Glob. Ecol. Biogeogr. 17, 145–151.
Lopez-Darias, M., Lobo, J.M., Gouat, P., 2008. Predicting potential distributions of invasive species: the exotic Barbary ground squirrel in the Canarian archipelago and the west Mediterranean region. Biol. Invasions 10, 1027–1040.
Lutolf, M., Kienast, F., Guisan, A., 2006. The ghost of past species occurrence: improving species distribution models for presence-only data. J. Appl. Ecol. 43, 802–815.
Maggini, R., Lehmann, A., Zimmermann, N.E., Guisan, A., 2006. Improving generalized regression analysis for the spatial prediction of forest communities. J. Biogeogr. 33, 1729–1749.
Maloney, P.E., Lynch, S.C., Kane, S.F., Jensen, C.E., Rizzo, D.M., 2005. Establishment of an emerging generalist pathogen in redwood forest communities. J. Ecol. 93,899–905.
Manel, S., Williams, H.C., Ormerod, S.J., 2001. Evaluating presence–absence modelsin ecology: the need to account for prevalence. J. Appl. Ecol. 38, 921–931.
McArthur, R.H., 1957. On the relative abundance of bird species. Proc. Natl. Acad. Sci.U.S.A. 43, 293–295.
McCartney, H.A., Fitt, B.D.L., 1985. Construction of dispersal models. In: Ingram, D.,Williams, P., Gilligan, C.A. (Eds.), Advances in Plant Pathology, Vol. 3, Mathematical Modeling of Crop Disease. Academic Press, London, pp. 107–143.
Meentemeyer, R.K., Anacker, B., Mark, W., Rizzo, D.M., 2008. Early detection ofemerging forest disease using dispersal estimation and ecological niche modeling. Ecol. Appl., 377–390.
Meentemeyer, R.K., Rizzo, D., Mark, W., Lotz, E., 2004. Mapping the risk of establishment and spread of Sudden Oak Death in California. For. Ecol. Manage. 200,195–214.
Miller, J., 2005. Incorporating spatial dependence in predictive vegetation models:residual interpolation methods. Prof. Geogr. 57, 169–184.
Miller, J., Franklin, J., 2002. Modeling the distribution of four vegetation alliancesusing generalized linear models and classification trees with spatial dependence.Ecol. Model. 157, 227–247.
Moore, I.D., Grayson, R.B., Ladson, A.R., 1991. Digital terrain modelling. A reviewof hydrological, geomorphological, and biological applications. Hydrol. Proc. 5,3–30.
Pearson, R.G., 2006. Climate change and the migration capacity of species. TrendsEcol. Evol. 21, 111–113.
Pearson, R.G., Thuiller, W., Araujo, M.B., Martinez-Meyer, E., Brotons, L., McClean, C.,Miles, L., Segurado, P., Dawson, T.P., Lees, D.C., 2006. Model-based uncertaintyin species range prediction. J. Biogeogr. 33, 1704–1711.
Peterson, A.T., 2003. Predicting the geography of species’ invasions via ecologicalniche modeling. Q. Rev. Biol. 78, 419–433.
Peterson, A.T., Papes, M., Kluza, D.A., 2003. Predicting the potential invasive distributions of four alien plant species in North America. Weed Sci. 51, 863–868.
Peterson, A.T., Papes, M., Soberon, J., 2008. Rethinking receiver operating characteristic analysis applications in ecological niche modeling. Ecol. Model. 213,63–72.
Peterson, A.T., Vieglais, D.A., 2001. Predicting species invasions using ecological niche modeling: new approaches from bioinformatics attack a pressing problem. Bioscience 51, 363–371.
Phillips, S.J., 2008. Transferability, sample selection bias and background data in presence-only modelling: a response to Peterson et al. (2007). Ecography 31, 272–278.
ontius, R.G., Schneider, L.C., 2001. Land-cover change model validation by an ROCmethod for the Ipswich watershed, Massachusetts, USA. Agric. Ecosyst. Environ.85, 239–248.
ulliam, H.R., 2000. On the relationship between niche and distribution. Ecol. Lett.3, 349–361.
izzo, D.M., Garbelotto, M., 2003. Sudden oak death: endangering California andOregon forest ecosystems. Front. Ecol. Environ. 1, 197–204.
izzo, D.M., Garbelotto, M., Hansen, E.A., 2005. Phytophthora ramorum: integrativeresearch and management of an emerging pathogen in California and Oregonforests. Annu. Rev. Phytopathol. 43, 309–335.
odder, D., Sole, M., Bohme, W., 2008. Predicting the potential distributions of twoalien invasive Housegeckos (Gekkonidae: Hemidactylus frenatus, Hemidactylusmabouia). Northwest. J. Zool. 4, 236–246.
egurado, P., Araujo, M.B., 2004. An evaluation of methods for modelling species distributions. J. Biogeogr. 31, 1555–1568.
oberon, J., 2007. Grinnellian and Eltonian niches and geographic distributions of species. Ecol. Lett. 10, 1115–1123.
oberon, J., Peterson, A.T., 2005. Interpretation of models of fundamental ecological niches and species’ distributional areas. Biodivers. Inform. 2, 1–10.
l Modelling 220 (2009) 3248–3258
Strubbe, D., Matthysen, E., 2009. Predicting the potential distribution of invasive ring-necked parakeets Psittacula krameri in northern Belgium using an ecological niche modelling approach. Biol. Invasions 11, 497–513.
Sutherst, R.W., Bourne, A.S., 2009. Modelling non-equilibrium distributions of invasive species: a tale of two modelling paradigms. Biol. Invasions 11, 1231– 1237.
Svenning, J.C., Skov, F., 2004. Limited filling of the potential range in European tree species. Ecol. Lett. 7, 565–573.
Thomas, C.D., Cameron, A., Green, R.E., Bakkenes, M., Beaumont, L.J., Collingham, Y.C., 2004. Extinction risk from climate change. Nature 427, 145–147.
Thuiller, W., Brotons, L., Araujo, M.B., Lavorel, S., 2004. Effects of restricting environmental range of data to project current and future species distributions. Ecography 27, 165–172.
Tsoar, A., Allouche, O., Steinitz, O., Rotem, D., Kadmon, R., 2007. A comparative evaluation of presence-only methods for modelling species distribution. Divers.
Distrib. 13, 397–405.
Woods, A., Coates, K.D., Hamann, A., 2005. Is an unprecedented dothistroma needle blight epidemic related to climate change? Bioscience 55, 761–769.
Zaniewski, A.E., Lehmann, A., Overton, J.M.C., 2002. Predicting species spatial distributions using presence-only data: a case study of native New Zealand ferns. Ecol. Model. 157, 261–280.


![A-level · Basidiomycota Ascomycota Zygomycota Oomycota Deuteromycota Myxomycota Name the taxon represented by Zygomycota. [1 mark] Rhizopus is a member of the Zygomycota. It has](https://static.documents.pub/doc/80x56/5e8fc02208d273473c58080f/a-level-basidiomycota-ascomycota-zygomycota-oomycota-deuteromycota-myxomycota-name.jpg)


