15
SCM Consulting Solutions Inventory Controlling Cockpit 2011.1 Christian Hald, SAP Consulting Released for customer

SCM Consulting Solutions Inventory Controlling Cockpit 2011.1 Christian Hald, SAP Consulting
Released
for
customer

© 2011 SAP AG. All rights reserved. 2 Customer
Agenda
1. The Challenge: Transparent Stocks
2. The Solution: SCM Consulting Solution Inventory Cockpit
3. Details of Inventory Cockpit

© 2011 SAP AG. All rights reserved. 3 Customer
The Challenge: Transparent Stocks
Present stock-specific key figure situation for:
Slow-moving items
Dead stock
Range of coverage
Consumption fluctuation
…
In addition to the snapshot, a transparent overview of the history over given periods
is required.
Bundle all stock information in a central evaluation transaction.
Any degree of focus and detail, from individual materials to aggregated views for
entire plants
Clear overview of stock situation with suitable graphics and tables
Summary and separate overview of particularly critical materials
Determination of stock history on the basis of customer-specific consumption update
procedures
Full integration of ABC-XYZ classification in stock information

© 2011 SAP AG. All rights reserved. 4 Customer
Agenda
1. The Challenge: Transparent Stocks
2. The Solution: SCM Consulting Solution Inventory Cockpit
3. Details of Inventory Cockpit

© 2011 SAP AG. All rights reserved. 5 Customer
The Solution: SCM Consulting Solution Inventory Cockpit
Determination and presentation of stock-specific key figures in the course of user-definable
comparison periods:
Slow-moving items
Dead stock
Range of coverage
Consumption fluctuation (among others)
Determination of key figures both material-specific and grouped according to material groups,
MRP controller, procurement type, material status, plant, and so on
Consumption relevance of movement types to be evaluated can be freely adjusted for the
evaluation, without affecting the SAP standard configuration
Evaluation on the basis of the standard consumption update, material documents, and info
structures
Transparent presentation of the results in flexible graphical evaluations and as tables with the
option to download
Direct access to critical materials through ranking lists for the individual key figures, presented
in tables and graphics
Full integration of ABC-XYZ classification in stock information
Transparent overview of stock history in user-defined periods and levels of detail

© 2011 SAP AG. All rights reserved. 6 Customer
Agenda
1. The Challenge: Transparent Stocks
2. The Solution: SCM Consulting Solution Inventory Cockpit
3. Details of Inventory Cockpit

© 2011 SAP AG. All rights reserved. 7 Customer
Details of Inventory Cockpit
The Inventory Cockpit displays aggregated data based on consumption values from the past.
In addition to the standard consumption update, both info structures and material documents can be used as data sources.
Any movement types can be considered consumption-relevant without affecting the standard configuration.
The calculated
Key figures
Ranking lists
Period comparisons
Aggregations and
Analysis graphics
are presented in the Inventory Cockpit as graphics and tables
Historical data from
consumption update,
material documents,
info structures
Historical data from
consumption update,
material documents,
info structures
Analysis of consumption,
calculation of key figures,
presentation in the
Inventory Cockpit

© 2011 SAP AG. All rights reserved. 8 Customer
© SAP
2009,
Invento
ry
Cockpit
/ Marc
Hoppe
/ Page
8
Performing Analyses – Material Document Aggregation
Material document aggregation groups material documents into period consumptions
that can be evaluated.
Level of analysis: The analysis can be performed at the level of material, material - plant, or
material - plant - storage.
The analysis can cover a range of period types.
In the area of analysis, the scope of the evaluation can be further restricted by specifying the
relevant materials, plants, and storage locations.

© 2011 SAP AG. All rights reserved. 9 Customer
© SAP
2009,
Invento
ry
Cockpit
/ Marc
Hoppe
/ Page
9
Performing Analyses – Determination of Key Figures in
the MRP Monitor
The MRP Monitor calculates the key figure basis that the Inventory Cockpit depends
on
The period and scope of the analysis are defined.
In the area of analysis, the selection is restricted by material, plant, material type, and so on.

© 2011 SAP AG. All rights reserved. 10 Customer
© SAP
2009,
Invento
ry
Cockpit
/ Marc
Hoppe
/ Page
10
Inventory Cockpit Settings
Settings before you launch the Inventory Cockpit
On the Filter tab you restrict the scope of the analysis as required on the basis of material,
plant, and so on:
Set up the time frame of the
analysis:
Other settings regarding target
stock, ranking list, graphical
display, graphic Customizing, and
exponential smoothing are
possible.
© 2011 SAP AG. All rights reserved. 11 Customer
© SAP
2009,
Invento
ry
Cockpit
/ Marc
Hoppe
/ Page
11
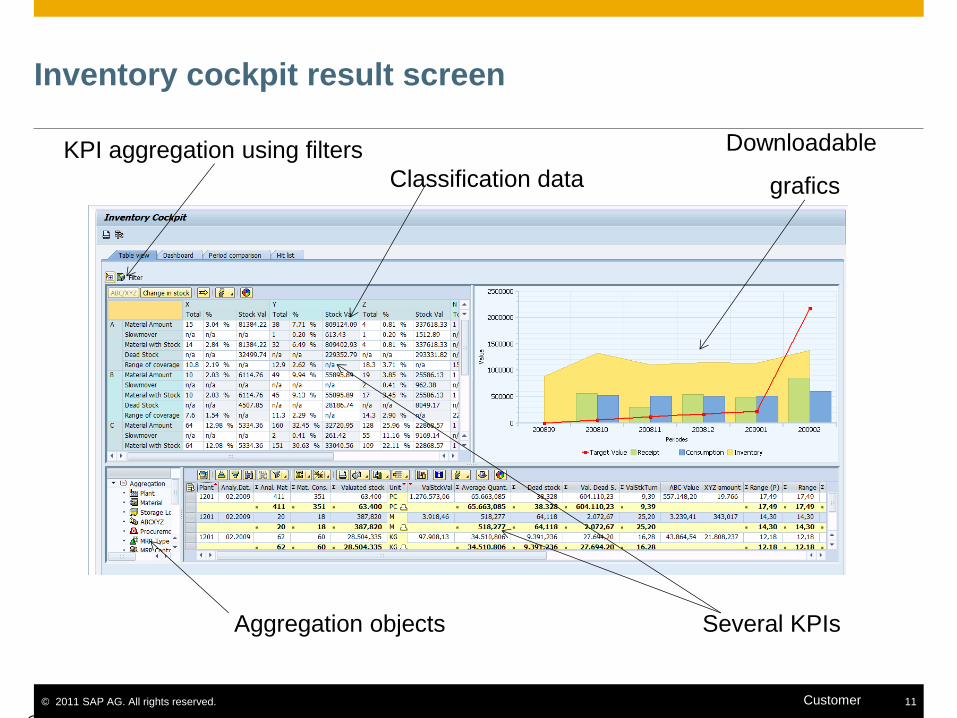
Inventory cockpit result screen
Classification data
Aggregation objects
KPI aggregation using filters
Several KPIs
Downloadable
grafics
© 2011 SAP AG. All rights reserved. 12 Customer
© SAP
2009,
Invento
ry
Cockpit
/ Marc
Hoppe
/ Page
12
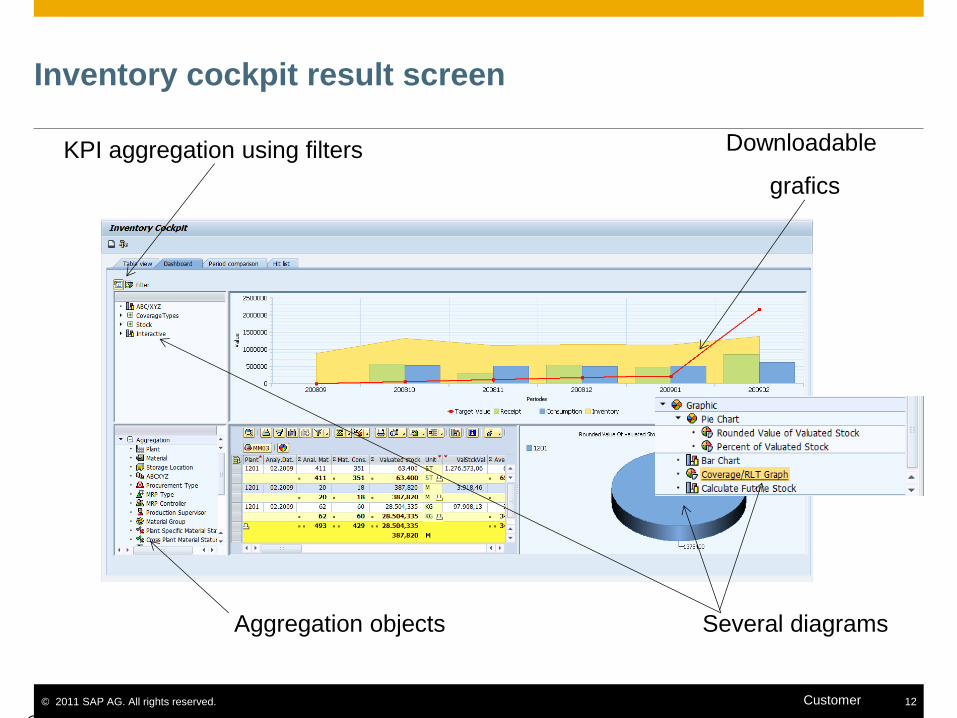
Inventory cockpit result screen
Aggregation objects
KPI aggregation using filters
Several diagrams
Downloadable
grafics

© 2011 SAP AG. All rights reserved. 13 Customer
© SAP
2009,
Invento
ry
Cockpit
/ Marc
Hoppe
/ Page
13
Inventory cockpit result screen
KPI aggregation using filters
Stock and coverage classes
Coverage vs. lead times

© 2011 SAP AG. All rights reserved. 14 Customer
© SAP
2009,
Invento
ry
Cockpit
/ Marc
Hoppe
/ Page
14
Inventory cockpit result screen
KPI aggregation using filters Periodic comparison

© 2011 SAP AG. All rights reserved. 15 Customer
© SAP
2009,
Invento
ry
Cockpit
/ Marc
Hoppe
/ Page
15
Inventory cockpit result screen
Hitlists for important KPIs
Filter


