This project was joint funded under the Carbon Vision Buildings
program by:
Available from: www.bath.ac.uk/mech‐eng/sert/embodied/
Peer Review Source: Hammond, G.P. and C.I. Jones, 2008, 'Embodied energy and carbon in construction materials', Proc. Instn Civil. Engrs: Energy, in press.
Whilst efforts have been made to ensure the accuracy of the information contained in the Inventory of Carbon & Energy (ICE), the content is subject to change and the University of Bath cannot guarantee its accuracy or currency. The University reserves the right to make changes to the information in ICE without notice. The information is consequently provided "as is" without any representation or warranty as to accuracy, currency, quality or fitness for purpose of any kind. You should independently verify any information contained in ICE before relying on it. The University of Bath does not make any representation nor give any warranty as to the ownership of the copyright of any material forming part of ICE and does not accept any liability for any direct, indirect, incidental or consequential losses arising from the infringement of any third party rights in relation to any material in ICE .
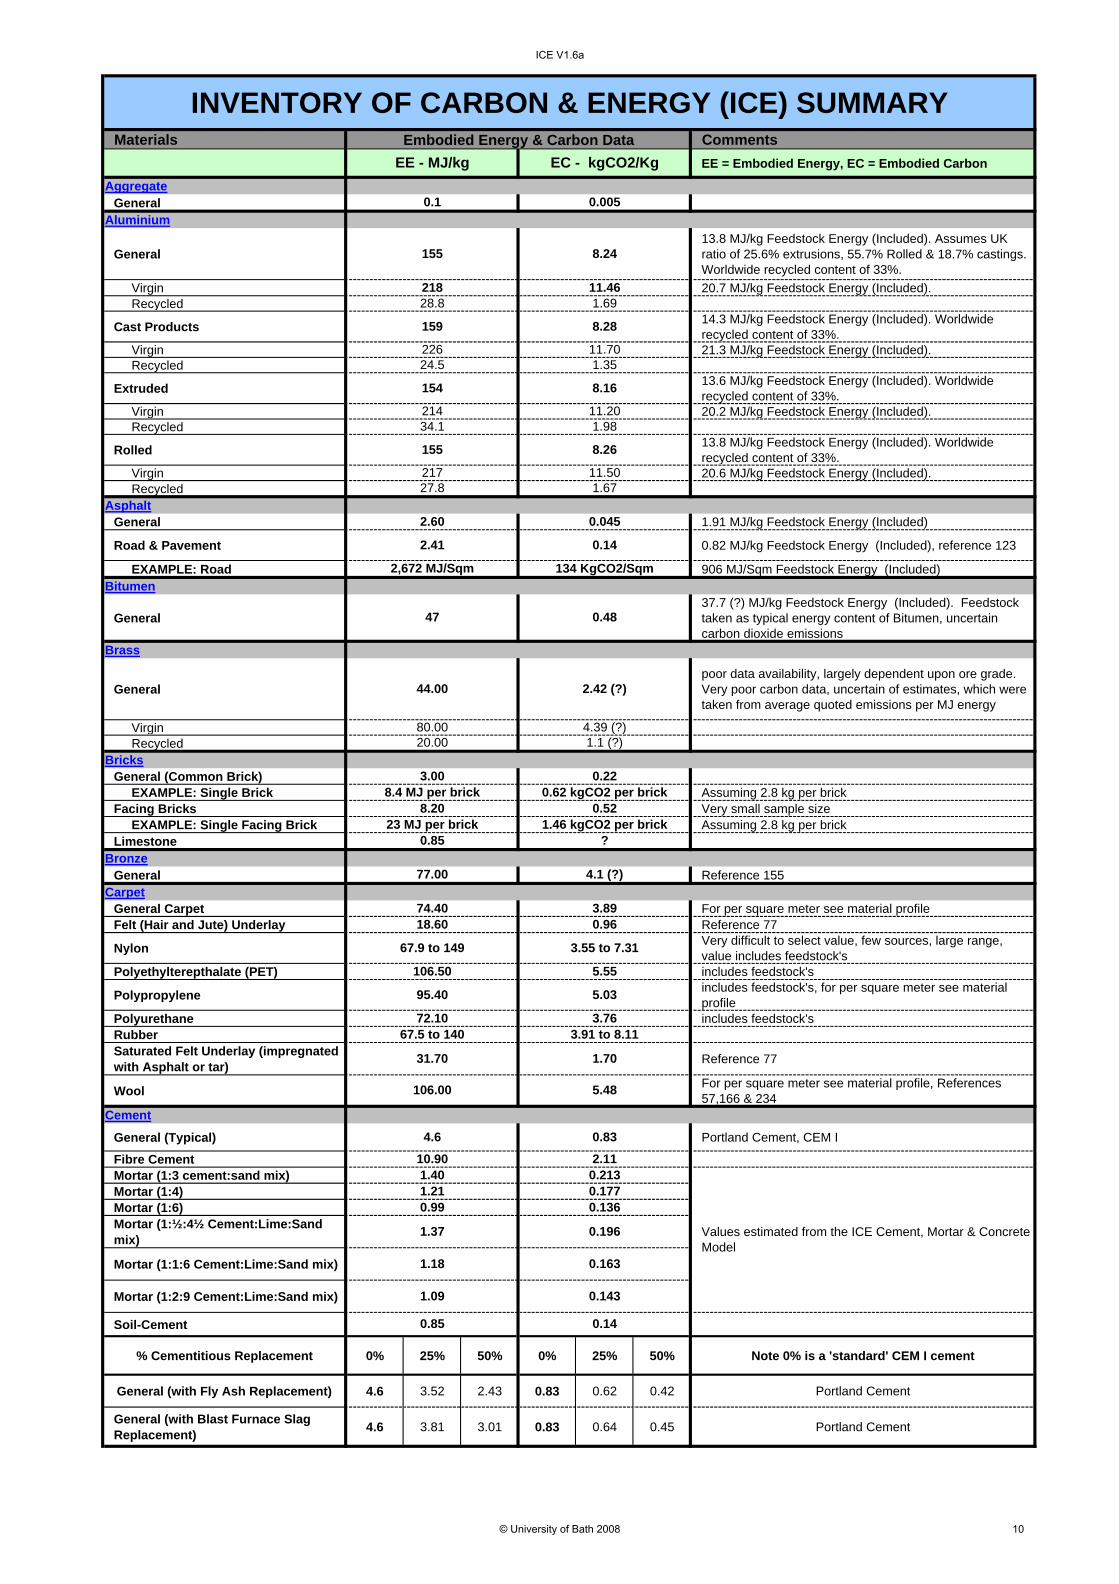
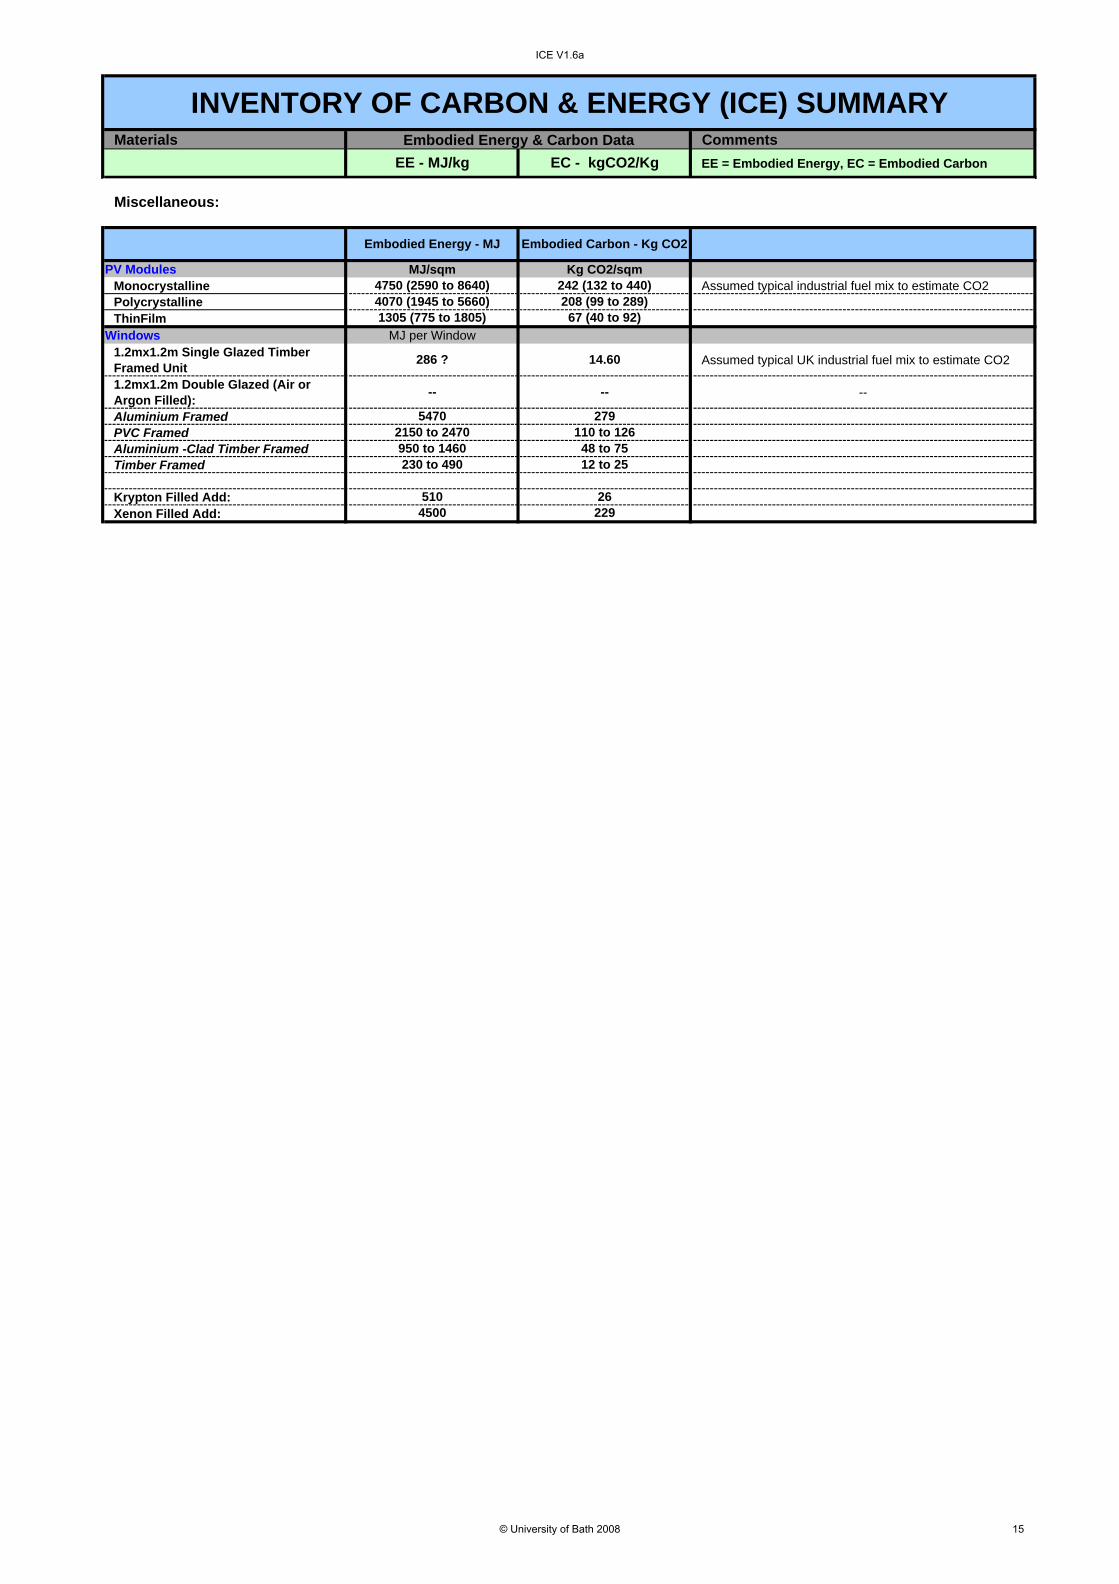
General13.8 MJ/kg Feedstock Energy (Included). Assumes UK ratio of 25.6% extrusions, 55.7% Rolled & 18.7% castings. Worldwide recycled content of 33%.
Virgin 20.7 MJ/kg Feedstock Energy (Included). Recycled
Cast Products 14.3 MJ/kg Feedstock Energy (Included). Worldwide recycled content of 33%.
Virgin 21.3 MJ/kg Feedstock Energy (Included). Recycled
Extruded 13.6 MJ/kg Feedstock Energy (Included). Worldwide recycled content of 33%.
Virgin 20.2 MJ/kg Feedstock Energy (Included). Recycled
Rolled 13.8 MJ/kg Feedstock Energy (Included). Worldwide recycled content of 33%.
Virgin 20.6 MJ/kg Feedstock Energy (Included). Recycled
AsphaltGeneral 1.91 MJ/kg Feedstock Energy (Included)
Road & Pavement 0.82 MJ/kg Feedstock Energy (Included), reference 123
EXAMPLE: Road 906 MJ/Sqm Feedstock Energy (Included)Bitumen
General37.7 (?) MJ/kg Feedstock Energy (Included). Feedstock taken as typical energy content of Bitumen, uncertain carbon dioxide emissions
Brass
Generalpoor data availability, largely dependent upon ore grade. Very poor carbon data, uncertain of estimates, which were taken from average quoted emissions per MJ energy
VirginRecycled
BricksGeneral (Common Brick)
EXAMPLE: Single Brick Assuming 2.8 kg per brickFacing Bricks Very small sample size
EXAMPLE: Single Facing Brick Assuming 2.8 kg per brickLimestone
BronzeGeneral Reference 155
CarpetGeneral Carpet For per square meter see material profileFelt (Hair and Jute) Underlay Reference 77
Nylon Very difficult to select value, few sources, large range, value includes feedstock's
Polyethylterepthalate (PET) includes feedstock's
Polypropylene includes feedstock's, for per square meter see material profile
Polyurethane includes feedstock'sRubberSaturated Felt Underlay (impregnated with Asphalt or tar) Reference 77
Wool For per square meter see material profile, References 57,166 & 234
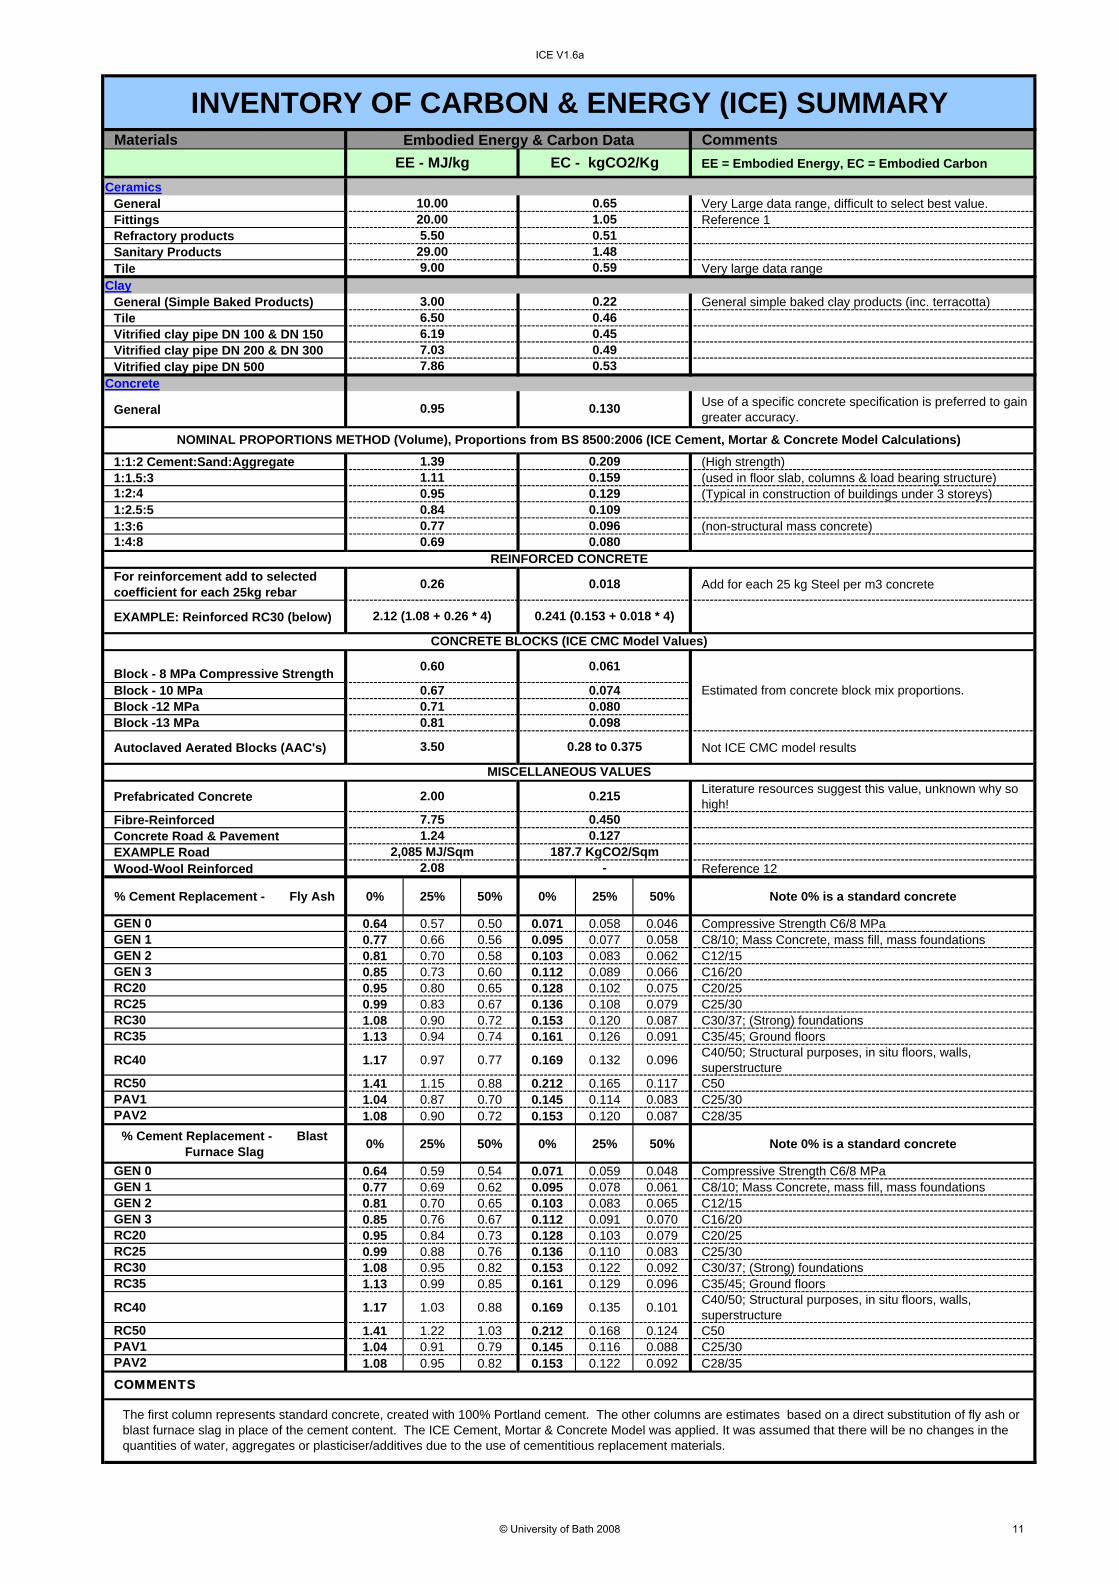
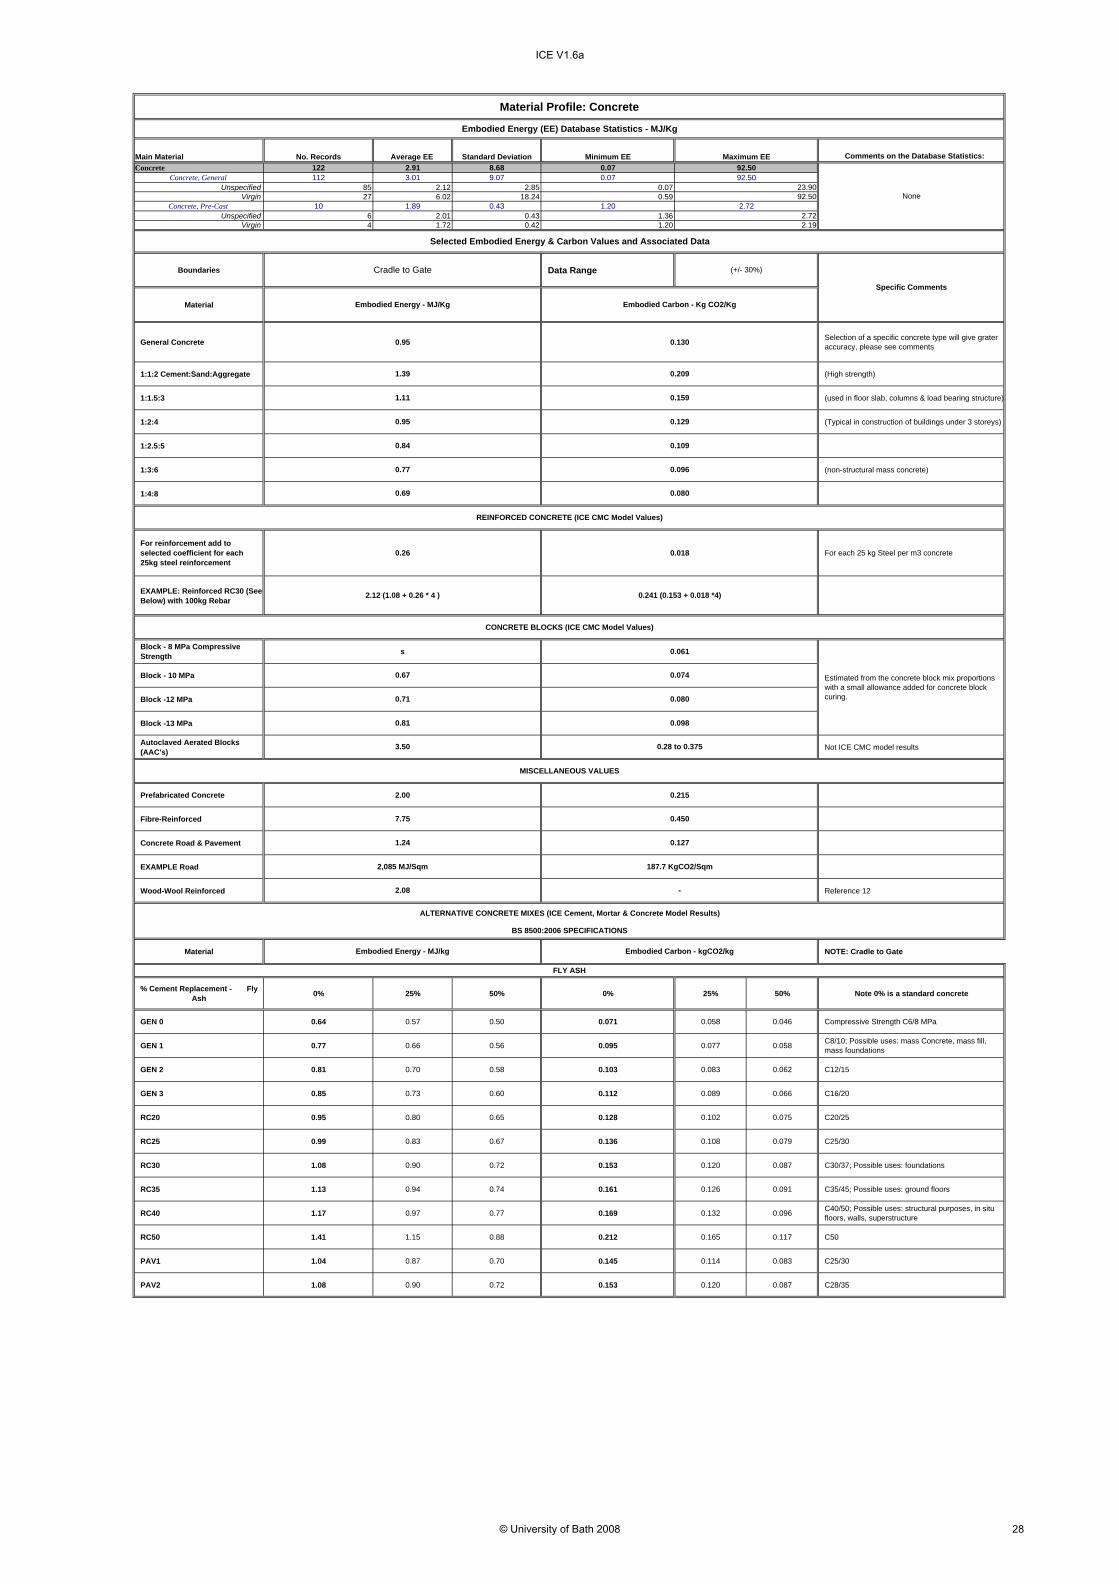
General Use of a specific concrete specification is preferred to gain greater accuracy.
1:1:2 Cement:Sand:Aggregate (High strength)1:1.5:3 (used in floor slab, columns & load bearing structure)1:2:4 (Typical in construction of buildings under 3 storeys)1:2.5:51:3:6 (non-structural mass concrete)1:4:8
For reinforcement add to selected coefficient for each 25kg rebar Add for each 25 kg Steel per m3 concrete
NOMINAL PROPORTIONS METHOD (Volume), Proportions from BS 8500:2006 (ICE Cement, Mortar & Concrete Model Calculations)
0.018
1.24
0.28 to 0.375
7.75
2.12 (1.08 + 0.26 * 4) 0.241 (0.153 + 0.018 * 4)
3.00 0.226.50 0.466.19 0.457.03
20.00 1.05
29.00 1.489.00 0.59
5.50 0.51
10.00 0.65
0.129
0.77 0.0960.69 0.080
0.2091.39
COMMENTS
The first column represents standard concrete, created with 100% Portland cement. The other columns are estimates based on a direct substitution of fly ash or blast furnace slag in place of the cement content. The ICE Cement, Mortar & Concrete Model was applied. It was assumed that there will be no changes in the quantities of water, aggregates or plasticiser/additives due to the use of cementitious replacement materials.
GeneralConflicting data, possibly due to large variations in ore grade. Assumes recycled materials of 46%. See material profiles for further details
VirginLarge data range, very difficult to select possibly due to large variations in ore grade and therefore embodied energy and carbon.
Recycled from high grade scrap Recycled from low grade scrap
Glass
General
Poor data availability on recycled glass. Virgin Glass releases 0.185 Kg CO2 during production processes (Additional to energy emissions) this has been factored in (Fact taken from British Glass). Recycling rate from British glass report towards sustainable development 2004, difficult to select embodied carbon
Fibreglass (Glasswool)Toughened Only three data sources
Insulation
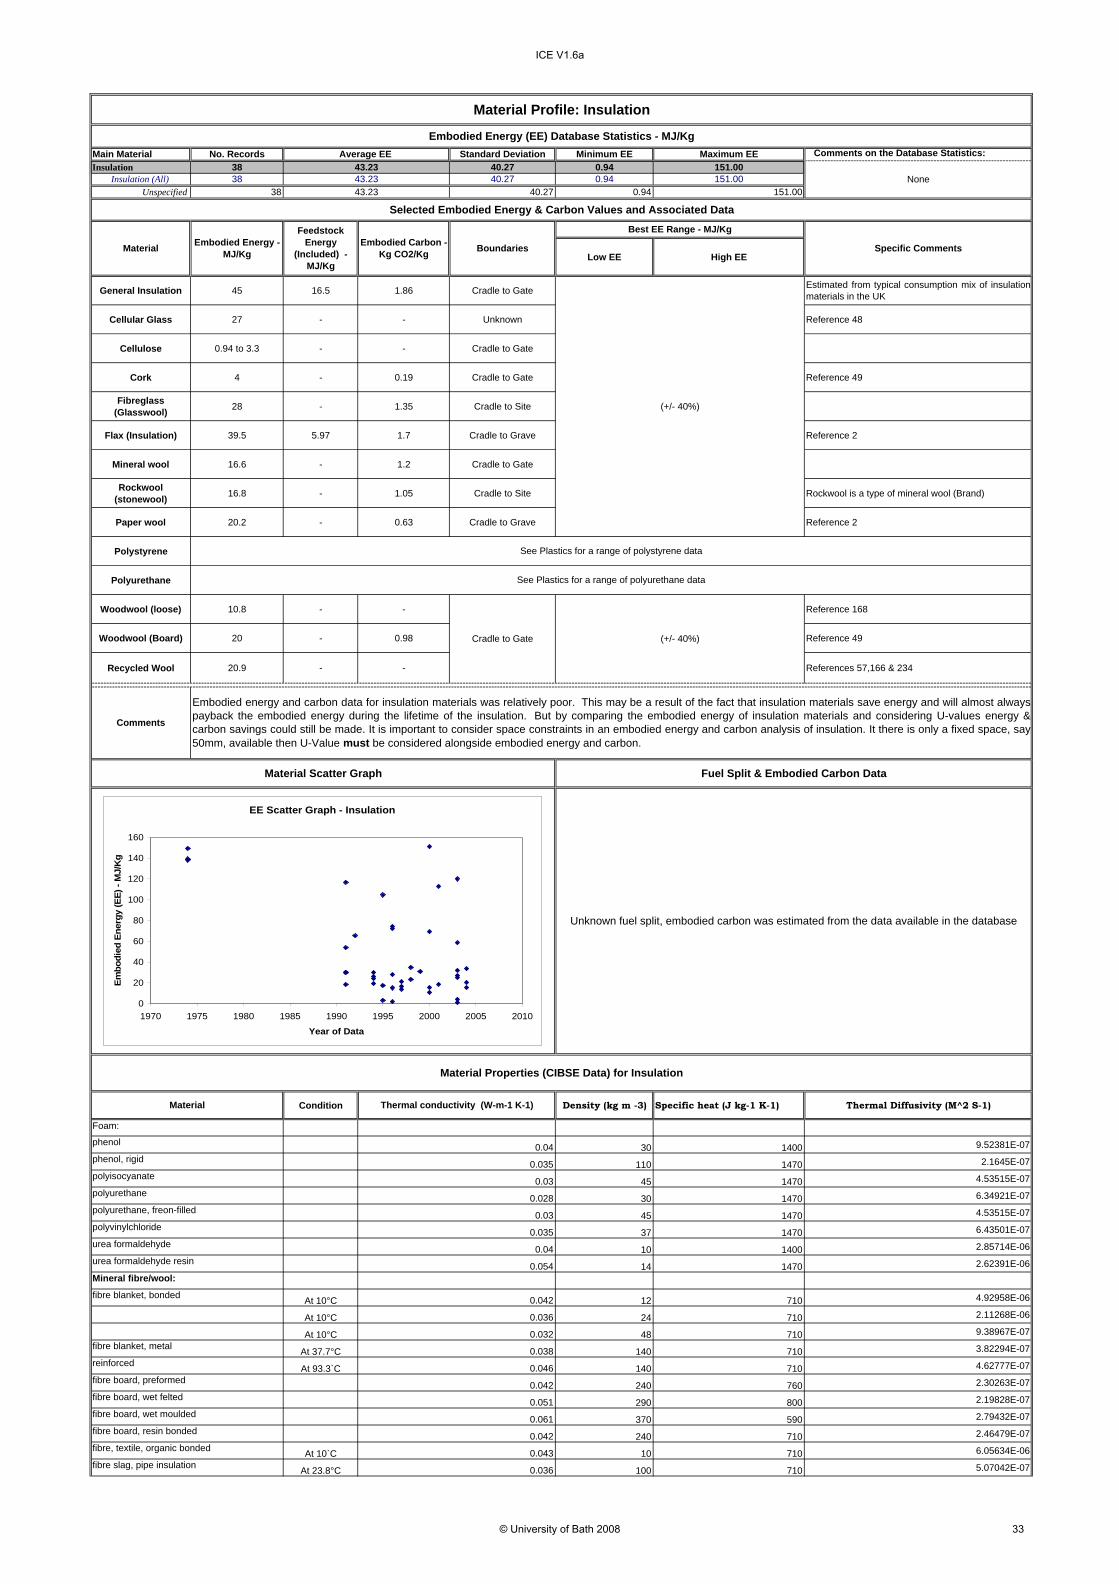
General Insulation Estimated from typical market shares, Feedstock Energy 16.5 MJ/kg (Included)
Cellular Glass Reference 48Cellulose Cork Reference 49Fibreglass (Glasswool) Poor data difficult to select appropriate value
Flax (Insulation) Reference 2, 5.97 MJ/kg Feedstock Energy (Included)
Mineral woolRockwool (stonewool)Paper wool Reference 2Polystyrene see plasticsPolyurethane see plasticsWoodwool (loose) Reference 168Woodwool (Board) Reference 49Wool (Recycled) References 57,166 & 234
IronGeneral Uncertain
Lead
General Allocated (divided) on a mass basis, assumes recycling rate of 61.5%
VirginRecycled
Virgin If produced with zinc Allocated by system expansion (i.e. energy contributable to zinc by other processes)
LimeGeneral Embodied carbon was difficult to estimate
LinoleumGeneral Data difficult to select, large data range.
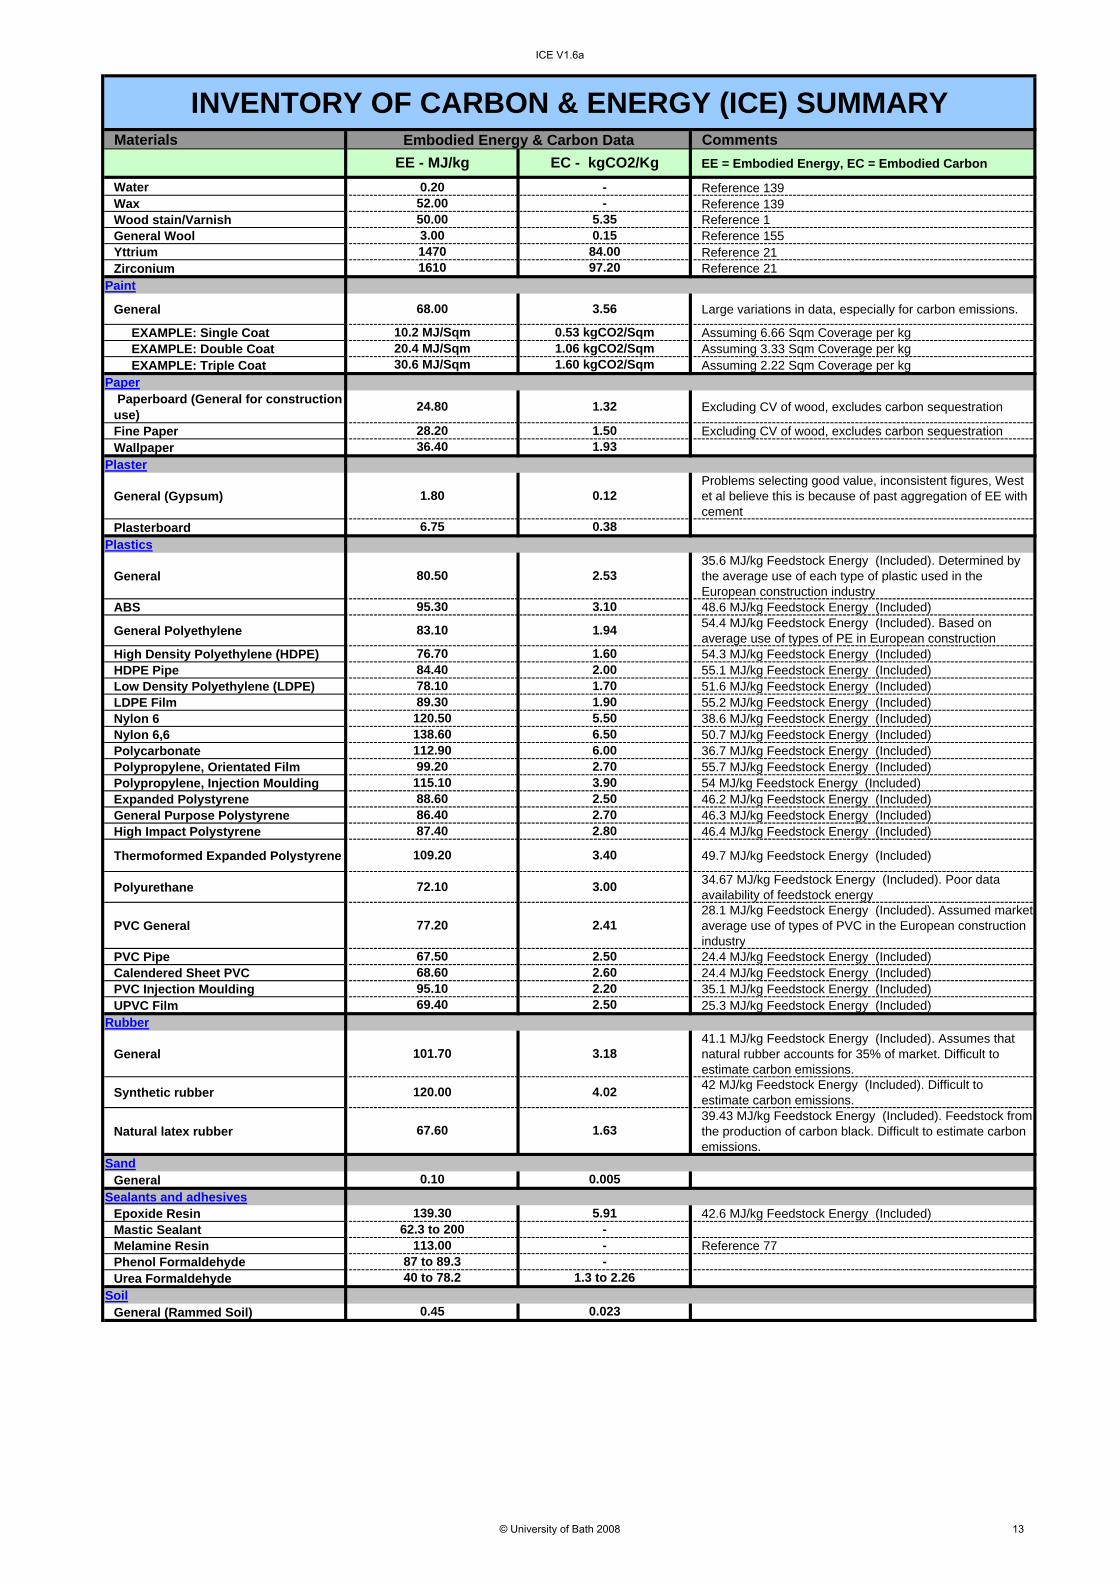
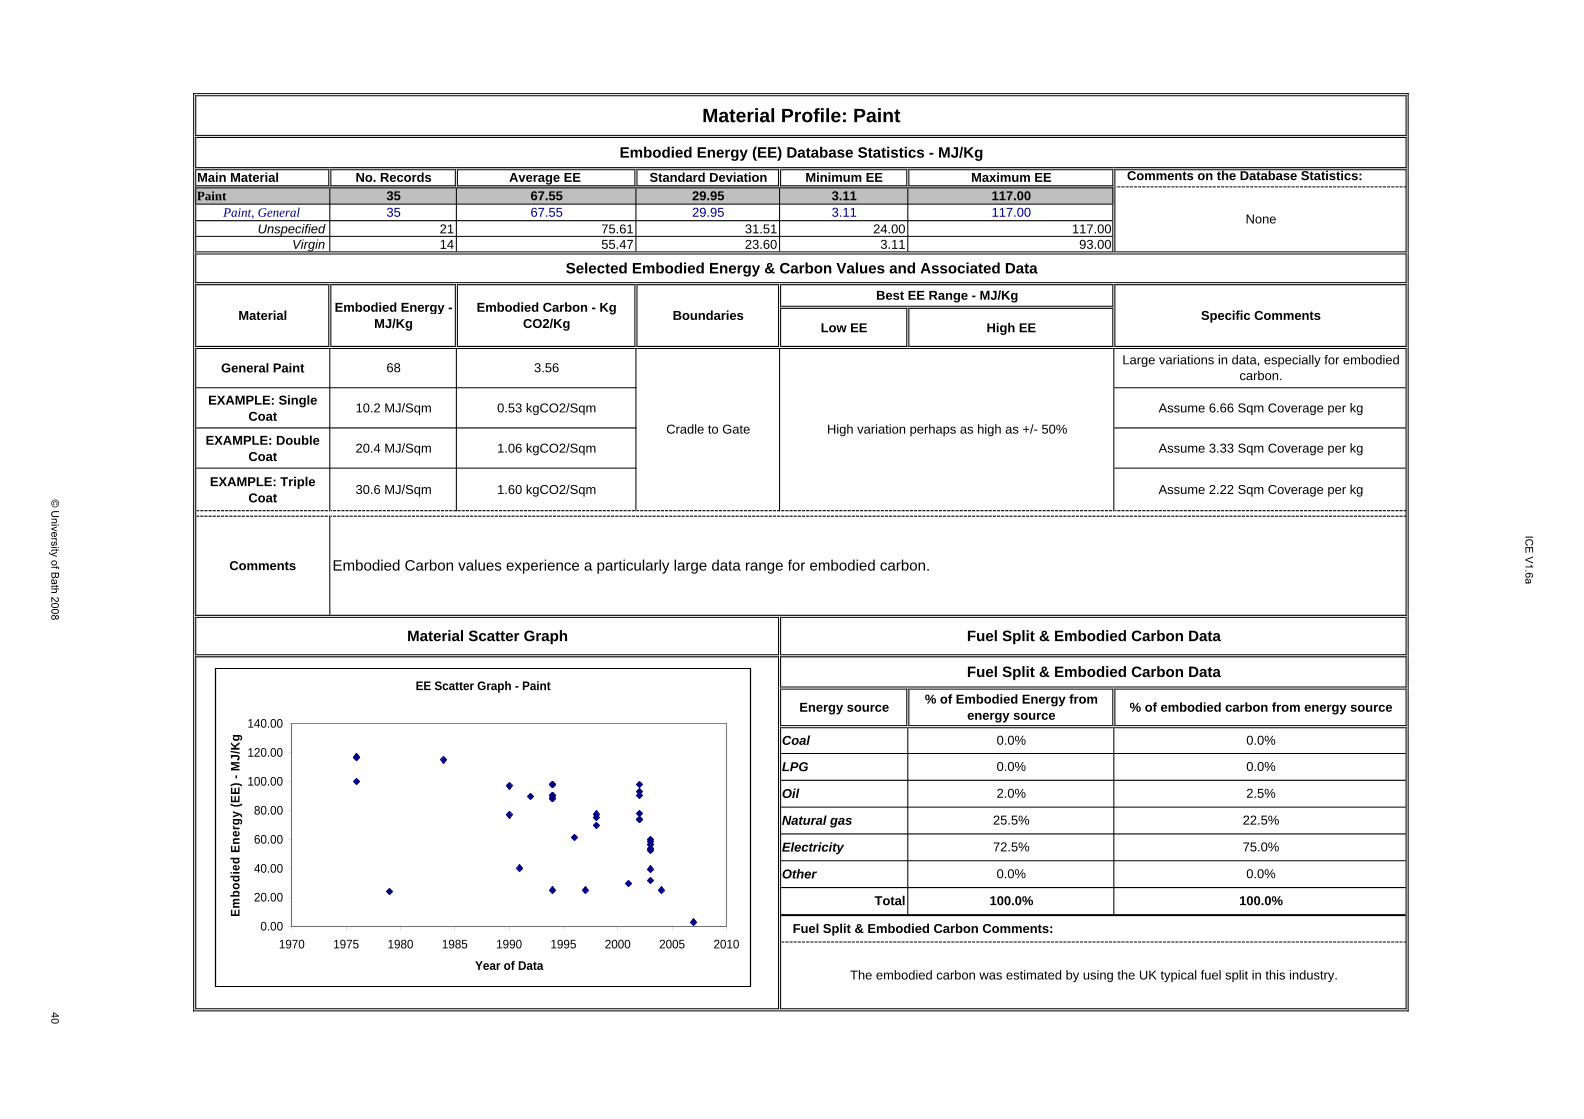
General Large variations in data, especially for carbon emissions.
EXAMPLE: Single Coat Assuming 6.66 Sqm Coverage per kgEXAMPLE: Double Coat Assuming 3.33 Sqm Coverage per kgEXAMPLE: Triple Coat Assuming 2.22 Sqm Coverage per kg
Paper Paperboard (General for construction use) Excluding CV of wood, excludes carbon sequestration
Fine Paper Excluding CV of wood, excludes carbon sequestrationWallpaper
Plaster
General (Gypsum)Problems selecting good value, inconsistent figures, West et al believe this is because of past aggregation of EE with cement
PlasterboardPlastics
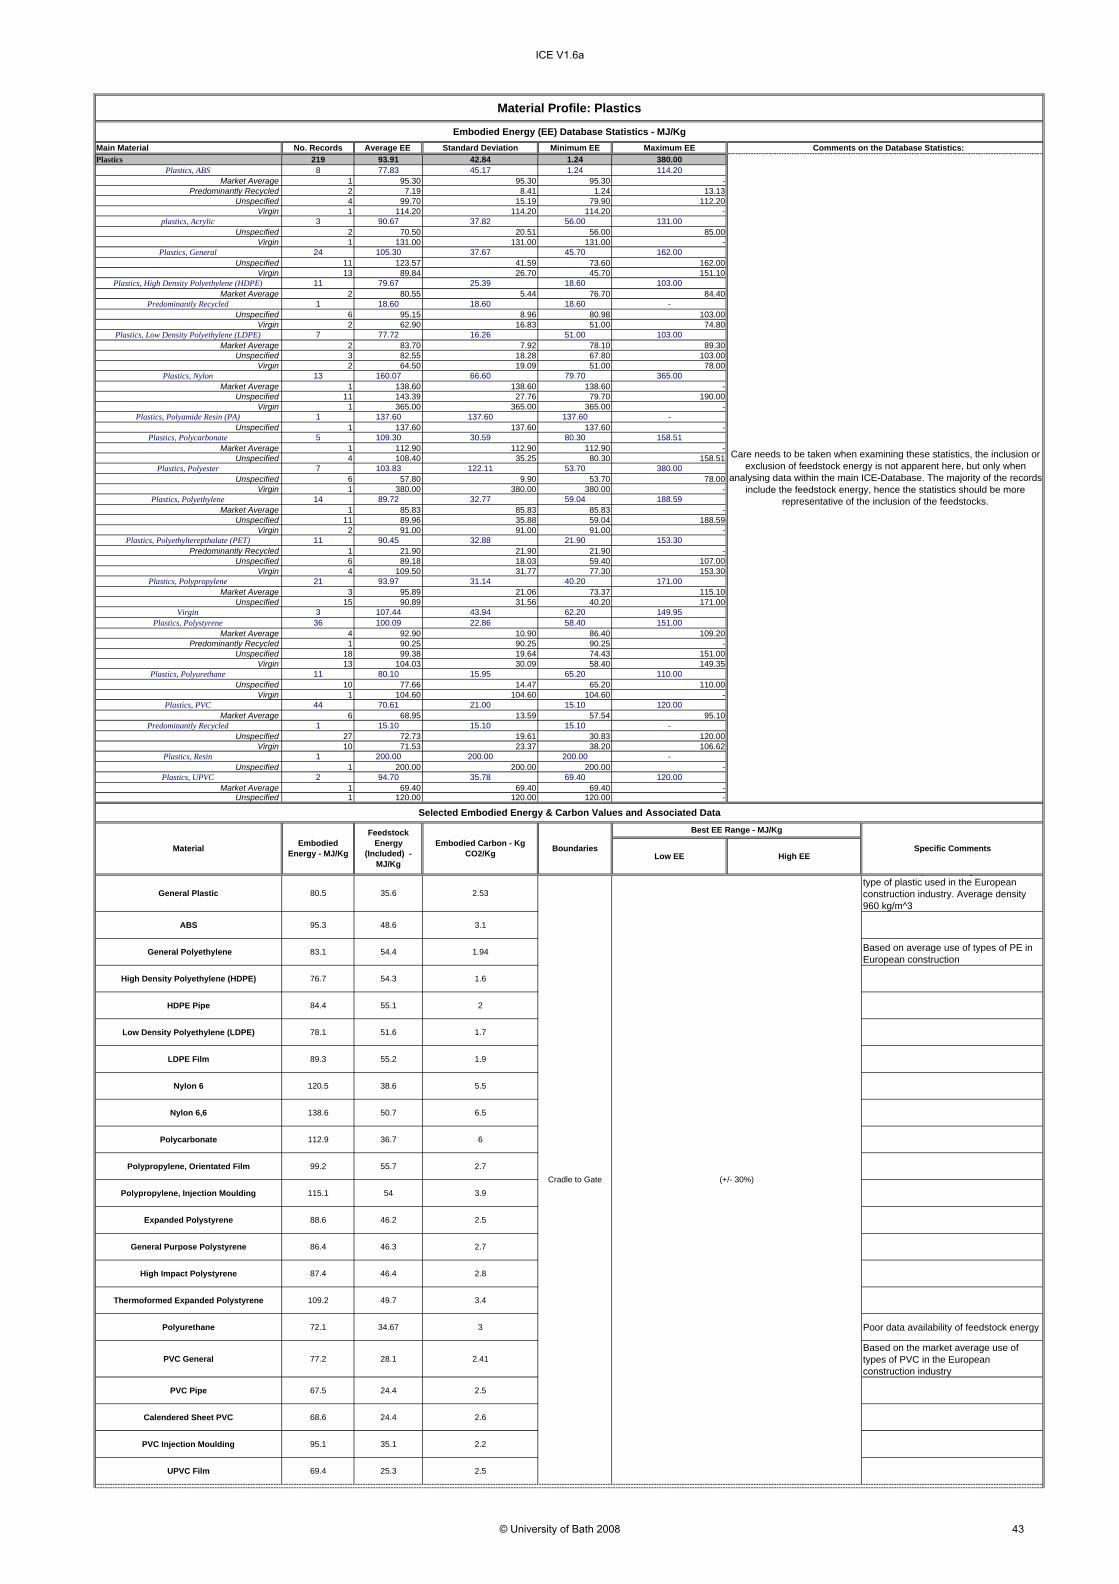
General35.6 MJ/kg Feedstock Energy (Included). Determined by the average use of each type of plastic used in the European construction industry
ABS 48.6 MJ/kg Feedstock Energy (Included)
General Polyethylene 54.4 MJ/kg Feedstock Energy (Included). Based on average use of types of PE in European construction
High Density Polyethylene (HDPE) 54.3 MJ/kg Feedstock Energy (Included)HDPE Pipe 55.1 MJ/kg Feedstock Energy (Included)Low Density Polyethylene (LDPE) 51.6 MJ/kg Feedstock Energy (Included)LDPE Film 55.2 MJ/kg Feedstock Energy (Included)Nylon 6 38.6 MJ/kg Feedstock Energy (Included)Nylon 6,6 50.7 MJ/kg Feedstock Energy (Included)Polycarbonate 36.7 MJ/kg Feedstock Energy (Included)Polypropylene, Orientated Film 55.7 MJ/kg Feedstock Energy (Included)Polypropylene, Injection Moulding 54 MJ/kg Feedstock Energy (Included)Expanded Polystyrene 46.2 MJ/kg Feedstock Energy (Included)General Purpose Polystyrene 46.3 MJ/kg Feedstock Energy (Included)High Impact Polystyrene 46.4 MJ/kg Feedstock Energy (Included)
Thermoformed Expanded Polystyrene 49.7 MJ/kg Feedstock Energy (Included)
Polyurethane 34.67 MJ/kg Feedstock Energy (Included). Poor data availability of feedstock energy
PVC General28.1 MJ/kg Feedstock Energy (Included). Assumed market average use of types of PVC in the European construction industry
PVC Pipe 24.4 MJ/kg Feedstock Energy (Included)Calendered Sheet PVC 24.4 MJ/kg Feedstock Energy (Included)PVC Injection Moulding 35.1 MJ/kg Feedstock Energy (Included)UPVC Film 25.3 MJ/kg Feedstock Energy (Included)
Rubber
General41.1 MJ/kg Feedstock Energy (Included). Assumes that natural rubber accounts for 35% of market. Difficult to estimate carbon emissions.
Synthetic rubber 42 MJ/kg Feedstock Energy (Included). Difficult to estimate carbon emissions.
Natural latex rubber39.43 MJ/kg Feedstock Energy (Included). Feedstock from the production of carbon black. Difficult to estimate carbon emissions.
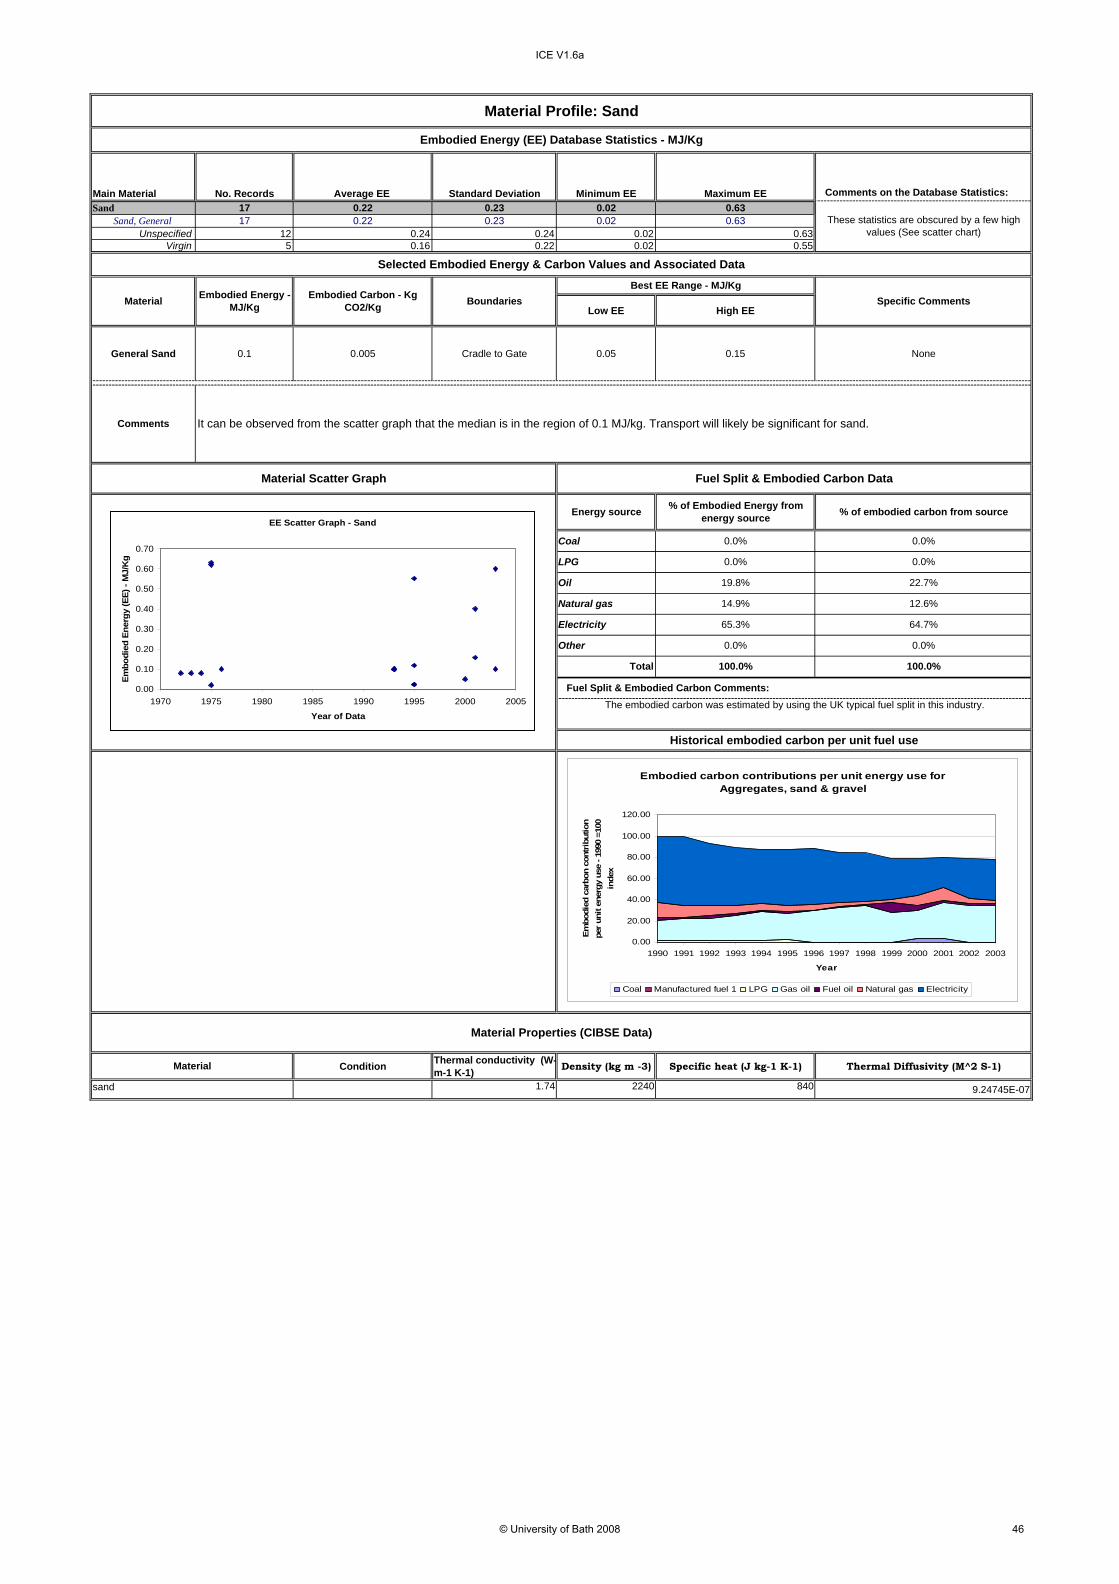
SandGeneral
Sealants and adhesivesEpoxide Resin 42.6 MJ/kg Feedstock Energy (Included)Mastic SealantMelamine Resin Reference 77Phenol FormaldehydeUrea Formaldehyde
General (average of all steels) Estimated from UK mix of materials. Worldwide recycled content of 42.7%
Virgin
Recycled Could not collect strong statistics on mix of recycled steels
Bar & rod Recycled content 42.7%VirginRecycled
Engineering steel - RecycledPipe - Virgin
RecycledPlate - Virgin
RecycledSection Recycled content 42.7%
VirginRecycled
Sheet - VirginRecycled
Sheet - Galvanised - VirginWire - Virgin
Stainless
4.3 MJ/kg Feedstock Energy (Included). This data has been difficult to select, there is highly conflicting data, finally selected world average data from institute of Stainless Steel Forum (ISSF) due to the large extent of the study. Values specified are for the most popular grade (304).
StoneGeneral Stone Gravel/ChippingsGranite Reference 22LimestoneMarbleMarble tileShale Reference 36Slate Large data range
TimberGeneral Estimated from UK consumption of timber Glue Laminated timber HardboardLaminated Veneer Lumber Ref 126MDF Only 4 data sourcesParticle Board Very large data range, difficult to select best valuePlywoodSawn HardwoodSawn SoftwoodVeneer Particleboard (Furniture)
TinTin Coated Plate (Steel)Tin lack of modern data, large range of data
Titanium
Virgin lack of modern data, large range of data, small sample size
Recycled lack of modern data, large range of data, small sample size
Vinyl Flooring
General 23.58 MJ/kg Feedstock Energy (Included), Same value as PVC calendered sheet
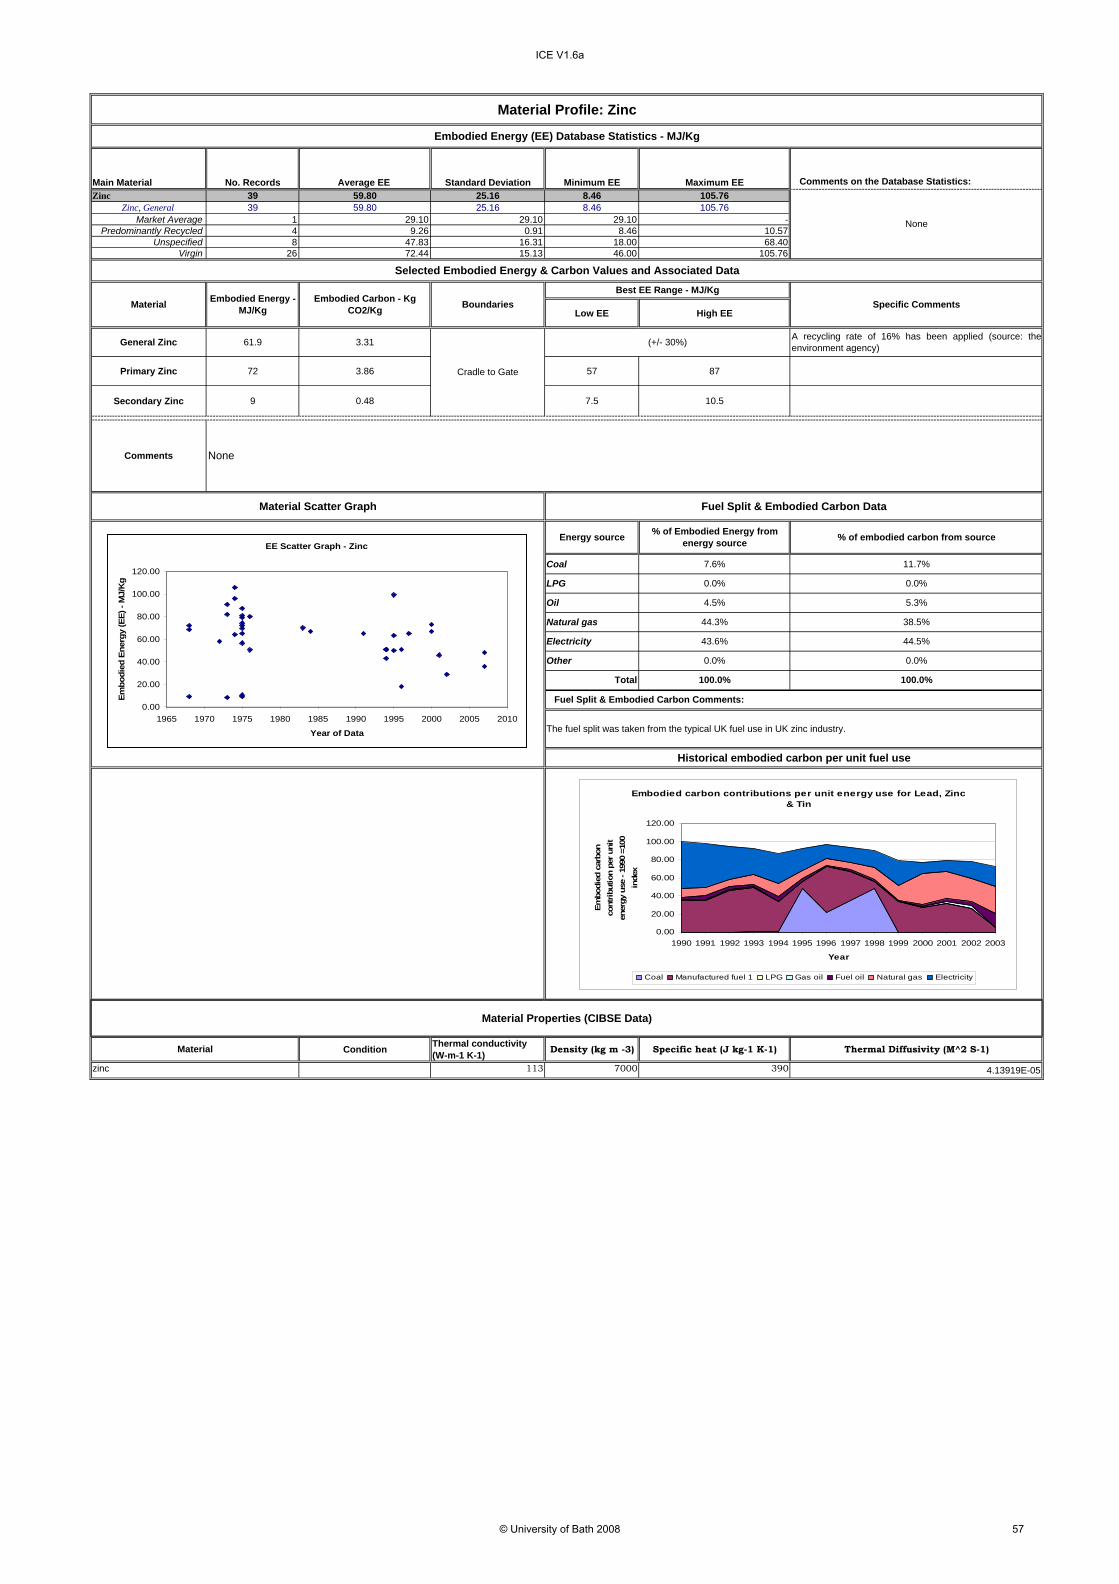
Vinyl Composite Tiles (VCT) Reference 77Zinc
GeneralVirginRecycled
uncertain carbon estimates, currently estimated from typical fuel mix
36.40 2.68
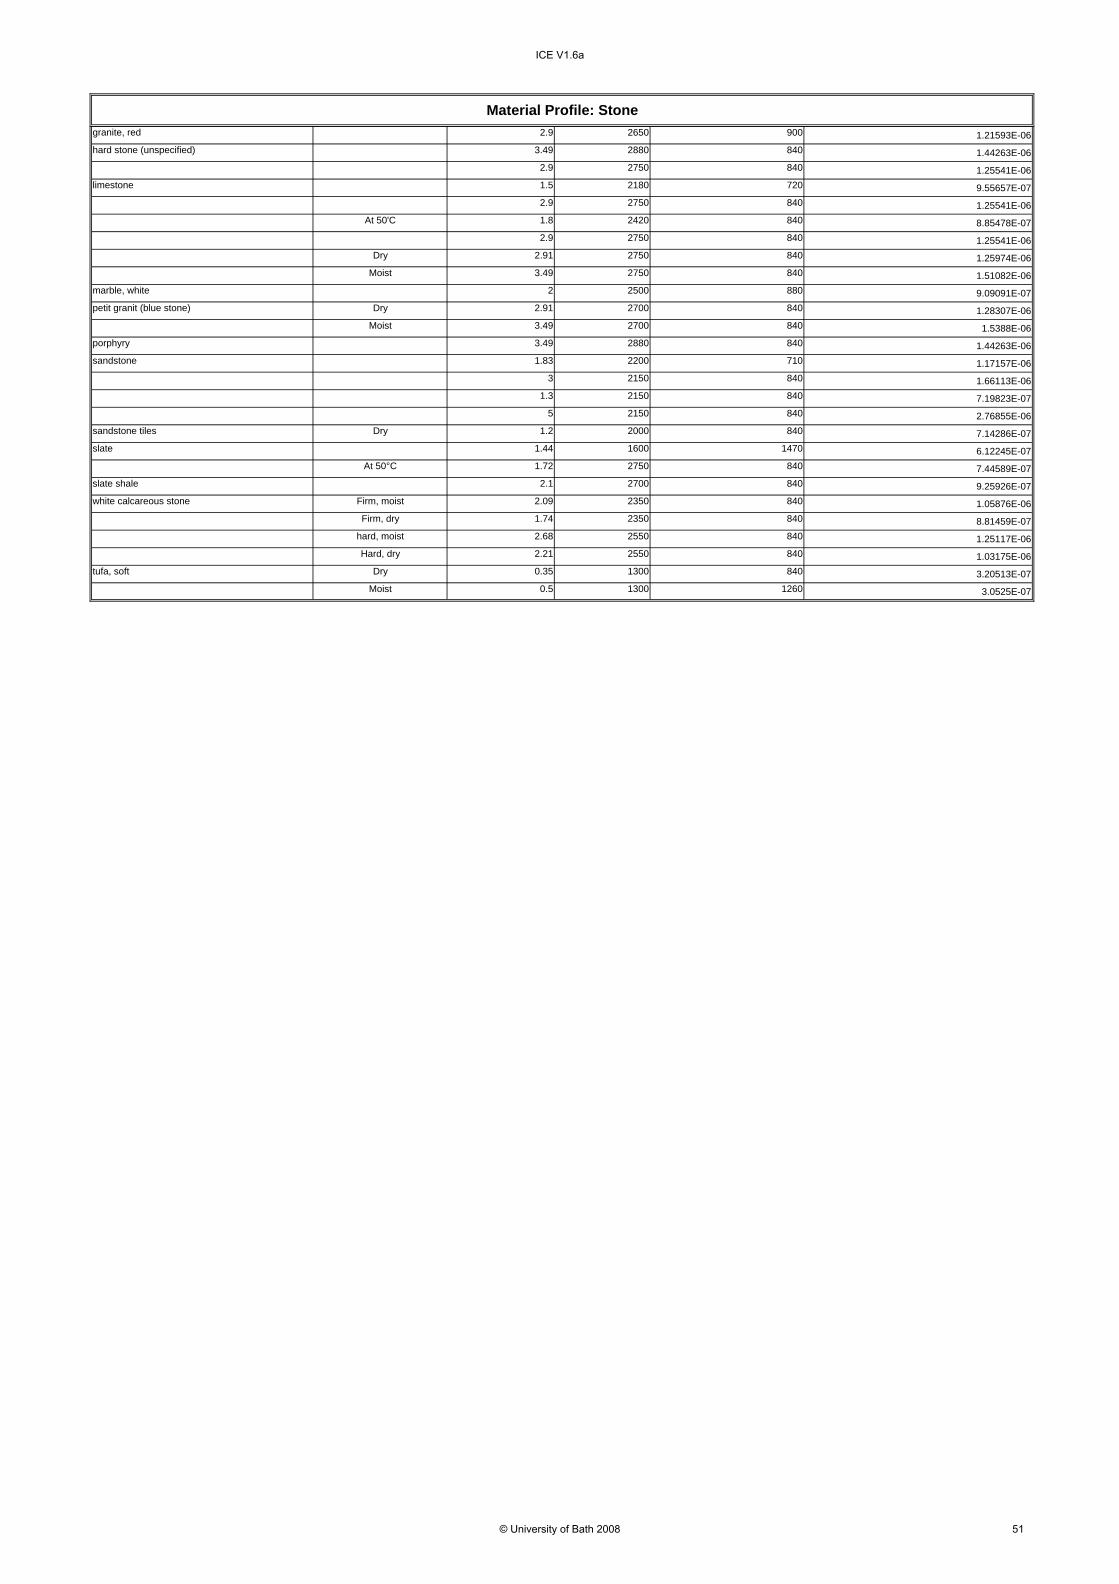
Data on stone was difficult to select, with high standard deviations and data ranges.
All timber values exclude the Calorific Value (CV) of wood. Timber values were particularly difficult to select!
Main Material Standard Deviation Minimum EE Maximum EE Comments on the Database Statistics:Material
Sub-Material Category100% Recycled50% Recycled
Other SpecificationUnspecified
Virgin
UK Typical Primary Secondary UK Typical Primary Secondary Low EE High EE
General Material
Cast Products
Extruded
Rolled
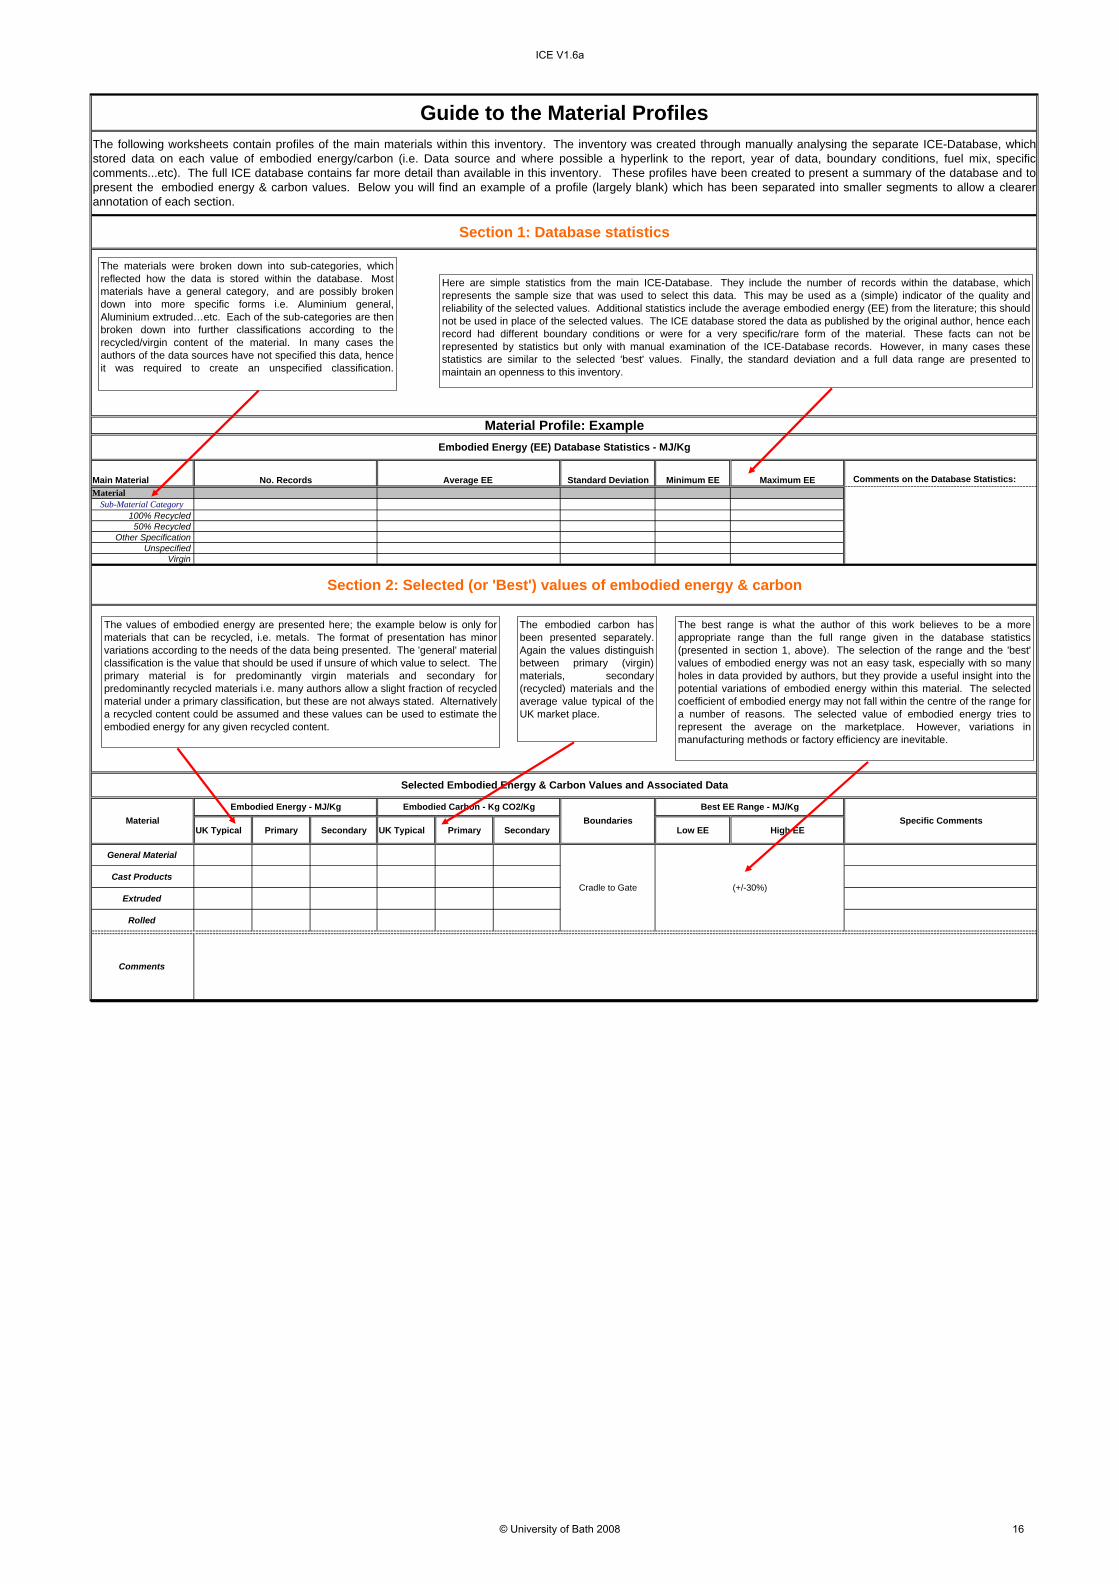
Guide to the Material ProfilesThe following worksheets contain profiles of the main materials within this inventory. The inventory was created through manually analysing the separate ICE-Database, whichstored data on each value of embodied energy/carbon (i.e. Data source and where possible a hyperlink to the report, year of data, boundary conditions, fuel mix, specificcomments...etc). The full ICE database contains far more detail than available in this inventory. These profiles have been created to present a summary of the database and topresent the embodied energy & carbon values. Below you will find an example of a profile (largely blank) which has been separated into smaller segments to allow a clearerannotation of each section.
Section 1: Database statistics
Section 2: Selected (or 'Best') values of embodied energy & carbon
Material Profile: ExampleEmbodied Energy (EE) Database Statistics - MJ/Kg
No. Records Average EE
Embodied Energy - MJ/Kg Embodied Carbon - Kg CO2/Kg
Selected Embodied Energy & Carbon Values and Associated Data
Material BoundariesBest EE Range - MJ/Kg
Specific Comments
Comments
Cradle to Gate (+/-30%)
Here are simple statistics from the main ICE-Database. They include the number of records within the database, whichrepresents the sample size that was used to select this data. This may be used as a (simple) indicator of the quality andreliability of the selected values. Additional statistics include the average embodied energy (EE) from the literature; this shouldnot be used in place of the selected values. The ICE database stored the data as published by the original author, hence eachrecord had different boundary conditions or were for a very specific/rare form of the material. These facts can not berepresented by statistics but only with manual examination of the ICE-Database records. However, in many cases thesestatistics are similar to the selected 'best' values. Finally, the standard deviation and a full data range are presented tomaintain an openness to this inventory.
The materials were broken down into sub-categories, whichreflected how the data is stored within the database. Mostmaterials have a general category, and are possibly brokendown into more specific forms i.e. Aluminium general,Aluminium extruded…etc. Each of the sub-categories are thenbroken down into further classifications according to therecycled/virgin content of the material. In many cases theauthors of the data sources have not specified this data, henceit was required to create an unspecified classification.
The values of embodied energy are presented here; the example below is only formaterials that can be recycled, i.e. metals. The format of presentation has minorvariations according to the needs of the data being presented. The 'general' materialclassification is the value that should be used if unsure of which value to select. Theprimary material is for predominantly virgin materials and secondary forpredominantly recycled materials i.e. many authors allow a slight fraction of recycledmaterial under a primary classification, but these are not always stated. Alternativelya recycled content could be assumed and these values can be used to estimate theembodied energy for any given recycled content.
The embodied carbon hasbeen presented separately.Again the values distinguishbetween primary (virgin)materials, secondary(recycled) materials and theaverage value typical of theUK market place.
The best range is what the author of this work believes to be a moreappropriate range than the full range given in the database statistics(presented in section 1, above). The selection of the range and the 'best'values of embodied energy was not an easy task, especially with so manyholes in data provided by authors, but they provide a useful insight into thepotential variations of embodied energy within this material. The selectedcoefficient of embodied energy may not fall within the centre of the range fora number of reasons. The selected value of embodied energy tries torepresent the average on the marketplace. However, variations inmanufacturing methods or factory efficiency are inevitable.
% of Embodied Energy from energy source % of embodied carbon from source
Material Condition Thermal conductivity (W-m-1K-1) Density (kg m -3)
Material Scatter Graph Fuel Split & Embodied Carbon Data
Material Properties (CIBSE Data)
Other
Coal
Electricity
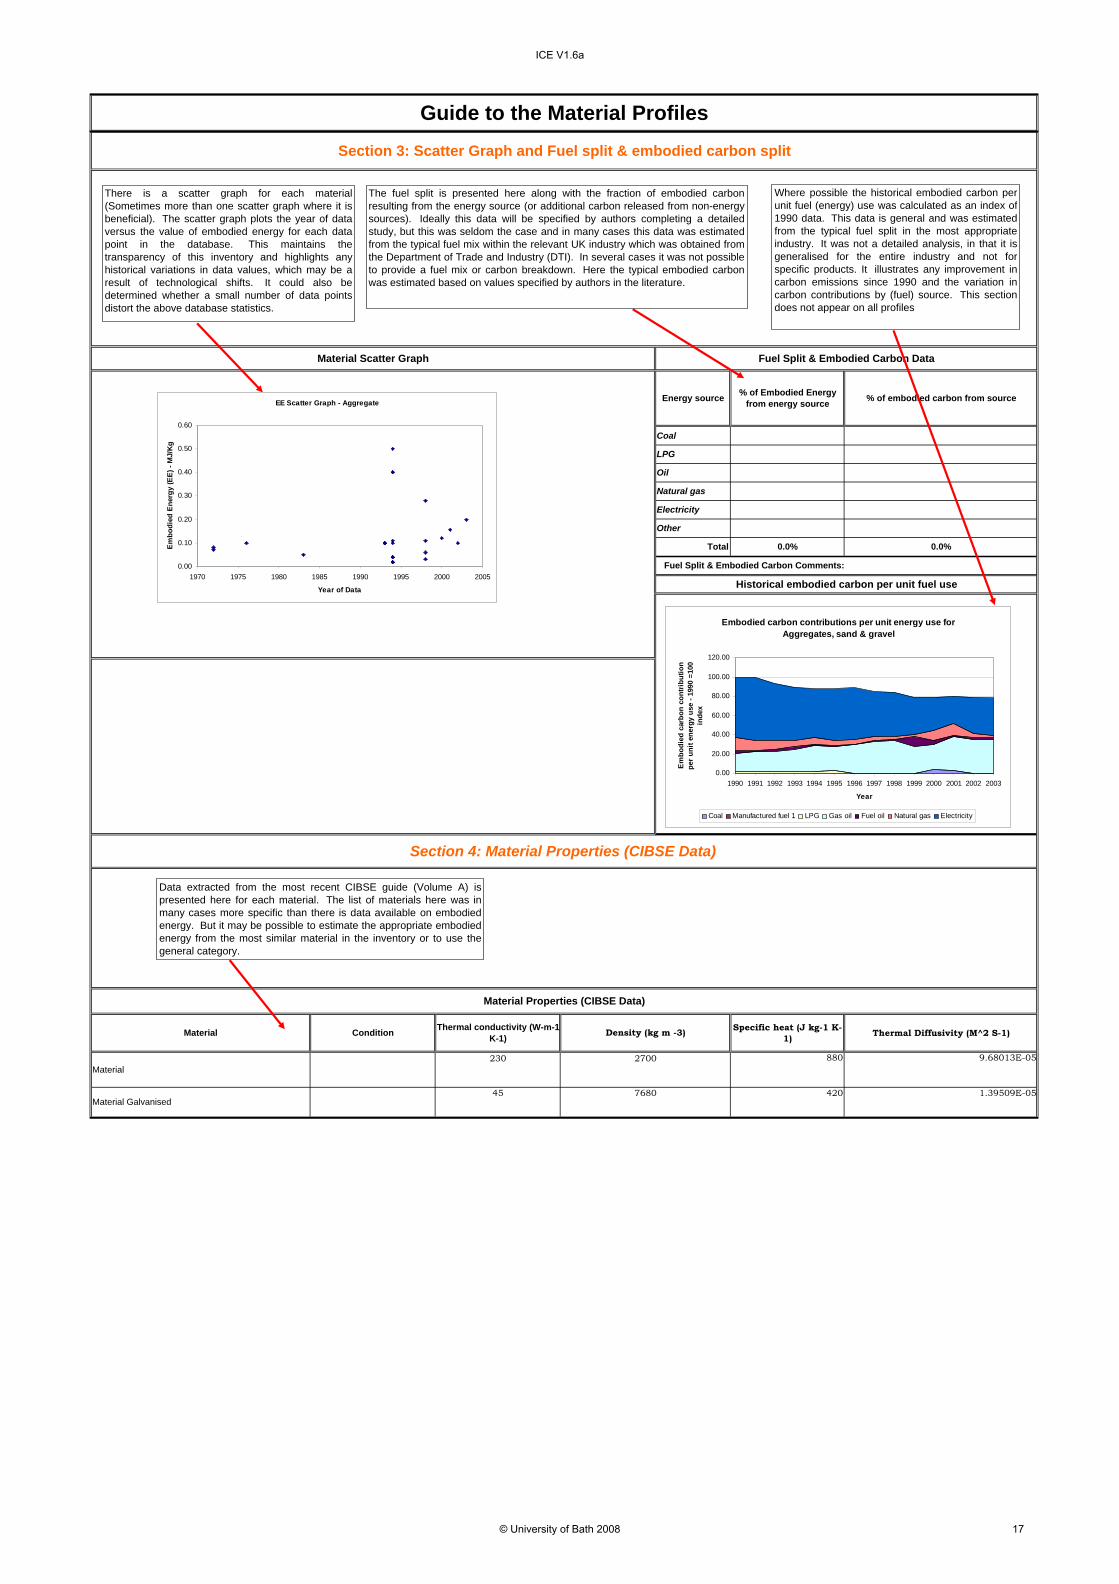
There is a scatter graph for each material(Sometimes more than one scatter graph where it isbeneficial). The scatter graph plots the year of dataversus the value of embodied energy for each datapoint in the database. This maintains thetransparency of this inventory and highlights anyhistorical variations in data values, which may be aresult of technological shifts. It could also bedetermined whether a small number of data pointsdistort the above database statistics.
The fuel split is presented here along with the fraction of embodied carbonresulting from the energy source (or additional carbon released from non-energysources). Ideally this data will be specified by authors completing a detailedstudy, but this was seldom the case and in many cases this data was estimatedfrom the typical fuel mix within the relevant UK industry which was obtained fromthe Department of Trade and Industry (DTI). In several cases it was not possibleto provide a fuel mix or carbon breakdown. Here the typical embodied carbonwas estimated based on values specified by authors in the literature.
Data extracted from the most recent CIBSE guide (Volume A) ispresented here for each material. The list of materials here was inmany cases more specific than there is data available on embodiedenergy. But it may be possible to estimate the appropriate embodiedenergy from the most similar material in the inventory or to use thegeneral category.
Embodied carbon contributions per unit energy use for Aggregates, sand & gravel
Coal Manufactured fuel 1 LPG Gas oil Fuel oil Natural gas Electricity
Where possible the historical embodied carbon perunit fuel (energy) use was calculated as an index of1990 data. This data is general and was estimatedfrom the typical fuel split in the most appropriateindustry. It was not a detailed analysis, in that it isgeneralised for the entire industry and not forspecific products. It illustrates any improvement incarbon emissions since 1990 and the variation incarbon contributions by (fuel) source. This sectiondoes not appear on all profiles
General Aggregate 0.1 0.005 Cradle to Gate 0.05 0.25 None
Condition Thermal conductivity (W-m-1 K-1) Density (kg m -3) Specific heat (J
kg-1 K-1) Thermal Diffusivity (M^2 S-1)
Undried 1.8 2240 840 9.5663E-07
Oven dried 1.3 2240 920 6.3082E-07aggregate (sand, gravel or stone)
Material Properties (CIBSE Data)
Material
aggregate
The embodied carbon was estimated by using the UK typical fuel split in this industry, the resultingvalue is in agreement with other results in the literature.
Total 100.0% 100.0%
Other 0.0%
Electricity 65.3%
0.0%
0.0%
0.0%
14.9% 12.6%
64.7%
22.7%19.8%
0.0%
0.0%
CommentsIt should be noted that the scatter graph does not display all of the data that needs to be considered when selecting a best value, e.g.the boundary conditions (cradle to site, cradle to gate...etc), these are stored in the database but they are not represented in the scattergraph. Transport will likely be significant for aggregates.
Material Scatter Graph Fuel Split & Embodied Carbon Data
LPG
Historical embodied carbon per unit fuel use
% of Embodied Energy from energy
source
Fuel Split & Embodied Carbon Comments:
Natural gas
Energy source
Coal
Oil
% of embodied carbon from source
Material Profile: Aggregate
Embodied Energy (EE) Database Statistics - MJ/Kg
Embodied Carbon - Kg CO2/Kg Boundaries
Best EE Range - MJ/KgSpecific Comments
Selected Embodied Energy & Carbon Values and Associated Data
Material Embodied Energy - MJ/Kg
None
Embodied carbon contributions per unit energy use for Aggregates, sand & gravel
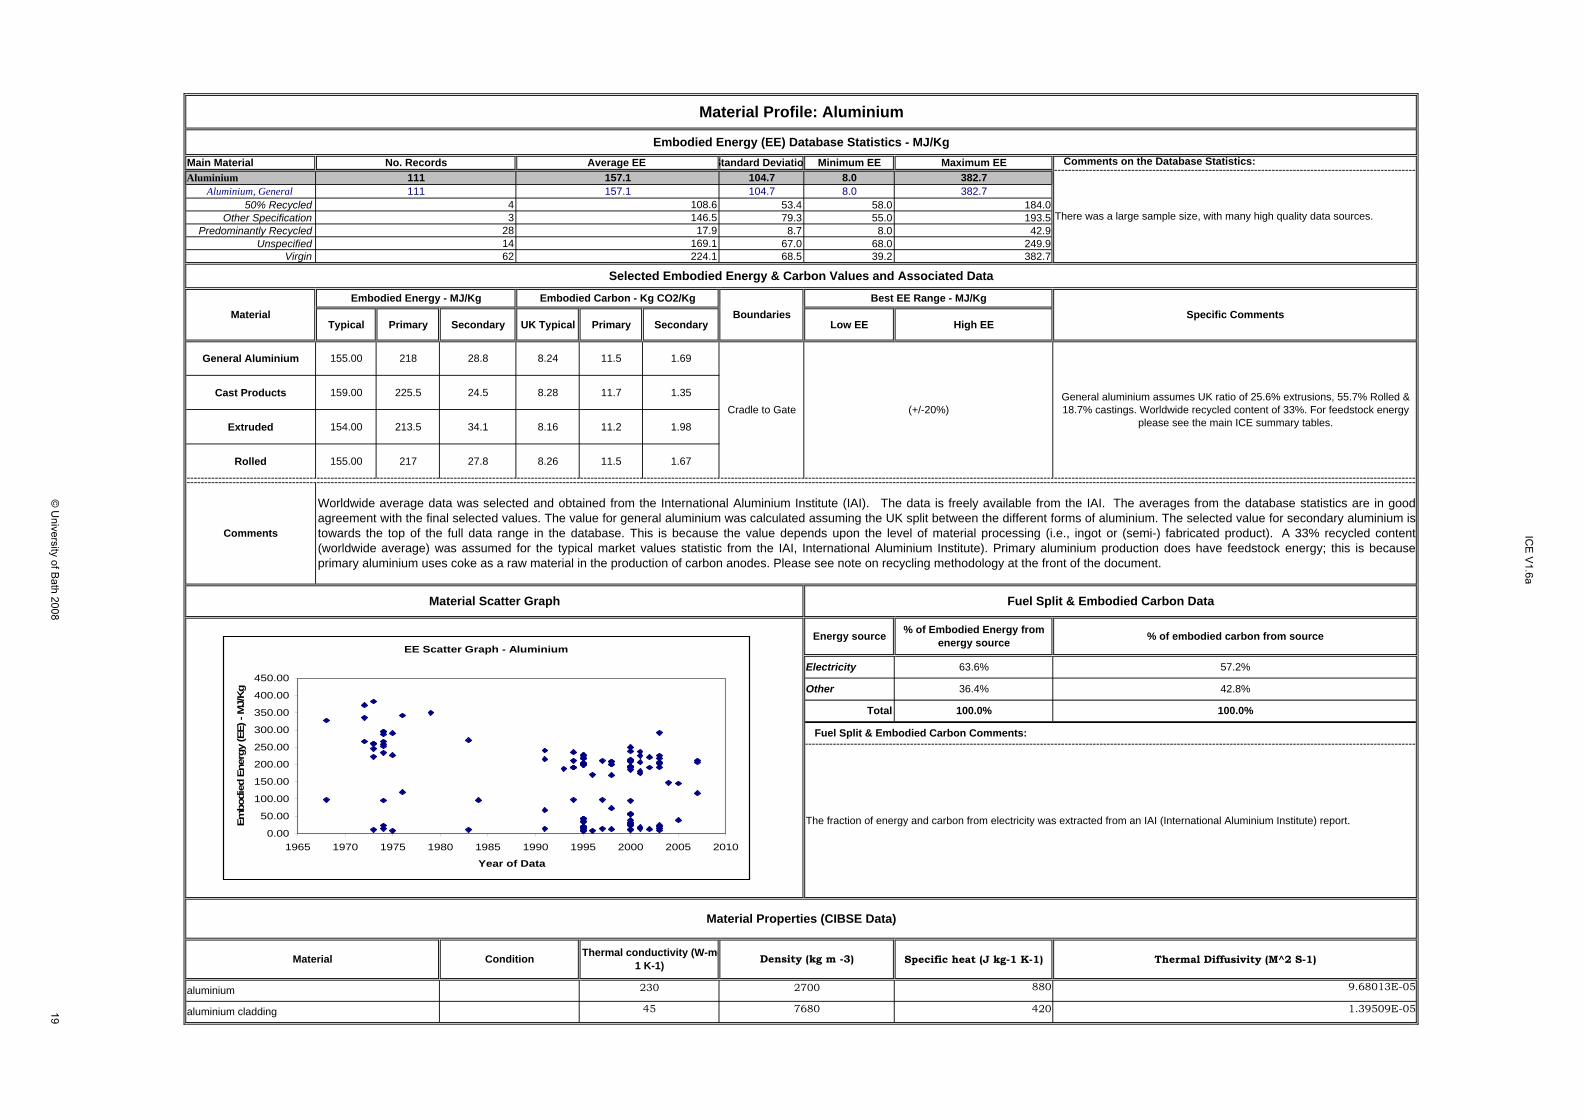
Main Material Standard Deviatio Minimum EE Maximum EE Comments on the Database Statistics:Aluminium 104.7 8.0 382.7
Aluminium, General 104.7 8.0 382.750% Recycled 53.4 58.0 184.0
Other Specification 79.3 55.0 193.5Predominantly Recycled 8.7 8.0 42.9
Unspecified 67.0 68.0 249.9Virgin 68.5 39.2 382.7
Typical Primary Secondary UK Typical Primary Secondary Low EE High EE
General Aluminium 155.00 218 28.8 8.24 11.5 1.69
Cast Products 159.00 225.5 24.5 8.28 11.7 1.35
Extruded 154.00 213.5 34.1 8.16 11.2 1.98
Rolled 155.00 217 27.8 8.26 11.5 1.67
Specific heat (J kg-1 K-1) Thermal Diffusivity (M^2 S-1)
880 9.68013E-05
420 1.39509E-05
General aluminium assumes UK ratio of 25.6% extrusions, 55.7% Rolled & 18.7% castings. Worldwide recycled content of 33%. For feedstock energy
please see the main ICE summary tables.
328
7680
aluminium
aluminium cladding
230
45
2700
63.6%
Material Condition
Total 100.0%
Density (kg m -3)Thermal conductivity (W-m-1 K-1)
Fuel Split & Embodied Carbon Comments:
The fraction of energy and carbon from electricity was extracted from an IAI (International Aluminium Institute) report.
Material Properties (CIBSE Data)
Worldwide average data was selected and obtained from the International Aluminium Institute (IAI). The data is freely available from the IAI. The averages from the database statistics are in goodagreement with the final selected values. The value for general aluminium was calculated assuming the UK split between the different forms of aluminium. The selected value for secondary aluminium istowards the top of the full data range in the database. This is because the value depends upon the level of material processing (i.e., ingot or (semi-) fabricated product). A 33% recycled content(worldwide average) was assumed for the typical market values statistic from the IAI, International Aluminium Institute). Primary aluminium production does have feedstock energy; this is becauseprimary aluminium uses coke as a raw material in the production of carbon anodes. Please see note on recycling methodology at the front of the document.
% of embodied carbon from source
42.8%
57.2%
100.0%
Other 36.4%
Energy source
Electricity
108.6146.517.9
% of Embodied Energy from energy source
Material Scatter Graph Fuel Split & Embodied Carbon Data
There was a large sample size, with many high quality data sources.
111 157.1
Comments
Cradle to Gate
Material
(+/-20%)
Embodied Energy - MJ/KgBoundaries
No. Records
1114
Average EE
157.1
Material Profile: Aluminium
Embodied Energy (EE) Database Statistics - MJ/Kg
Selected Embodied Energy & Carbon Values and Associated Data
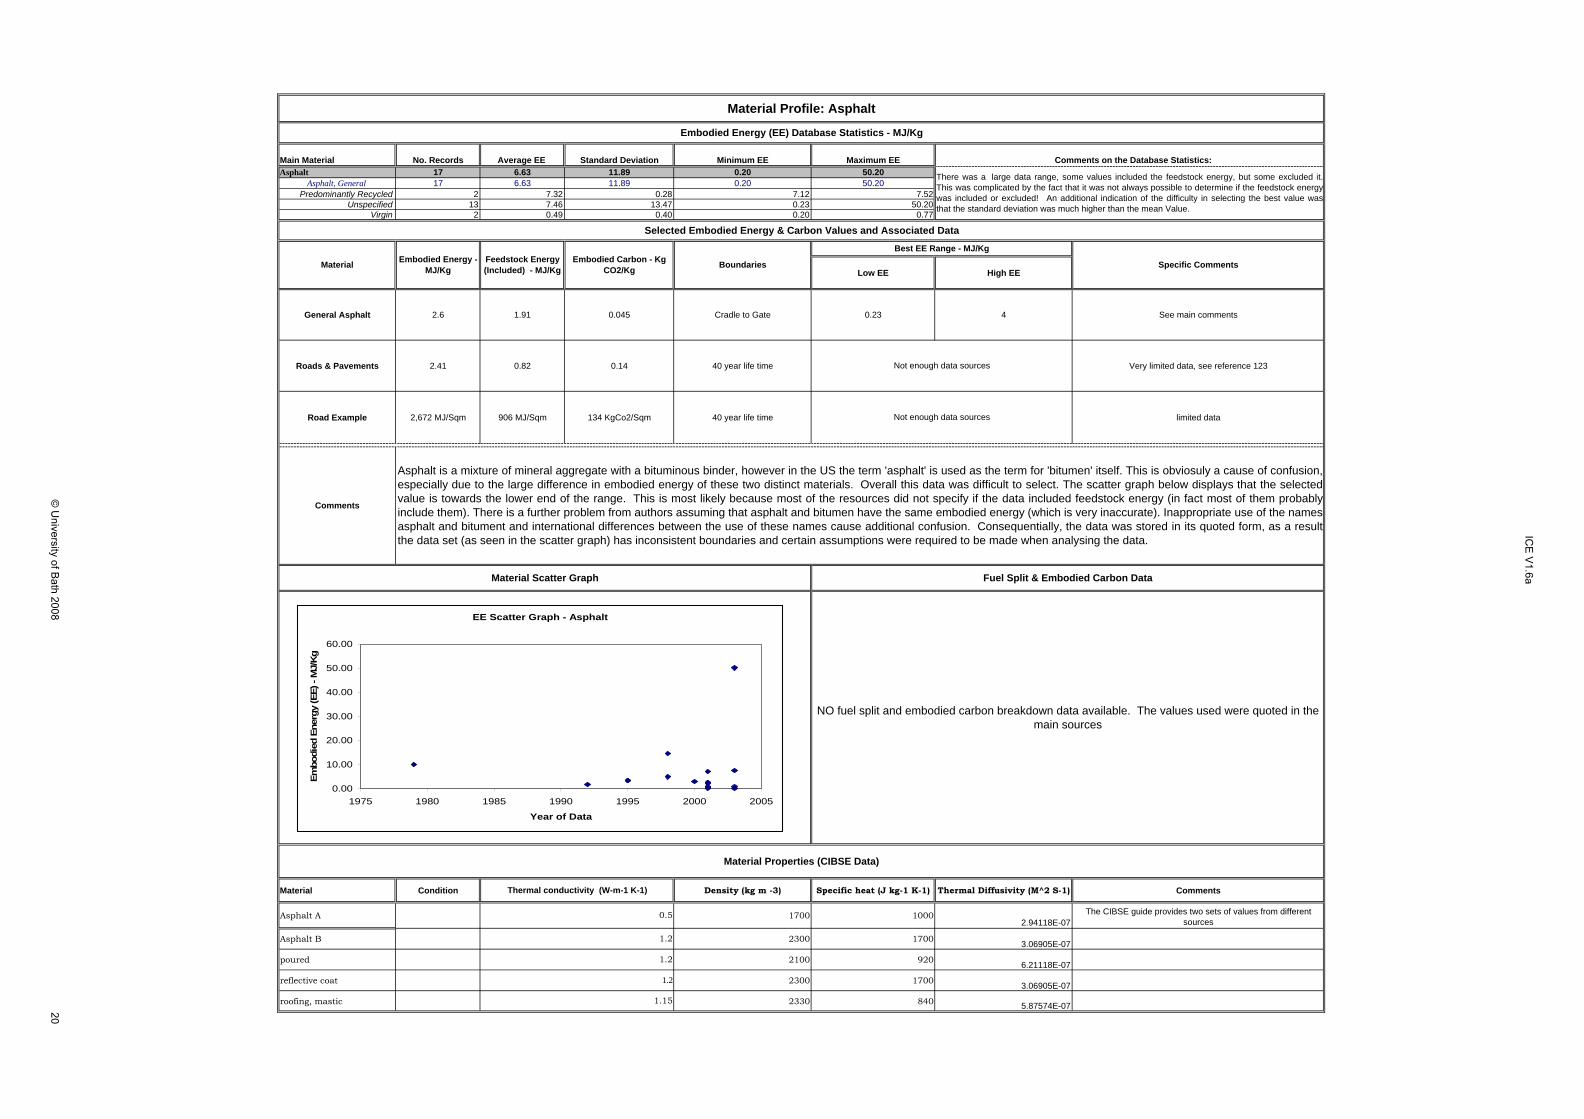
General Asphalt 2.6 1.91 0.045 Cradle to Gate 0.23 4 See main comments
Roads & Pavements 2.41 0.82 0.14 40 year life time Very limited data, see reference 123
Road Example 2,672 MJ/Sqm 906 MJ/Sqm 134 KgCo2/Sqm 40 year life time limited data
Material Condition Density (kg m -3) Specific heat (J kg-1 K-1) Thermal Diffusivity (M^2 S-1) Comments
Asphalt A 1700 10002.94118E-07
The CIBSE guide provides two sets of values from different sources
Asphalt B 2300 1700 3.06905E-07
poured 2100 920 6.21118E-07
reflective coat 2300 1700 3.06905E-07
roofing, mastic 2330 840 5.87574E-07
1.2
1.15
Material Scatter Graph Fuel Split & Embodied Carbon Data
Material Properties (CIBSE Data)
Thermal conductivity (W-m-1 K-1)
0.5
1.2
1.2
Material Profile: Asphalt
Embodied Energy (EE) Database Statistics - MJ/Kg
Selected Embodied Energy & Carbon Values and Associated Data
Specific CommentsMaterial Embodied Energy - MJ/Kg
Embodied Carbon - Kg CO2/Kg Boundaries
Comments on the Database Statistics:
There was a large data range, some values included the feedstock energy, but some excluded it.This was complicated by the fact that it was not always possible to determine if the feedstock energywas included or excluded! An additional indication of the difficulty in selecting the best value wasthat the standard deviation was much higher than the mean Value.
Feedstock Energy (Included) - MJ/Kg
Not enough data sources
NO fuel split and embodied carbon breakdown data available. The values used were quoted in the main sources
Best EE Range - MJ/Kg
Comments
Asphalt is a mixture of mineral aggregate with a bituminous binder, however in the US the term 'asphalt' is used as the term for 'bitumen' itself. This is obviosuly a cause of confusion,especially due to the large difference in embodied energy of these two distinct materials. Overall this data was difficult to select. The scatter graph below displays that the selectedvalue is towards the lower end of the range. This is most likely because most of the resources did not specify if the data included feedstock energy (in fact most of them probablyinclude them). There is a further problem from authors assuming that asphalt and bitumen have the same embodied energy (which is very inaccurate). Inappropriate use of the namesasphalt and bitument and international differences between the use of these names cause additional confusion. Consequentially, the data was stored in its quoted form, as a resultthe data set (as seen in the scatter graph) has inconsistent boundaries and certain assumptions were required to be made when analysing the data.
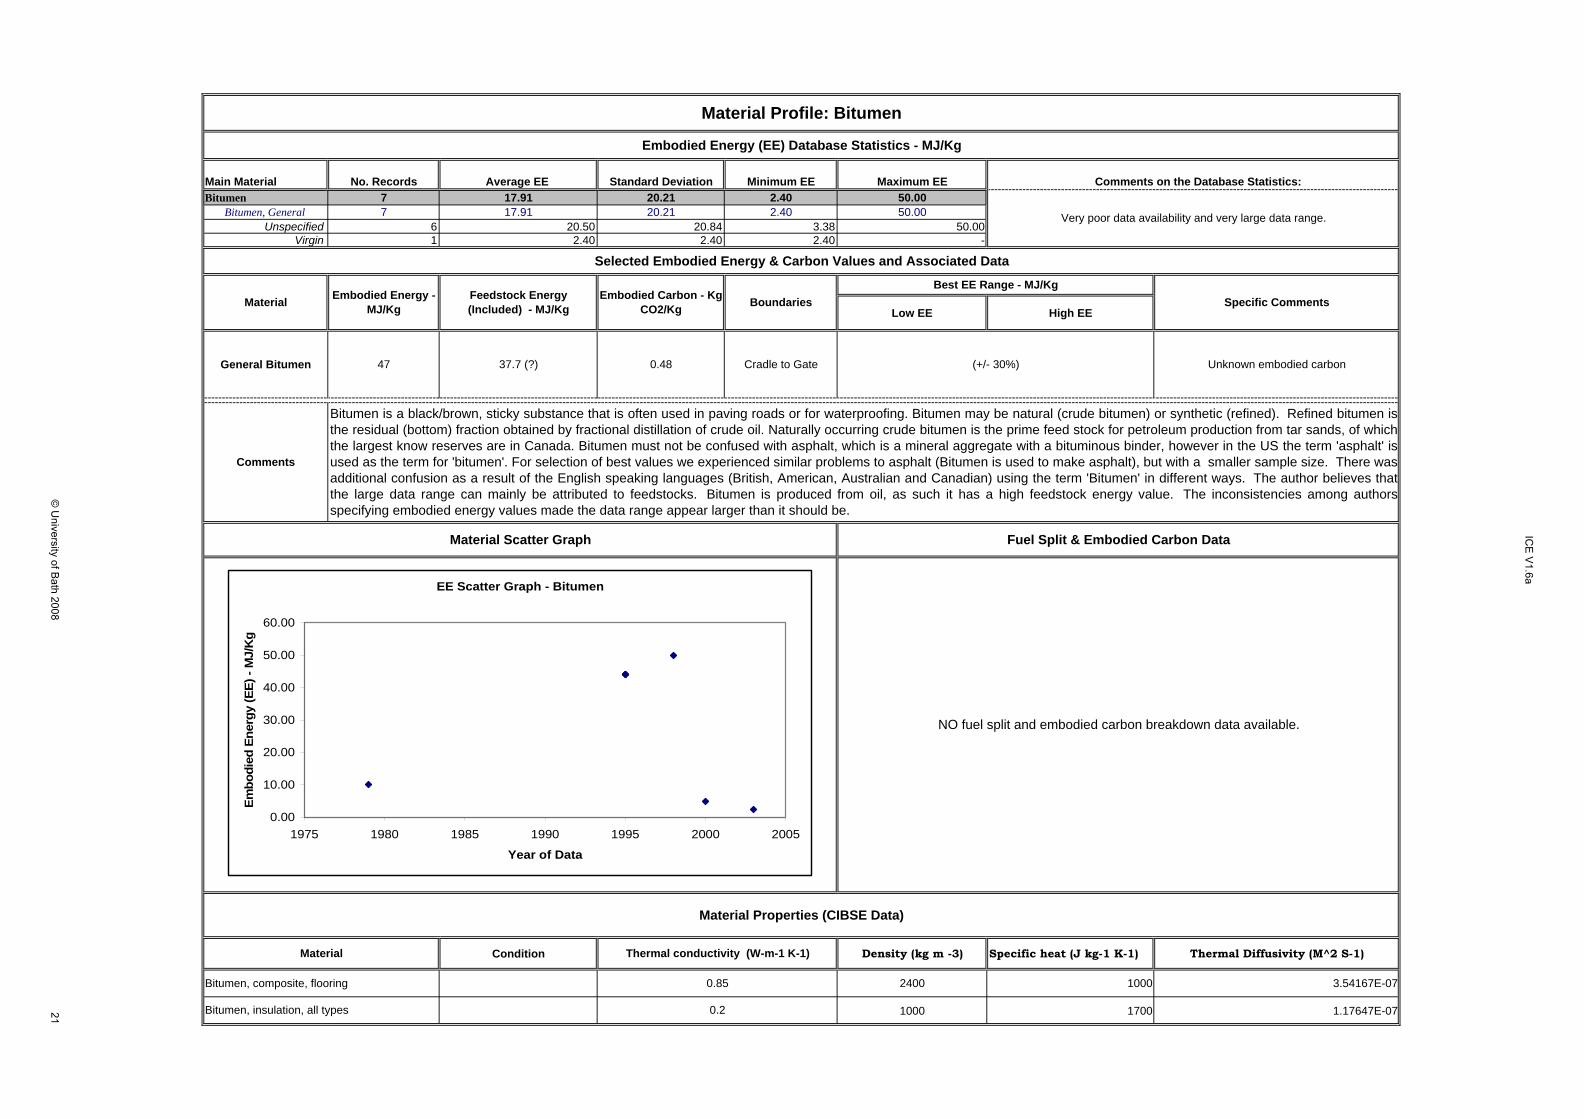
General Bitumen 47 37.7 (?) 0.48 Cradle to Gate Unknown embodied carbon
Condition Density (kg m -3) Specific heat (J kg-1 K-1) Thermal Diffusivity (M^2 S-1)
2400 1000 3.54167E-07
1000 1700 1.17647E-07
Material Profile: Bitumen
Embodied Energy (EE) Database Statistics - MJ/Kg
Comments on the Database Statistics:
Very poor data availability and very large data range.
Bitumen, insulation, all types
0.85
0.2
Material Properties (CIBSE Data)
Material
Bitumen, composite, flooring
(+/- 30%)
Thermal conductivity (W-m-1 K-1)
Selected Embodied Energy & Carbon Values and Associated Data
Material Embodied Energy - MJ/Kg
Feedstock Energy (Included) - MJ/Kg
Embodied Carbon - Kg CO2/Kg Boundaries
Best EE Range - MJ/KgSpecific Comments
NO fuel split and embodied carbon breakdown data available.
Comments
Bitumen is a black/brown, sticky substance that is often used in paving roads or for waterproofing. Bitumen may be natural (crude bitumen) or synthetic (refined). Refined bitumen isthe residual (bottom) fraction obtained by fractional distillation of crude oil. Naturally occurring crude bitumen is the prime feed stock for petroleum production from tar sands, of whichthe largest know reserves are in Canada. Bitumen must not be confused with asphalt, which is a mineral aggregate with a bituminous binder, however in the US the term 'asphalt' isused as the term for 'bitumen'. For selection of best values we experienced similar problems to asphalt (Bitumen is used to make asphalt), but with a smaller sample size. There wasadditional confusion as a result of the English speaking languages (British, American, Australian and Canadian) using the term 'Bitumen' in different ways. The author believes thatthe large data range can mainly be attributed to feedstocks. Bitumen is produced from oil, as such it has a high feedstock energy value. The inconsistencies among authorsspecifying embodied energy values made the data range appear larger than it should be.
Material Scatter Graph Fuel Split & Embodied Carbon Data
Condition Thermal conductivity (W-m-1 K-1) Density (kg m -3) Specific heat (J kg-1 K-1) Thermal Diffusivity (M^2 S-1)
110 8500 390 3.31825E-05
Fuel Split & Embodied Carbon Comments:
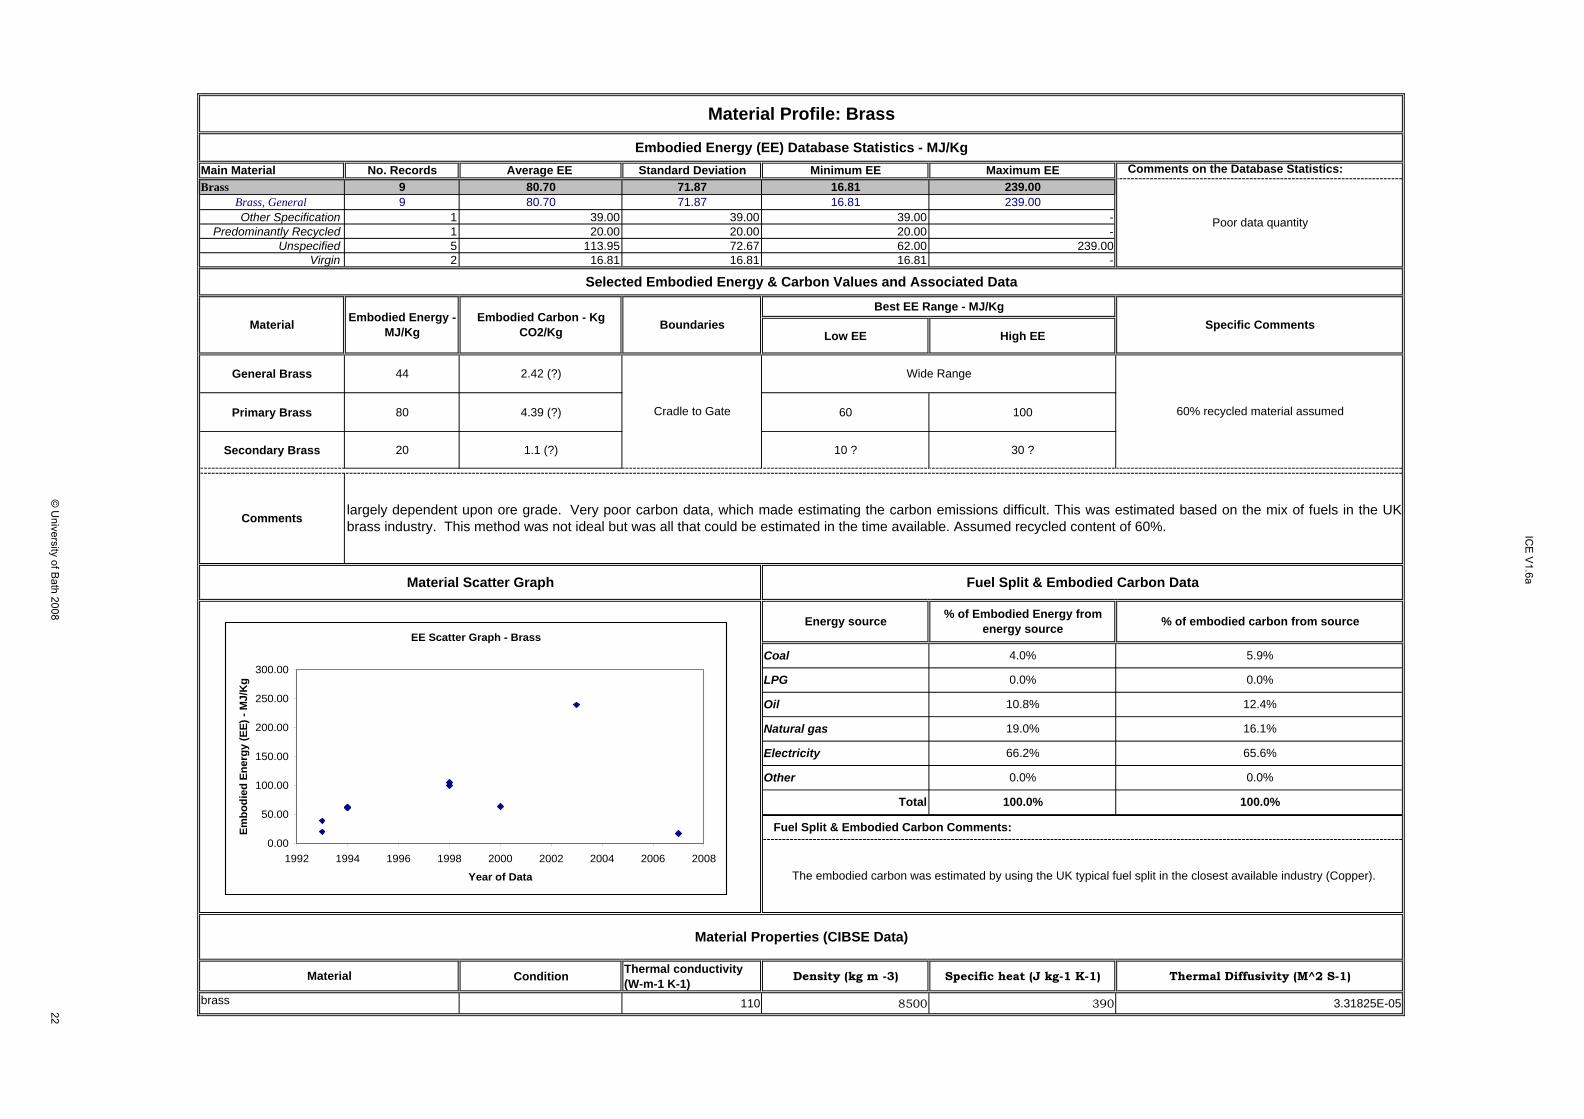
The embodied carbon was estimated by using the UK typical fuel split in the closest available industry (Copper).
Other 0.0% 0.0%
Total 100.0% 100.0%
Natural gas 19.0% 16.1%
Electricity 66.2% 65.6%
10.8% 12.4%
Cradle to Gate
Wide Range
4.0% 5.9%
LPG 0.0% 0.0%
60% recycled material assumed
Energy source % of Embodied Energy from energy source % of embodied carbon from source
Material BoundariesEmbodied Energy - MJ/Kg
Embodied Carbon - Kg CO2/Kg
Best EE Range - MJ/KgSpecific Comments
Material Profile: Brass
Embodied Energy (EE) Database Statistics - MJ/Kg
Poor data quantity
Selected Embodied Energy & Carbon Values and Associated Data
Material
brass
Comments largely dependent upon ore grade. Very poor carbon data, which made estimating the carbon emissions difficult. This was estimated based on the mix of fuels in the UKbrass industry. This method was not ideal but was all that could be estimated in the time available. Assumed recycled content of 60%.
Material Scatter Graph Fuel Split & Embodied Carbon Data
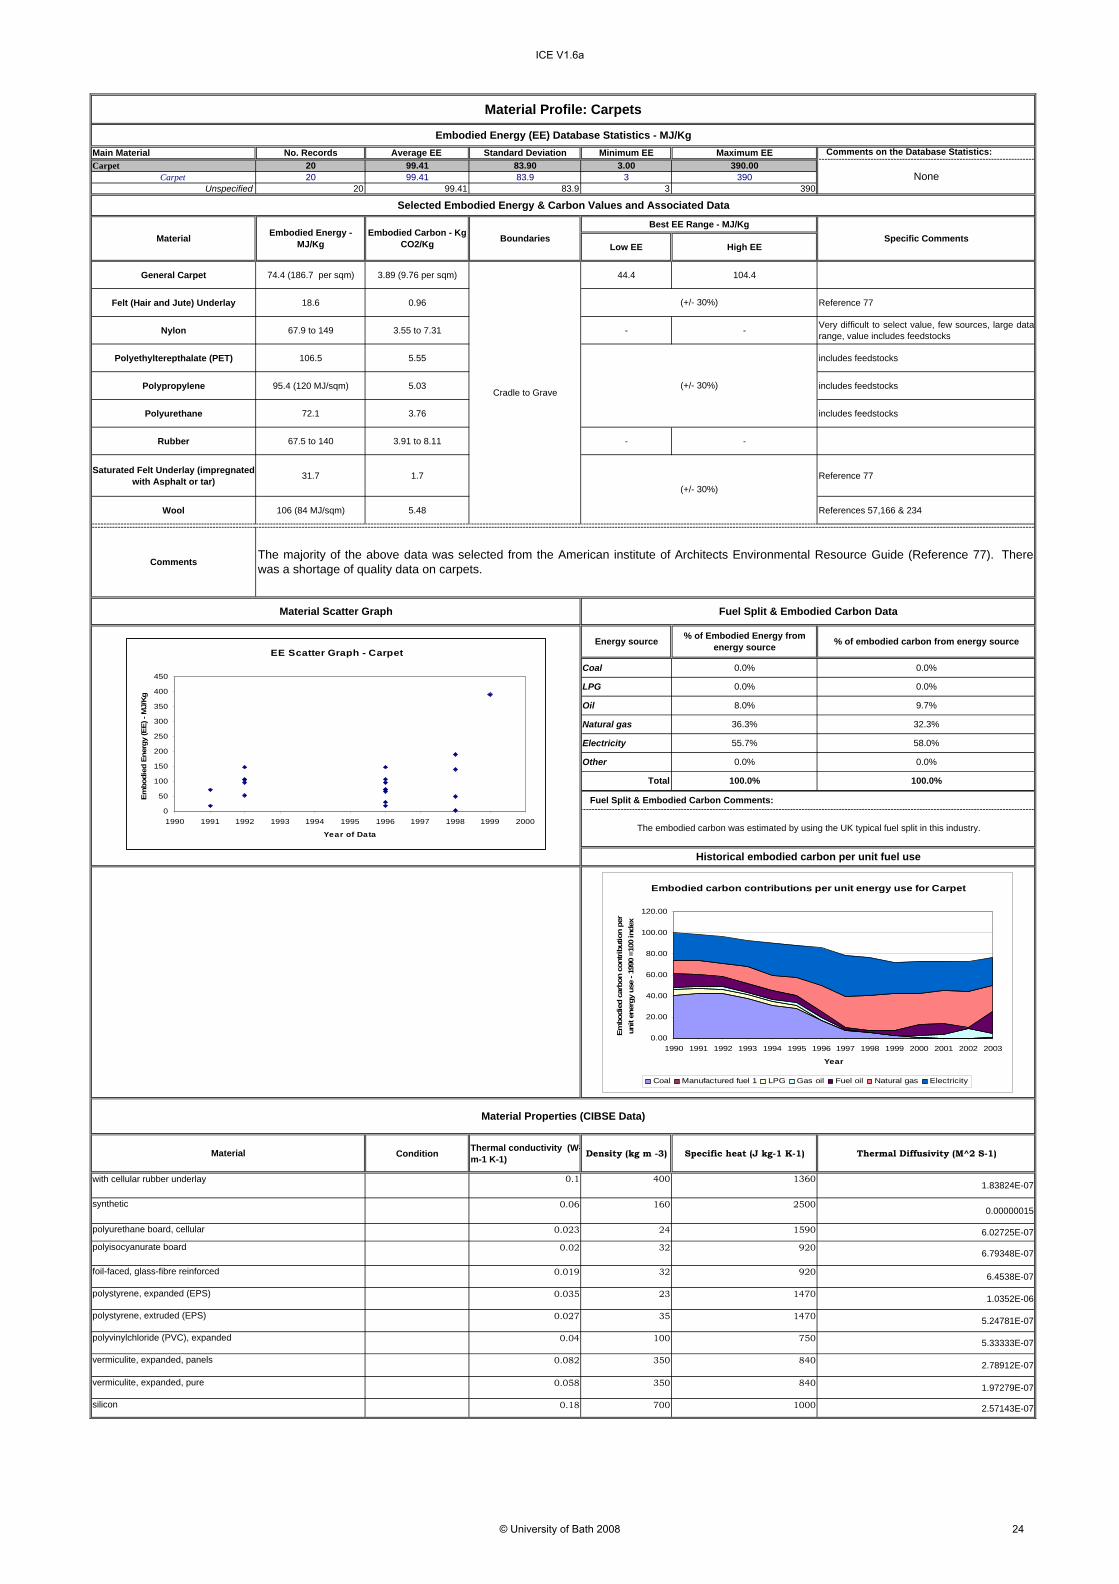
General Carpet 74.4 (186.7 per sqm) 3.89 (9.76 per sqm) 44.4 104.4
Felt (Hair and Jute) Underlay 18.6 0.96 Reference 77
Nylon 67.9 to 149 3.55 to 7.31 - - Very difficult to select value, few sources, large datarange, value includes feedstocks
Polyethylterepthalate (PET) 106.5 5.55 includes feedstocks
Polypropylene 95.4 (120 MJ/sqm) 5.03 includes feedstocks
Polyurethane 72.1 3.76 includes feedstocks
Rubber 67.5 to 140 3.91 to 8.11 - -
Saturated Felt Underlay (impregnated with Asphalt or tar) 31.7 1.7 Reference 77
Wool 106 (84 MJ/sqm) 5.48 References 57,166 & 234
Condition Thermal conductivity (W-m-1 K-1) Density (kg m -3) Specific heat (J kg-1 K-1) Thermal Diffusivity (M^2 S-1)
0.1 400 13601.83824E-07
0.06 160 25000.00000015
0.023 24 1590 6.02725E-070.02 32 920 6.79348E-07
0.019 32 920 6.4538E-07
0.035 23 1470 1.0352E-06
0.027 35 1470 5.24781E-07
0.04 100 750 5.33333E-07
0.082 350 840 2.78912E-07
0.058 350 840 1.97279E-07
0.18 700 1000 2.57143E-07
vermiculite, expanded, panels
The embodied carbon was estimated by using the UK typical fuel split in this industry.
Material Properties (CIBSE Data)
Material
100.0% 100.0%
Comments
Coal
Oil
LPG 0.0% 0.0%
9.7%
Energy source
The majority of the above data was selected from the American institute of Architects Environmental Resource Guide (Reference 77). Therewas a shortage of quality data on carpets.
0.0% 0.0%
(+/- 30%)
Fuel Split & Embodied Carbon Data
Cradle to Grave
Material Scatter Graph
(+/- 30%)
(+/- 30%)
silicon
with cellular rubber underlay
synthetic
polyurethane board, cellular
polyisocyanurate board
foil-faced, glass-fibre reinforced
polystyrene, expanded (EPS)
polystyrene, extruded (EPS)
vermiculite, expanded, pure
polyvinylchloride (PVC), expanded
Best EE Range - MJ/Kg
Material Profile: Carpets
Embodied Energy (EE) Database Statistics - MJ/Kg
None
Selected Embodied Energy & Carbon Values and Associated Data
Embodied Energy - MJ/KgMaterial Embodied Carbon - Kg
CO2/Kg Boundaries Specific Comments
8.0%
Historical embodied carbon per unit fuel use
Total
36.3%
Fuel Split & Embodied Carbon Comments:
Other
32.3%
% of Embodied Energy from energy source % of embodied carbon from energy source
Natural gas
0.0% 0.0%
Electricity 55.7% 58.0%
Embodied carbon contributions per unit energy use for Carpet
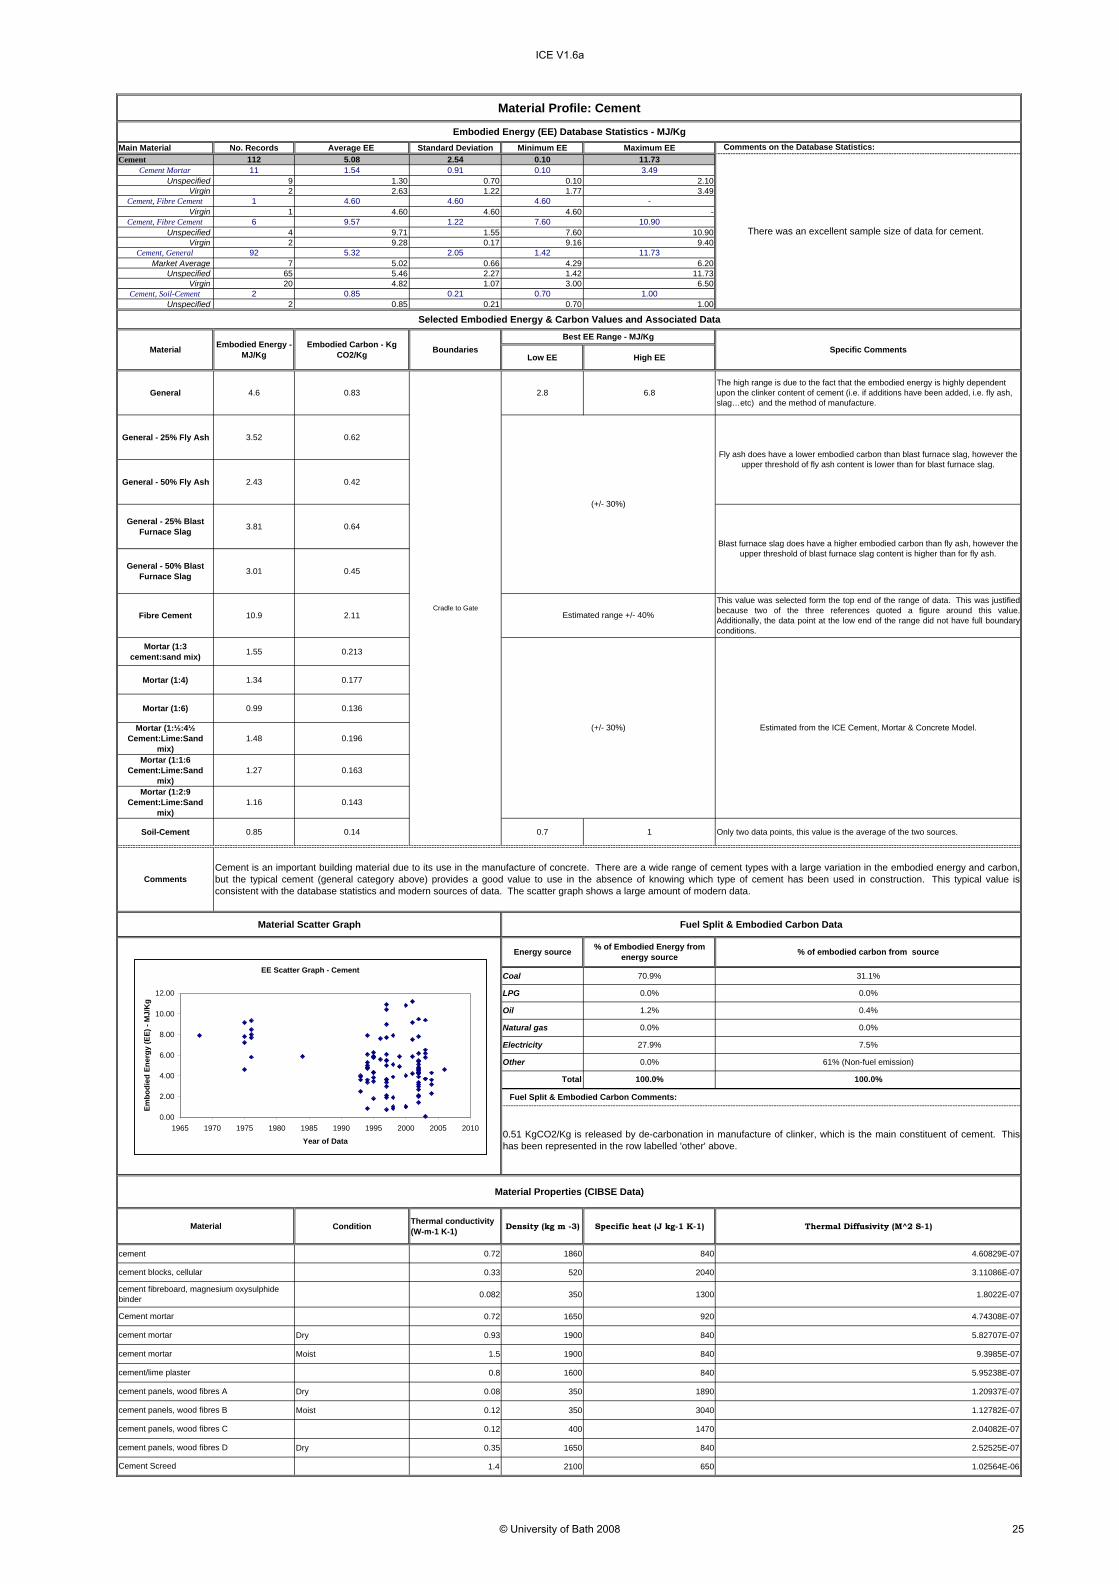
General 4.6 0.83 2.8 6.8The high range is due to the fact that the embodied energy is highly dependent upon the clinker content of cement (i.e. if additions have been added, i.e. fly ash, slag…etc) and the method of manufacture.
General - 25% Fly Ash 3.52 0.62
General - 50% Fly Ash 2.43 0.42
General - 25% Blast Furnace Slag 3.81 0.64
General - 50% Blast Furnace Slag 3.01 0.45
Fibre Cement 10.9 2.11
This value was selected form the top end of the range of data. This was justifiedbecause two of the three references quoted a figure around this value.Additionally, the data point at the low end of the range did not have full boundaryconditions.
Mortar (1:3 cement:sand mix) 1.55 0.213
Mortar (1:4) 1.34 0.177
Mortar (1:6) 0.99 0.136
Mortar (1:½:4½ Cement:Lime:Sand
mix)1.48 0.196
Mortar (1:1:6 Cement:Lime:Sand
mix)1.27 0.163
Mortar (1:2:9 Cement:Lime:Sand
mix)1.16 0.143
Soil-Cement 0.85 0.14 0.7 1 Only two data points, this value is the average of the two sources.
Condition Thermal conductivity (W-m-1 K-1) Density (kg m -3) Specific heat (J kg-1 K-1) Thermal Diffusivity (M^2 S-1)
0.72 1860 840 4.60829E-07
0.33 520 2040 3.11086E-07
0.082 350 1300 1.8022E-07
0.72 1650 920 4.74308E-07
Dry 0.93 1900 840 5.82707E-07
Moist 1.5 1900 840 9.3985E-07
0.8 1600 840 5.95238E-07
Dry 0.08 350 1890 1.20937E-07
Moist 0.12 350 3040 1.12782E-07
0.12 400 1470 2.04082E-07
Dry 0.35 1650 840 2.52525E-07
1.4 2100 650 1.02564E-06
Cradle to Gate
Estimated from the ICE Cement, Mortar & Concrete Model.
cement mortar
cement mortar
Material Properties (CIBSE Data)
Material
CommentsCement is an important building material due to its use in the manufacture of concrete. There are a wide range of cement types with a large variation in the embodied energy and carbon,but the typical cement (general category above) provides a good value to use in the absence of knowing which type of cement has been used in construction. This typical value isconsistent with the database statistics and modern sources of data. The scatter graph shows a large amount of modern data.
Material Scatter Graph Fuel Split & Embodied Carbon Data
cement panels, wood fibres D
Cement Screed
cement panels, wood fibres B
cement panels, wood fibres C
Material Profile: Cement
Embodied Energy (EE) Database Statistics - MJ/Kg
Selected Embodied Energy & Carbon Values and Associated Data
There was an excellent sample size of data for cement.
cement/lime plaster
cement panels, wood fibres A
cement
Cement mortar
cement blocks, cellular
cement fibreboard, magnesium oxysulphide binder
Energy source % of Embodied Energy from energy source % of embodied carbon from source
0.0% 0.0%
Coal 70.9% 31.1%
LPG
Best EE Range - MJ/KgSpecific CommentsMaterial Embodied Energy -
MJ/KgEmbodied Carbon - Kg
CO2/Kg Boundaries
Electricity 27.9% 7.5%
1.2% 0.4%Oil
Natural gas 0.0% 0.0%
Other 0.0% 61% (Non-fuel emission)
Fuel Split & Embodied Carbon Comments:
0.51 KgCO2/Kg is released by de-carbonation in manufacture of clinker, which is the main constituent of cement. Thishas been represented in the row labelled 'other' above.
Total 100.0% 100.0%
Fly ash does have a lower embodied carbon than blast furnace slag, however the upper threshold of fly ash content is lower than for blast furnace slag.
Blast furnace slag does have a higher embodied carbon than fly ash, however the upper threshold of blast furnace slag content is higher than for fly ash.
General Ceramics 10 0.65 2.5 29.1 There was an incredible data range, which madeselection of a single value difficult.
Fittings 20 1.05 Reference 1
Refractory products 5.5 0.51
Sanitary Products 29 1.48
Tile 9 0.59 2.5 19.5
Condition Thermal conductivity (W-m-1 K-1) Density (kg m -3) Specific heat (J kg-1 K-
1) Thermal Diffusivity (M^2 S-1)
Dry 1.2 2000 850 7.05882E-07
Dry 0.8 1700 850 5.53633E-07
0.85 1900 840 5.32581E-07
1.3 2000 840 7.7381E-07
0.52 1120 840 5.52721E-07
0.623 1120 840 6.62202E-07
0.693 1120 840 7.36607E-07
1.803 1920 840 1.11793E-06
Material Properties (CIBSE Data)
Material
Ceramic tiles
Coal 0.0% 0.0%
0.0% 0.0%
Natural gas 40.2%
clay tile, pavior
ceramic floor tiles
clay tiles
clay tiles, burnt
clay tile, hollow, 10.2mm. 1 cell
Clay tile, hollow, 20.3mm, 2 cells
Clay tile, hollow, 32.5mm, 3 cells
Oil
21.4%
Electricity 59.8% 49.9%
0.0%
Material Profile: Ceramics
Embodied Energy (EE) Database Statistics - MJ/Kg
None
Selected Embodied Energy & Carbon Values and Associated Data
Material Embodied Energy - MJ/Kg
Embodied Carbon - Kg CO2/Kg Boundaries
Best EE Range - MJ/Kg
28.7%
LPG 0.0% 0.0%
Specific Comments
Comments The scatter graph displays a large data range, which made selection of a best value difficult. The large range may be attributed to different types of ceramicproducts.
Cradle to Gate
The embodied carbon was estimated by using the UK typical fuel split in this industry. The fuel split is for general ceramics.
Historical embodied carbon per unit fuel use
Fuel Split & Embodied Carbon Comments:
Estimated Range (+/- 30%)
Material Scatter Graph Fuel Split & Embodied Carbon Data
Total 100.0% 100.0%
Energy source % of Embodied Energy from energy source % of embodied carbon from energy source
Other
Embodied carbon contributions per unit energy use for Ceramic tile
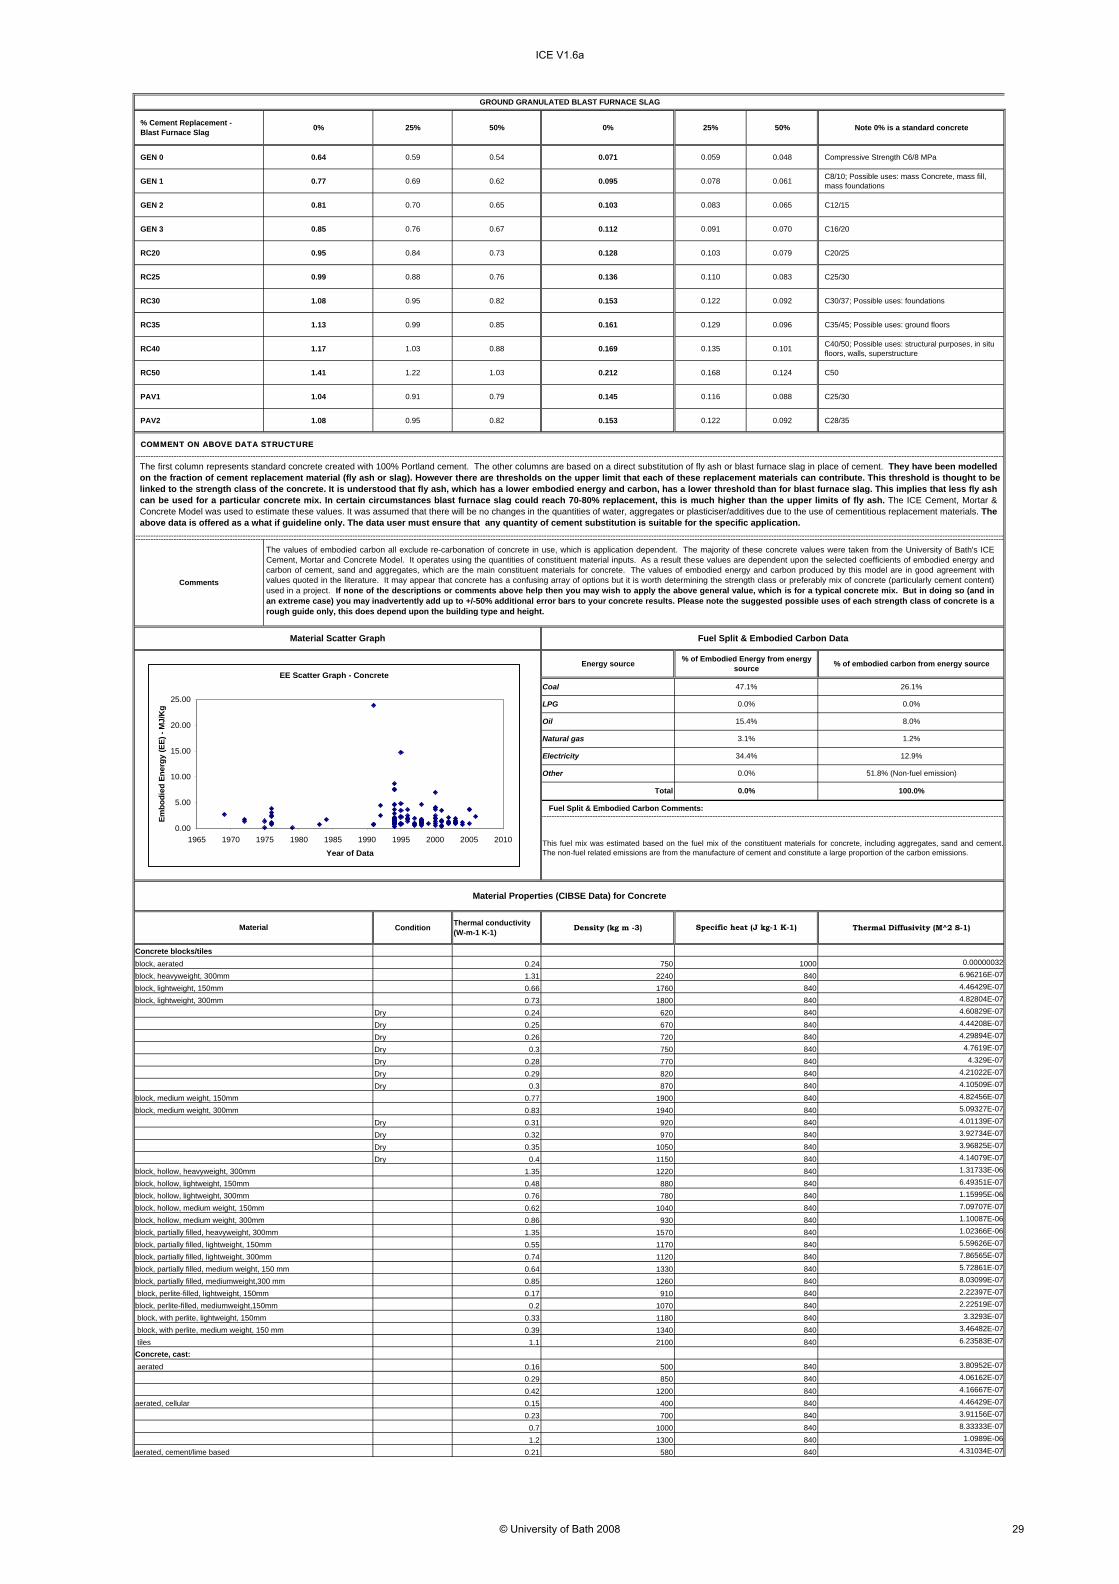
RC40 1.17 1.03 0.88 0.169 0.135 0.101 C40/50; Possible uses: structural purposes, in situ floors, walls, superstructure
RC50 1.41 1.22 1.03 0.212 0.168 0.124 C50
PAV1 1.04 0.91 0.79 0.145 0.116 0.088 C25/30
PAV2 1.08 0.95 0.82 0.153 0.122 0.092 C28/35
Condition Thermal conductivity (W-m-1 K-1) Density (kg m -3) Thermal Diffusivity (M^2 S-1)
0.24 750 0.00000032
1.31 2240 6.96216E-07
0.66 1760 4.46429E-07
0.73 1800 4.82804E-07
Dry 0.24 620 4.60829E-07
Dry 0.25 670 4.44208E-07
Dry 0.26 720 4.29894E-07
Dry 0.3 750 4.7619E-07
Dry 0.28 770 4.329E-07
Dry 0.29 820 4.21022E-07
Dry 0.3 870 4.10509E-07
0.77 1900 4.82456E-07
0.83 1940 5.09327E-07
Dry 0.31 920 4.01139E-07
Dry 0.32 970 3.92734E-07
Dry 0.35 1050 3.96825E-07
Dry 0.4 1150 4.14079E-07
1.35 1220 1.31733E-06
0.48 880 6.49351E-07
0.76 780 1.15995E-06
0.62 1040 7.09707E-07
0.86 930 1.10087E-06
1.35 1570 1.02366E-06
0.55 1170 5.59626E-07
0.74 1120 7.86565E-07
0.64 1330 5.72861E-07
0.85 1260 8.03099E-07
0.17 910 2.22397E-07
0.2 1070 2.22519E-07
0.33 1180 3.3293E-07
0.39 1340 3.46482E-07
1.1 2100 6.23583E-07
0.16 500 3.80952E-07
0.29 850 4.06162E-07
0.42 1200 4.16667E-07
0.15 400 4.46429E-07
0.23 700 3.91156E-07
0.7 1000 8.33333E-07
1.2 1300 1.0989E-06
0.21 580 4.31034E-07
840840840
840840
840840
840
840840
840840840840
840840
840840
840840
840840840840
840840840840
Other
100.0%
840840
Material Properties (CIBSE Data) for Concrete
Material
Total
51.8% (Non-fuel emission)
840840
840
0.0%
0.0%
Specific heat (J kg-1 K-1)
840840840840
Material Scatter Graph Fuel Split & Embodied Carbon Data
Electricity 12.9%
% of Embodied Energy from energy source
47.1%
0.0%
3.1%
34.4%
1.2%
GROUND GRANULATED BLAST FURNACE SLAG
Fuel Split & Embodied Carbon Comments:
This fuel mix was estimated based on the fuel mix of the constituent materials for concrete, including aggregates, sand and cement.The non-fuel related emissions are from the manufacture of cement and constitute a large proportion of the carbon emissions.
block, medium weight, 150mmblock, medium weight, 300mm
block, perlite-filled, lightweight, 150mm
aerated, cellular
block, perlite-filled, mediumweight,150mm
Concrete, cast: tiles block, with perlite, medium weight, 150 mm
aerated
aerated, cement/lime based
COMMENT ON ABOVE DATA STRUCTURE
EE Scatter Graph - Concrete
0.00
5.00
10.00
15.00
20.00
25.00
1965 1970 1975 1980 1985 1990 1995 2000 2005 2010
Year of Data
Embo
died
Ene
rgy
(EE)
- M
J/K
g
The values of embodied carbon all exclude re-carbonation of concrete in use, which is application dependent. The majority of these concrete values were taken from the University of Bath's ICECement, Mortar and Concrete Model. It operates using the quantities of constituent material inputs. As a result these values are dependent upon the selected coefficients of embodied energy andcarbon of cement, sand and aggregates, which are the main constituent materials for concrete. The values of embodied energy and carbon produced by this model are in good agreement withvalues quoted in the literature. It may appear that concrete has a confusing array of options but it is worth determining the strength class or preferably mix of concrete (particularly cement content)used in a project. If none of the descriptions or comments above help then you may wish to apply the above general value, which is for a typical concrete mix. But in doing so (and inan extreme case) you may inadvertently add up to +/-50% additional error bars to your concrete results. Please note the suggested possible uses of each strength class of concrete is arough guide only, this does depend upon the building type and height.
The first column represents standard concrete created with 100% Portland cement. The other columns are based on a direct substitution of fly ash or blast furnace slag in place of cement. They have been modelledon the fraction of cement replacement material (fly ash or slag). However there are thresholds on the upper limit that each of these replacement materials can contribute. This threshold is thought to belinked to the strength class of the concrete. It is understood that fly ash, which has a lower embodied energy and carbon, has a lower threshold than for blast furnace slag. This implies that less fly ashcan be used for a particular concrete mix. In certain circumstances blast furnace slag could reach 70-80% replacement, this is much higher than the upper limits of fly ash. The ICE Cement, Mortar &Concrete Model was used to estimate these values. It was assumed that there will be no changes in the quantities of water, aggregates or plasticiser/additives due to the use of cementitious replacement materials. Theabove data is offered as a what if guideline only. The data user must ensure that any quantity of cement substitution is suitable for the specific application.
Secondary from high grade scrap 17.5 (?) 0.96 (?) 10 25
Condition Thermal conductivity (W-m-1 K-1) Density (kg m -3) Specific heat (J kg-1 K-1) Thermal Diffusivity (M^2 S-1)
384 8600 390 0.00011449
Fuel Split & Embodied Carbon Comments:
The embodied carbon was estimated by using the UK typical fuel split in the copper industry.
Other 0.0% 0.0%
Total 100.0% 100.0%
Natural gas 19.0% 16.1%
Electricity 66.2% 65.6%
LPG 0.0% 0.0%
Oil 10.8% 12.4%
Comments
Material Embodied Energy - MJ/Kg
Best EE Range - MJ/Kg
Material Profile: Copper
Embodied Energy (EE) Database Statistics - MJ/Kg
None
Selected Embodied Energy & Carbon Values and Associated Data
The embodied energy of copper displays a very large data range. This is possibly due to variations in the grade of copper ore and copper scrap. There was poor data on thetypical embodied carbon of copper, consequentially the embodied carbon data is uncertain.
Coal 4.0% 5.9%
Energy source % of Embodied Energy from energy source % of embodied carbon from source
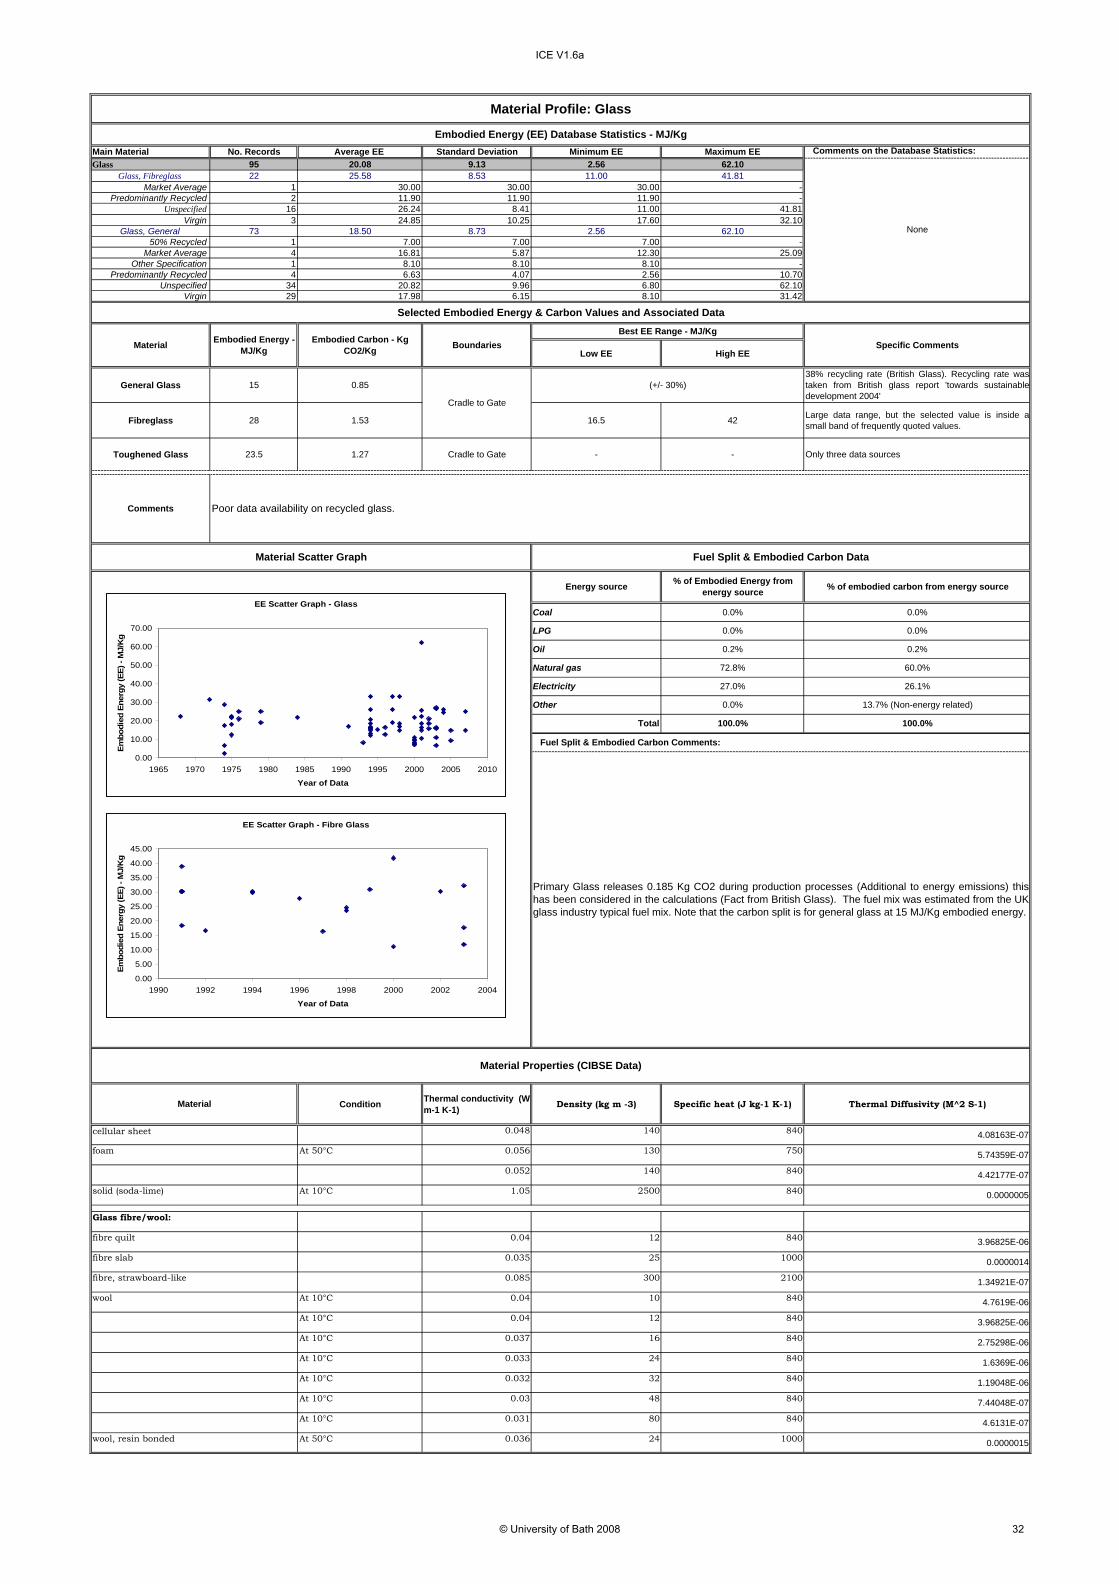
General Glass 15 0.8538% recycling rate (British Glass). Recycling rate wastaken from British glass report 'towards sustainabledevelopment 2004'
Fibreglass 28 1.53 16.5 42 Large data range, but the selected value is inside asmall band of frequently quoted values.
Toughened Glass 23.5 1.27 Cradle to Gate - - Only three data sources
Condition Thermal conductivity (W-m-1 K-1) Density (kg m -3) Specific heat (J kg-1 K-1) Thermal Diffusivity (M^2 S-1)
0.048 140 840 4.08163E-07
At 50°C 0.056 130 750 5.74359E-07
0.052 140 840 4.42177E-07
At 10°C 1.05 2500 840 0.0000005
0.04 12 840 3.96825E-06
0.035 25 1000 0.0000014
0.085 300 2100 1.34921E-07
At 10°C 0.04 10 840 4.7619E-06
At 10°C 0.04 12 840 3.96825E-06
At 10°C 0.037 16 840 2.75298E-06
At 10°C 0.033 24 840 1.6369E-06
At 10°C 0.032 32 840 1.19048E-06
At 10°C 0.03 48 840 7.44048E-07
At 10°C 0.031 80 840 4.6131E-07
At 50°C 0.036 24 1000 0.0000015
foam
Material
wool, resin bonded
fibre, strawboard-like
wool
% of embodied carbon from energy source
26.1%
Natural gas
fibre slab
cellular sheet
Glass fibre/wool:
fibre quilt
solid (soda-lime)
Material Properties (CIBSE Data)
Cradle to Gate
Material Embodied Energy - MJ/Kg
Embodied Carbon - Kg CO2/Kg Boundaries
Best EE Range - MJ/Kg
(+/- 30%)
Electricity 27.0%
Material Profile: Glass
Embodied Energy (EE) Database Statistics - MJ/Kg
None
Selected Embodied Energy & Carbon Values and Associated Data
Specific Comments
Comments Poor data availability on recycled glass.
% of Embodied Energy from energy source
Material Scatter Graph Fuel Split & Embodied Carbon Data
Energy source
0.0%
LPG
72.8% 60.0%
0.0% 0.0%
Coal
Oil 0.2% 0.2%
0.0%
Fuel Split & Embodied Carbon Comments:
Primary Glass releases 0.185 Kg CO2 during production processes (Additional to energy emissions) thishas been considered in the calculations (Fact from British Glass). The fuel mix was estimated from the UKglass industry typical fuel mix. Note that the carbon split is for general glass at 15 MJ/Kg embodied energy.
0.032fibre blanket, metal 0.038reinforced 0.046fibre board, preformed 0.042
0.054urea formaldehyde resin
Mineral fibre/wool:
polyisocyanate 0.03polyurethane
0.035
0.036
0.035
urea formaldehyde 0.04
polyvinylchloride
polyurethane, freon-filled 0.03
fibre blanket, bonded 0.042
0.04
0.028
Comments
Embodied energy and carbon data for insulation materials was relatively poor. This may be a result of the fact that insulation materials save energy and will almost alwayspayback the embodied energy during the lifetime of the insulation. But by comparing the embodied energy of insulation materials and considering U-values energy &carbon savings could still be made. It is important to consider space constraints in an embodied energy and carbon analysis of insulation. It there is only a fixed space, say50mm, available then U-Value must be considered alongside embodied energy and carbon.
Unknown fuel split, embodied carbon was estimated from the data available in the database
Material Scatter Graph Fuel Split & Embodied Carbon Data
phenol, rigid
phenol
See Plastics for a range of polystyrene data
Foam:
See Plastics for a range of polyurethane data
(+/- 40%)Cradle to Gate
Material Properties (CIBSE Data) for Insulation
Material Thermal conductivity (W-m-1 K-1)
(+/- 40%)
Feedstock Energy
(Included) - MJ/Kg
Best EE Range - MJ/Kg
Material Embodied Energy - MJ/Kg
Embodied Carbon - Kg CO2/Kg Boundaries Specific Comments
Material Profile: Insulation
Embodied Energy (EE) Database Statistics - MJ/Kg
None
Selected Embodied Energy & Carbon Values and Associated Data
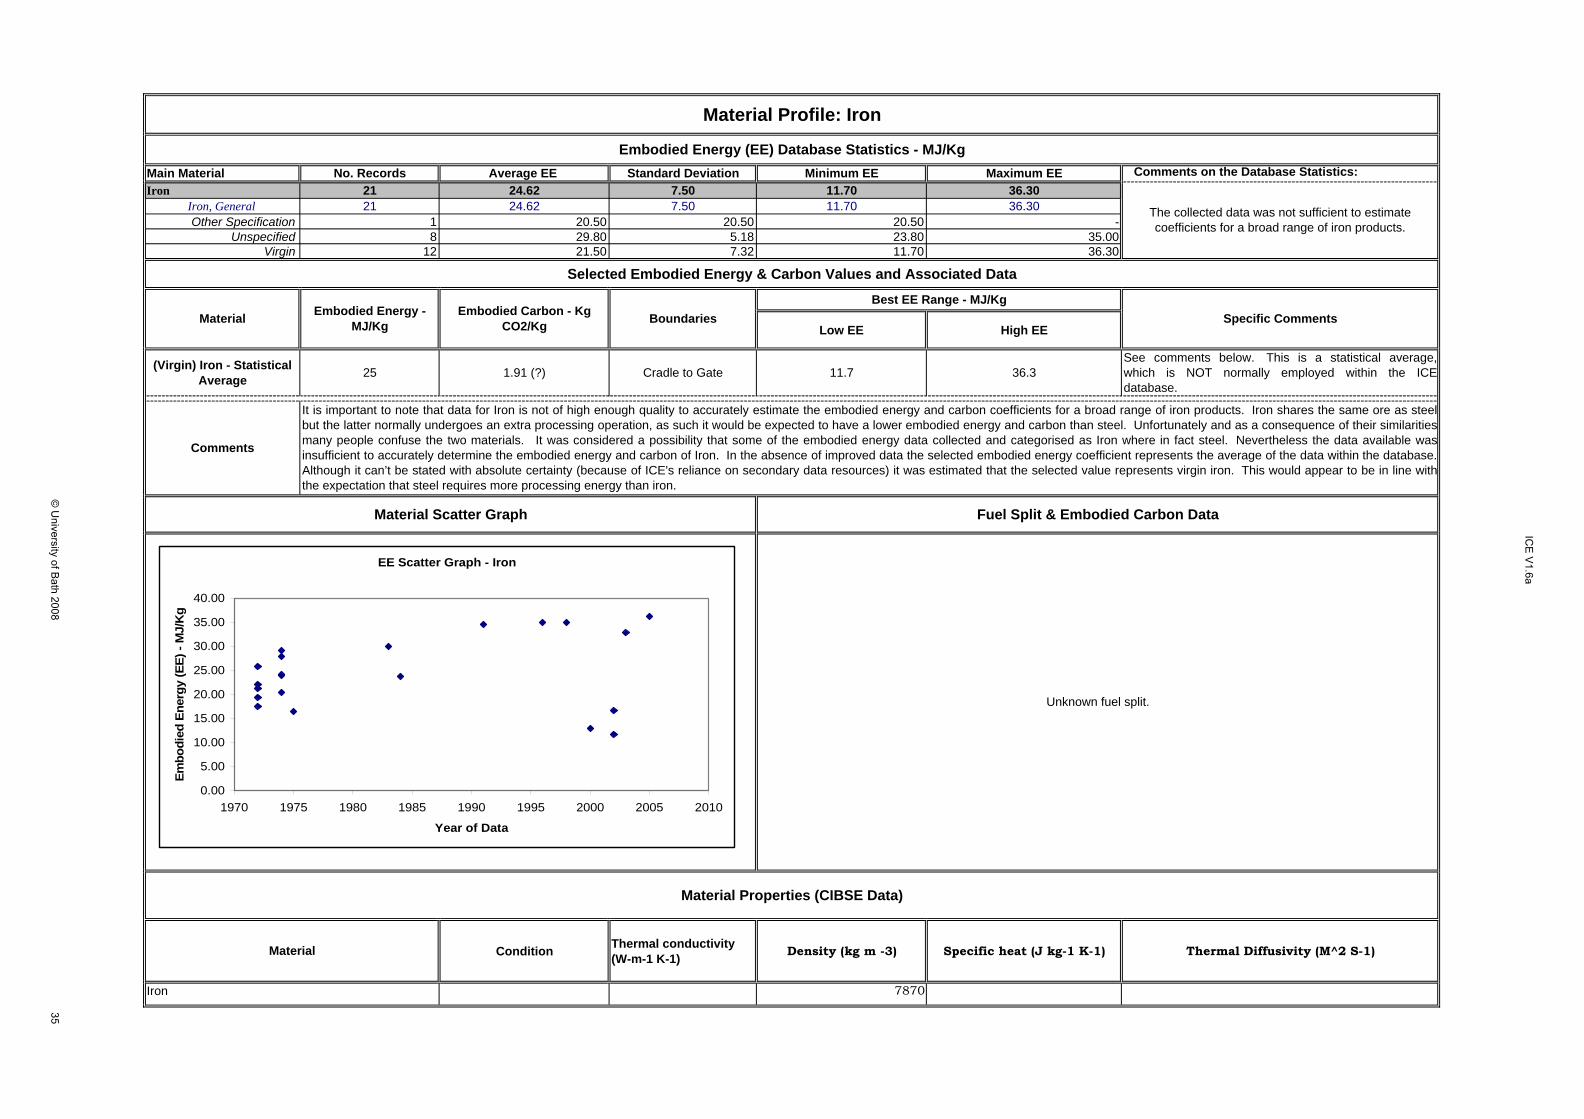
(Virgin) Iron - Statistical Average 25 1.91 (?) Cradle to Gate 11.7 36.3
See comments below. This is a statistical average,which is NOT normally employed within the ICEdatabase.
Condition Thermal conductivity (W-m-1 K-1) Density (kg m -3) Specific heat (J kg-1 K-1) Thermal Diffusivity (M^2 S-1)
7870
Material Profile: Iron
Embodied Energy (EE) Database Statistics - MJ/Kg
The collected data was not sufficient to estimate coefficients for a broad range of iron products.
Selected Embodied Energy & Carbon Values and Associated Data
Best EE Range - MJ/KgSpecific CommentsMaterial Embodied Energy -
MJ/KgEmbodied Carbon - Kg
CO2/Kg Boundaries
Comments
It is important to note that data for Iron is not of high enough quality to accurately estimate the embodied energy and carbon coefficients for a broad range of iron products. Iron shares the same ore as steelbut the latter normally undergoes an extra processing operation, as such it would be expected to have a lower embodied energy and carbon than steel. Unfortunately and as a consequence of their similaritiesmany people confuse the two materials. It was considered a possibility that some of the embodied energy data collected and categorised as Iron where in fact steel. Nevertheless the data available wasinsufficient to accurately determine the embodied energy and carbon of Iron. In the absence of improved data the selected embodied energy coefficient represents the average of the data within the database.Although it can’t be stated with absolute certainty (because of ICE's reliance on secondary data resources) it was estimated that the selected value represents virgin iron. This would appear to be in line withthe expectation that steel requires more processing energy than iron.
Material Scatter Graph Fuel Split & Embodied Carbon Data
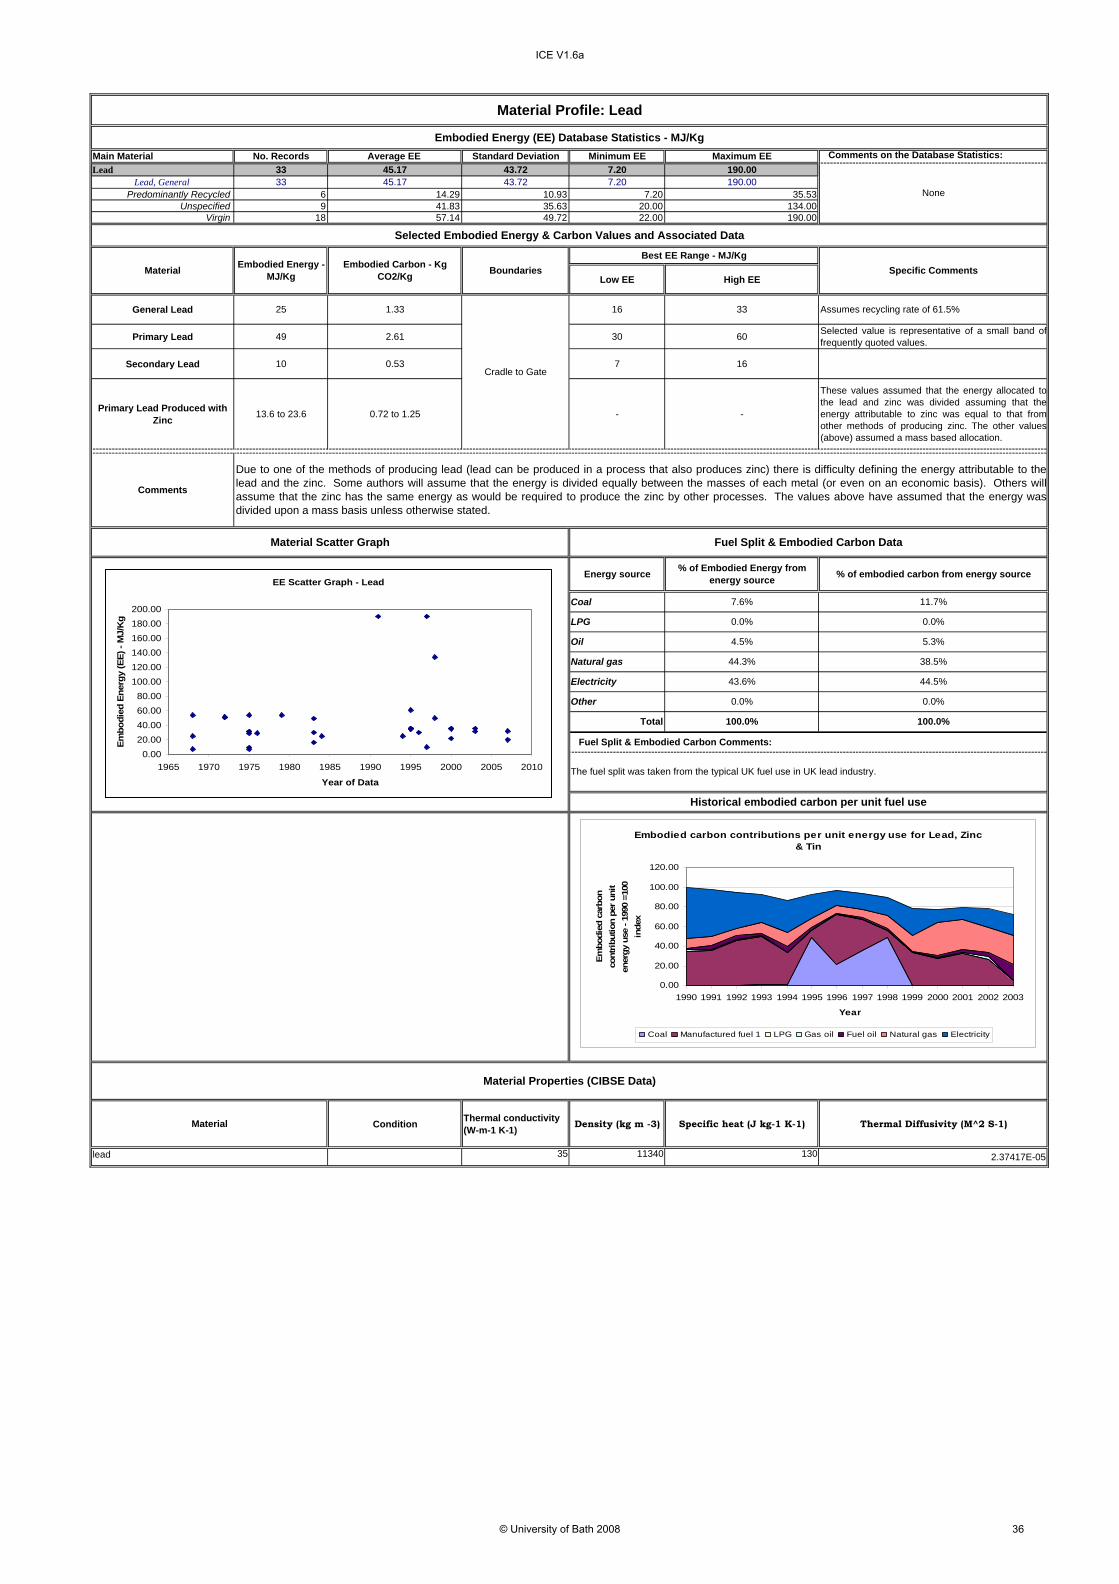
General Lead 25 1.33 16 33 Assumes recycling rate of 61.5%
Primary Lead 49 2.61 30 60 Selected value is representative of a small band offrequently quoted values.
Secondary Lead 10 0.53 7 16
Primary Lead Produced with Zinc 13.6 to 23.6 0.72 to 1.25 - -
These values assumed that the energy allocated tothe lead and zinc was divided assuming that theenergy attributable to zinc was equal to that fromother methods of producing zinc. The other values(above) assumed a mass based allocation.
Condition Thermal conductivity (W-m-1 K-1) Density (kg m -3) Specific heat (J kg-1 K-1) Thermal Diffusivity (M^2 S-1)
35 11340 130 2.37417E-05
44.5%
Fuel Split & Embodied Carbon Comments:
0.0% 0.0%
Total 100.0% 100.0%
Natural gas 44.3%
LPG
lead
Material Properties (CIBSE Data)
Material
Electricity 43.6%
38.5%
Other
The fuel split was taken from the typical UK fuel use in UK lead industry.
Historical embodied carbon per unit fuel use
% of embodied carbon from energy source
Oil 4.5% 5.3%
11.7%
Comments
Due to one of the methods of producing lead (lead can be produced in a process that also produces zinc) there is difficulty defining the energy attributable to thelead and the zinc. Some authors will assume that the energy is divided equally between the masses of each metal (or even on an economic basis). Others willassume that the zinc has the same energy as would be required to produce the zinc by other processes. The values above have assumed that the energy wasdivided upon a mass basis unless otherwise stated.
0.0% 0.0%
Coal 7.6%
Material Scatter Graph Fuel Split & Embodied Carbon Data
Energy source % of Embodied Energy from energy source
Material Profile: Lead
Embodied Energy (EE) Database Statistics - MJ/Kg
None
Selected Embodied Energy & Carbon Values and Associated Data
Specific Comments
Cradle to Gate
Material Embodied Energy - MJ/Kg
Embodied Carbon - Kg CO2/Kg Boundaries
Best EE Range - MJ/Kg
Embodied carbon contributions per unit energy use for Lead, Zinc & Tin
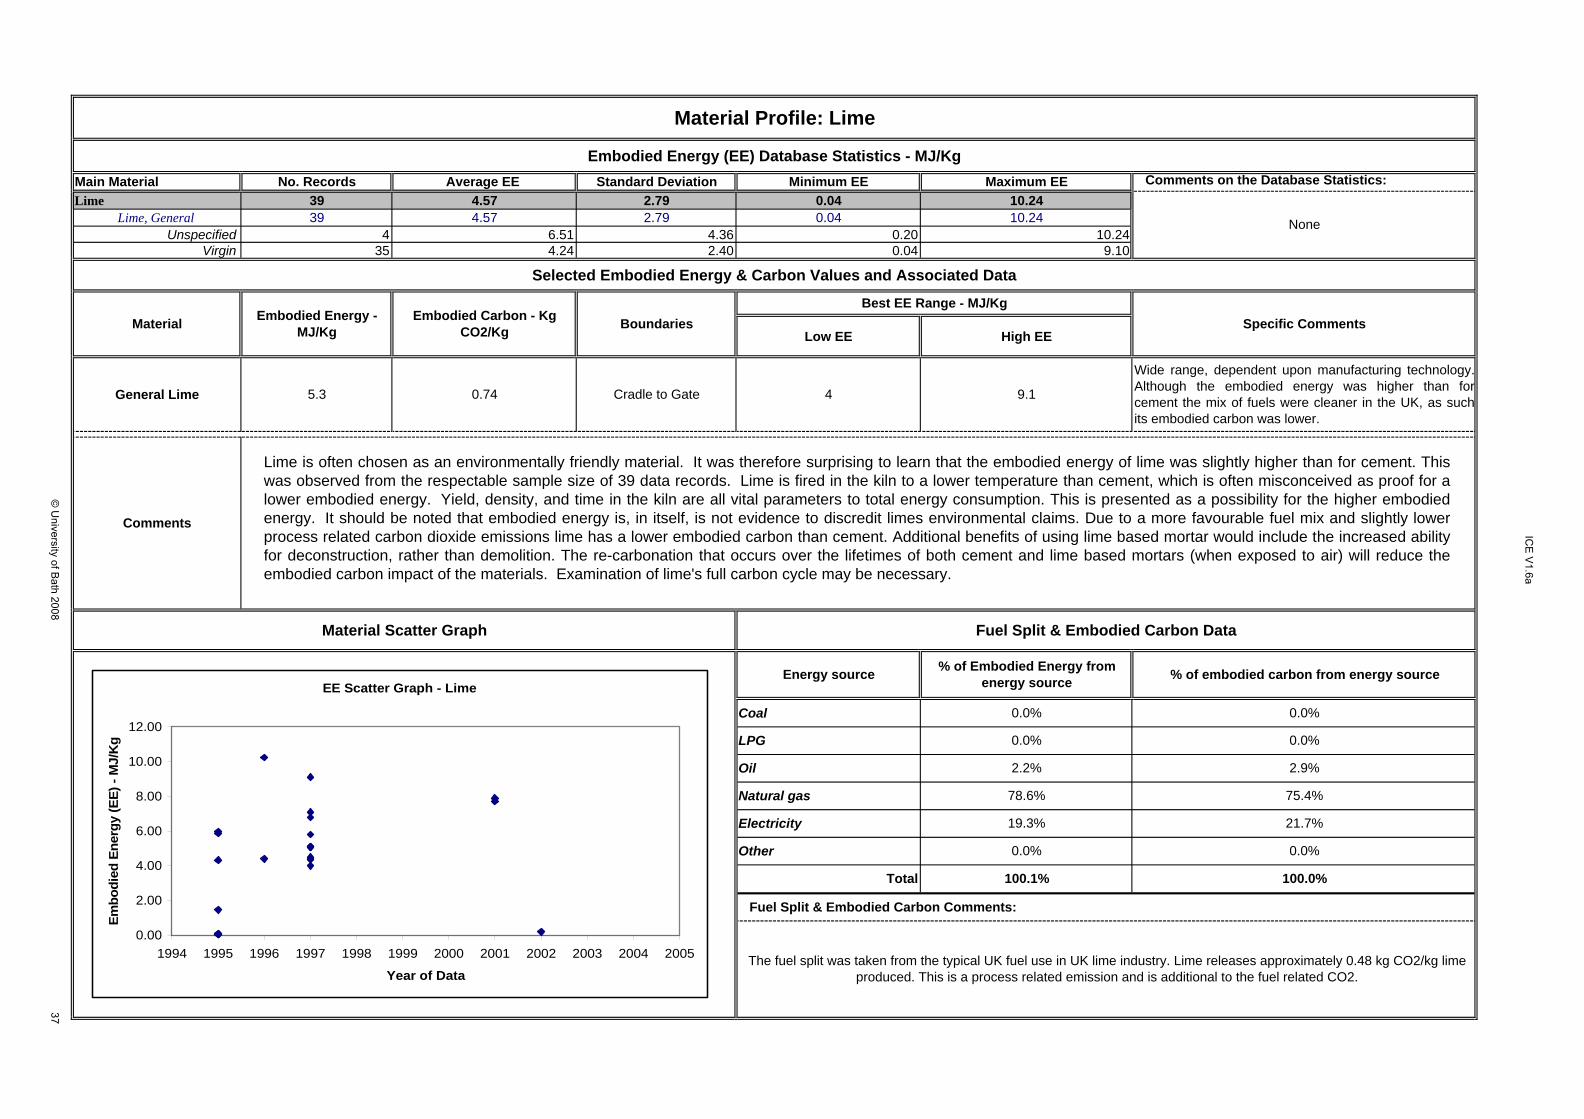
Wide range, dependent upon manufacturing technology.Although the embodied energy was higher than forcement the mix of fuels were cleaner in the UK, as suchits embodied carbon was lower.
Fuel Split & Embodied Carbon Comments:
The fuel split was taken from the typical UK fuel use in UK lime industry. Lime releases approximately 0.48 kg CO2/kg lime produced. This is a process related emission and is additional to the fuel related CO2.
Other 0.0% 0.0%
Total 100.1% 100.0%
Natural gas 78.6% 75.4%
Electricity 19.3% 21.7%
LPG 0.0% 0.0%
Oil 2.2% 2.9%
Energy source % of Embodied Energy from energy source % of embodied carbon from energy source
Coal 0.0% 0.0%
Boundaries
Material Profile: Lime
Embodied Energy (EE) Database Statistics - MJ/Kg
None
Selected Embodied Energy & Carbon Values and Associated Data
Best EE Range - MJ/KgSpecific CommentsMaterial Embodied Energy -
MJ/Kg
Comments
Material Scatter Graph Fuel Split & Embodied Carbon Data
Lime is often chosen as an environmentally friendly material. It was therefore surprising to learn that the embodied energy of lime was slightly higher than for cement. Thiswas observed from the respectable sample size of 39 data records. Lime is fired in the kiln to a lower temperature than cement, which is often misconceived as proof for alower embodied energy. Yield, density, and time in the kiln are all vital parameters to total energy consumption. This is presented as a possibility for the higher embodiedenergy. It should be noted that embodied energy is, in itself, is not evidence to discredit limes environmental claims. Due to a more favourable fuel mix and slightly lowerprocess related carbon dioxide emissions lime has a lower embodied carbon than cement. Additional benefits of using lime based mortar would include the increased abilityfor deconstruction, rather than demolition. The re-carbonation that occurs over the lifetimes of both cement and lime based mortars (when exposed to air) will reduce theembodied carbon impact of the materials. Examination of lime's full carbon cycle may be necessary.
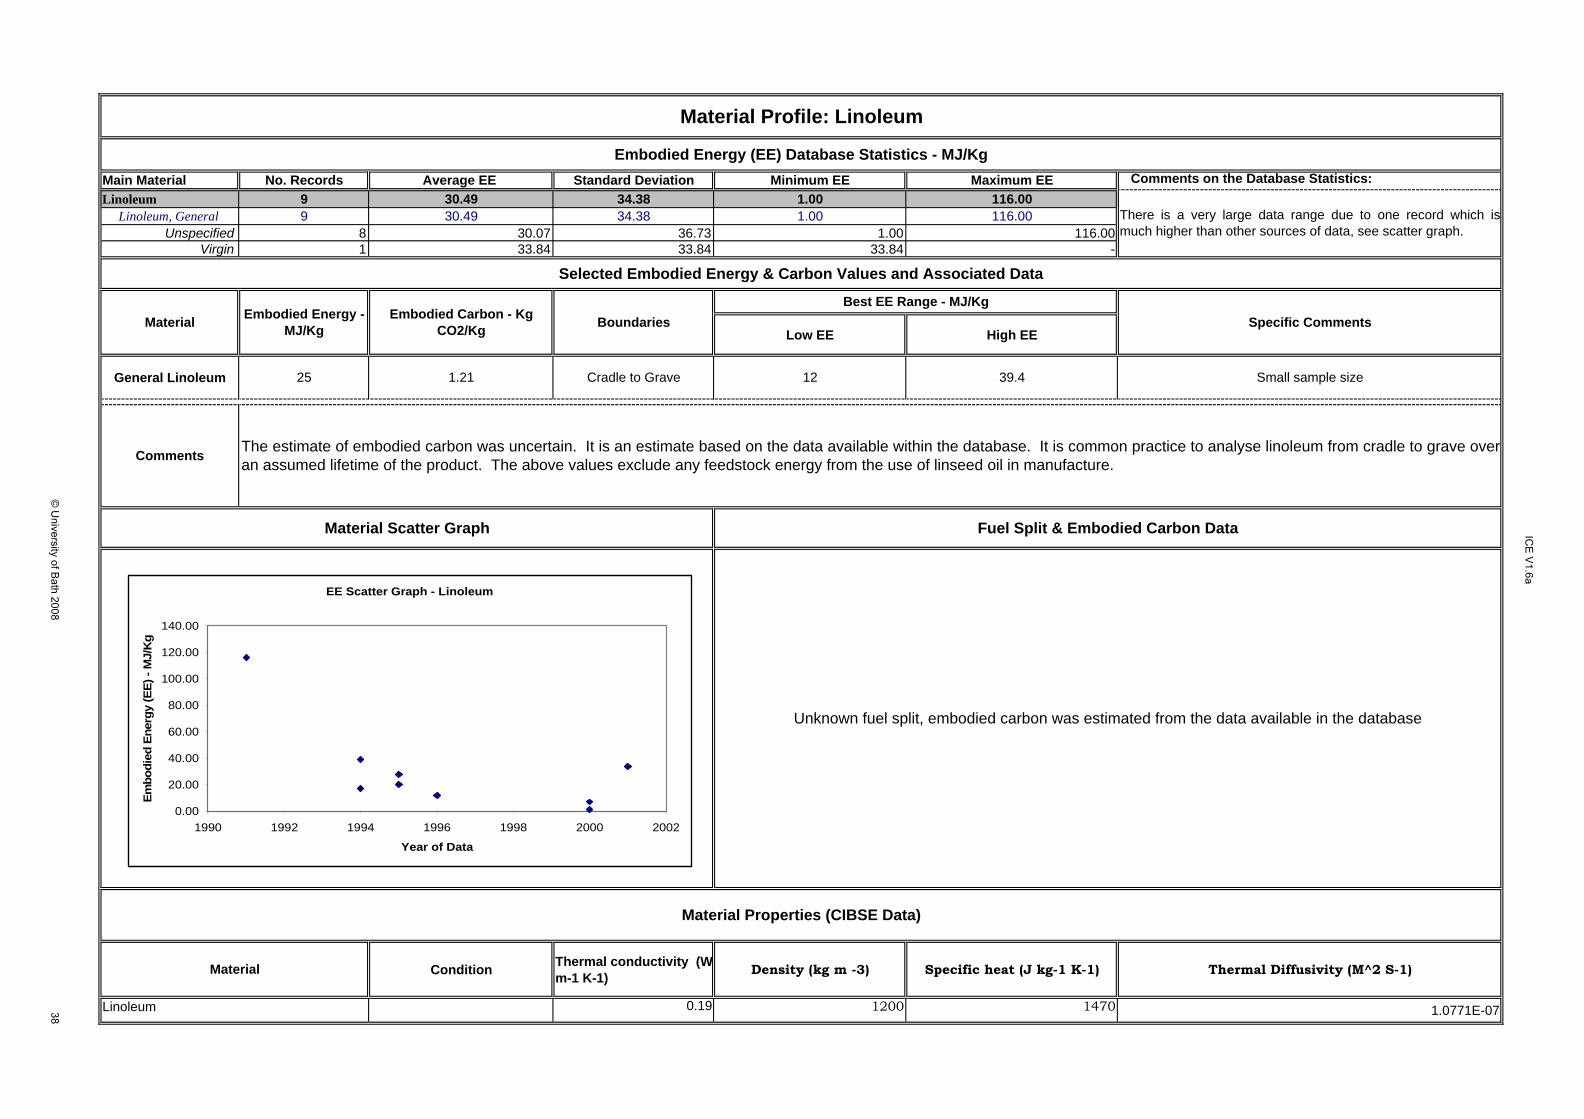
General Linoleum 25 1.21 Cradle to Grave 12 39.4 Small sample size
Condition Thermal conductivity (Wm-1 K-1) Density (kg m -3) Specific heat (J kg-1 K-1) Thermal Diffusivity (M^2 S-1)
0.19 1200 1470 1.0771E-07Linoleum
Unknown fuel split, embodied carbon was estimated from the data available in the database
Material Profile: Linoleum
Embodied Energy (EE) Database Statistics - MJ/Kg
There is a very large data range due to one record which ismuch higher than other sources of data, see scatter graph.
Selected Embodied Energy & Carbon Values and Associated Data
Material Properties (CIBSE Data)
Material
Material Scatter Graph
Comments The estimate of embodied carbon was uncertain. It is an estimate based on the data available within the database. It is common practice to analyse linoleum from cradle to grave overan assumed lifetime of the product. The above values exclude any feedstock energy from the use of linseed oil in manufacture.
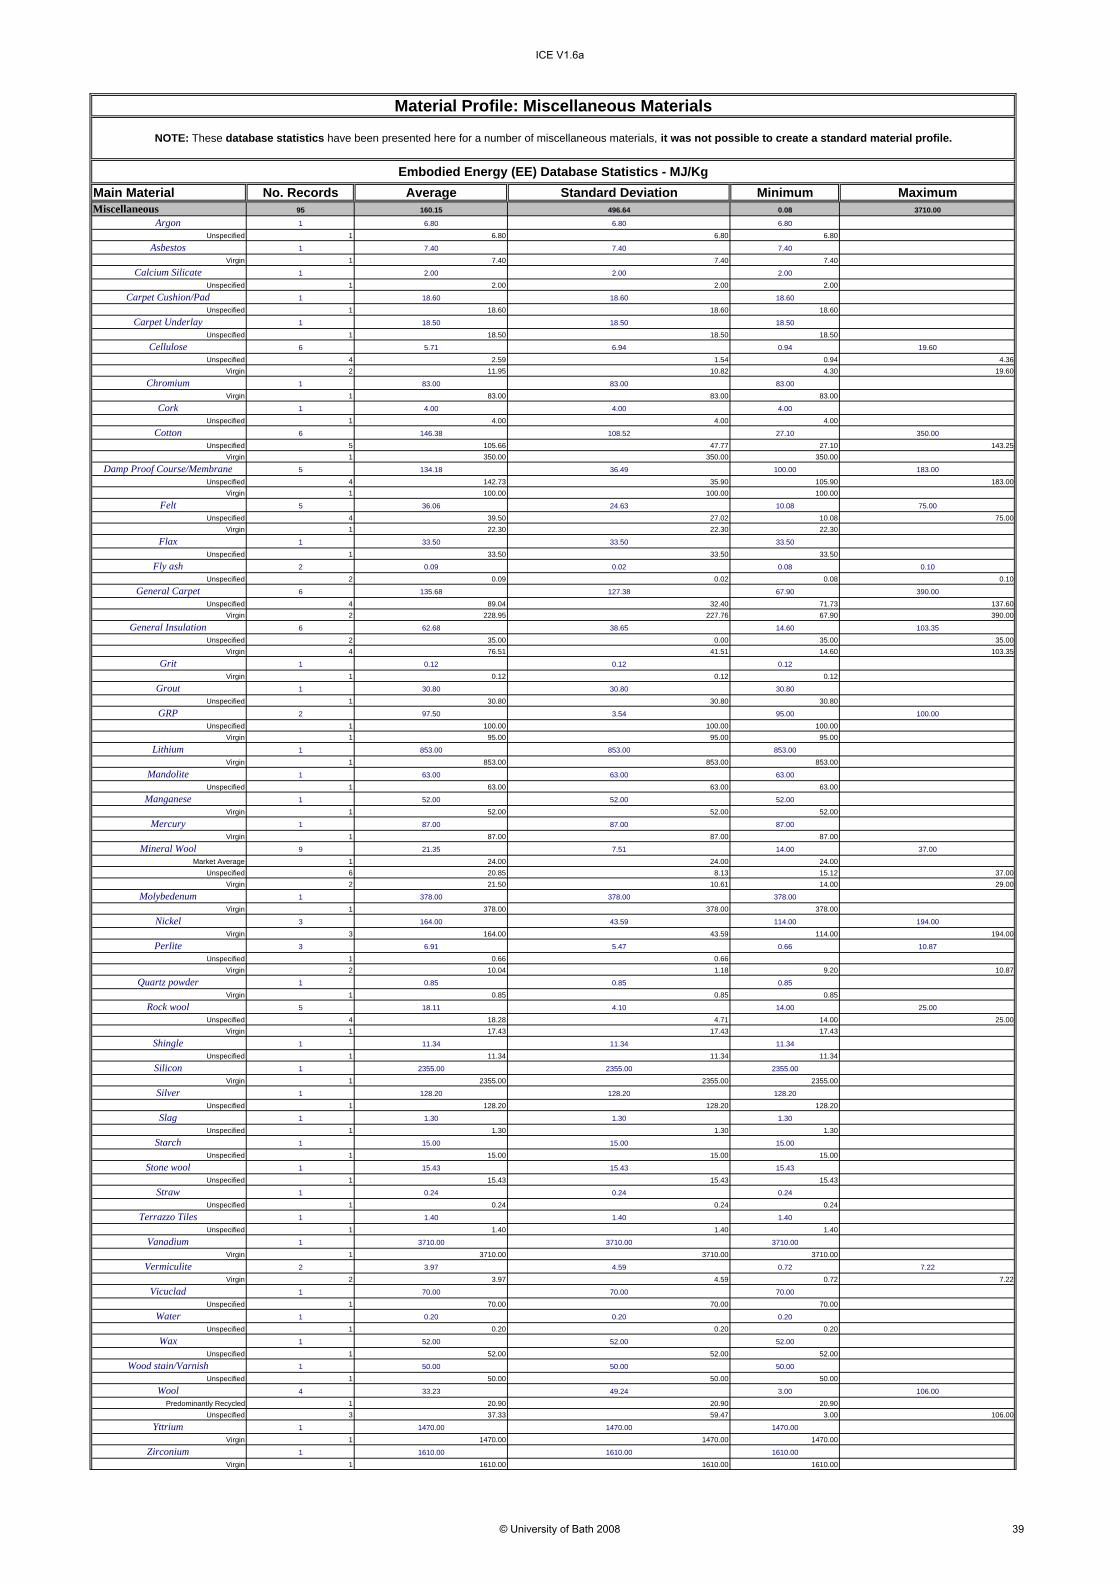
NOTE: These database statistics have been presented here for a number of miscellaneous materials, it was not possible to create a standard material profile.
Paperboard (General construction purposes) 24.80 1.32 10 39 -
Fine Paper 28.20 1.50 12 42 -
Wallpaper 36.40 1.93 -
Condition Thermal conductivity (W-m-1 K-1) Density (kg m -3) Specific heat (J kg-1 K-1) Thermal Diffusivity (M^2 S-1)
0.06 1090 1000 5.50459E-08
0.072 480 1380 1.08696E-07
0.0%Other 0.0%
100.0% 100.0%
Historical embodied carbon per unit fuel use
Total
- laminated paper
- bitumen impregnated paper
Material Properties (CIBSE Data)
Material
Fuel Split & Embodied Carbon Comments:
6.7%
LPG
27.7%
Electricity 63.6% 65.2%
Natural gas 31.8%
Much of the data in the database was outdated for paper. Notable improvements have been made within this industry in this time period. The best values inthe database were selected and then modified to take into account the current situation. The values exclude the CV (Calorific Value) of wood and the effectof carbon sequestration, which is a complex discussion (see the material profile for timber).
Cradle to Gate
Energy source % of Embodied Energy from energy source % of embodied carbon from energy source
Oil 0.3% 0.4%
The embodied carbon was estimated by using the UK typical fuel split in the paper and paperboard industry.
Material Profile: Paper
Embodied Energy (EE) Database Statistics - MJ/Kg
None
Selected Embodied Energy & Carbon Values and Associated Data
Boundaries
(+/- 30%)
Best EE Range - MJ/KgSpecific CommentsEmbodied Energy -
MJ/KgEmbodied Carbon - Kg
CO2/Kg
0.0% 0.0%
Coal 4.3%
Material Scatter Graph Fuel Split & Embodied Carbon Data
Comments
Material
Embodied carbon contributions per unit energy use for Cardboard
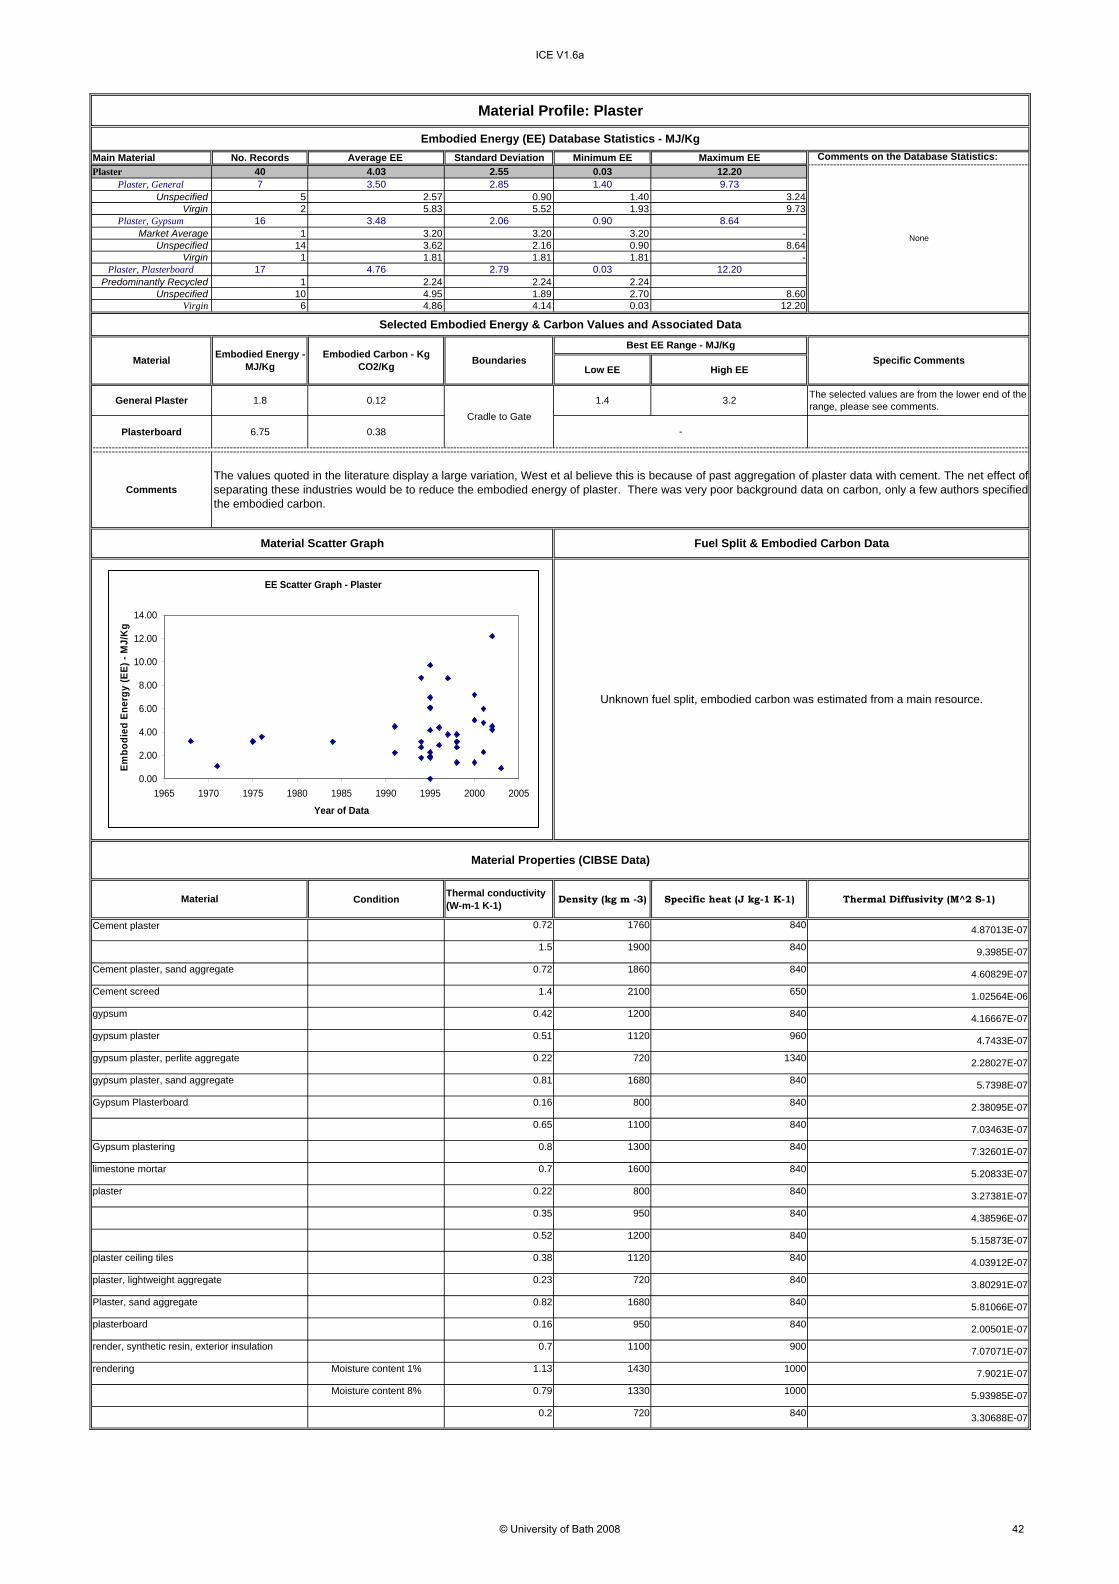
General Plaster 1.8 0.12 1.4 3.2 The selected values are from the lower end of the range, please see comments.
Plasterboard 6.75 0.38
Condition Thermal conductivity (W-m-1 K-1) Density (kg m -3) Specific heat (J kg-1 K-1) Thermal Diffusivity (M^2 S-1)
0.72 1760 840 4.87013E-07
1.5 1900 840 9.3985E-07
0.72 1860 840 4.60829E-07
1.4 2100 650 1.02564E-06
0.42 1200 840 4.16667E-07
0.51 1120 960 4.7433E-07
0.22 720 1340 2.28027E-07
0.81 1680 840 5.7398E-07
0.16 800 840 2.38095E-07
0.65 1100 840 7.03463E-07
0.8 1300 840 7.32601E-07
0.7 1600 840 5.20833E-07
0.22 800 840 3.27381E-07
0.35 950 840 4.38596E-07
0.52 1200 840 5.15873E-07
0.38 1120 840 4.03912E-07
0.23 720 840 3.80291E-07
0.82 1680 840 5.81066E-07
0.16 950 840 2.00501E-07
0.7 1100 900 7.07071E-07
Moisture content 1% 1.13 1430 1000 7.9021E-07
Moisture content 8% 0.79 1330 1000 5.93985E-07
0.2 720 840 3.30688E-07
Plaster, sand aggregate
plasterboard
render, synthetic resin, exterior insulation
rendering
Gypsum plastering
limestone mortar
plaster
plaster, lightweight aggregate
plaster ceiling tiles
Unknown fuel split, embodied carbon was estimated from a main resource.
Cement plaster
Cement plaster, sand aggregate
gypsum plaster, sand aggregate
Gypsum Plasterboard
Material Properties (CIBSE Data)
Material
Cement screed
gypsum plaster
gypsum plaster, perlite aggregate
gypsum
Material Scatter Graph Fuel Split & Embodied Carbon Data
Best EE Range - MJ/KgSpecific Comments
CommentsThe values quoted in the literature display a large variation, West et al believe this is because of past aggregation of plaster data with cement. The net effect ofseparating these industries would be to reduce the embodied energy of plaster. There was very poor background data on carbon, only a few authors specifiedthe embodied carbon.
Material Embodied Energy - MJ/Kg
Embodied Carbon - Kg CO2/Kg Boundaries
Cradle to Gate
Material Profile: Plaster
Embodied Energy (EE) Database Statistics - MJ/Kg
None
Selected Embodied Energy & Carbon Values and Associated Data
At 10°C 0.023 1590 4.52044E-07polyurethane, unfaced
plastic tiles
polyurethane, expanded
polyurethane, freon-filled
polyvinylchloride
urea formaldehyde resin
tiles
Polyvinylchloride (PVC)
30
30
110
45
Density (kg m -3)
1380
45
urea formaldehyde
polyisocyanate
Foam:
polyurethane
phenol, rigid
phenol
1200
30.4%
Fuel Split & Embodied Carbon Comments:
22.3%
Material Properties (CIBSE Data)
Material
% of embodied carbon from energy sourceEnergy source
Total 100.0% 100.0%
Oil fuels
Other Fuels 32.9%
27.2%
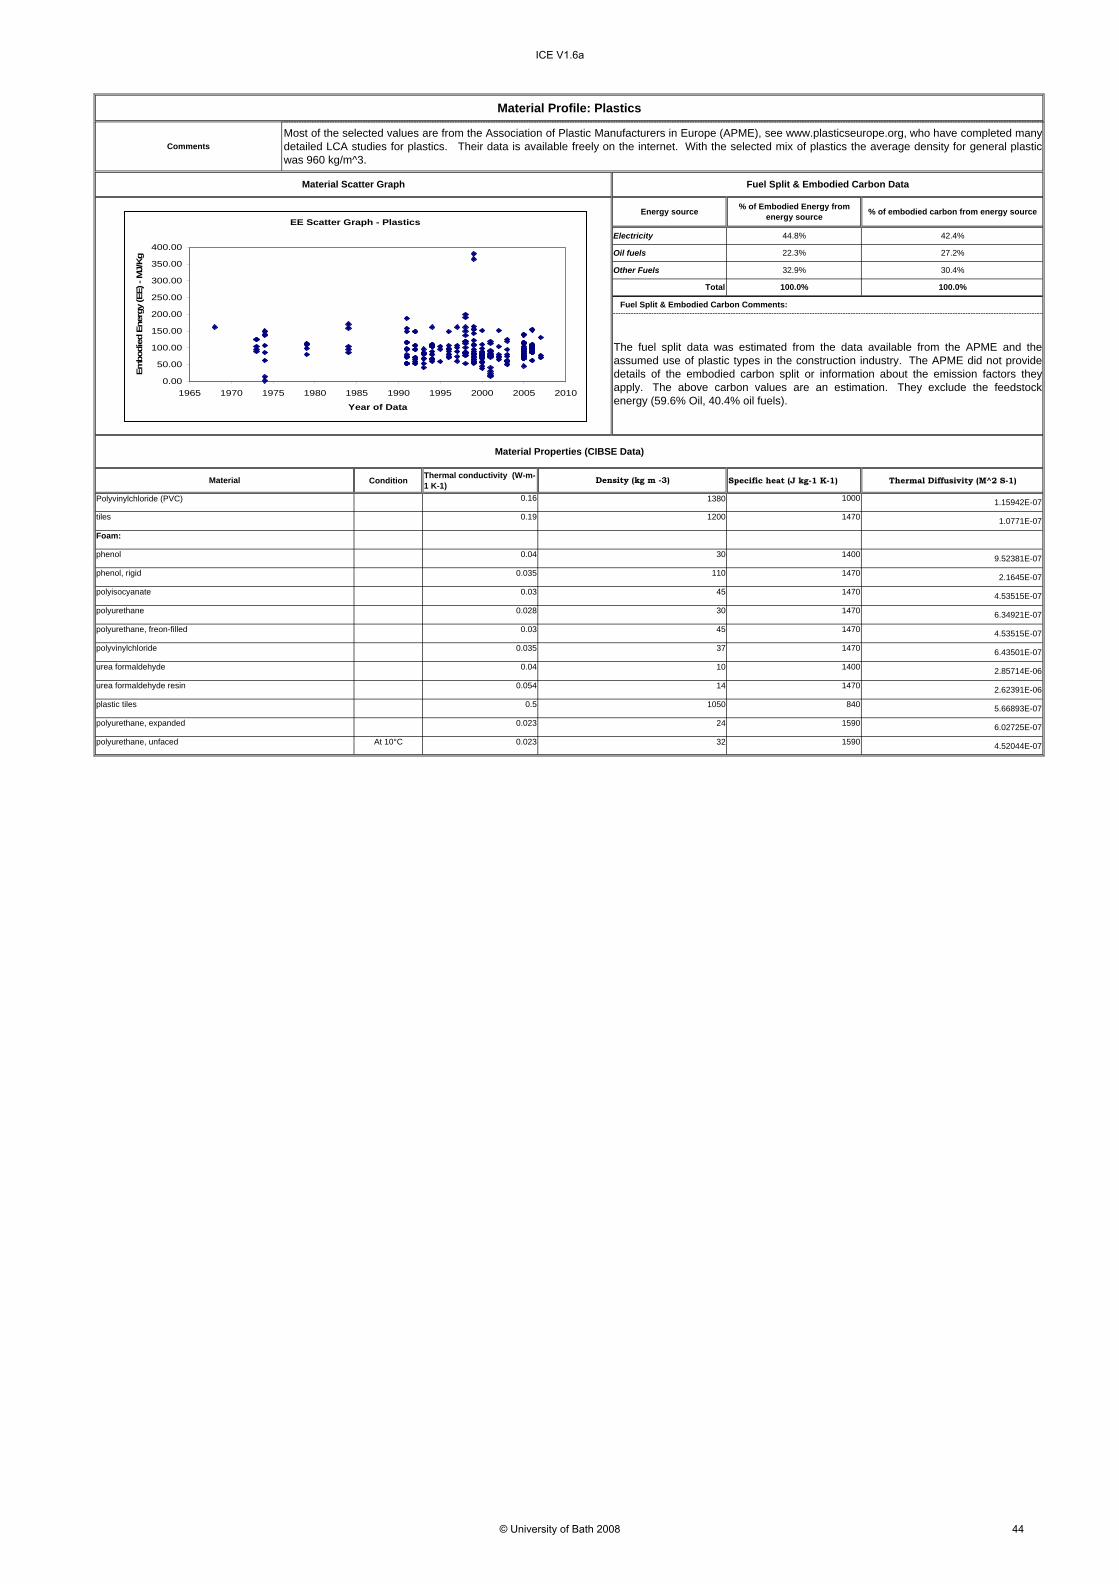
CommentsMost of the selected values are from the Association of Plastic Manufacturers in Europe (APME), see www.plasticseurope.org, who have completed manydetailed LCA studies for plastics. Their data is available freely on the internet. With the selected mix of plastics the average density for general plasticwas 960 kg/m^3.
44.8% 42.4%Electricity
% of Embodied Energy from energy source
Material Scatter Graph Fuel Split & Embodied Carbon Data
The fuel split data was estimated from the data available from the APME and theassumed use of plastic types in the construction industry. The APME did not providedetails of the embodied carbon split or information about the emission factors theyapply. The above carbon values are an estimation. They exclude the feedstockenergy (59.6% Oil, 40.4% oil fuels).
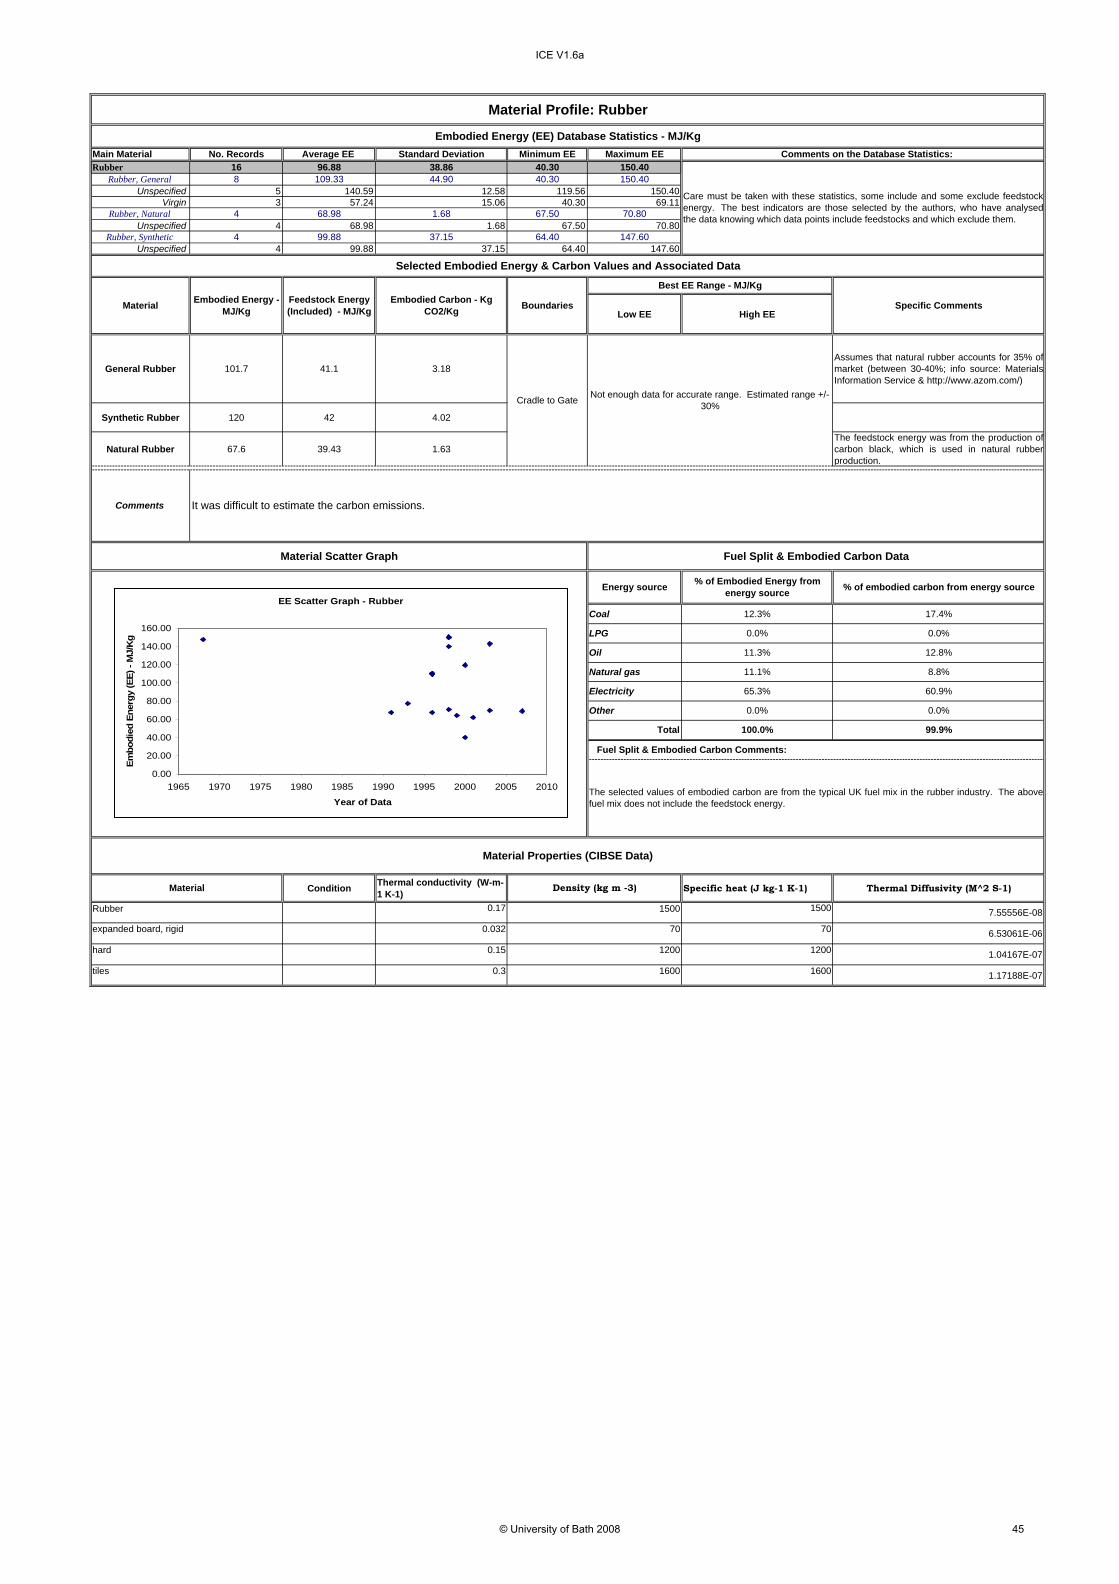
General Rubber 101.7 41.1 3.18Assumes that natural rubber accounts for 35% ofmarket (between 30-40%; info source: MaterialsInformation Service & http://www.azom.com/)
Synthetic Rubber 120 42 4.02
Natural Rubber 67.6 39.43 1.63The feedstock energy was from the production ofcarbon black, which is used in natural rubberproduction.
The selected values of embodied carbon are from the typical UK fuel mix in the rubber industry. The abovefuel mix does not include the feedstock energy.
Total 100.0% 99.9%
Oil 11.3% 12.8%
tiles
Material Properties (CIBSE Data)
Material Density (kg m -3)
Rubber 1500
70
Comments on the Database Statistics:
Cradle to Gate Not enough data for accurate range. Estimated range +/- 30%
Best EE Range - MJ/Kg
Specific Comments
Care must be taken with these statistics, some include and some exclude feedstockenergy. The best indicators are those selected by the authors, who have analysedthe data knowing which data points include feedstocks and which exclude them.
Other 0.0% 0.0%
0.0%
11.1% 8.8%
65.3% 60.9%
0.0%
Natural gas
Material Scatter Graph Fuel Split & Embodied Carbon Data
Energy source % of Embodied Energy from energy source % of embodied carbon from energy source
Coal 12.3% 17.4%
LPG
Comments It was difficult to estimate the carbon emissions.
Material Profile: Rubber
Embodied Energy (EE) Database Statistics - MJ/Kg
Selected Embodied Energy & Carbon Values and Associated Data
Material Embodied Energy - MJ/Kg
Embodied Carbon - Kg CO2/Kg BoundariesFeedstock Energy
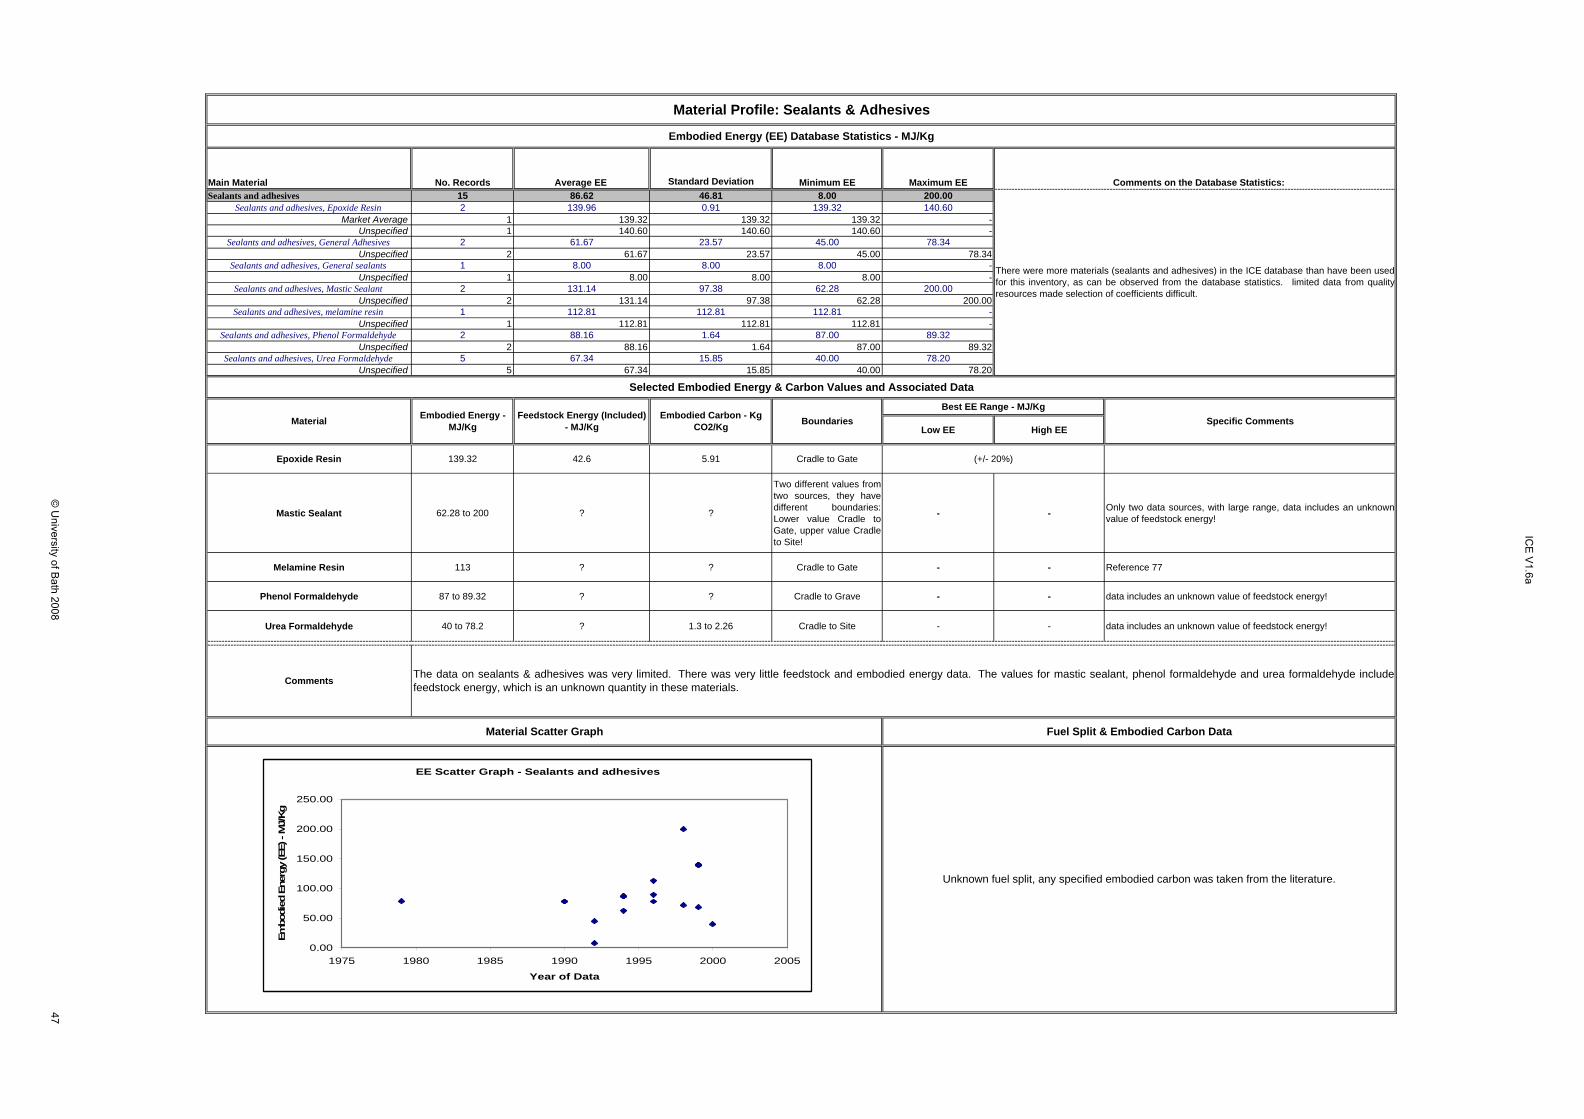
Phenol Formaldehyde 87 to 89.32 ? ? Cradle to Grave - - data includes an unknown value of feedstock energy!
Urea Formaldehyde 40 to 78.2 ? 1.3 to 2.26 Cradle to Site - - data includes an unknown value of feedstock energy!
Material Profile: Sealants & Adhesives
Embodied Energy (EE) Database Statistics - MJ/Kg
Selected Embodied Energy & Carbon Values and Associated Data
Material Embodied Energy - MJ/Kg
Embodied Carbon - Kg CO2/Kg Boundaries
Best EE Range - MJ/KgSpecific Comments
Comments on the Database Statistics:
There were more materials (sealants and adhesives) in the ICE database than have been usedfor this inventory, as can be observed from the database statistics. limited data from qualityresources made selection of coefficients difficult.
Feedstock Energy (Included) - MJ/Kg
Unknown fuel split, any specified embodied carbon was taken from the literature.
Comments The data on sealants & adhesives was very limited. There was very little feedstock and embodied energy data. The values for mastic sealant, phenol formaldehyde and urea formaldehyde includefeedstock energy, which is an unknown quantity in these materials.
(+/- 20%)
Material Scatter Graph Fuel Split & Embodied Carbon Data
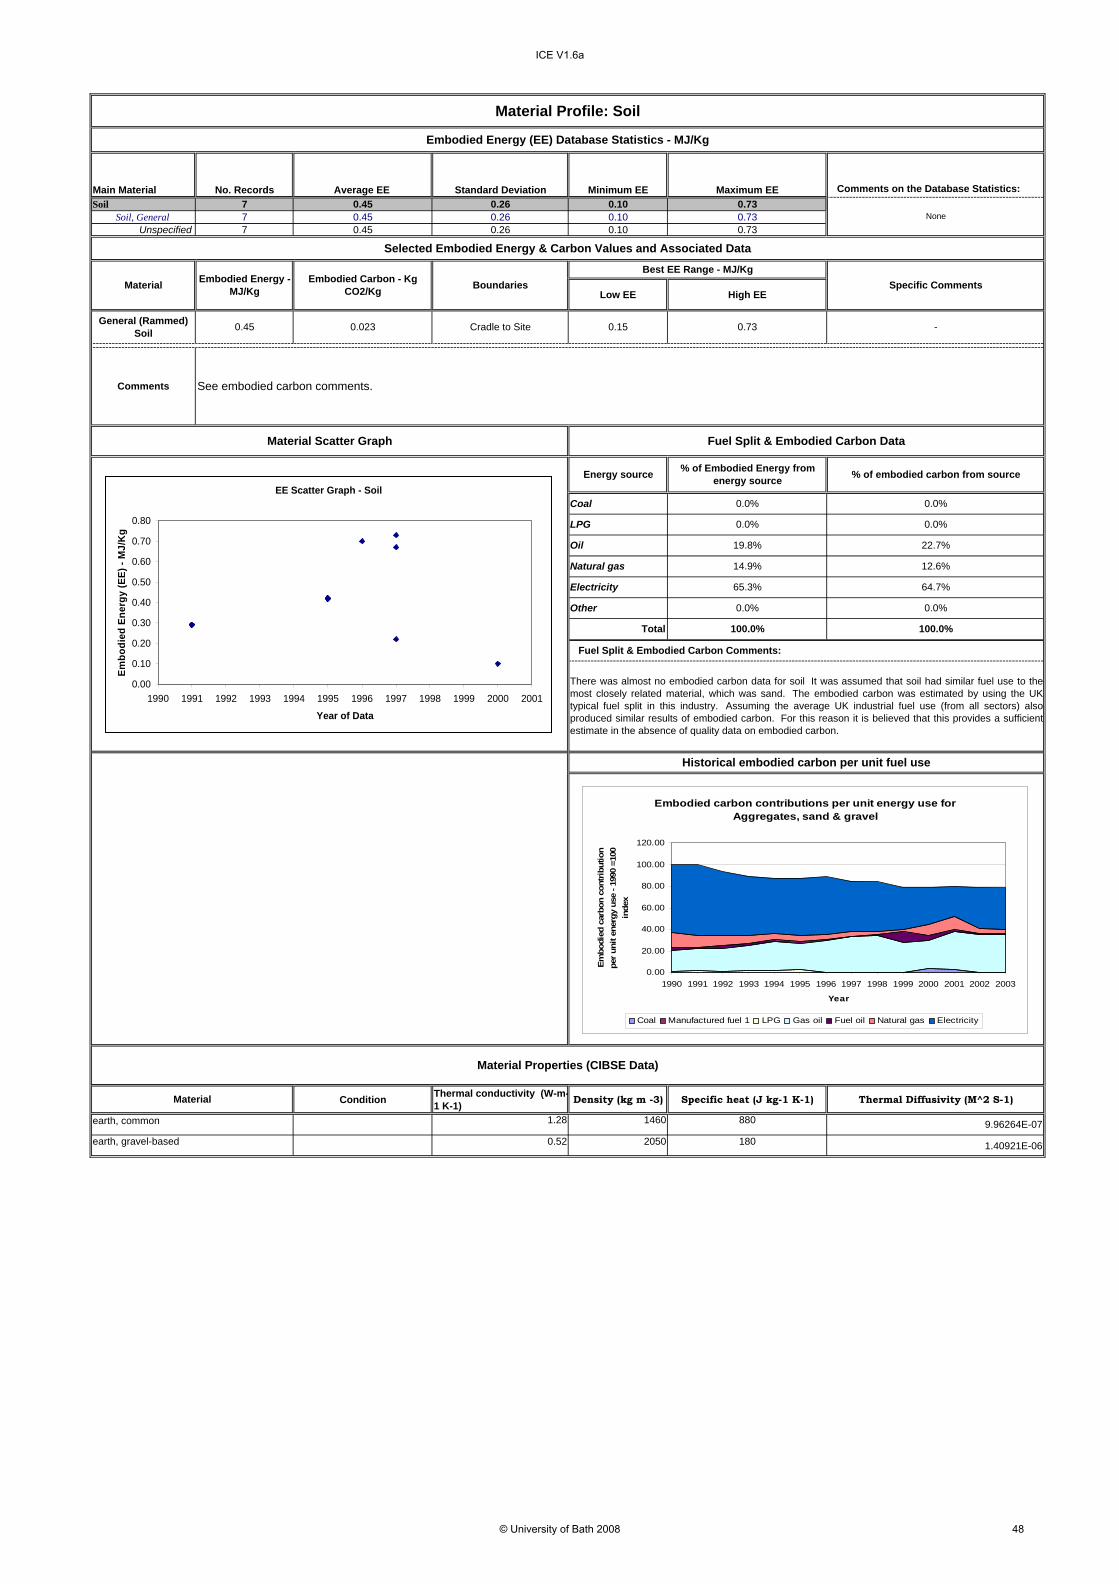
General (Rammed) Soil 0.45 0.023 Cradle to Site 0.15 0.73 -
Condition Thermal conductivity (W-m-1 K-1) Density (kg m -3) Specific heat (J kg-1 K-1) Thermal Diffusivity (M^2 S-1)
1.28 1460 880 9.96264E-07
0.52 2050 180 1.40921E-06
Historical embodied carbon per unit fuel use
earth, gravel-based
Material Properties (CIBSE Data)
Material
earth, common
100.0%
There was almost no embodied carbon data for soil It was assumed that soil had similar fuel use to themost closely related material, which was sand. The embodied carbon was estimated by using the UKtypical fuel split in this industry. Assuming the average UK industrial fuel use (from all sectors) alsoproduced similar results of embodied carbon. For this reason it is believed that this provides a sufficientestimate in the absence of quality data on embodied carbon.
Fuel Split & Embodied Carbon Comments:
0.0%
Total 100.0%
Other
Natural gas 14.9% 12.6%
Electricity 65.3% 64.7%
0.0% 0.0%
LPG 0.0%
BoundariesBest EE Range - MJ/Kg
Specific Comments
Material Scatter Graph
Comments See embodied carbon comments.
Material Embodied Energy - MJ/Kg
Embodied Carbon - Kg CO2/Kg
Fuel Split & Embodied Carbon Data
Oil 19.8% 22.7%
0.0%
Coal
0.0%
Energy source % of Embodied Energy from energy source % of embodied carbon from source
Material Profile: Soil
Embodied Energy (EE) Database Statistics - MJ/Kg
None
Selected Embodied Energy & Carbon Values and Associated Data
Embodied carbon contributions per unit energy use for Aggregates, sand & gravel
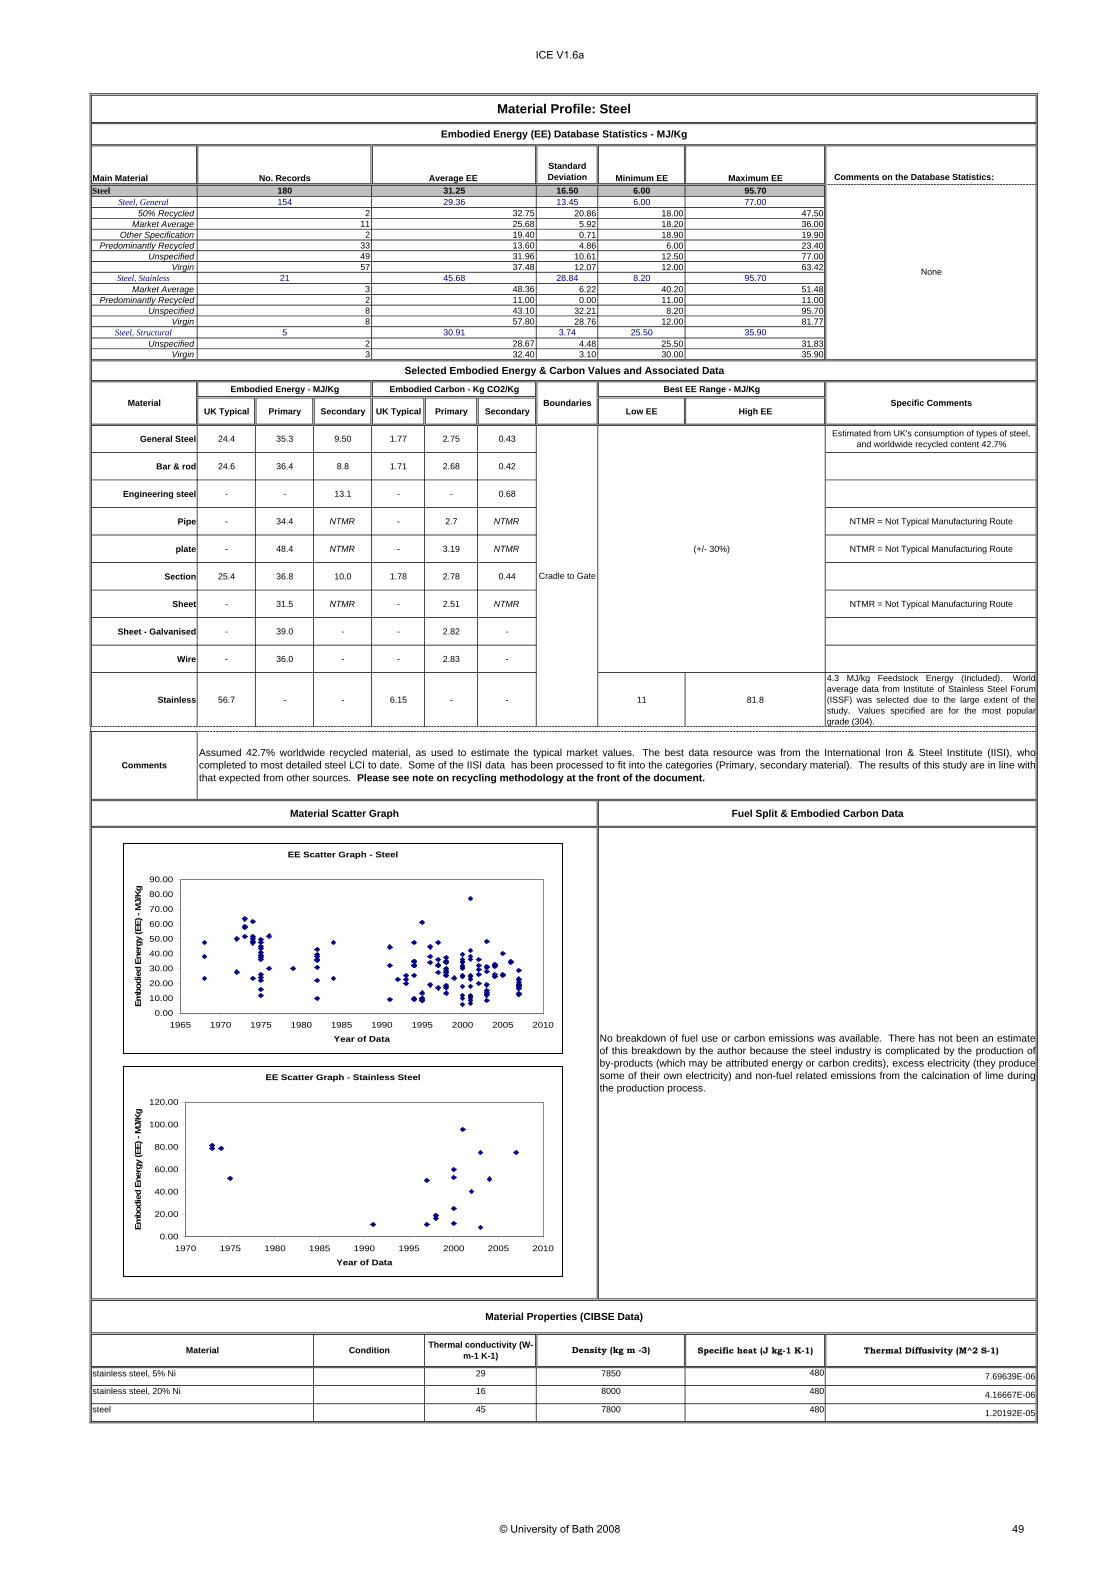
4.3 MJ/kg Feedstock Energy (Included). Worldaverage data from Institute of Stainless Steel Forum(ISSF) was selected due to the large extent of thestudy. Values specified are for the most populargrade (304).
Specific heat (J kg-1 K-1) Thermal Diffusivity (M^2 S-1)
480 7.69639E-06
480 4.16667E-06
480 1.20192E-05
16
Embodied Energy - MJ/Kg Embodied Carbon - Kg CO2/Kg
32.40
Selected Embodied Energy & Carbon Values and Associated Data
Specific Comments
(+/- 30%)
Best EE Range - MJ/KgBoundaries
Cradle to Gate
48.36
Average EE 31.2529.36
32.75
28.67
43.1057.80
30.91
2
23
25.6819.40
31.9637.48
13.60
11.00
11
3349
2
Material Profile: Steel
Embodied Energy (EE) Database Statistics - MJ/Kg
None
No. Records180154
5721
Material
CommentsAssumed 42.7% worldwide recycled material, as used to estimate the typical market values. The best data resource was from the International Iron & Steel Institute (IISI), whocompleted to most detailed steel LCI to date. Some of the IISI data has been processed to fit into the categories (Primary, secondary material). The results of this study are in line withthat expected from other sources. Please see note on recycling methodology at the front of the document.
88
5
23
45.68
7850
8000
No breakdown of fuel use or carbon emissions was available. There has not been an estimateof this breakdown by the author because the steel industry is complicated by the production ofby-products (which may be attributed energy or carbon credits), excess electricity (they producesome of their own electricity) and non-fuel related emissions from the calcination of lime duringthe production process.
Material Scatter Graph Fuel Split & Embodied Carbon Data
stainless steel, 5% Ni
stainless steel, 20% Ni
7800
Material Properties (CIBSE Data)
Material Condition Thermal conductivity (W-m-1 K-1) Density (kg m -3)
Selected Embodied Energy & Carbon Values and Associated Data
Material Embodied Energy - MJ/Kg
Comments Several values were selected based on single sources of data, but because of the importance of stone in construction it was decided that these values should beused if they were from a quality data source. Data on stone is generally poor.
The embodied carbon was estimated by using the UK typical fuel split in this industry.
Historical embodied carbon per unit fuel use
Oil 34.3% 38.2%
0.0% 0.0%
Fuel Split & Embodied Carbon Comments:
0.0%
Electricity 55.9%
0.0%
8.1%
53.7%
Embodied Carbon - Kg CO2/Kg Boundaries
Best EE Range - MJ/KgSpecific Comments
Material Properties (CIBSE Data)
Material
100.0%
Natural gas 9.8%
Coal 0.0%
Total
Other
LPG
0.0%
100.0%
Material Scatter Graph
Cradle to Gate
Cradle to Gate
Not enough data for accurate range. Estimated range +/- 30%
Not enough data for accurate range. Estimated range +/- 30%
Fuel Split & Embodied Carbon Data
Energy source % of Embodied Energy from energy source % of embodied carbon from source
Embodied carbon contributions per unit energy use for Stone
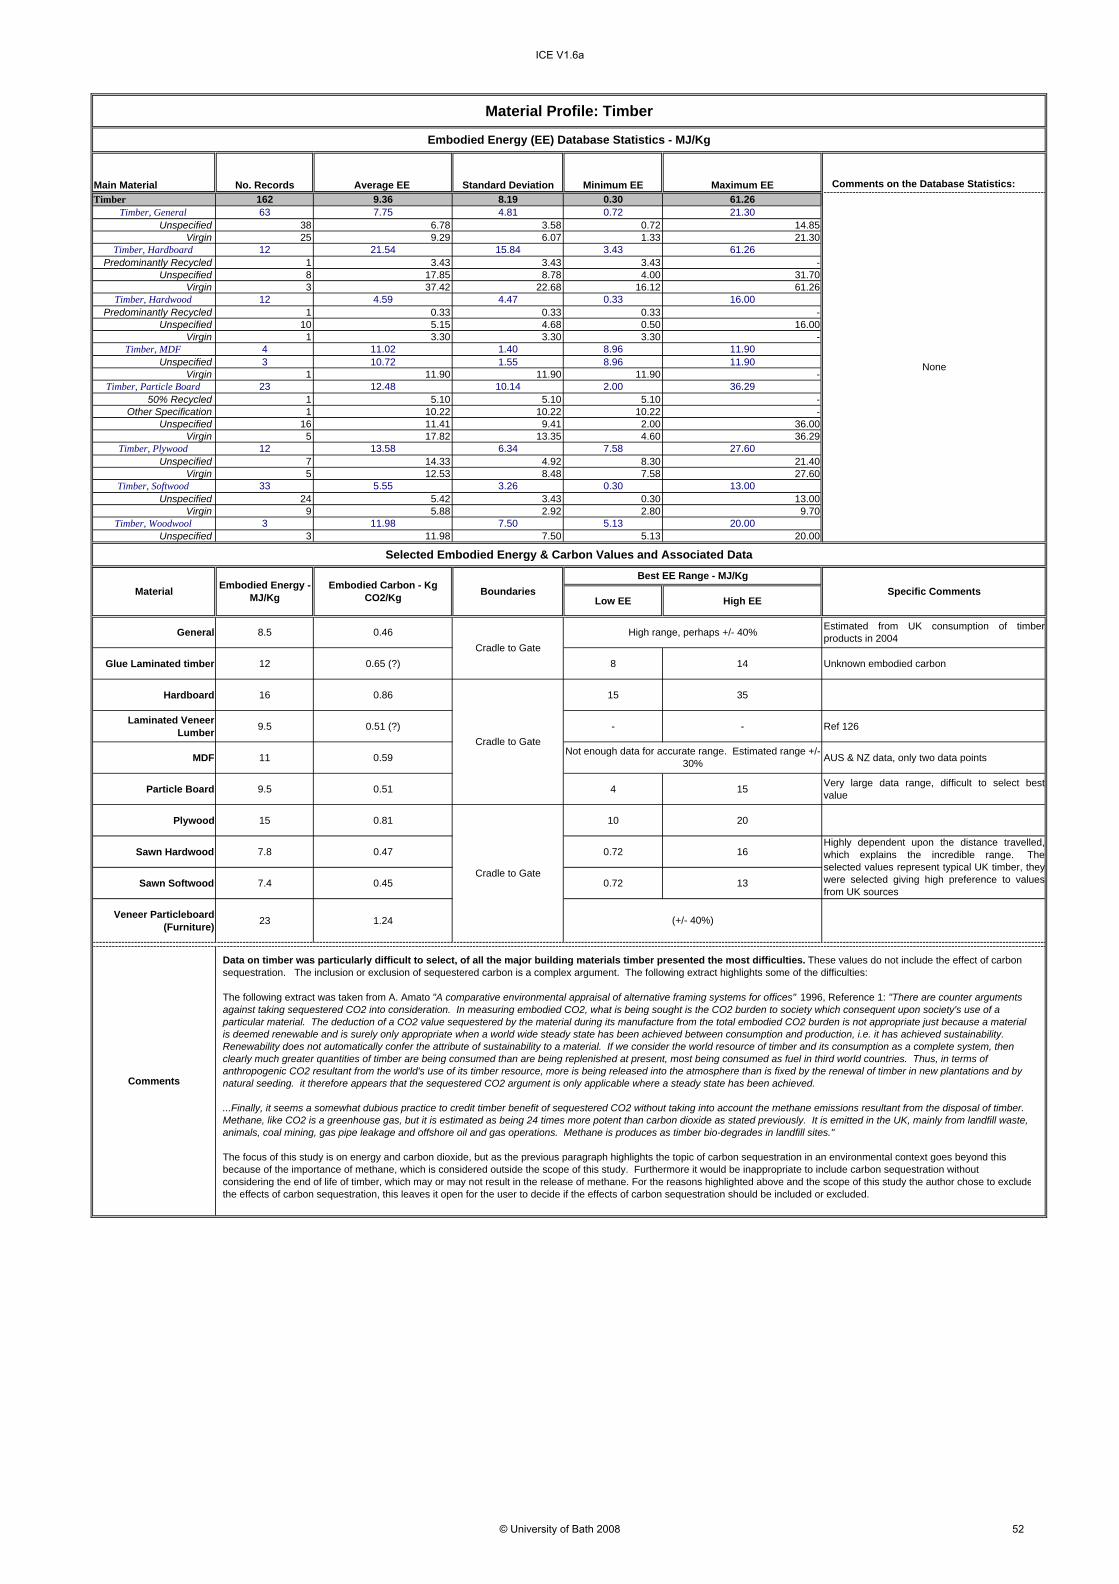
Particle Board 9.5 0.51 4 15 Very large data range, difficult to select bestvalue
Plywood 15 0.81 10 20
Sawn Hardwood 7.8 0.47 0.72 16
Sawn Softwood 7.4 0.45 0.72 13
Veneer Particleboard (Furniture) 23 1.24
Material Embodied Energy - MJ/Kg
Cradle to Gate
High range, perhaps +/- 40%
Not enough data for accurate range. Estimated range +/- 30%
Comments
Material Profile: Timber
Embodied Energy (EE) Database Statistics - MJ/Kg
None
Selected Embodied Energy & Carbon Values and Associated Data
Cradle to Gate
Cradle to Gate
Highly dependent upon the distance travelled,which explains the incredible range. Theselected values represent typical UK timber, theywere selected giving high preference to valuesfrom UK sources
Embodied Carbon - Kg CO2/Kg Boundaries Specific Comments
Best EE Range - MJ/Kg
(+/- 40%)
Data on timber was particularly difficult to select, of all the major building materials timber presented the most difficulties. These values do not include the effect of carbon sequestration. The inclusion or exclusion of sequestered carbon is a complex argument. The following extract highlights some of the difficulties:
The following extract was taken from A. Amato "A comparative environmental appraisal of alternative framing systems for offices" 1996, Reference 1: "There are counter arguments against taking sequestered CO2 into consideration. In measuring embodied CO2, what is being sought is the CO2 burden to society which consequent upon society's use of a particular material. The deduction of a CO2 value sequestered by the material during its manufacture from the total embodied CO2 burden is not appropriate just because a material is deemed renewable and is surely only appropriate when a world wide steady state has been achieved between consumption and production, i.e. it has achieved sustainability. Renewability does not automatically confer the attribute of sustainability to a material. If we consider the world resource of timber and its consumption as a complete system, then clearly much greater quantities of timber are being consumed than are being replenished at present, most being consumed as fuel in third world countries. Thus, in terms of anthropogenic CO2 resultant from the world's use of its timber resource, more is being released into the atmosphere than is fixed by the renewal of timber in new plantations and by natural seeding. it therefore appears that the sequestered CO2 argument is only applicable where a steady state has been achieved.
...Finally, it seems a somewhat dubious practice to credit timber benefit of sequestered CO2 without taking into account the methane emissions resultant from the disposal of timber. Methane, like CO2 is a greenhouse gas, but it is estimated as being 24 times more potent than carbon dioxide as stated previously. It is emitted in the UK, mainly from landfill waste, animals, coal mining, gas pipe leakage and offshore oil and gas operations. Methane is produces as timber bio-degrades in landfill sites."
The focus of this study is on energy and carbon dioxide, but as the previous paragraph highlights the topic of carbon sequestration in an environmental context goes beyond this because of the importance of methane, which is considered outside the scope of this study. Furthermore it would be inappropriate to include carbon sequestration without considering the end of life of timber, which may or may not result in the release of methane. For the reasons highlighted above and the scope of this study the author chose to excludethe effects of carbon sequestration, this leaves it open for the user to decide if the effects of carbon sequestration should be included or excluded.
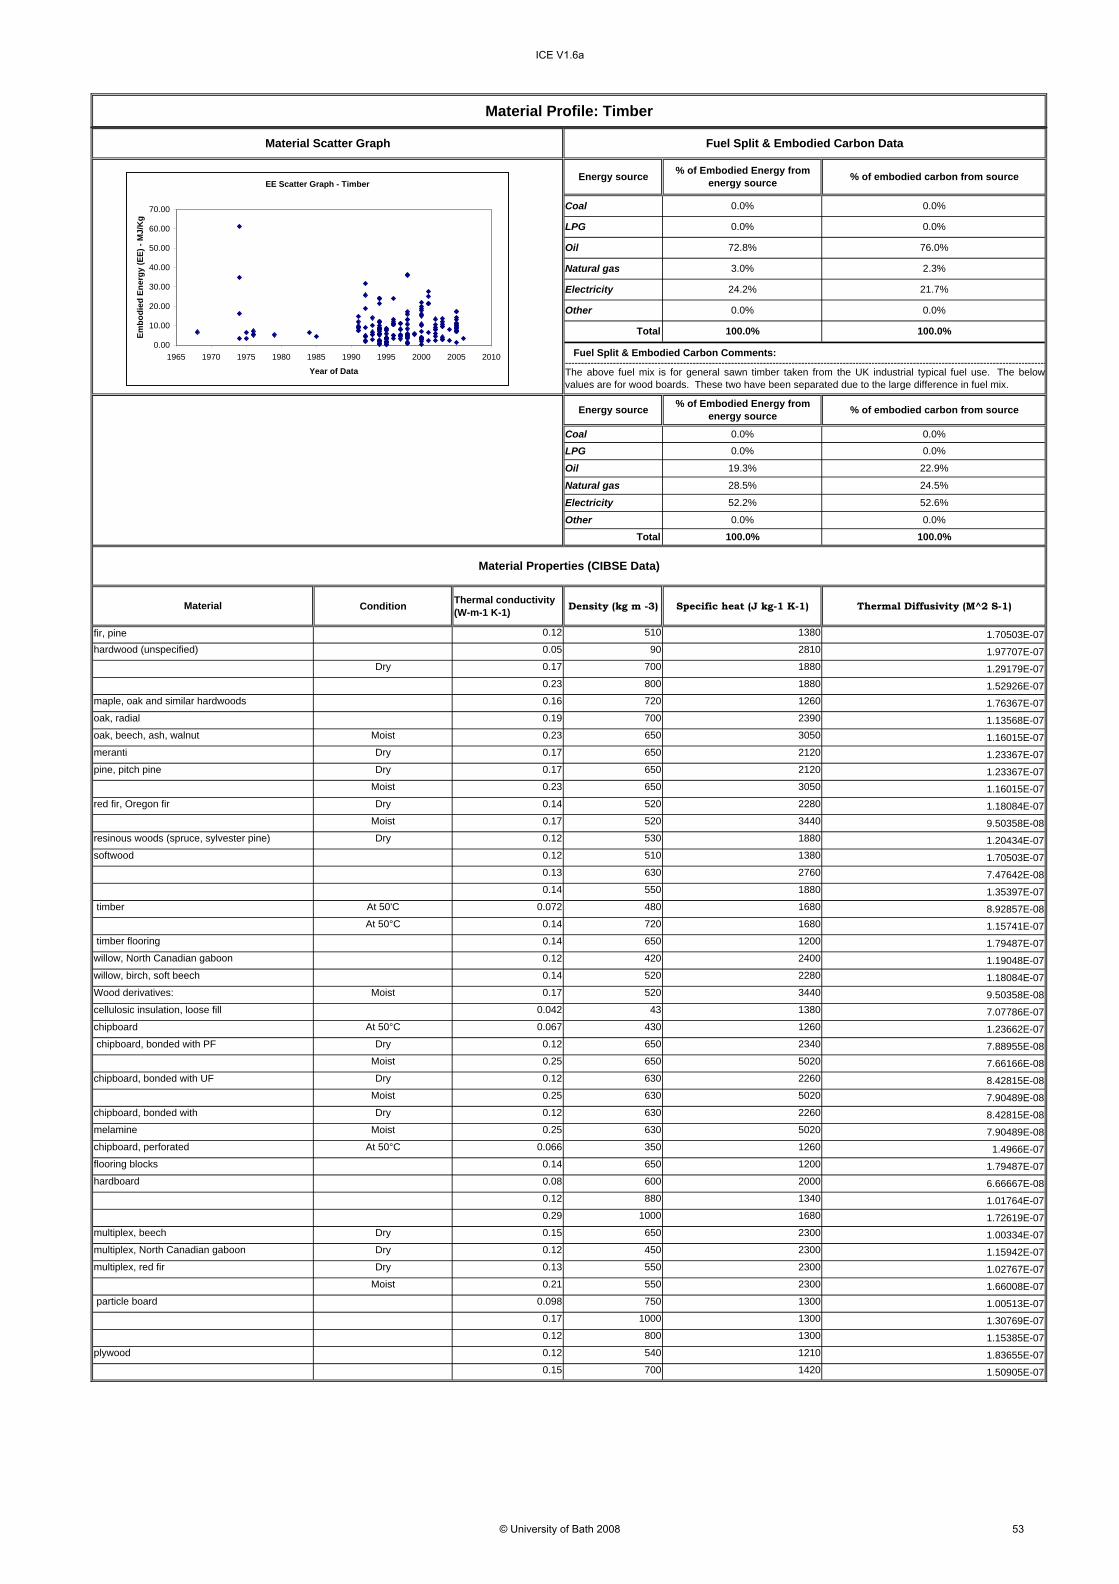
Energy source % of Embodied Energy from energy source
Other
24.2%
0.0%
% of embodied carbon from source
Total 100.0%
Fuel Split & Embodied Carbon Comments:
The above fuel mix is for general sawn timber taken from the UK industrial typical fuel use. The belowvalues are for wood boards. These two have been separated due to the large difference in fuel mix.
Coal 0.0%
100.0%
2.3%Natural gas
Oil
Material Scatter Graph
0.0% 0.0%
Fuel Split & Embodied Carbon Data
0.0%
Energy source % of Embodied Energy from energy source % of embodied carbon from source
Tin Coated (Steel) 19.2 to 54.7 1.03 to 2.93 Cradle to Gate - - -
Tin 250 13.7 Cradle to Gate 19.5 55.5 lack of modern data, large range of data
Condition Thermal conductivity (W-m-1 K-1) Density (kg m -3) Specific heat (J kg-1 K-1) Thermal Diffusivity (M^2 S-1)
65 7300 240 3.71005E-05tin
Material Properties (CIBSE Data)
Material
100.0% 100.0%Total
The fuel split was taken from the typical UK fuel use in UK tin industry.
Fuel Split & Embodied Carbon Comments:
Boundaries
There was a lack of modern data on tin, as reflected in the scatter graph. There was also a very large range of data, which was considered to be a result of tincoated steel products. These products contain small amounts of tin and are predominantly steel.
Material Profile: Tin
Embodied Energy (EE) Database Statistics - MJ/Kg
None
Selected Embodied Energy & Carbon Values and Associated Data
Comments
Material Embodied Energy - MJ/Kg
Embodied Carbon - Kg CO2/Kg
Oil 4.5%
38.5%
Best EE Range - MJ/KgSpecific Comments
Coal 7.6% 11.7%
LPG 0.0% 0.0%
Material Scatter Graph Fuel Split & Embodied Carbon Data
Energy source % of Embodied Energy from energy source % of embodied carbon from energy source
Historical embodied carbon per unit fuel use
5.3%
44.3%
Other 0.0% 0.0%
Natural gas
Electricity 43.6% 44.5%
Embodied carbon contributions per unit energy use for Lead, Zinc & Tin
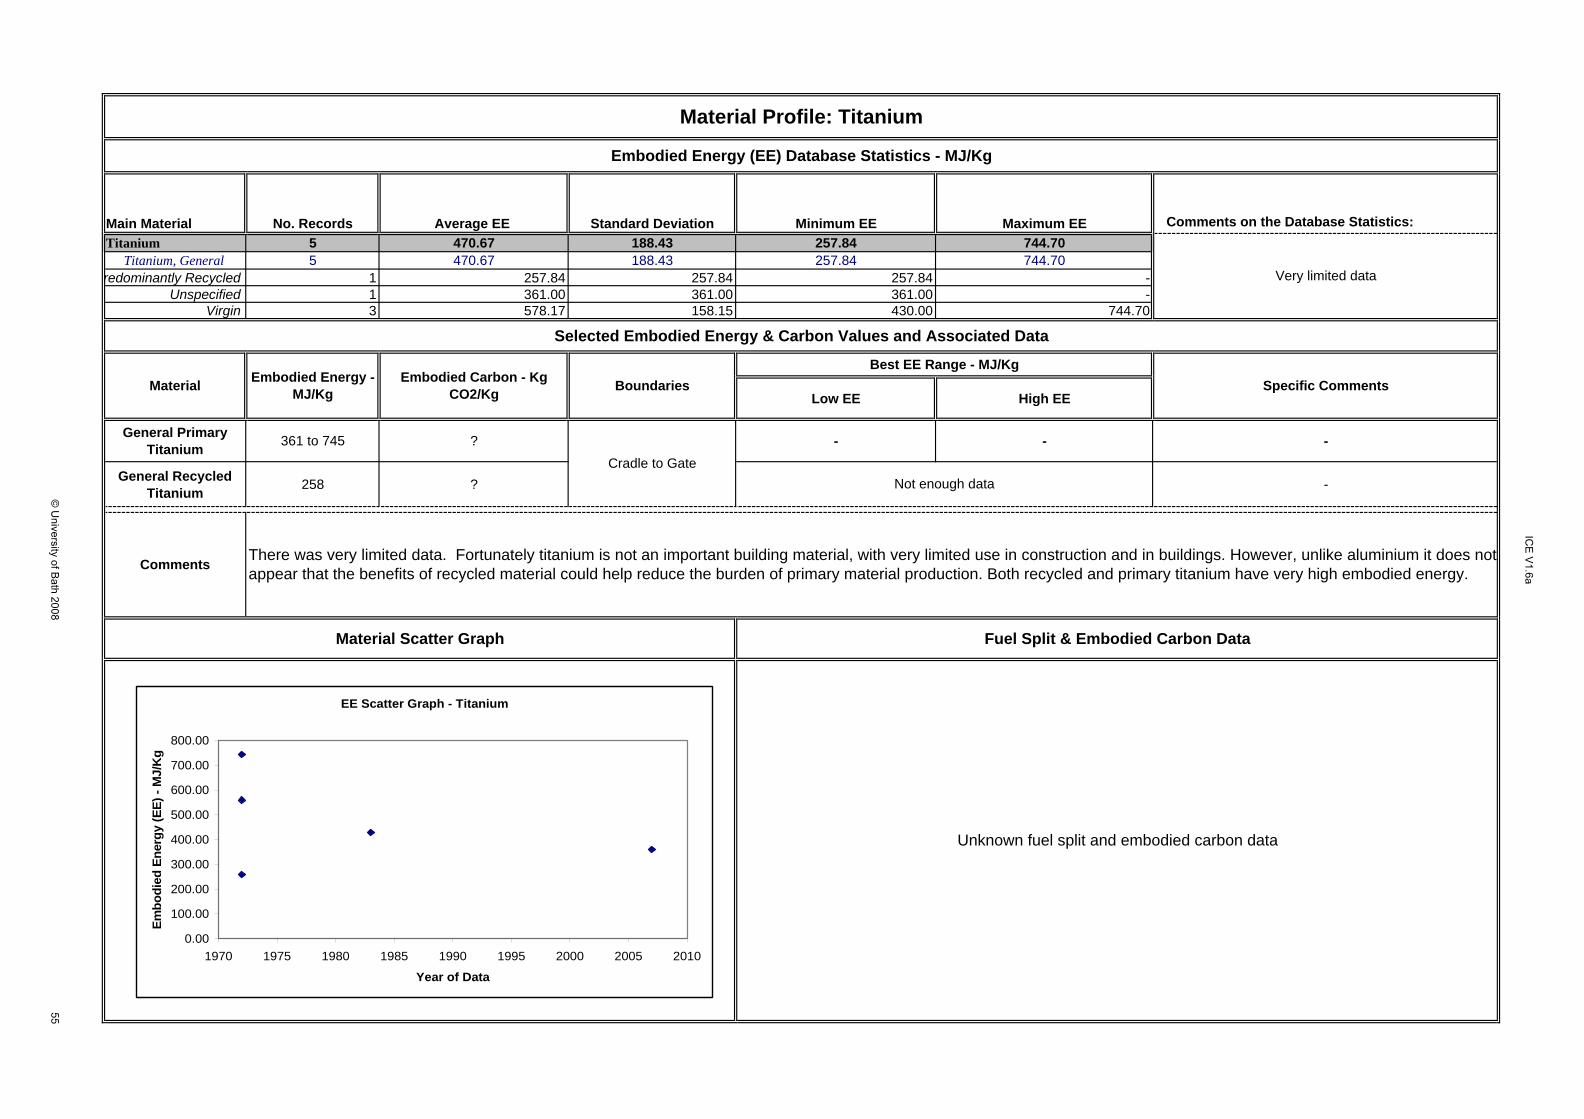
Main Material No. Records Average EE Standard Deviation Minimum EE Maximum EE Comments on the Database Statistics:Titanium 5 470.67 188.43 257.84 744.70
Selected Embodied Energy & Carbon Values and Associated Data
Material Embodied Energy - MJ/Kg
Embodied Carbon - Kg CO2/Kg Boundaries
Comments There was very limited data. Fortunately titanium is not an important building material, with very limited use in construction and in buildings. However, unlike aluminium it does notappear that the benefits of recycled material could help reduce the burden of primary material production. Both recycled and primary titanium have very high embodied energy.
Cradle to GateNot enough data
Unknown fuel split and embodied carbon data
Material Scatter Graph Fuel Split & Embodied Carbon Data
Main Material No. Records Average EE Standard Deviation Minimum EE Maximum EE
Vinyl 10 53.69 34.82 11.80 120.00
Vinyl, General 10 53.69 34.82 11.80 120.00
Unspecified 10 53.69 34.82 11.80 120.00
Low EE High EE
General Vinyl Flooring 65.64 23.58 2.29 Cradle to Gate 11.8 96Same value as PVC calendered sheet, this value is inagreement with the other values in the database forvinyl flooring.
Comments It should be noted that in the scatter graph below most of the specified values include feedstock energy. It is not possible from the scatter graph alone to determine which include and whichexclude feedstock energy. This data is stored within the ICE-Database.
Material Profile: Vinyl Flooring
Embodied Energy (EE) Database Statistics - MJ/Kg
Selected Embodied Energy & Carbon Values and Associated Data
Material Embodied Energy - MJ/Kg
Comments on the Database Statistics:
Care needs to be taken when looking at these statistics due to feedstock energy. It is onlyapparent when examining the (separate) database records whether feedstock energy is includedor excluded, sometimes it is not known and assumptions need to be made.
Feedstock Energy
(Included) - MJ/Kg
Embodied Carbon - Kg CO2/Kg Boundaries
Material Scatter Graph Fuel Split & Embodied Carbon Data
Energy source % of Embodied Energy from energy source % of embodied carbon from source
Electricity 41.8%
Oil fuels 15.1%
Other Fuels 43.1%
The energy split was specified in the literature, the carbon split is an estimate, although considered a good indicator. The main fuelclassified under 'other' fuels was natural gas.
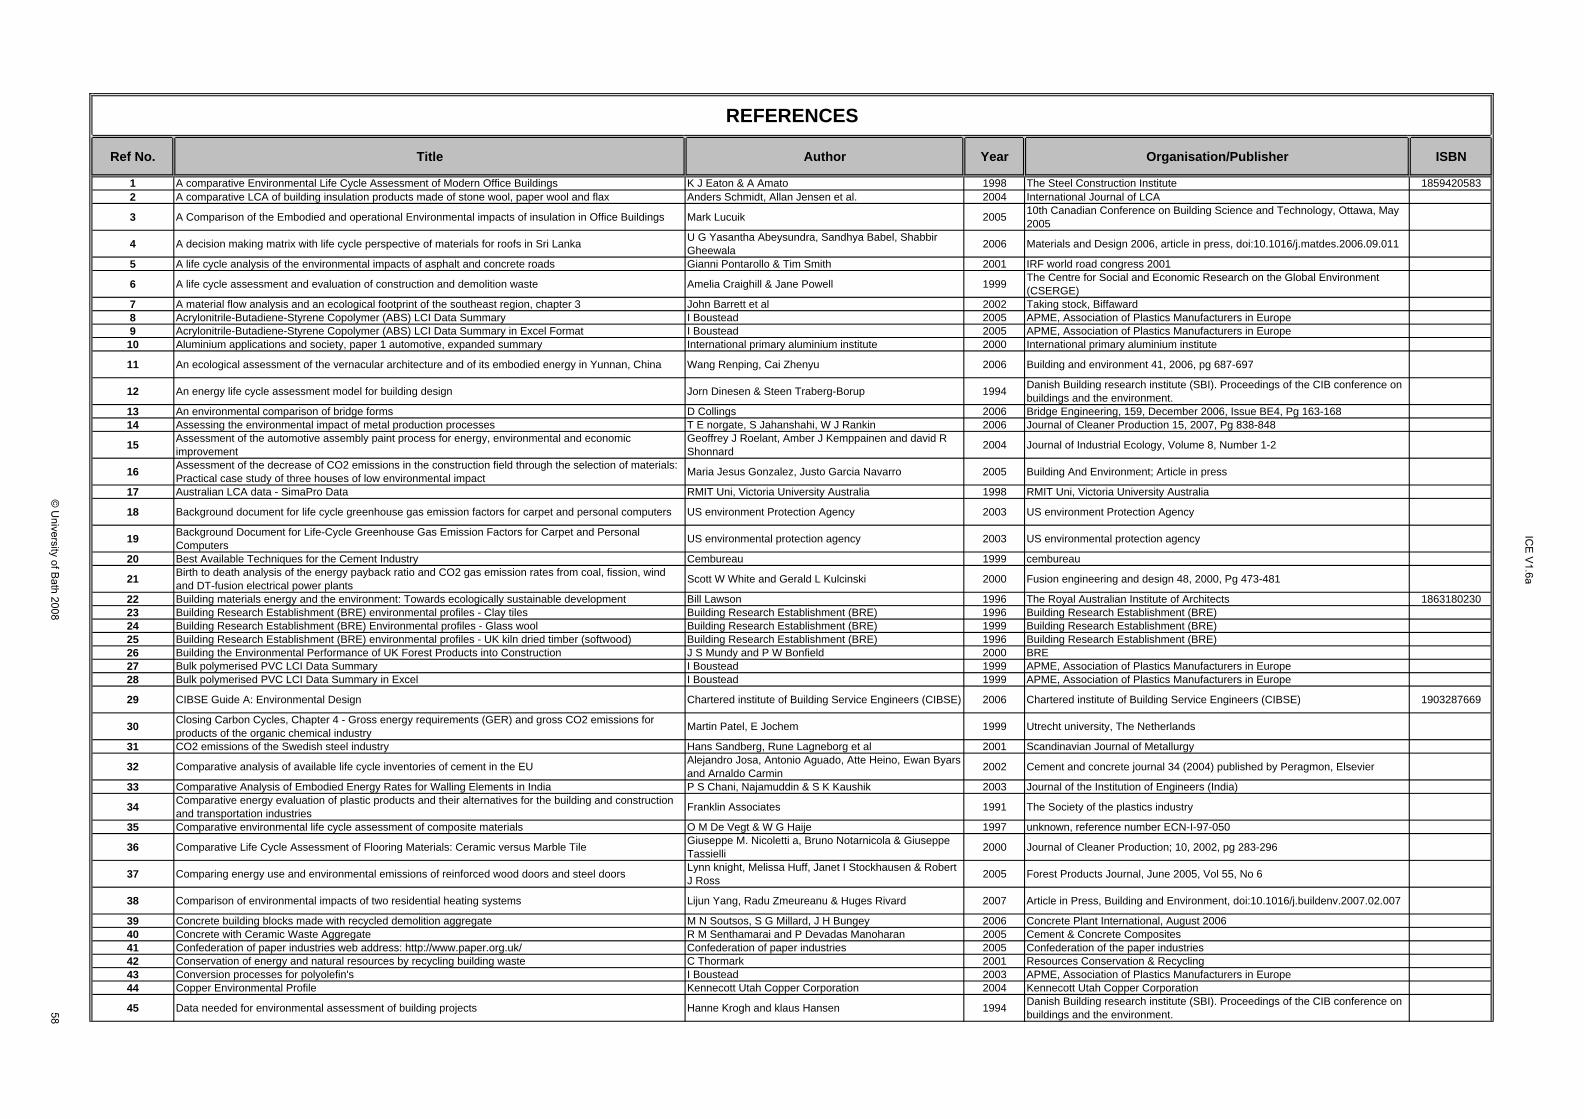
Ref No. Title Author Year Organisation/Publisher ISBN
1 A comparative Environmental Life Cycle Assessment of Modern Office Buildings K J Eaton & A Amato 1998 The Steel Construction Institute 18594205832 A comparative LCA of building insulation products made of stone wool, paper wool and flax Anders Schmidt, Allan Jensen et al. 2004 International Journal of LCA
3 A Comparison of the Embodied and operational Environmental impacts of insulation in Office Buildings Mark Lucuik 2005 10th Canadian Conference on Building Science and Technology, Ottawa, May 2005
4 A decision making matrix with life cycle perspective of materials for roofs in Sri Lanka U G Yasantha Abeysundra, Sandhya Babel, Shabbir Gheewala 2006 Materials and Design 2006, article in press, doi:10.1016/j.matdes.2006.09.011
5 A life cycle analysis of the environmental impacts of asphalt and concrete roads Gianni Pontarollo & Tim Smith 2001 IRF world road congress 2001
6 A life cycle assessment and evaluation of construction and demolition waste Amelia Craighill & Jane Powell 1999 The Centre for Social and Economic Research on the Global Environment (CSERGE)
7 A material flow analysis and an ecological footprint of the southeast region, chapter 3 John Barrett et al 2002 Taking stock, Biffaward8 Acrylonitrile-Butadiene-Styrene Copolymer (ABS) LCI Data Summary I Boustead 2005 APME, Association of Plastics Manufacturers in Europe9 Acrylonitrile-Butadiene-Styrene Copolymer (ABS) LCI Data Summary in Excel Format I Boustead 2005 APME, Association of Plastics Manufacturers in Europe10 Aluminium applications and society, paper 1 automotive, expanded summary International primary aluminium institute 2000 International primary aluminium institute
11 An ecological assessment of the vernacular architecture and of its embodied energy in Yunnan, China Wang Renping, Cai Zhenyu 2006 Building and environment 41, 2006, pg 687-697
12 An energy life cycle assessment model for building design Jorn Dinesen & Steen Traberg-Borup 1994 Danish Building research institute (SBI). Proceedings of the CIB conference on buildings and the environment.
13 An environmental comparison of bridge forms D Collings 2006 Bridge Engineering, 159, December 2006, Issue BE4, Pg 163-16814 Assessing the environmental impact of metal production processes T E norgate, S Jahanshahi, W J Rankin 2006 Journal of Cleaner Production 15, 2007, Pg 838-848
15 Assessment of the automotive assembly paint process for energy, environmental and economic improvement
Geoffrey J Roelant, Amber J Kemppainen and david R Shonnard 2004 Journal of Industrial Ecology, Volume 8, Number 1-2
16 Assessment of the decrease of CO2 emissions in the construction field through the selection of materials: Practical case study of three houses of low environmental impact Maria Jesus Gonzalez, Justo Garcia Navarro 2005 Building And Environment; Article in press
17 Australian LCA data - SimaPro Data RMIT Uni, Victoria University Australia 1998 RMIT Uni, Victoria University Australia
18 Background document for life cycle greenhouse gas emission factors for carpet and personal computers US environment Protection Agency 2003 US environment Protection Agency
19 Background Document for Life-Cycle Greenhouse Gas Emission Factors for Carpet and Personal Computers US environmental protection agency 2003 US environmental protection agency
20 Best Available Techniques for the Cement Industry Cembureau 1999 cembureau
21 Birth to death analysis of the energy payback ratio and CO2 gas emission rates from coal, fission, wind and DT-fusion electrical power plants Scott W White and Gerald L Kulcinski 2000 Fusion engineering and design 48, 2000, Pg 473-481
22 Building materials energy and the environment: Towards ecologically sustainable development Bill Lawson 1996 The Royal Australian Institute of Architects 186318023023 Building Research Establishment (BRE) environmental profiles - Clay tiles Building Research Establishment (BRE) 1996 Building Research Establishment (BRE)24 Building Research Establishment (BRE) Environmental profiles - Glass wool Building Research Establishment (BRE) 1999 Building Research Establishment (BRE)25 Building Research Establishment (BRE) environmental profiles - UK kiln dried timber (softwood) Building Research Establishment (BRE) 1996 Building Research Establishment (BRE)26 Building the Environmental Performance of UK Forest Products into Construction J S Mundy and P W Bonfield 2000 BRE27 Bulk polymerised PVC LCI Data Summary I Boustead 1999 APME, Association of Plastics Manufacturers in Europe28 Bulk polymerised PVC LCI Data Summary in Excel I Boustead 1999 APME, Association of Plastics Manufacturers in Europe
29 CIBSE Guide A: Environmental Design Chartered institute of Building Service Engineers (CIBSE) 2006 Chartered institute of Building Service Engineers (CIBSE) 1903287669
30 Closing Carbon Cycles, Chapter 4 - Gross energy requirements (GER) and gross CO2 emissions for products of the organic chemical industry Martin Patel, E Jochem 1999 Utrecht university, The Netherlands
31 CO2 emissions of the Swedish steel industry Hans Sandberg, Rune Lagneborg et al 2001 Scandinavian Journal of Metallurgy
32 Comparative analysis of available life cycle inventories of cement in the EU Alejandro Josa, Antonio Aguado, Atte Heino, Ewan Byars and Arnaldo Carmin 2002 Cement and concrete journal 34 (2004) published by Peragmon, Elsevier
33 Comparative Analysis of Embodied Energy Rates for Walling Elements in India P S Chani, Najamuddin & S K Kaushik 2003 Journal of the Institution of Engineers (India)
34 Comparative energy evaluation of plastic products and their alternatives for the building and construction and transportation industries Franklin Associates 1991 The Society of the plastics industry
35 Comparative environmental life cycle assessment of composite materials O M De Vegt & W G Haije 1997 unknown, reference number ECN-I-97-050
36 Comparative Life Cycle Assessment of Flooring Materials: Ceramic versus Marble Tile Giuseppe M. Nicoletti a, Bruno Notarnicola & Giuseppe Tassielli 2000 Journal of Cleaner Production; 10, 2002, pg 283-296
37 Comparing energy use and environmental emissions of reinforced wood doors and steel doors Lynn knight, Melissa Huff, Janet I Stockhausen & Robert J Ross 2005 Forest Products Journal, June 2005, Vol 55, No 6
38 Comparison of environmental impacts of two residential heating systems Lijun Yang, Radu Zmeureanu & Huges Rivard 2007 Article in Press, Building and Environment, doi:10.1016/j.buildenv.2007.02.007
39 Concrete building blocks made with recycled demolition aggregate M N Soutsos, S G Millard, J H Bungey 2006 Concrete Plant International, August 200640 Concrete with Ceramic Waste Aggregate R M Senthamarai and P Devadas Manoharan 2005 Cement & Concrete Composites41 Confederation of paper industries web address: http://www.paper.org.uk/ Confederation of paper industries 2005 Confederation of the paper industries42 Conservation of energy and natural resources by recycling building waste C Thormark 2001 Resources Conservation & Recycling43 Conversion processes for polyolefin's I Boustead 2003 APME, Association of Plastics Manufacturers in Europe44 Copper Environmental Profile Kennecott Utah Copper Corporation 2004 Kennecott Utah Copper Corporation
45 Data needed for environmental assessment of building projects Hanne Krogh and klaus Hansen 1994 Danish Building research institute (SBI). Proceedings of the CIB conference on buildings and the environment.
Ref No. Title Author Year Organisation/Publisher ISBN
REFERENCES
46 Defining and Improving Environmental Performance in the Concrete Industry D Higgins, L Parrott & L Sear 2000 DETR & UK Concrete Alliance
47 ECFA Environmental Declaration Plasticising Admixtures ECFA - European Federation of Concrete Admixture Association 2006 ECFA - European Federation of Concrete Admixture Association
48 Ecohouse 2: A Design Guide Sue Roaf, Manuel Fuentes & Stephanie Thomas 2003 Architectural Press (Elsevier) 75065734049 Ecology of Building Materials Bjorn Berge 2000 Architectural press 75063394850 ECO-Profiles of the European Plastics Industry, Methodology I Boustead 2003 APME, Association of Plastics Manufacturers in Europe
51 EEE: A prototype tool for the evaluation of embodied energy and greenhouse gas emissions of exterior envelope of Canadian houses
Rym Baouendi, Radu Zmeureanu, Brian Bradley & Avi Friedman 2002 Centre for Building Studies, Department of Building, Civil and Environmental
52 Embodied energy - detailed methodology Tim Grant at the Centre for Design at RMIT 2001 Centre for Design RMIT University Australia53 Embodied energy analysis of New Zealand building materials Alcorn and Baird 1996 Embodied Energy - The Current State of Play, Deakin University, Nov 199654 Embodied energy and carbon dioxide emissions for building materials John West, Carol Atkinson & Nigel Howard 1994 Proceedings of the CIB conference on buildings and the environment, BRE
55 Embodied Energy and CO2 Coefficients for NZ Building Materials Andrew Alcorn 2003 Centre for Building Performance Research, Victoria University of Wellington
56 Embodied Energy and CO2 Emissions of Wood and Concrete Framed Buildings in Sweden L Gustavsson & R Sathre 2004 Ecotechnology, Mid-Sweden university
57 Embodied Energy Coefficients of Building Materials Andrew Alcorn 1996 Centre for Building Performance Research, Victoria University of Wellington
58 Embodied energy in buildings: Wood versus concrete - reply to Borjesson and Gustavsson M Lenzen and G Treloar 2002 Energy Policy 30, 2002, 249-25559 Embodied energy of common and alternative building materials and technologies B V Venkaarama Reddy & K S Jagadish 2001 Energy and buildings, Elsevier60 Energy Analysis Edited by John A G Thomas 1977 IPC science Press Technology 90285260461 Energy and environmental impact analysis of double-glazed windows G Weir and T Muneer 1996 Napier university
62 Energy consumption and associated greenhouse gas emissions related to maintenance of a residential structure Paul Winistorfer & Zhangjing Chen 2004 CORRIM
63 Energy consumption of asphalt and reinforced concrete pavement materials and construction Pablo Zapata & John Gambatese 2005 Journal of infrastructure systems, March 200564 Energy Performance of buildings George Baird, Michael R Donn 1984 CRC Press Inc. 84935186365 Energy use during the life cycle of buildings: a method K Adalberth 1997 Building and environment, Vol 32, No. 4, pg 317-32066 Environmental assessment of bio-based polymers and natural fibres Martin Patel, Catia Bastioli et al 2003 Unknown67 Environmental Assessment of Brick Production in Greece Christopher Koroneos & Aris Dompros 2006 Building and Environment 42, 2007, Pg 2114-2123
68 Environmental Benefits of Recycling - An international Review of Life Cycle Comparisons for Key Materials in the UK Recycling Sector WRAP - Waste Resources Action Programme 2006 WRAP - Waste Resources Action Programme
69 Environmental burdens of concrete and concrete products Sirje Vares & Tarja Häkkinen 1998 Technical Research Centre of Finland, VTT Building Technology70 Environmental impact of building and construction materials, Volume B: Mineral products R Clough and R Martyn 1995 CIRIA, Construction Industry Research and Information Association 86017812971 Environmental impact of building and construction materials, Volume C: Metals N Howard 1995 CIRIA, Construction Industry Research and Information Association 86017813772 Environmental impact of building and construction materials, Volume D: Plastics and elastomers R Clough and R Martyn 1995 CIRIA, Construction Industry Research and Information Association 860178145
73 Environmental impact of building and construction materials, Volume E: Timber and timber products J Newton and R Venables 1995 CIRIA, Construction Industry Research and Information Association 860178153
74 Environmental impact of building and construction materials, Volume F: Paints and coatings, adhesives and sealants R Bradley, A Griffiths and M Levitt 1995 CIRIA, Construction Industry Research and Information Association 860178161
75 Environmental LCI data for Rockwool Rollbatt Price Waterhouse Coopers, PWC 2003 Price Waterhouse Coopers, PWC
76 Environmental Performance Evaluation of Thermal Insulation Materials and its Impact on the Building A M Papadopoulos & E Giama 2006 Building and Environment, Article in Press, doi:10.1016/j.buildenv.2006.04.012
77 Environmental Resource guide Joseph A Demkin 1997 AIA, American institute of Architects 471140430
78 Environmental, economic and social analysis of materials for doors and windows in Sri Lanka U G Yasantha Abeysundra, Sandhya Babel, Shabbir Gheewala & Alice Sharp 2006 Building and Environment 42, 2007, Pg 2141-2149
79 Epoxy resin LCI Data Summary I Boustead 1999 APME, Association of Plastics Manufacturers in Europe80 Epoxy resin LCI Data Summary in excel format I Boustead 1999 APME, Association of Plastics Manufacturers in Europe81 Estimating the embodied energy of timber building products Stephen Pullen 2000 Journal of the institute of Wood Science, Vol 15 No.3, 2000
82 European Database for Corrugated Board Life Cycle Studies FEFCO European Federation of Corrugated Board Manufacturers, & GEO & ECO 2006 FEFCO European Federation of Corrugated Board Manufacturers, & GEO &
ECO83 Evaluate the whole life environmental impact of glass in a fully glazed commercial building Mohamed R Kiani, Andrew Miller et al 2005 University of Brighton84 Evaluation of building environmental impacts: Two case studies Stephen Carpenter & John Kokko 1996 ASHRAE transactions85 Evaluation of CO2 payback time of power plants by LCA K Tahara, T Kojima, A Inaba 1997 Energy conservation and management, Vol 3886 Gate to Gate Life Cycle Inventory of Glued-Laminated Timbers Production Maureen E Puettmann and James B Wilson 2005 Wood and Fibre Science 37, Special CORRIM Issue, 2005, Pg 99-11387 Gate to Gate Life Cycle Inventory of I-Joist Production James B Wilson & Eric R Dancer 2005 Wood and Fibre Science 37, Special CORRIM Issue, 2005, Pg 85-9888 Gate to Gate Life Cycle Inventory of Laminated Veneer Lumber Production James B Wilson & Eric R Dancer 2005 Wood and Fibre Science 37, Special CORRIM Issue, 2005, Pg 114-12789 Gate to gate life cycle inventory of softwood lumber production Michael R Milota, Cynthia D West & Ian D Hartley 2005 Wood and Fibre Science, 37 Corrim Special issue, 2005, Pg 47-5790 Gate to Gate Life Cycle inventory of Softwood Plywood Production James B Wilson and Eric T Sakimoto 2005 Wood and Fibre Science 37, Special CORRIM Issue, 2005, Pg 58-7391 Gate to Gate Life Cycle Inventory of Oriented Strandboard Production D Earl Kline 2005 Wood and Fibre Science 37, Special CORRIM Issue, 2005, Pg 74-8492 GBC - The green building challenge handbook Unknown 1995 http://www.gbc-ziegelhandbuch.org/eng/main.asp?Menu=393 Glass Recycling - Life Cycle Carbon Dioxide Emissions British Glass by Enviros 2003 British Glass by Enviros94 Green building Handbook Vol 2: A guide to building products and their impact on the environment Tom Woolley, Sam Kimmins 2000 E & FN Spon, Taylor & Francis Group 41925380795 Green Building Handbook: A guide to building products and their impact on the environment Tom Woolley, Sam Kimmins 1997 E & FN Spon, Thomson Science & Professional 419226907
Ref No. Title Author Year Organisation/Publisher ISBN
REFERENCES
96 Greenhouse Gas Emissions and Costs Over the Life Cycle of Wood and Alternative Flooring Materials Ann Kristin Petersen and Birger Solberg 2004 Climatic Change 64, 2004, Pg 143-167
97 Handbook of Industrial Energy Analysis I Boustead, G F Hancock 1979 Ellis Horwood Limited 85312064198 High Density polyethylene LCI Data Summary I Boustead 2005 APME, Association of Plastics Manufacturers in Europe99 High Density polyethylene LCI Data Summary in Excel format I Boustead 2005 APME, Association of Plastics Manufacturers in Europe
100 High Density polyethylene pipe extrusion LCI Data Summary I Boustead 2005 Plastic Europe, the former APME101 High Density polyethylene pipe extrusion LCI Data Summary in Excel format I Boustead 2005 APME, Association of Plastics Manufacturers in Europe
102 High Performance High Volume Fly Ash Concrete for Sustainable Development P Kumar Mehta 2004 international Workshop on Sustainable Development and Concrete technology, Beijing, China, May 20-21 2004
103 How Sustainable is Concrete? Leslie Struble and Jonathan Godfrey 1999 University of Illinois, International workshop on sustainable development and concrete technology
104 IISF - Stainless steel LCI spreadsheet IISF - institute of Stainless Steel Forum (ISSF) 2004 IISF - institute of Stainless Steel Forum (ISSF)105 IISI bar & wire rod BF route IISI - International Iron & Steel Institute 2000 IISI - International Iron & Steel Institute106 IISI bar & wire rod EAF route IISI - International Iron & Steel Institute 2000 IISI - International Iron & Steel Institute107 IISI coated flat steel BF route IISI - International Iron & Steel Institute 2000 IISI - International Iron & Steel Institute108 IISI electrogalvanised coil BF route IISI - International Iron & Steel Institute 2000 IISI - International Iron & Steel Institute109 IISI engineering steel EAF route IISI - International Iron & Steel Institute 2000 IISI - International Iron & Steel Institute110 IISI Finished cold rolled coil BF route IISI - International Iron & Steel Institute 2000 IISI - International Iron & Steel Institute111 IISI Hot dipped galvanised coil BF route IISI - International Iron & Steel Institute 2000 IISI - International Iron & Steel Institute112 IISI Hot rolled coil BF route IISI - International Iron & Steel Institute 2000 IISI - International Iron & Steel Institute113 IISI Plate BF route IISI - International Iron & Steel Institute 2000 IISI - International Iron & Steel Institute114 IISI section BF route IISI - International Iron & Steel Institute 2000 IISI - International Iron & Steel Institute115 IISI section EAF route IISI - International Iron & Steel Institute 2000 IISI - International Iron & Steel Institute116 IISI Steel pipe BF route IISI - International Iron & Steel Institute 2000 IISI - International Iron & Steel Institute
117 Integrated Pollution Prevention and Control (IPPC) - Reference Document on Best Available Techniques in the Cement and Lime Manufacturing Industries European Comission, IPPC 2001 European Commission
118 Integrated Pollution Prevention and Control; Draft reference document on best available techniques in the ceramic manufacturing industry, draft October 2004 European Commission 2004 European Commission
119 Integrated Pollution Prevention and Control; Draft reference document on best available techniques in the pulp and paper manufacturing industry, December 2001 European Commission 2001 European Commission
120 Kingspan Therma - An Environmental Profile Kingspan 2006 Kingspan121 LCA and Embodied Energy; Some Contentious Issues W R Lawson 1996 Embodied Energy - The Current State of Play, Deakin University, Nov 1996
122 LCA Fact Sheet, Life Cycle Analysis of Clay Brick Housing - Based on a Typical Project Home The Centre for Sustainable Technology, University of Newcastle, Australia 2003 The Centre for Sustainable Technology, University of Newcastle, Australia
123 LCA of Road - A pilot study for inventory analysis Hakan Stripple 2001 IVL Swedish Environmental Research Institute124 Life Cycle Analysis of a Residential Home in Michigan Steven Blanchard and Peter Reppe 1998 Centre for Sustainable Systems, university of Michigan125 Life cycle analysis of wind-fuel cell integrated system F I Kahn, K Hawboldt & M T Iqbal 2005 Renewable Energy, Vol 30, 2005, Pg 157-177126 Life Cycle Analysis of Wood Products: Cradle to Gate LCI of Residential Wood Building Materials Maureen E Puettmann and James B Wilson 2005 Wood and Fibre Science 37, Special CORRIM Issue, 2005, Pg 18-29127 Life cycle assessment environmental profile of cotton and polyester-cotton fabrics Eija M Kalliala & Pertti Nousiainen 1999 AUTEX Research Journal Vol 1, No. 1, 1999128 Life Cycle Assessment for Painting Processes: Putting the VOC Issue in Perspective Ian D Dobson 1995 Progress in Organic Coatings 27, 1996, Pg 55-58129 Life Cycle Assessment of 4 Types of Floor Covering Jose Potting & Korenils Blok 1994 Dept. science, technology and society, Utrecht university130 Life cycle assessment of a wind farm and related externalities L Schleisner 2000 Renewable energy 20, 2000, 279-288
131 Life Cycle Assessment of Flooring Materials: Case Study A. Jonsson, A-M, Tillman, T.Svensson 1995 Building and Environment (Journal) Vol 32, No.3, pg 245-255, 1997, Pergamon, Elsevier.
132 Life Cycle Assessment of Nickel Products Ecobalance for Nickel Industry LCA Group 2000 Ecobalance for Nickel Industry LCA Group133 Life Cycle Assessment of Particleboards and Fibreboards A. Frühwald, J. Hasch 1999 http://www.oekobilanzen-holz.de/
134 Life Cycle Assessment of polyvinyl Chloride and Alternatives: Summary Report for Consultation DEFRA 2001 DEFRA, Web address: http:www.defra.gov.uk/environment/consult/PVC/index2.htm
135 Life Cycle Assessment of PVC and of Principle Competing Materials Martin Baitz, Johannes Kreissig and Eloise Byrne 2004 European Commission
136 Life Cycle Assessment of Road Construction Ulla-Maija Mroueh, Paula Eskola, Jutta Laine-Ylijoki, Kari Wellman et al 2000 FINNRA - Finnish National Road Administration
137 Life Cycle Assessment of Wood Floor Coverings Barbara Nebel, Bernhard Zimmer and Gerd Wegener 2006 International Journal of LCA 11 (3), 2006, Pg 172-182
138 Life cycle CO2 emissions of a photovoltaic/wind/diesel generating system Y Kemmoku, K Ishikawa, S Nakagawa, T Kawamoto & T Sakakibara 2002 Electrical engineering in Japan, Vol 138, No. 2, 2002
139 Life Cycle CO2 Emissions of a Photovoltaic/Wind/Diesel Generating System Yoshishige Kemmoku, Keiko Ishikawa, Shigeyasu Nakagawa, teru Kawamoto 2002 Electrical Engineering in Japan, Vol 1, No 2, 2002
140 Life cycle energy and environmental performance of a new university building modelling challenges and design implications Chris Scheuer, Gregory A. Keoleian, Peter Reppe 2003 Energy and buildings 35, pg 1049-1064
141 Life Cycle Environmental Assessment of Paint Processes Stella Papasavva, Sheila Kia, Joseph Claya, and Raymond Gunther 2002 Journal of Coatings Technology, Vol. 74, No. 925, February 2002
142 life Cycle Impact Assessment of Printing Paper using Non-Wood Pulp and De-inked Pulp Katsuhito Nakazawa, Toru Katsura, Keiichi Katayama, Itaru Yasui 2004 6th International Conference on EcoBalance, Tsukuba, Japan, 25-27 Oct. 2004.
143 Life Cycle Inventory for kraft sack paper Pär Weström & Cathrine Löfgre 2005 CEPI Eurokraft / Eurosac
Ref No. Title Author Year Organisation/Publisher ISBN
REFERENCES
144 Life Cycle inventory of Five Products Produced from Polylactide (PLA) and Petroleum Based Resins - Summary Report Franklin Associates for Athena Institute 2006 Athena Institute International
145 Life Cycle inventory of Five Products Produced from Polylactide (PLA) and Petroleum Based Resins - Technical Report Franklin Associates for Athena Institute 2006 Athena Institute International
146 Life Cycle Inventory of Medium Density Fibreboard Beatriz Rivela, M Teresa Moreira and Gumersindo Feijoo 2007 Int J LCA 12 (3) 143 – 150 (2007)
147 Life Cycle Inventory of Particleboard: A Case Study in the Wood Sector Beatriz Rivela, Almudena Hospido, M Teresa Moreira and Gumersindo Feijoo 2006 International Journal of LCA 11 (2), Pg 106-113
148 Life Cycle Inventory of Slag Cement Concrete Jan R Prusinski, Medgar L Marceau and Martha G VanGeem 2003 Presented at 8th CANMET/ACI international conference in Fly Ash, Silica Fume
and Natural Pozzilans in Concrete
149 Life cycle inventory of the worldwide aluminium industry with regard to energy consumption and emissions of greenhouse gases, paper 1 - automotive International primary aluminium institute 2000 International primary aluminium institute
150 Life cycle of window materials - A comparative assessment M. Asif, A. Davidson & T. Muneer 2002 School of Engineering, Napier University, Edinburgh151 Life Cycle Assessment Data Copper Sheet European Copper Institute 2005 European Copper Institute152 Life Cycle Assessment Data Copper Tube European Copper Institute 2005 European Copper Institute153 Life Cycle Assessment Data Copper Wire European Copper Institute 2005 European Copper Institute154 Lightweight high-performance concrete masonry-block mix design Babrak Amiri, Gary L Krause and Maher K Tadros 1994 ACI Materials Journal, September-October 1994155 Lime Activity CO2 Emissions Factors EULA - European Lime Association 2003 EULA - European Lime Association156 LISA LCA software case study, Nurses Faculty - University of Australia LISA Software 2000 LISA Software, University of Newcastle, Australia157 Low Density polyethylene film LCI Data Summary I Boustead 2005 APME, Association of Plastics Manufacturers in Europe158 Low Density polyethylene film LCI Data Summary in Excel format I Boustead 2005 APME, Association of Plastics Manufacturers in Europe159 Low Density polyethylene LCI Data Summary I Boustead 2005 APME, Association of Plastics Manufacturers in Europe160 Low Density polyethylene LCI Data Summary in Excel format I Boustead 1999 APME, Association of Plastics Manufacturers in Europe
161 Materials, Operational Energy inputs and Net Energy Ratio for Photobiological Hydrogen Production Greg Burgess, Javier Fernandez-Velasco 2006 International Journal of Hydrogen Energy, Article in Press, doi:10.1016/j.ijhydene.2006.10.055
162 Mechanical Properties of Concrete with Recycled Coarse Aggregate Khaldoun Rahal 2007 Building and Environment 42, 2007, Pg 407-415163 Metal Resources and Energy P F Chapman, F Roberts 1983 Butterworth & Co Ltd 408108010164 New Gross Energy Requirement Figures for Material Production E Worrell, R J J van Heijningen et al 1993 Energy Vol 19. No.6 pg 627-640, Pergamon, Elsevier Science Ltd.
165 New Zealand Building Materials Embodied Energy Coefficients Database: Volume II - Coefficients Andrew Alcorn, Peter Wood 1998 Centre for Building Performance Research, Victoria University of Wellington
166 New Zealand Embodied Energy Coefficients George Baird, Andrew Alcorn, Phil Haslam 1997 Centre for Building Performance Research, Victoria University of Wellington
167 Nylon 66 LCI Data Summary in Excel format, APME I Boustead 1999 APME, Association of Plastics Manufacturers in Europe168 Nylon 66 LCI Data Summary, APME I Boustead 1999 APME, Association of Plastics Manufacturers in Europe
169 Planning for sustainable development and construction Somerset Trust for Sustainable Development 2000 Somerset Trust for Sustainable development, Town Hall, Langport, Somerset, TA10 9GR
170 Polyamide 6 (Nylon 6) LCI Data Summary I Boustead 2005 APME, Association of Plastics Manufacturers in Europe171 Polyamide 6 (Nylon 6) LCI Data Summary in Excel I Boustead 2005 APME, Association of Plastics Manufacturers in Europe172 Polyamide 66 (Nylon 66) LCI Data Summary I Boustead 2005 APME, Association of Plastics Manufacturers in Europe173 Polyamide 66 (Nylon 66) LCI Data Summary in Excel I Boustead 2005 APME, Association of Plastics Manufacturers in Europe174 Polycarbonate LCI Data Summary I Boustead 2005 APME, Association of Plastics Manufacturers in Europe175 Polycarbonate LCI Data Summary in Excel format I Boustead 2005 APME, Association of Plastics Manufacturers in Europe176 Polyolefin's I Boustead 2003 APME, Association of Plastics Manufacturers in Europe177 Polypropylene injection moulding LCI Data Summary I Boustead 2005 APME, Association of Plastics Manufacturers in Europe178 Polypropylene injection moulding LCI Data Summary in Excel format I Boustead 1999 APME, Association of Plastics Manufacturers in Europe179 Polypropylene LCI Data Summary I Boustead 2005 APME, Association of Plastics Manufacturers in Europe180 Polypropylene LCI Data Summary in Excel format I Boustead 2005 APME, Association of Plastics Manufacturers in Europe181 Polypropylene orientated film LCI Data Summary I Boustead 2005 APME, Association of Plastics Manufacturers in Europe182 Polypropylene orientated film LCI Data Summary in Excel format I Boustead 2005 APME, Association of Plastics Manufacturers in Europe183 Polystyrene (Expandable)(EPS) LCI Data Summary I Boustead 2006 APME, Association of Plastics Manufacturers in Europe184 Polystyrene (Expandable)(EPS) LCI Data Summary in Excel format I Boustead 2006 APME, Association of Plastics Manufacturers in Europe185 Polystyrene (General Purpose)(GPPS) LCI Data Summary I Boustead 2006 APME, Association of Plastics Manufacturers in Europe186 Polystyrene (General Purpose)(GPPS) LCI Data Summary in Excel format I Boustead 2006 APME, Association of Plastics Manufacturers in Europe187 Polystyrene (High Impact) LCI Data Summary I Boustead 2005 APME, Association of Plastics Manufacturers in Europe188 Polystyrene (High Impact) LCI Data Summary in Excel format I Boustead 2005 APME, Association of Plastics Manufacturers in Europe189 Polyurethane Flexible foam LCI Data Summary I Boustead 2005 APME, Association of Plastics Manufacturers in Europe190 Polyurethane Flexible foam LCI Data Summary in Excel I Boustead 2005 APME, Association of Plastics Manufacturers in Europe191 Polyurethane Rigid foam LCI Data Summary I Boustead 2005 APME, Association of Plastics Manufacturers in Europe192 Polyurethane Rigid foam LCI Data Summary in Excel I Boustead 2005 APME, Association of Plastics Manufacturers in Europe
193 Product Comparisons Method G D Salomonsson & M D Ambrose 1996 CSIRO Building, Construction and Engineering, Melbourne, Australia as appearing in Embodied Energy conference at Deakin University 1996
194 PVC (emulsion polymerised) LCI Data Summary I Boustead 1999 APME, Association of Plastics Manufacturers in Europe195 PVC (emulsion polymerised) LCI Data Summary in Excel I Boustead 1999 APME, Association of Plastics Manufacturers in Europe
Ref No. Title Author Year Organisation/Publisher ISBN
REFERENCES
196 PVC Calendered Sheet LCI Summary Data I Boustead 2005 APME, Association of Plastics Manufacturers in Europe197 PVC Calendered Sheet LCI Summary Data in Excel I Boustead 2005 APME, Association of Plastics Manufacturers in Europe198 PVC Injection Moulding LCI Data Summary I Boustead 2005 APME, Association of Plastics Manufacturers in Europe199 PVC Injection Moulding LCI Data Summary in Excel I Boustead 2005 APME, Association of Plastics Manufacturers in Europe200 PVC pipe LCI data summary I Boustead 2005 APME, Association of Plastics Manufacturers in Europe201 PVC pipe LCI data summary in Excel I Boustead 2005 APME, Association of Plastics Manufacturers in Europe202 PVC Unplasticised Film (UPVC Film) LCI Data Summary I Boustead 2005 APME, Association of Plastics Manufacturers in Europe203 PVC Unplasticised Film (UPVC Film) LCI Data Summary in Excel I Boustead 2005 APME, Association of Plastics Manufacturers in Europe204 Quality based energy contents and carbon coefficients for building materials: A System approach W P S Dias & S P Pooliyadda 2004 Energy 29, 2004, 561-580205 Quantitative assessment of embodied environmental profile of building materials Gong, Zhiqi & Zhang, Zhihui 2004 Journal of Tsinghua university, Vol. 44, No.9206 Quantities for ordering building materials Cement and concrete institute 2006 Cement and Concrete Institute207 Quantity based Energy Contents and Carbon Coefficients for Building Materials: A Systems Approach W P S Dias & S P Pooliyadda 2001 Energy 29, 2004, pg 561-580
208 Report for Life Cycle Assessment for Paper and Packaging Waste Management Scenarios in New South WTim Grant, Karli L. James, Sven Lundie, Kees Sonneveld a 2001 Joint collaboration of Australian Universities, Centre for Design at RMIT University, Victoria University, University of New South Wales
209 Research on lifecycle fixed resources and exhausted carbon dioxide by buildings in Japan Noboru Urushizaki, Takeo Kamioka, Chiaki Kaneko & Sato 1994 Proceedings of the CIB conference on buildings and the environment.210 Rockwool environmental report: The wind of change Rockwool limited 1997 Rockwool Limited211 RT Environmental declaration Cold rolled steel sheet and coils Rautaruukki Oyj; www.ruukki.com 2007 Rautaruukki Oyj; www.ruukki.com212 RT Environmental declaration Colour coated steel sheets and coils Rautaruukki Oyj; www.ruukki.com 2007 Rautaruukki Oyj; www.ruukki.com213 RT Environmental declaration Metal coated steel sheet and coils Rautaruukki Oyj; www.ruukki.com 2007 Rautaruukki Oyj; www.ruukki.com214 RT Environmental declaration Ruukki’s structural hollow sections, steel pipe piles and steel sections Rautaruukki Oyj; www.ruukki.com 2007 Rautaruukki Oyj; www.ruukki.com215 RT Environmental Declaration: External wall element system (Nordicon) Rautaruukki Oyj; www.ruukki.com 2007 Rautaruukki Oyj; www.ruukki.com216 RT Environmental Declaration: Light-weight Sandwich Element System (Panel 3Lock) Rautaruukki Oyj; www.ruukki.com 2007 Rautaruukki Oyj; www.ruukki.com217 RT Environmental Declaration: Rautaruukki Oyj, Hot-rolled frames and bridge structures Rautaruukki Oyj; www.ruukki.com 2007 Rautaruukki Oyj; www.ruukki.com218 RT Environmental Declaration: Rautaruukki Oyj, Roofing sheets and façade claddings (paint coated) Rautaruukki Oyj; www.ruukki.com 2007 Rautaruukki Oyj; www.ruukki.com219 RT Environmental Declaration: Rautaruukki Oyj, Roofing sheets, façade claddings, purlins, framings and coRautaruukki Oyj; www.ruukki.com 2007 Rautaruukki Oyj; www.ruukki.com220 RT-Environmental declaration Hot rolled steel plates, sheet and coils Rautaruukki Oyj; www.ruukki.com 2007 Rautaruukki Oyj; www.ruukki.com221 Sikament 160 Technical data Sheet Sika Limited 2005 Sika Limited222 Sikkens Cetol BL 21 cradle to gate data Imperial College Life Cycle Assessment Group 2003 Akzo Nobel Specialist Coatings223 Sikkens Cetol BL 31 cradle to gate data Imperial College Life Cycle Assessment Group 2003 Akzo Nobel Specialist Coatings224 Sikkens Cetol BL opaque cradle to gate data Imperial College Life Cycle Assessment Group 2003 Akzo Nobel Specialist Coatings225 Sikkens Cetol BL Primer cradle to gate data Imperial College Life Cycle Assessment Group 2003 Akzo Nobel Specialist Coatings226 Sikkens Cetol WF 955 cradle to gate date Imperial College Life Cycle Assessment Group 2003 Akzo Nobel Specialist Coatings227 Sikkens Cetol WP 560 cradle to gate data Imperial College Life Cycle Assessment Group 2003 Akzo Nobel Specialist Coatings228 Sikkens Rubbol WF 380 cradle to gate data Imperial College Life Cycle Assessment Group 2003 Akzo Nobel Specialist Coatings229 Suspension polymerised PVC LCI Data Summary I Boustead 1999 APME, Association of Plastics Manufacturers in Europe230 Suspension polymerised PVC LCI Data Summary in Excel I Boustead 1999 APME, Association of Plastics Manufacturers in Europe231 Sustainability analysis of window frames M Asif, T Muneer & J Kubie 2005 Napier university232 Sustainable homes: Embodied energy in residential property development, A guide for registered social lan Sustainable homes 1999 Sustainable homes, http://www.sustainablehomes.co.uk233 Textile mass balances and product life cycles; Ref S5471 British Textile Technology Group 1999 British Textile Technology Group
234 The Energy Embodied in Building Materials - updated New Zealand coefficients and their significance George Baird, Andrew Alcorn, Phil Haslam 1997 Centre for Building Performance Research, Victoria University of Wellington
235 The European Steel Industry and Climate Change EUROFER, European Confederation of Iron and Steel Ind 2000 EUROFER, European Confederation of Iron and Steel Industries236 The Finnish metals industry and the environment Jyri Seppala, Sirkka Koskela, Matti Melanen, Matti Palperi 2002 Resources conservation and recycling (Journal), Elsevier237 The Future of the European Aluminium Industry: A MARKAL Energy and Material Flow Analysis D J Gielen 1998 ECN-Policy Studies238 The Life Cycle of copper, its co-products and by-products Robert U Ayres, Leslie W Ayres and ingrid Rade 2002 International institute for Environment and Development239 The measure of our sustainability, Report of the world steel industry 2004 International Iron and Steel Institute 2003 IISI, International Iron and Steel Institute240 Thermoformed, Expanded Polystyrene LCI Data Summary I Boustead 2005 APME, Association of Plastics Manufacturers in Europe241 Thermoformed, Expanded Polystyrene LCI Data Summary in Excel format I Boustead 2005 APME, Association of Plastics Manufacturers in Europe242 Timber as a building material - An environmental comparison against synthetic building materials Phil Townsend and Chris Wagner 2002 National Association of Forest Industries Ltd243 Towards the holistic assessment of building performance based on an integrated systems approach Stephane Citherlet 2001 Swiss federal institute of technology
244 What LCA can tell us about the cement industry Steven B. Young, Shannon Turnbul & Andrea Russell 2002 Five winds international; World business council for sustainable development
245 Window and advanced glazing systems life cycle assessment Stephane Citerlet, Francesca Di Gulielmo & Jean-Bernard 2000 Energy & Buildings 32 pg 225-234246 Wood based building materials and atmospheric carbon emissions Andrew H. Buchanan & S. Bry Levine 1999 Environmental Science & Policy 2 (1999) 427±437247 World steel life cycle inventory - IISI methodology report IISI - International Iron & Steel Institute 2000 IISI - International Iron & Steel Institute