71
Inventory of Total Rewards Programs & Practices A Report by WorldatWork, Underwritten by Compdata Surveys & Consulting January 2017
Inventory of Total Rewards Programs & Practices
A Report by WorldatWork, Underwritten by Compdata Surveys & Consulting
January 2017
About WorldatWork®
The Total Rewards AssociationWorldatWork (www.worldatwork.org) is a nonprofit human resources association forprofessionals and organizations focused on compensation, benefits, work-life effec-tiveness and total rewards — strategies to attract, motivate and retain an engaged andproductive workforce. WorldatWork and its affiliates provide comprehensive education,certification, research, advocacy and community, enhancing careers of professionalsand, ultimately, achieving better results for the organizations they serve. WorldatWorkhas more than 70,000 members and subscribers worldwide; 80 percent of Fortune 500companies employ a WorldatWork member. Founded in 1955, WorldatWork is affiliatedwith more than 70 local human resources associations and has offices in Scottsdale,Ariz., and Washington, D.C.
WorldatWork Society of Certified Professionals® is the certifying body for eight presti-gious designations: the Certified Compensation Professional® (CCP®), AdvancedCertified Compensation Professional (ACCP)™, Master Certified CompensationProfessional (MCCP)™, Certified Benefits Professional® (CBP), Global RemunerationProfessional (GRP®), Work-Life Certified Professional® (WLCP®), Certified SalesCompensation Professional (CSCP)™ and Certified Executive CompensationProfessional (CECP)™.
The WorldatWork group of registered marks also includes: Alliance for Work-LifeProgress or AWLP, workspan andWorldatWork Journal.
Contact:
WorldatWork Customer Relationship
Services
14040 N. Northsight Blvd.
Scottsdale, Arizona USA
85260-3601
877-951-9191 (United States and
Canada) or +1 480-922-2020 (other
countries)
Fax: 866-816-2962 (United States and
Canada) or +1 480-483-8352 (other
countries)
©2017 WorldatWorkAny laws, regulations or other legal requirements noted in this publication are, to the best of the publisher’s knowledge, accurate and current as of this report’spublishing date. WorldatWork is providing this information with the understanding that WorldatWork is not engaged, directly or by implication, in rendering legal,accounting or other related professional services. You are urged to consult with an attorney, accountant or other qualified professional concerning your ownspecific situation and any questions that you may have related to that.
No portion of this publication may be reproduced in any form without express written permission from WorldatWork.
About Compdata Surveys & Consulting: Where Data Meets Design.Compdata provides HR professionals with the compensation tools they need to staycompetitive. With our extensive pay and benefits database and experiencedcompensation consultants, we are a full-service firm providing innovative solutions tothe most complex compensation challenges.
We conduct salary surveys across a wide range of industries including banking andfinance; colleges and universities; health care; high tech; hospitality; insurance; legal;manufacturing and distribution; not-for-profit; services; and utilities. Our databasecontains information from more than 40,000 employers, and includes pay practicesand benefits. If you are tackling a more complex compensation challenge, ourconsultants have a wealth of expertise and experience. We specialize in tailoringprojects to your needs, and services include total rewards strategies, market reviews,job descriptions, base pay program design, executive compensation, variable payplan design and benefits program analysis.
Inventory of Total Rewards Programs & Practices WorldatWork 1
Introduction and Methodology
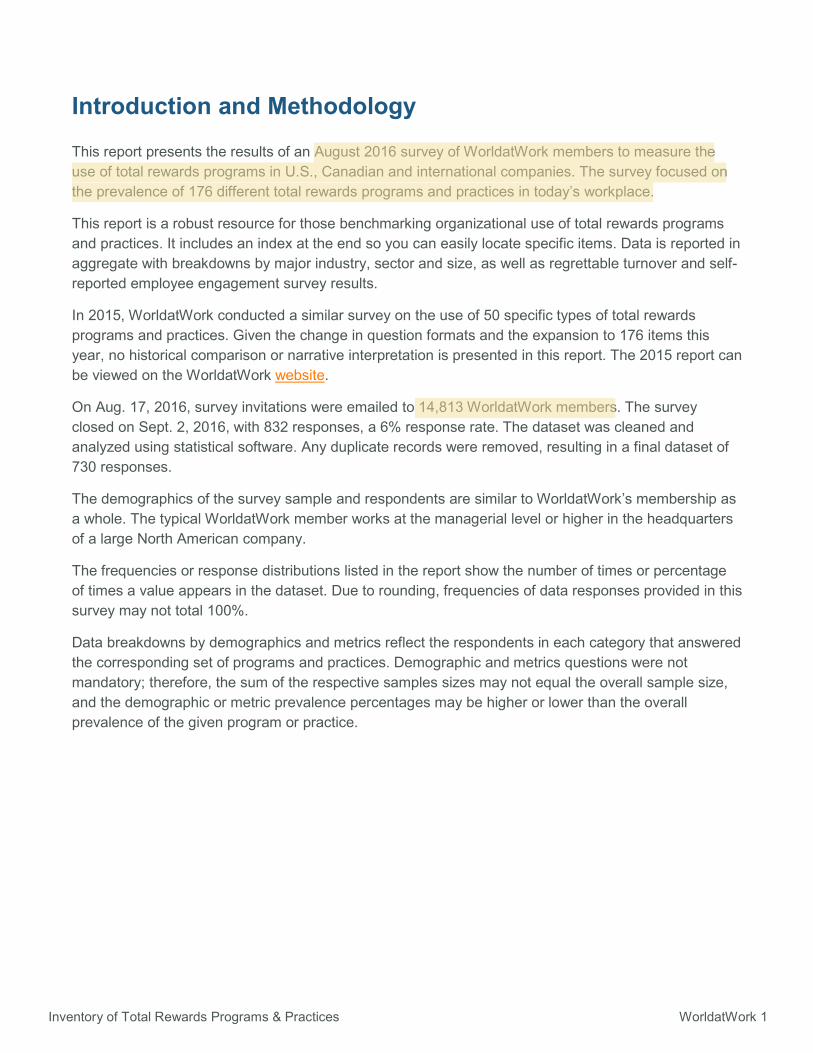
This report presents the results of an August 2016 survey of WorldatWork members to measure the use of total rewards programs in U.S., Canadian and international companies. The survey focused on the prevalence of 176 different total rewards programs and practices in today’s workplace.
This report is a robust resource for those benchmarking organizational use of total rewards programs and practices. It includes an index at the end so you can easily locate specific items. Data is reported in aggregate with breakdowns by major industry, sector and size, as well as regrettable turnover and self-reported employee engagement survey results.
In 2015, WorldatWork conducted a similar survey on the use of 50 specific types of total rewards programs and practices. Given the change in question formats and the expansion to 176 items this year, no historical comparison or narrative interpretation is presented in this report. The 2015 report can be viewed on the WorldatWork website.
On Aug. 17, 2016, survey invitations were emailed to 14,813 WorldatWork members. The survey closed on Sept. 2, 2016, with 832 responses, a 6% response rate. The dataset was cleaned and analyzed using statistical software. Any duplicate records were removed, resulting in a final dataset of 730 responses.
The demographics of the survey sample and respondents are similar to WorldatWork’s membership as a whole. The typical WorldatWork member works at the managerial level or higher in the headquarters of a large North American company.
The frequencies or response distributions listed in the report show the number of times or percentage of times a value appears in the dataset. Due to rounding, frequencies of data responses provided in this survey may not total 100%.
Data breakdowns by demographics and metrics reflect the respondents in each category that answered the corresponding set of programs and practices. Demographic and metrics questions were not mandatory; therefore, the sum of the respective samples sizes may not equal the overall sample size, and the demographic or metric prevalence percentages may be higher or lower than the overall prevalence of the given program or practice.
Inventory of Total Rewards Programs & Practices WorldatWork 2
Table of Contents Introduction and Methodology............................................................................................................ 1
Demographics ...................................................................................................................................... 3
Figure 1: Organization size................................................................................................................. 3
Figure 2: Total revenue ...................................................................................................................... 3
Figure 3: Workforce composition ........................................................................................................ 4
Figure 4: Country ............................................................................................................................... 4
Figure 4a: Number of Countries ......................................................................................................... 5
Figure 5: Industry ............................................................................................................................... 5
Figure 6: U.S. organizational unit ....................................................................................................... 6
Figure 7: Sector .................................................................................................................................. 6
Metrics .................................................................................................................................................. 7
Figure 8: Voluntary turnover ............................................................................................................... 7
Figure 9: Tracking of regrettable turnover ........................................................................................... 7
Figure 9a: Regrettable turnover .......................................................................................................... 8
Figure 10: Labor cost ......................................................................................................................... 8
Figure 11: Employee engagement ...................................................................................................... 9
Results and Analysis ......................................................................................................................... 10
Program Use by Organization Size (Number of Employees) ............................................................ 10
Program Use by Industry .................................................................................................................. 20
Program Use by Sector .................................................................................................................... 31
Program Use by Level of Employee Engagement ............................................................................ 41
Program Use by Regrettable Turnover ............................................................................................. 51
Health and Wellness Program Delivery to Employees (by Provider Options) ................................... 60
Definitions .......................................................................................................................................... 62
Participating Organizations .............................................................................................................. 63
Index ................................................................................................................................................... 66
Inventory of Total Rewards Programs & Practices WorldatWork 3
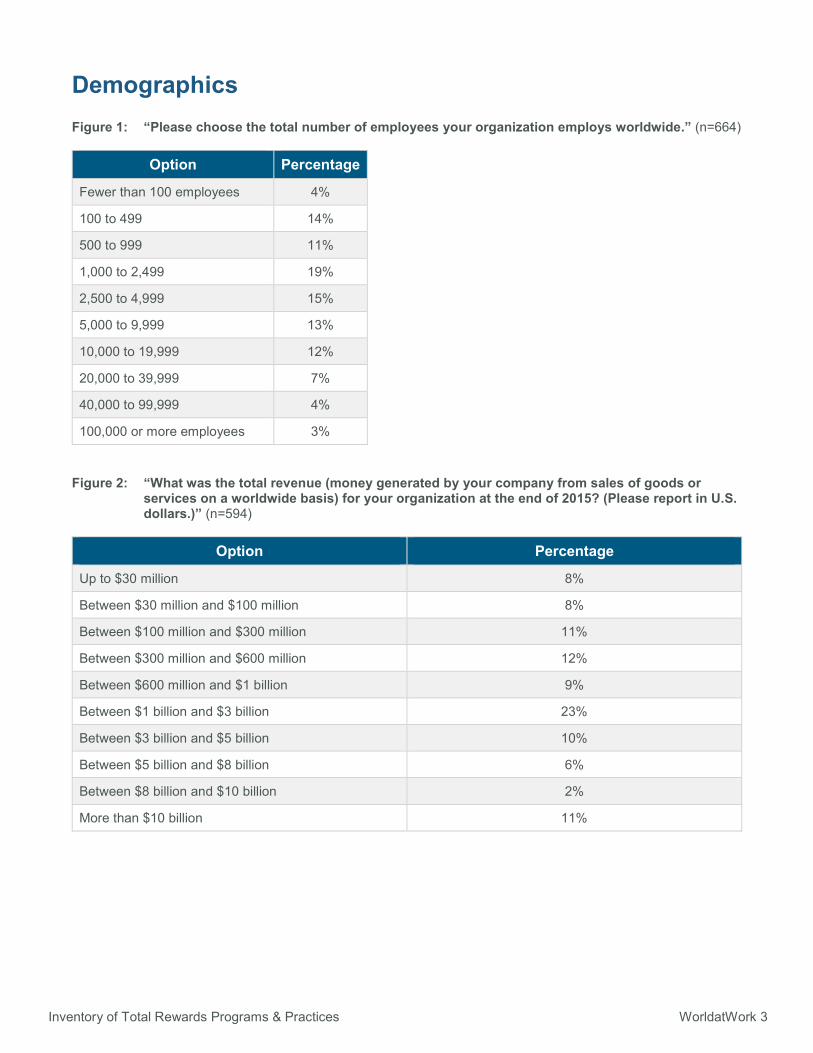
Demographics Figure 1: “Please choose the total number of employees your organization employs worldwide.” (n=664)
Option Percentage
Fewer than 100 employees 4%
100 to 499 14%
500 to 999 11%
1,000 to 2,499 19%
2,500 to 4,999 15%
5,000 to 9,999 13%
10,000 to 19,999 12%
20,000 to 39,999 7%
40,000 to 99,999 4%
100,000 or more employees 3% Figure 2: “What was the total revenue (money generated by your company from sales of goods or
services on a worldwide basis) for your organization at the end of 2015? (Please report in U.S. dollars.)” (n=594)
Option Percentage
Up to $30 million 8%
Between $30 million and $100 million 8%
Between $100 million and $300 million 11%
Between $300 million and $600 million 12%
Between $600 million and $1 billion 9%
Between $1 billion and $3 billion 23%
Between $3 billion and $5 billion 10%
Between $5 billion and $8 billion 6%
Between $8 billion and $10 billion 2%
More than $10 billion 11%
Inventory of Total Rewards Programs & Practices WorldatWork 4
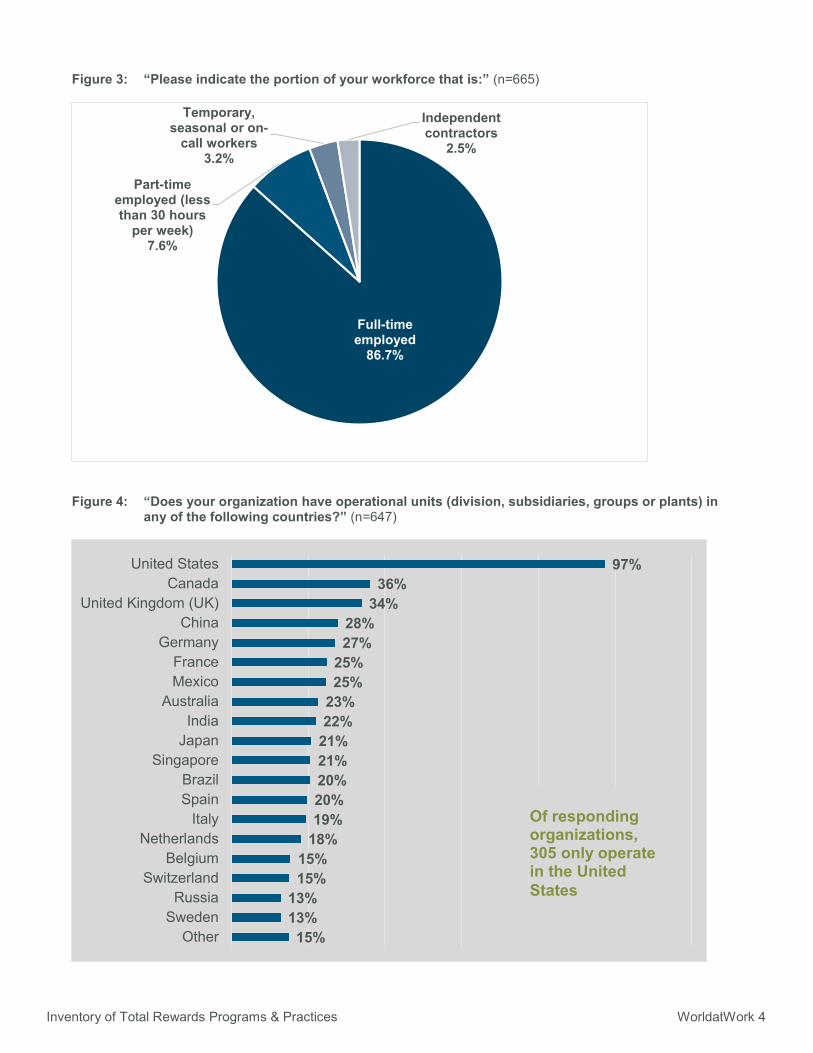
Figure 3: “Please indicate the portion of your workforce that is:” (n=665)
Figure 4: “Does your organization have operational units (division, subsidiaries, groups or plants) in
any of the following countries?” (n=647)
Full-time employed
86.7%
Part-time employed (less than 30 hours
per week)7.6%
Temporary, seasonal or on-
call workers3.2%
Independent contractors
2.5%
97%36%
34%28%27%
25%25%
23%22%
21%21%20%20%19%
18%15%15%
13%13%15%
United StatesCanada
United Kingdom (UK)China
GermanyFranceMexico
AustraliaIndia
JapanSingapore
BrazilSpain
ItalyNetherlands
BelgiumSwitzerland
RussiaSweden
Other
Of responding organizations, 305 only operate in the United States
Inventory of Total Rewards Programs & Practices WorldatWork 5
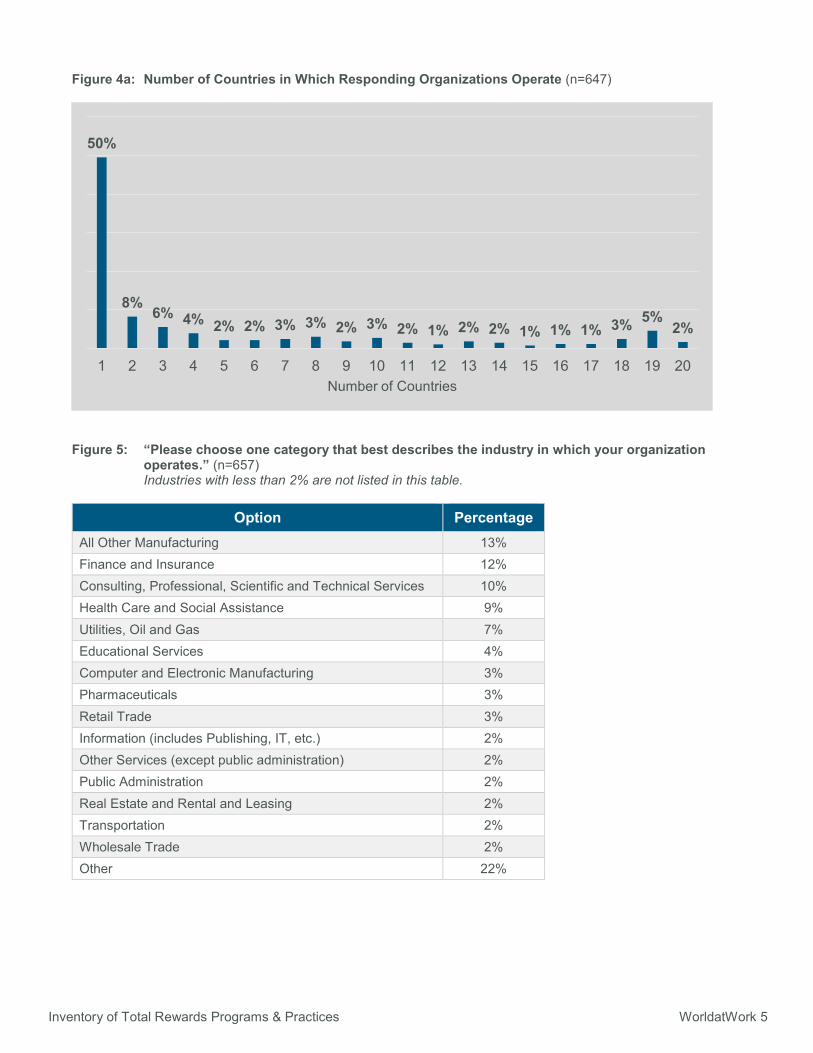
Figure 4a: Number of Countries in Which Responding Organizations Operate (n=647)
Figure 5: “Please choose one category that best describes the industry in which your organization
operates.” (n=657) Industries with less than 2% are not listed in this table.
Option Percentage All Other Manufacturing 13% Finance and Insurance 12% Consulting, Professional, Scientific and Technical Services 10% Health Care and Social Assistance 9% Utilities, Oil and Gas 7% Educational Services 4% Computer and Electronic Manufacturing 3% Pharmaceuticals 3% Retail Trade 3% Information (includes Publishing, IT, etc.) 2% Other Services (except public administration) 2% Public Administration 2% Real Estate and Rental and Leasing 2% Transportation 2% Wholesale Trade 2% Other 22%
50%
8%6% 4% 2% 2% 3% 3% 2% 3% 2% 1% 2% 2% 1% 1% 1% 3% 5%
2%
1 2 3 4 5 6 7 8 9 10 11 12 13 14 15 16 17 18 19 20Number of Countries
Inventory of Total Rewards Programs & Practices WorldatWork 6
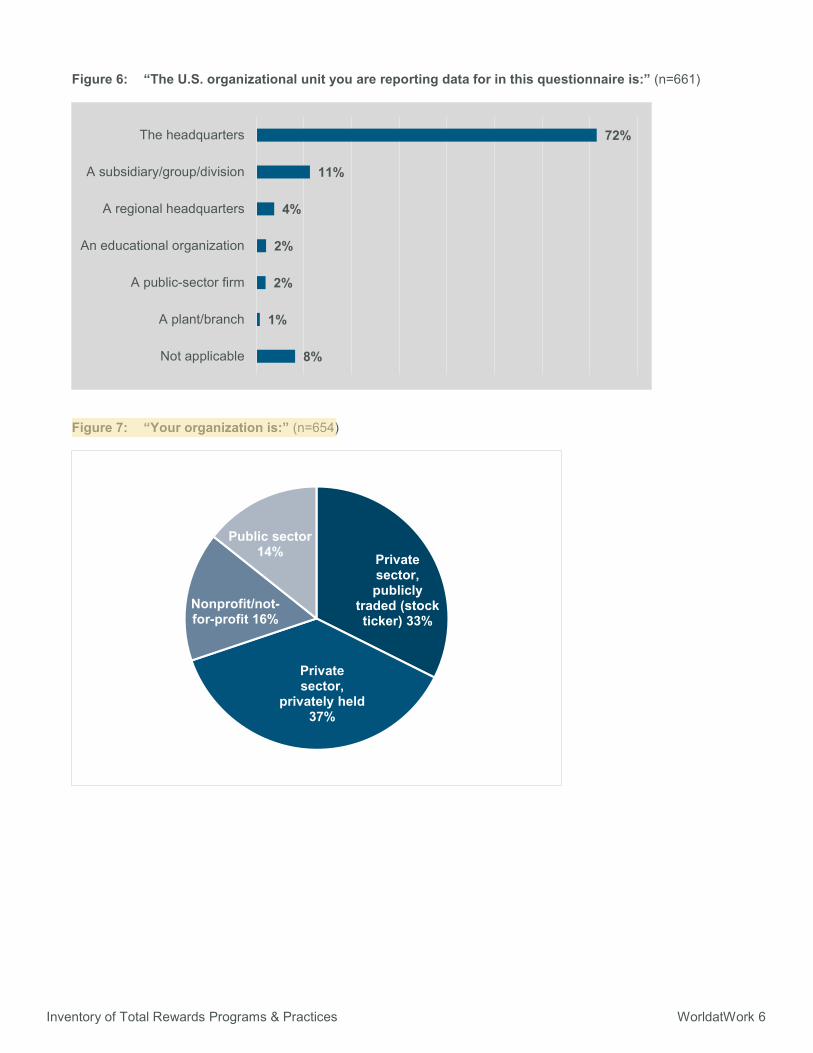
Figure 6: “The U.S. organizational unit you are reporting data for in this questionnaire is:” (n=661)
Figure 7: “Your organization is:” (n=654)
72%
11%
4%
2%
2%
1%
8%
The headquarters
A subsidiary/group/division
A regional headquarters
An educational organization
A public-sector firm
A plant/branch
Not applicable
Private sector, publicly
traded (stock ticker) 33%
Private sector,
privately held37%
Nonprofit/not-for-profit 16%
Public sector14%
Inventory of Total Rewards Programs & Practices WorldatWork 7
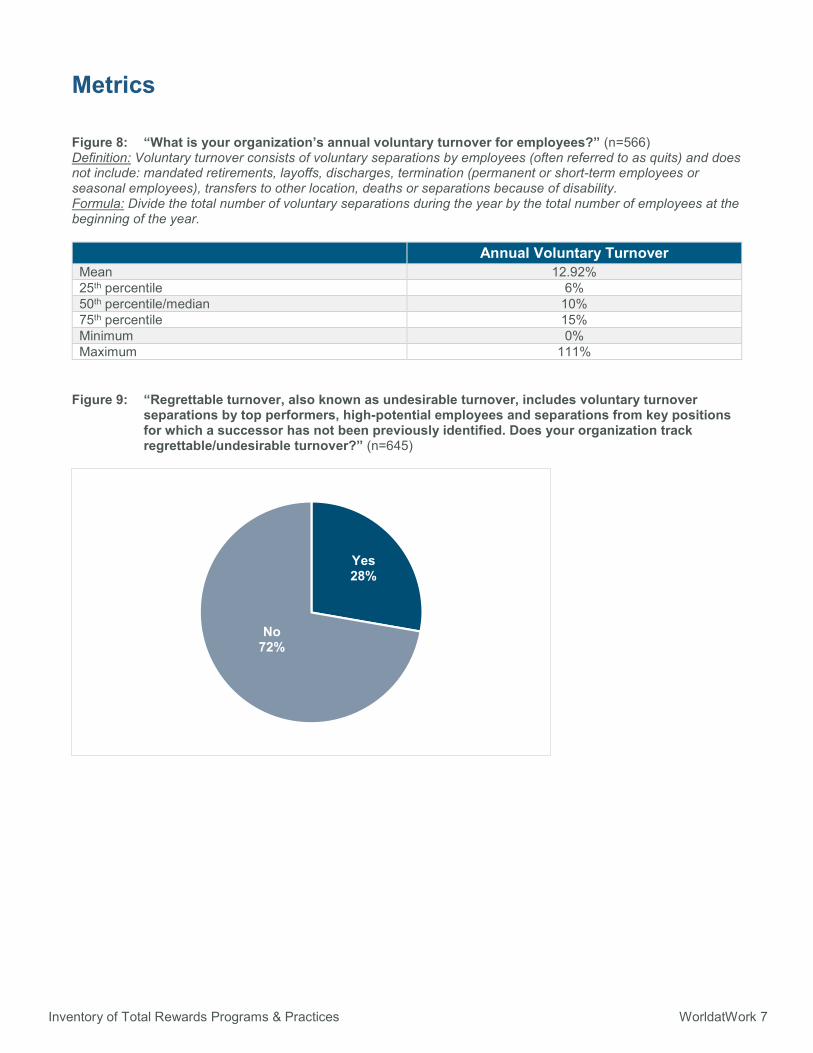
Metrics Figure 8: “What is your organization’s annual voluntary turnover for employees?” (n=566) Definition: Voluntary turnover consists of voluntary separations by employees (often referred to as quits) and does not include: mandated retirements, layoffs, discharges, termination (permanent or short-term employees or seasonal employees), transfers to other location, deaths or separations because of disability. Formula: Divide the total number of voluntary separations during the year by the total number of employees at the beginning of the year.
Annual Voluntary Turnover Mean 12.92% 25th percentile 6% 50th percentile/median 10% 75th percentile 15% Minimum 0% Maximum 111%
Figure 9: “Regrettable turnover, also known as undesirable turnover, includes voluntary turnover
separations by top performers, high-potential employees and separations from key positions for which a successor has not been previously identified. Does your organization track regrettable/undesirable turnover?” (n=645)
Yes28%
No72%
Inventory of Total Rewards Programs & Practices WorldatWork 8
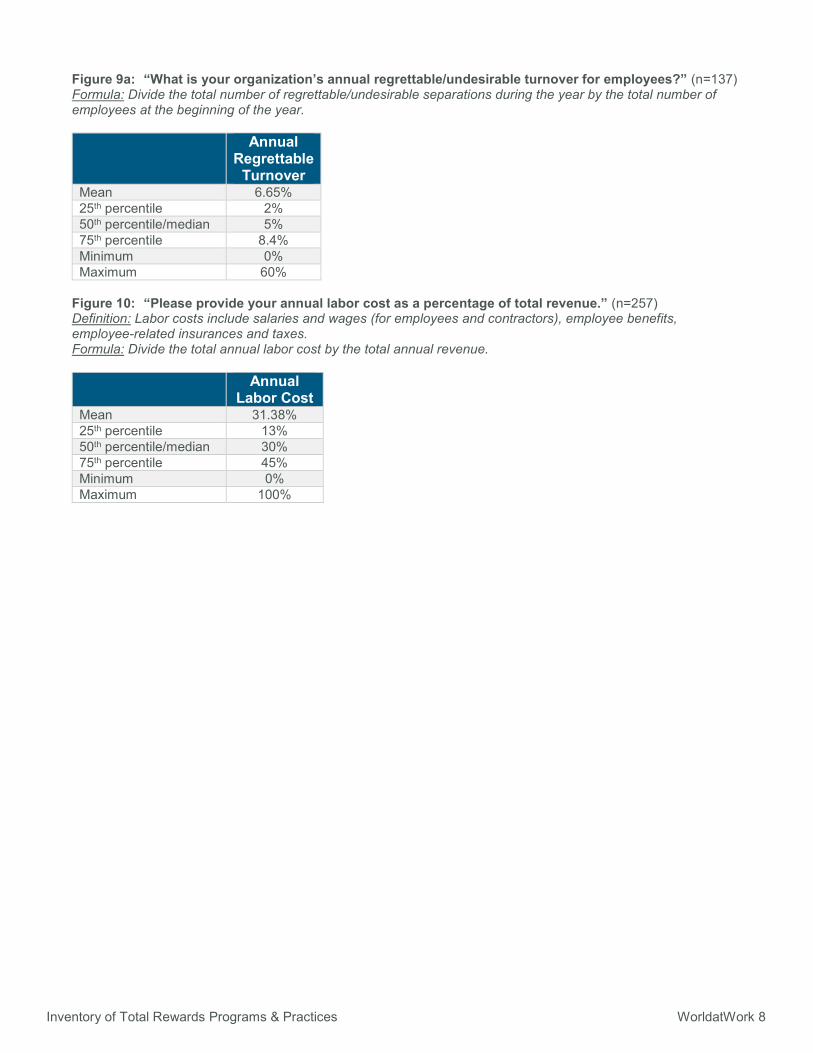
Figure 9a: “What is your organization’s annual regrettable/undesirable turnover for employees?” (n=137) Formula: Divide the total number of regrettable/undesirable separations during the year by the total number of employees at the beginning of the year.
Annual
Regrettable Turnover
Mean 6.65% 25th percentile 2% 50th percentile/median 5% 75th percentile 8.4% Minimum 0% Maximum 60%
Figure 10: “Please provide your annual labor cost as a percentage of total revenue.” (n=257) Definition: Labor costs include salaries and wages (for employees and contractors), employee benefits, employee-related insurances and taxes. Formula: Divide the total annual labor cost by the total annual revenue.
Annual Labor Cost
Mean 31.38% 25th percentile 13% 50th percentile/median 30% 75th percentile 45% Minimum 0% Maximum 100%
Inventory of Total Rewards Programs & Practices WorldatWork 9
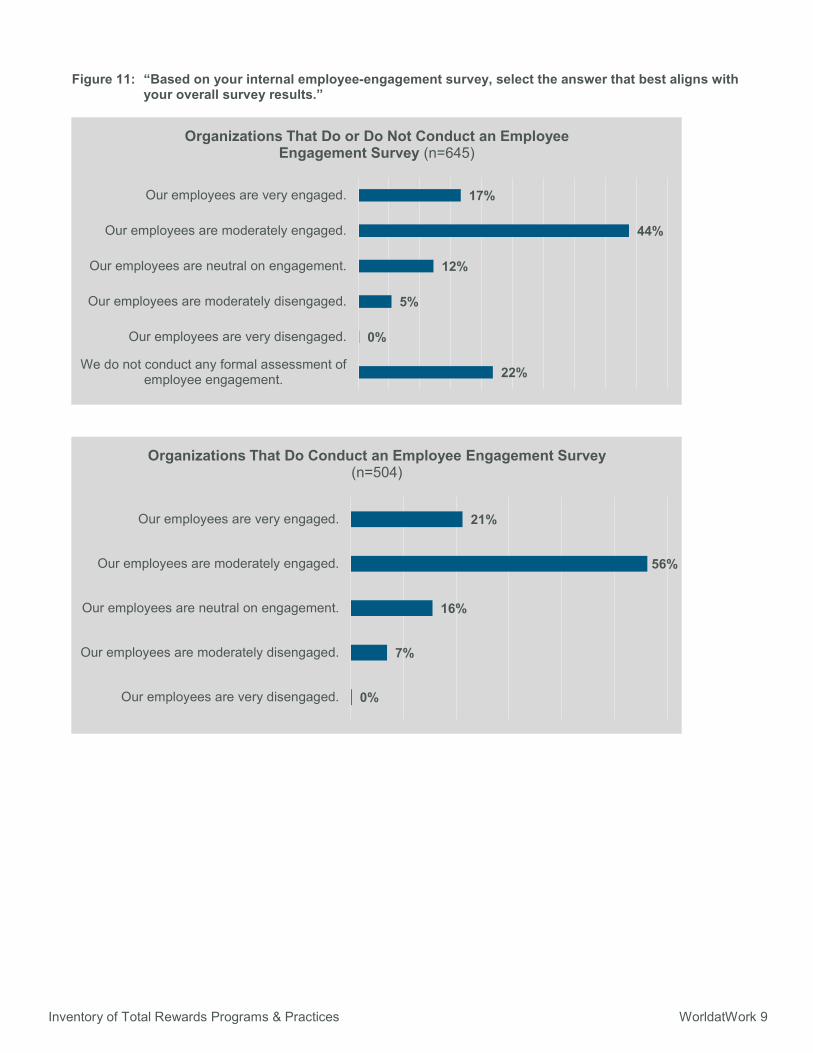
Figure 11: “Based on your internal employee-engagement survey, select the answer that best aligns with your overall survey results.”
17%
44%
12%
5%
0%
22%
Our employees are very engaged.
Our employees are moderately engaged.
Our employees are neutral on engagement.
Our employees are moderately disengaged.
Our employees are very disengaged.
We do not conduct any formal assessment ofemployee engagement.
Organizations That Do or Do Not Conduct an Employee Engagement Survey (n=645)
21%
56%
16%
7%
0%
Our employees are very engaged.
Our employees are moderately engaged.
Our employees are neutral on engagement.
Our employees are moderately disengaged.
Our employees are very disengaged.
Organizations That Do Conduct an Employee Engagement Survey (n=504)
Inventory of Total Rewards Programs & Practices WorldatWork 10
Results and Analysis
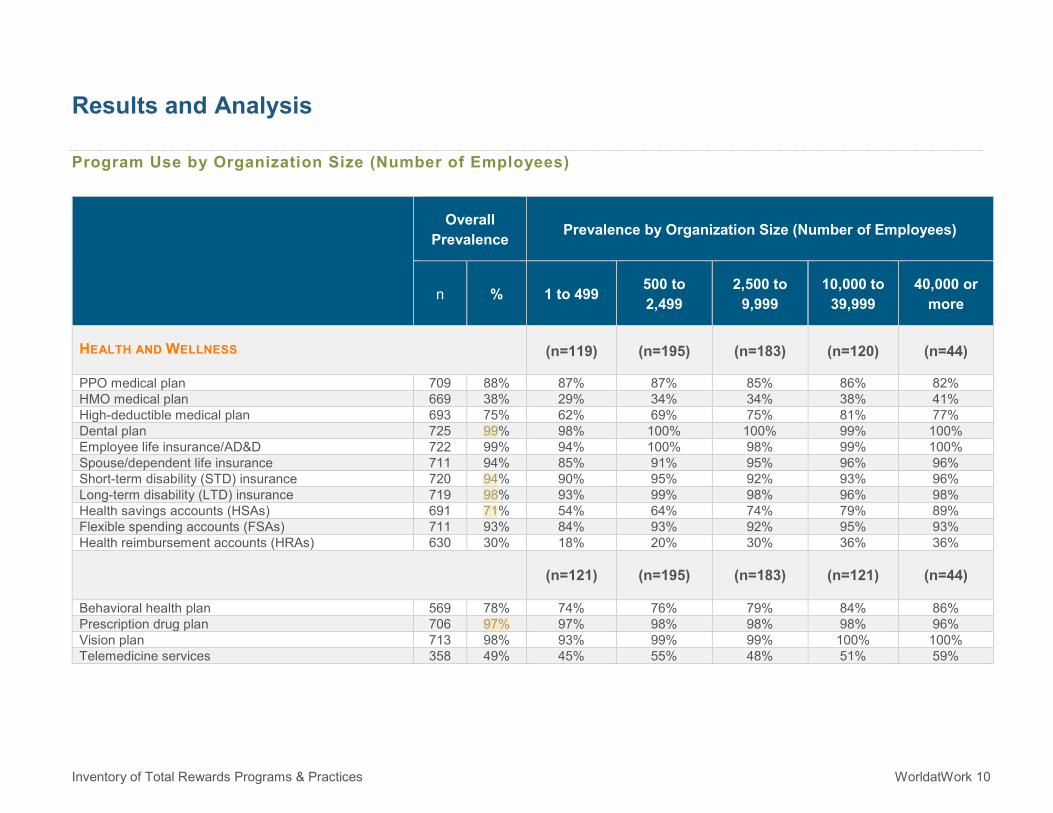
Program Use by Organization Size (Number of Employees)
Overall Prevalence Prevalence by Organization Size (Number of Employees)
n % 1 to 499 500 to 2,499
2,500 to 9,999
10,000 to 39,999
40,000 or more
HEALTH AND WELLNESS (n=119) (n=195) (n=183) (n=120) (n=44)
PPO medical plan 709 88% 87% 87% 85% 86% 82% HMO medical plan 669 38% 29% 34% 34% 38% 41% High-deductible medical plan 693 75% 62% 69% 75% 81% 77% Dental plan 725 99% 98% 100% 100% 99% 100% Employee life insurance/AD&D 722 99% 94% 100% 98% 99% 100% Spouse/dependent life insurance 711 94% 85% 91% 95% 96% 96% Short-term disability (STD) insurance 720 94% 90% 95% 92% 93% 96% Long-term disability (LTD) insurance 719 98% 93% 99% 98% 96% 98% Health savings accounts (HSAs) 691 71% 54% 64% 74% 79% 89% Flexible spending accounts (FSAs) 711 93% 84% 93% 92% 95% 93% Health reimbursement accounts (HRAs) 630 30% 18% 20% 30% 36% 36%
(n=121) (n=195) (n=183) (n=121) (n=44)
Behavioral health plan 569 78% 74% 76% 79% 84% 86% Prescription drug plan 706 97% 97% 98% 98% 98% 96% Vision plan 713 98% 93% 99% 99% 100% 100% Telemedicine services 358 49% 45% 55% 48% 51% 59%
Inventory of Total Rewards Programs & Practices WorldatWork 11
Overall Prevalence Prevalence by Organization Size (Number of Employees)
n % 1 to 499 500 to 2,499
2,500 to 9,999
10,000 to 39,999
40,000 or more
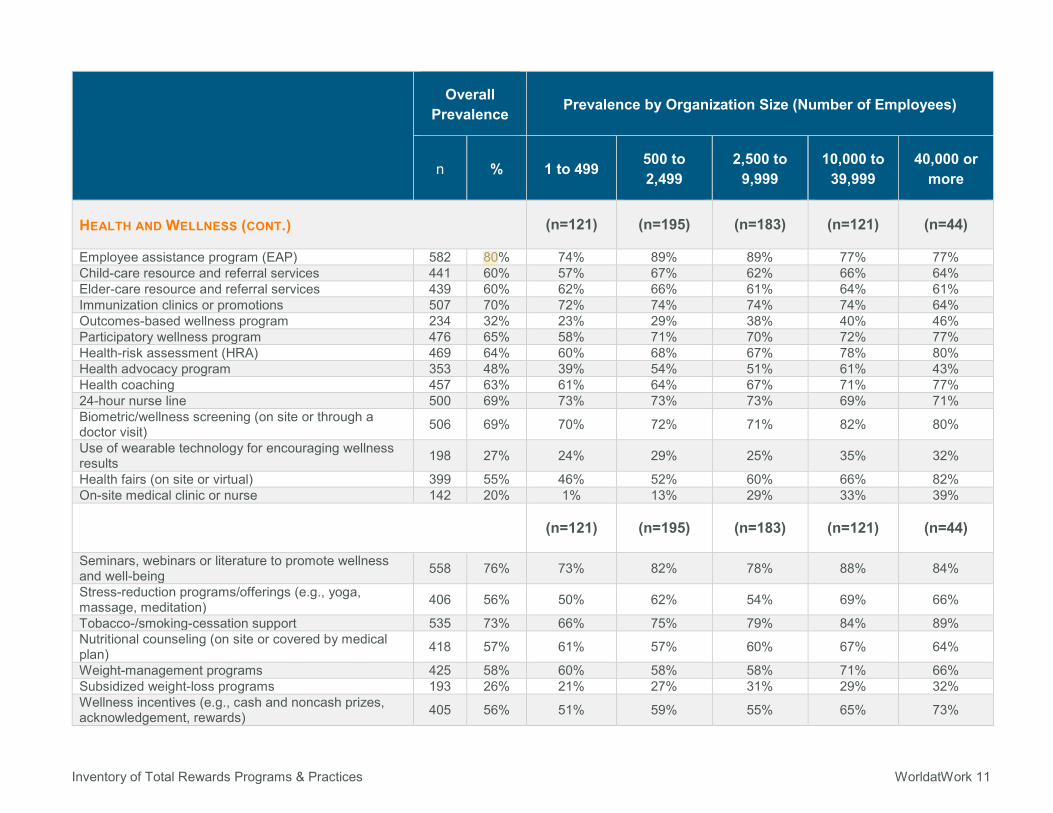
HEALTH AND WELLNESS (CONT.) (n=121) (n=195) (n=183) (n=121) (n=44)
Employee assistance program (EAP) 582 80% 74% 89% 89% 77% 77% Child-care resource and referral services 441 60% 57% 67% 62% 66% 64% Elder-care resource and referral services 439 60% 62% 66% 61% 64% 61% Immunization clinics or promotions 507 70% 72% 74% 74% 74% 64% Outcomes-based wellness program 234 32% 23% 29% 38% 40% 46% Participatory wellness program 476 65% 58% 71% 70% 72% 77% Health-risk assessment (HRA) 469 64% 60% 68% 67% 78% 80% Health advocacy program 353 48% 39% 54% 51% 61% 43% Health coaching 457 63% 61% 64% 67% 71% 77% 24-hour nurse line 500 69% 73% 73% 73% 69% 71% Biometric/wellness screening (on site or through a doctor visit) 506 69% 70% 72% 71% 82% 80%
Use of wearable technology for encouraging wellness results 198 27% 24% 29% 25% 35% 32%
Health fairs (on site or virtual) 399 55% 46% 52% 60% 66% 82% On-site medical clinic or nurse 142 20% 1% 13% 29% 33% 39%
(n=121) (n=195) (n=183) (n=121) (n=44)
Seminars, webinars or literature to promote wellness and well-being 558 76% 73% 82% 78% 88% 84%
Stress-reduction programs/offerings (e.g., yoga, massage, meditation) 406 56% 50% 62% 54% 69% 66%
Tobacco-/smoking-cessation support 535 73% 66% 75% 79% 84% 89% Nutritional counseling (on site or covered by medical plan) 418 57% 61% 57% 60% 67% 64%
Weight-management programs 425 58% 60% 58% 58% 71% 66% Subsidized weight-loss programs 193 26% 21% 27% 31% 29% 32% Wellness incentives (e.g., cash and noncash prizes, acknowledgement, rewards) 405 56% 51% 59% 55% 65% 73%
Inventory of Total Rewards Programs & Practices WorldatWork 12
Overall Prevalence Prevalence by Organization Size (Number of Employees)
n % 1 to 499 500 to 2,499
2,500 to 9,999
10,000 to 39,999
40,000 or more
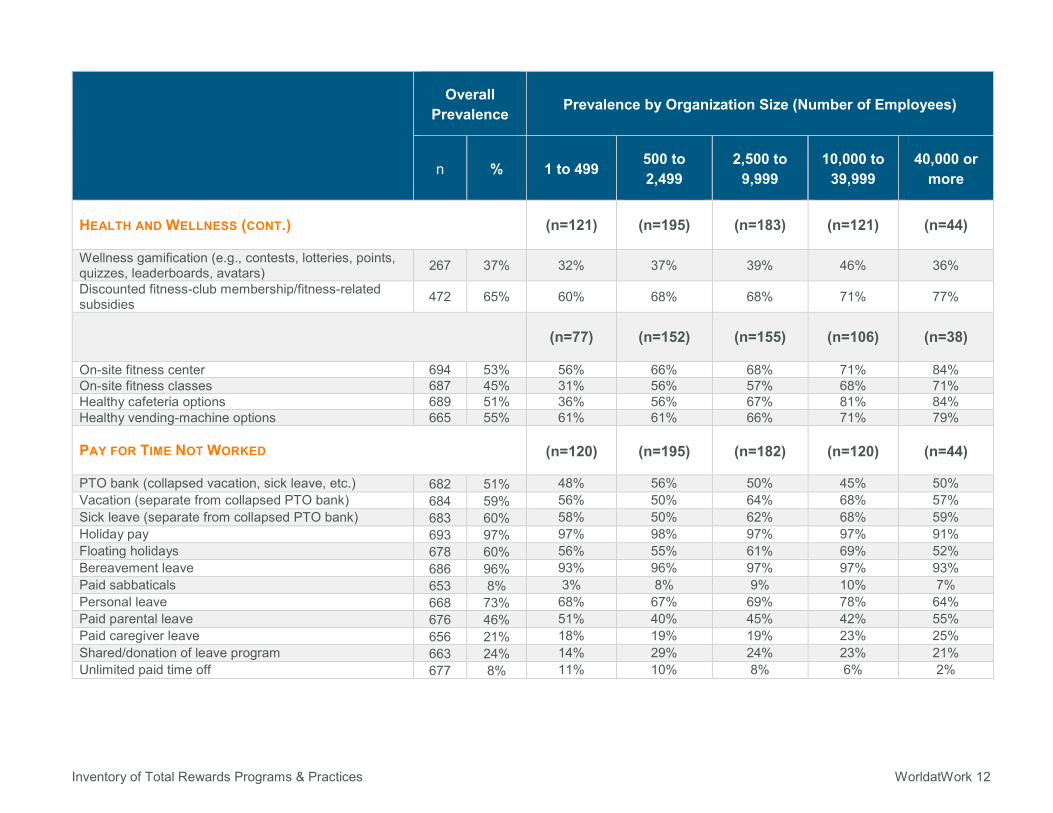
HEALTH AND WELLNESS (CONT.) (n=121) (n=195) (n=183) (n=121) (n=44)
Wellness gamification (e.g., contests, lotteries, points, quizzes, leaderboards, avatars) 267 37% 32% 37% 39% 46% 36%
Discounted fitness-club membership/fitness-related subsidies 472 65% 60% 68% 68% 71% 77%
(n=77) (n=152) (n=155) (n=106) (n=38)
On-site fitness center 694 53% 56% 66% 68% 71% 84% On-site fitness classes 687 45% 31% 56% 57% 68% 71% Healthy cafeteria options 689 51% 36% 56% 67% 81% 84% Healthy vending-machine options 665 55% 61% 61% 66% 71% 79%
PAY FOR TIME NOT WORKED (n=120) (n=195) (n=182) (n=120) (n=44)
PTO bank (collapsed vacation, sick leave, etc.) 682 51% 48% 56% 50% 45% 50% Vacation (separate from collapsed PTO bank) 684 59% 56% 50% 64% 68% 57% Sick leave (separate from collapsed PTO bank) 683 60% 58% 50% 62% 68% 59% Holiday pay 693 97% 97% 98% 97% 97% 91% Floating holidays 678 60% 56% 55% 61% 69% 52% Bereavement leave 686 96% 93% 96% 97% 97% 93% Paid sabbaticals 653 8% 3% 8% 9% 10% 7% Personal leave 668 73% 68% 67% 69% 78% 64% Paid parental leave 676 46% 51% 40% 45% 42% 55% Paid caregiver leave 656 21% 18% 19% 19% 23% 25% Shared/donation of leave program 663 24% 14% 29% 24% 23% 21% Unlimited paid time off 677 8% 11% 10% 8% 6% 2%
Inventory of Total Rewards Programs & Practices WorldatWork 13
Overall Prevalence Prevalence by Organization Size (Number of Employees)
n % 1 to 499 500 to 2,499
2,500 to 9,999
10,000 to 39,999
40,000 or more
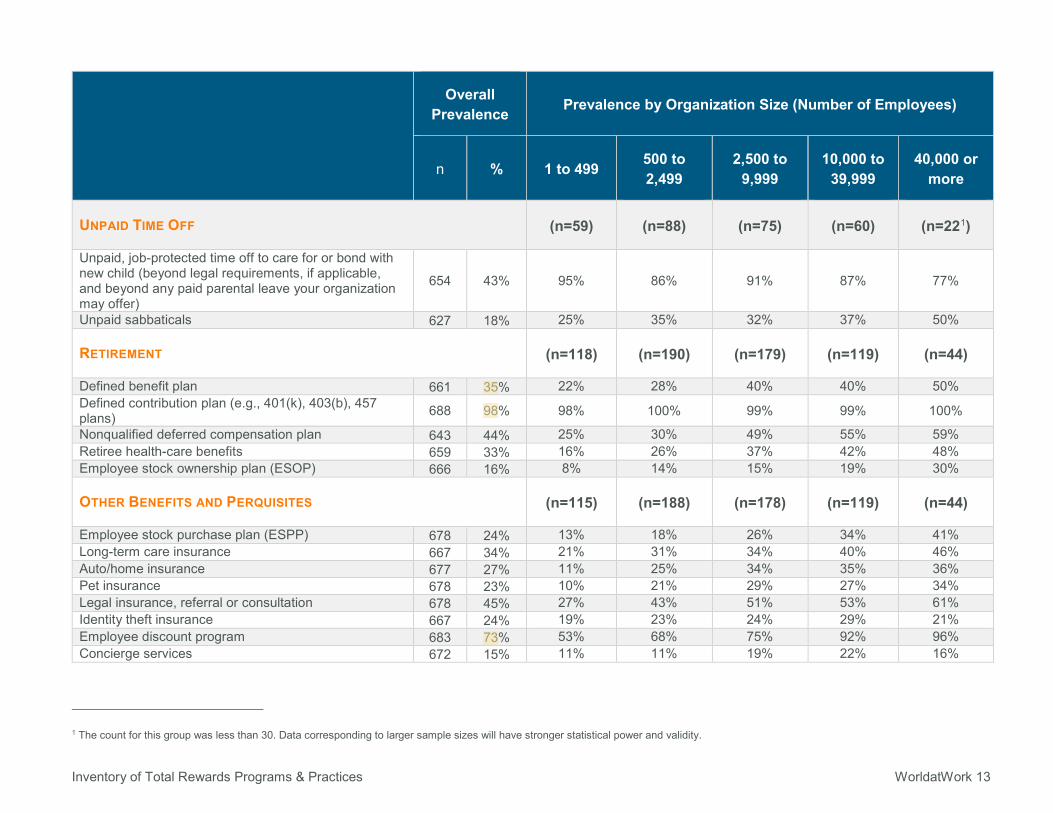
UNPAID TIME OFF (n=59) (n=88) (n=75) (n=60) (n=221)
Unpaid, job-protected time off to care for or bond with new child (beyond legal requirements, if applicable, and beyond any paid parental leave your organization may offer)
654 43% 95% 86% 91% 87% 77%
Unpaid sabbaticals 627 18% 25% 35% 32% 37% 50%
RETIREMENT (n=118) (n=190) (n=179) (n=119) (n=44)
Defined benefit plan 661 35% 22% 28% 40% 40% 50% Defined contribution plan (e.g., 401(k), 403(b), 457 plans) 688 98% 98% 100% 99% 99% 100%
Nonqualified deferred compensation plan 643 44% 25% 30% 49% 55% 59% Retiree health-care benefits 659 33% 16% 26% 37% 42% 48% Employee stock ownership plan (ESOP) 666 16% 8% 14% 15% 19% 30%
OTHER BENEFITS AND PERQUISITES (n=115) (n=188) (n=178) (n=119) (n=44)
Employee stock purchase plan (ESPP) 678 24% 13% 18% 26% 34% 41% Long-term care insurance 667 34% 21% 31% 34% 40% 46% Auto/home insurance 677 27% 11% 25% 34% 35% 36% Pet insurance 678 23% 10% 21% 29% 27% 34% Legal insurance, referral or consultation 678 45% 27% 43% 51% 53% 61% Identity theft insurance 667 24% 19% 23% 24% 29% 21% Employee discount program 683 73% 53% 68% 75% 92% 96% Concierge services 672 15% 11% 11% 19% 22% 16%
1 The count for this group was less than 30. Data corresponding to larger sample sizes will have stronger statistical power and validity.
Inventory of Total Rewards Programs & Practices WorldatWork 14
Overall Prevalence Prevalence by Organization Size (Number of Employees)
n % 1 to 499 500 to 2,499
2,500 to 9,999
10,000 to 39,999
40,000 or more
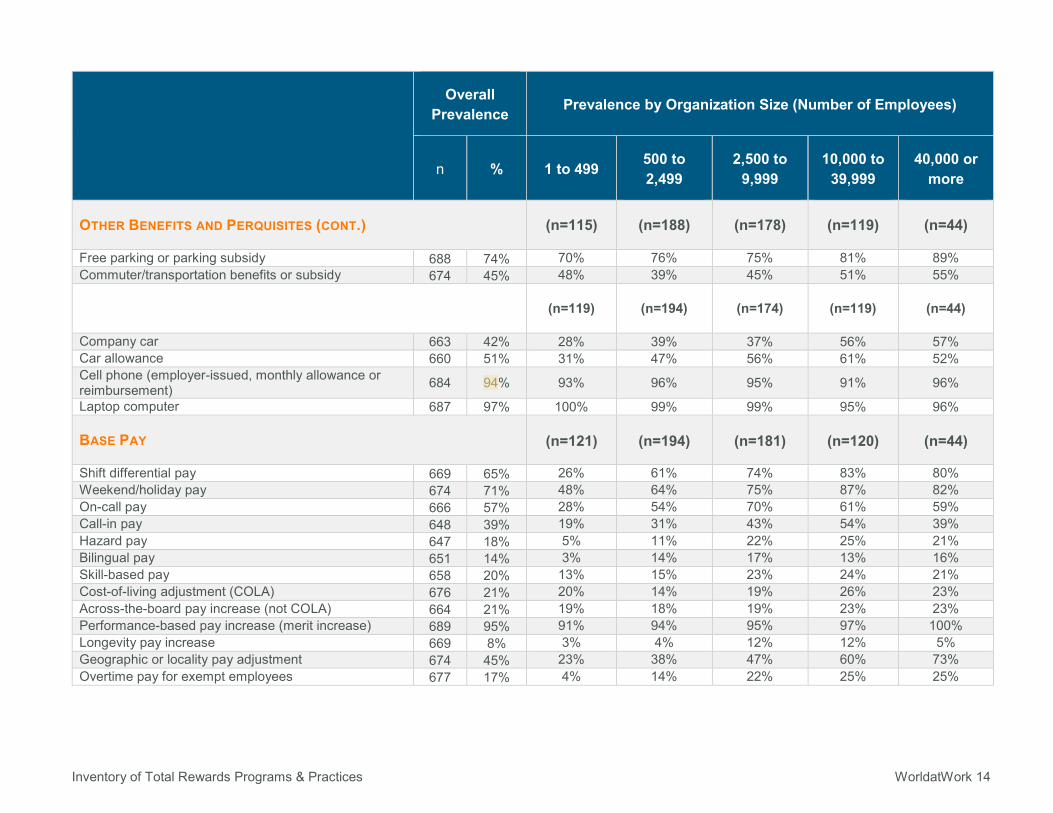
OTHER BENEFITS AND PERQUISITES (CONT.) (n=115) (n=188) (n=178) (n=119) (n=44)
Free parking or parking subsidy 688 74% 70% 76% 75% 81% 89% Commuter/transportation benefits or subsidy 674 45% 48% 39% 45% 51% 55%
(n=119) (n=194) (n=174) (n=119) (n=44)
Company car 663 42% 28% 39% 37% 56% 57% Car allowance 660 51% 31% 47% 56% 61% 52% Cell phone (employer-issued, monthly allowance or reimbursement) 684 94% 93% 96% 95% 91% 96%
Laptop computer 687 97% 100% 99% 99% 95% 96%
BASE PAY (n=121) (n=194) (n=181) (n=120) (n=44)
Shift differential pay 669 65% 26% 61% 74% 83% 80% Weekend/holiday pay 674 71% 48% 64% 75% 87% 82% On-call pay 666 57% 28% 54% 70% 61% 59% Call-in pay 648 39% 19% 31% 43% 54% 39% Hazard pay 647 18% 5% 11% 22% 25% 21% Bilingual pay 651 14% 3% 14% 17% 13% 16% Skill-based pay 658 20% 13% 15% 23% 24% 21% Cost-of-living adjustment (COLA) 676 21% 20% 14% 19% 26% 23% Across-the-board pay increase (not COLA) 664 21% 19% 18% 19% 23% 23% Performance-based pay increase (merit increase) 689 95% 91% 94% 95% 97% 100% Longevity pay increase 669 8% 3% 4% 12% 12% 5% Geographic or locality pay adjustment 674 45% 23% 38% 47% 60% 73% Overtime pay for exempt employees 677 17% 4% 14% 22% 25% 25%
Inventory of Total Rewards Programs & Practices WorldatWork 15
Overall Prevalence Prevalence by Organization Size (Number of Employees)
n % 1 to 499 500 to 2,499
2,500 to 9,999
10,000 to 39,999
40,000 or more
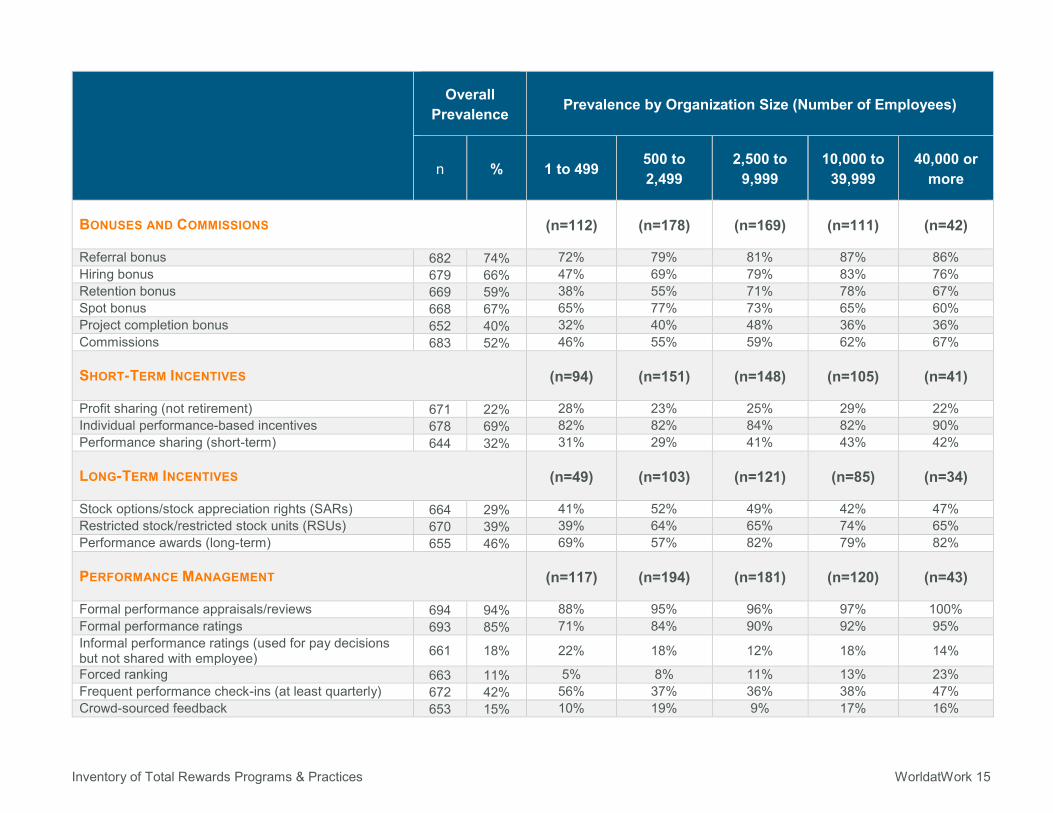
BONUSES AND COMMISSIONS (n=112) (n=178) (n=169) (n=111) (n=42)
Referral bonus 682 74% 72% 79% 81% 87% 86% Hiring bonus 679 66% 47% 69% 79% 83% 76% Retention bonus 669 59% 38% 55% 71% 78% 67% Spot bonus 668 67% 65% 77% 73% 65% 60% Project completion bonus 652 40% 32% 40% 48% 36% 36% Commissions 683 52% 46% 55% 59% 62% 67%
SHORT-TERM INCENTIVES (n=94) (n=151) (n=148) (n=105) (n=41)
Profit sharing (not retirement) 671 22% 28% 23% 25% 29% 22% Individual performance-based incentives 678 69% 82% 82% 84% 82% 90% Performance sharing (short-term) 644 32% 31% 29% 41% 43% 42%
LONG-TERM INCENTIVES (n=49) (n=103) (n=121) (n=85) (n=34)
Stock options/stock appreciation rights (SARs) 664 29% 41% 52% 49% 42% 47% Restricted stock/restricted stock units (RSUs) 670 39% 39% 64% 65% 74% 65% Performance awards (long-term) 655 46% 69% 57% 82% 79% 82%
PERFORMANCE MANAGEMENT (n=117) (n=194) (n=181) (n=120) (n=43)
Formal performance appraisals/reviews 694 94% 88% 95% 96% 97% 100% Formal performance ratings 693 85% 71% 84% 90% 92% 95% Informal performance ratings (used for pay decisions but not shared with employee) 661 18% 22% 18% 12% 18% 14%
Forced ranking 663 11% 5% 8% 11% 13% 23% Frequent performance check-ins (at least quarterly) 672 42% 56% 37% 36% 38% 47% Crowd-sourced feedback 653 15% 10% 19% 9% 17% 16%
Inventory of Total Rewards Programs & Practices WorldatWork 16
Overall Prevalence Prevalence by Organization Size (Number of Employees)
n % 1 to 499 500 to 2,499
2,500 to 9,999
10,000 to 39,999
40,000 or more
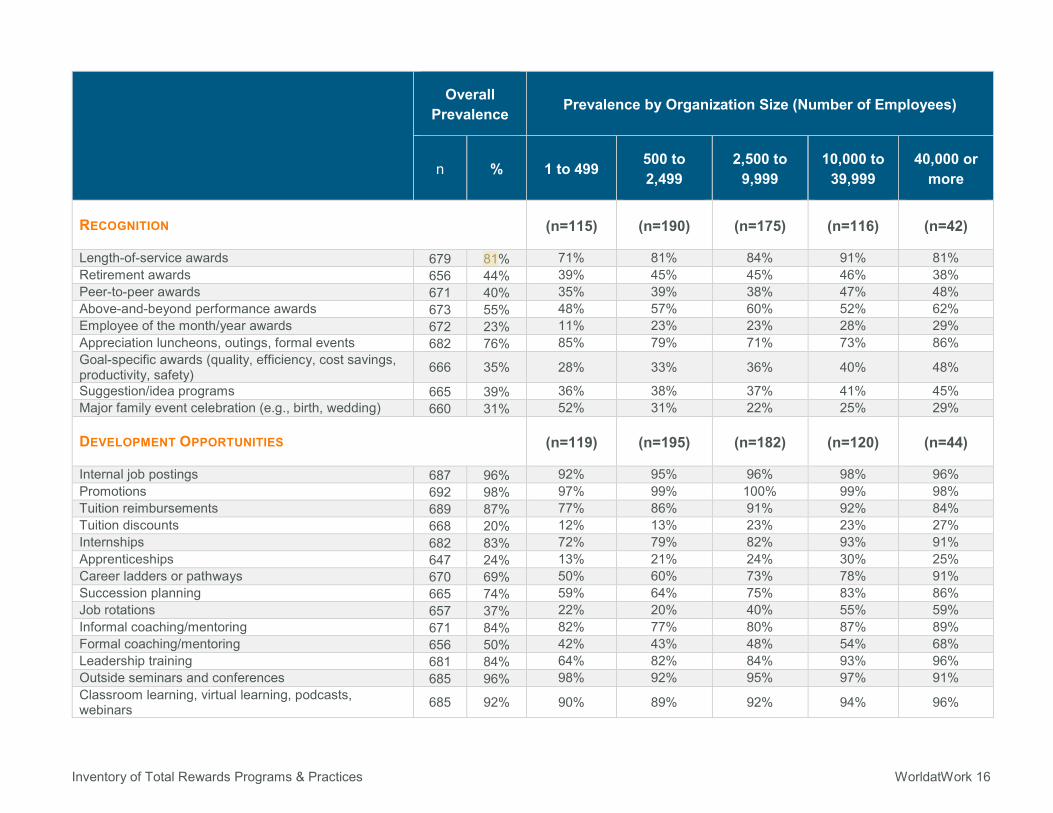
RECOGNITION (n=115) (n=190) (n=175) (n=116) (n=42)
Length-of-service awards 679 81% 71% 81% 84% 91% 81% Retirement awards 656 44% 39% 45% 45% 46% 38% Peer-to-peer awards 671 40% 35% 39% 38% 47% 48% Above-and-beyond performance awards 673 55% 48% 57% 60% 52% 62% Employee of the month/year awards 672 23% 11% 23% 23% 28% 29% Appreciation luncheons, outings, formal events 682 76% 85% 79% 71% 73% 86% Goal-specific awards (quality, efficiency, cost savings, productivity, safety) 666 35% 28% 33% 36% 40% 48%
Suggestion/idea programs 665 39% 36% 38% 37% 41% 45% Major family event celebration (e.g., birth, wedding) 660 31% 52% 31% 22% 25% 29%
DEVELOPMENT OPPORTUNITIES (n=119) (n=195) (n=182) (n=120) (n=44)
Internal job postings 687 96% 92% 95% 96% 98% 96% Promotions 692 98% 97% 99% 100% 99% 98% Tuition reimbursements 689 87% 77% 86% 91% 92% 84% Tuition discounts 668 20% 12% 13% 23% 23% 27% Internships 682 83% 72% 79% 82% 93% 91% Apprenticeships 647 24% 13% 21% 24% 30% 25% Career ladders or pathways 670 69% 50% 60% 73% 78% 91% Succession planning 665 74% 59% 64% 75% 83% 86% Job rotations 657 37% 22% 20% 40% 55% 59% Informal coaching/mentoring 671 84% 82% 77% 80% 87% 89% Formal coaching/mentoring 656 50% 42% 43% 48% 54% 68% Leadership training 681 84% 64% 82% 84% 93% 96% Outside seminars and conferences 685 96% 98% 92% 95% 97% 91% Classroom learning, virtual learning, podcasts, webinars 685 92% 90% 89% 92% 94% 96%
Inventory of Total Rewards Programs & Practices WorldatWork 17
Overall Prevalence Prevalence by Organization Size (Number of Employees)
n % 1 to 499 500 to 2,499
2,500 to 9,999
10,000 to 39,999
40,000 or more
DEVELOPMENT OPPORTUNITIES (CONT.) (n=119) (n=195) (n=182) (n=120) (n=44)
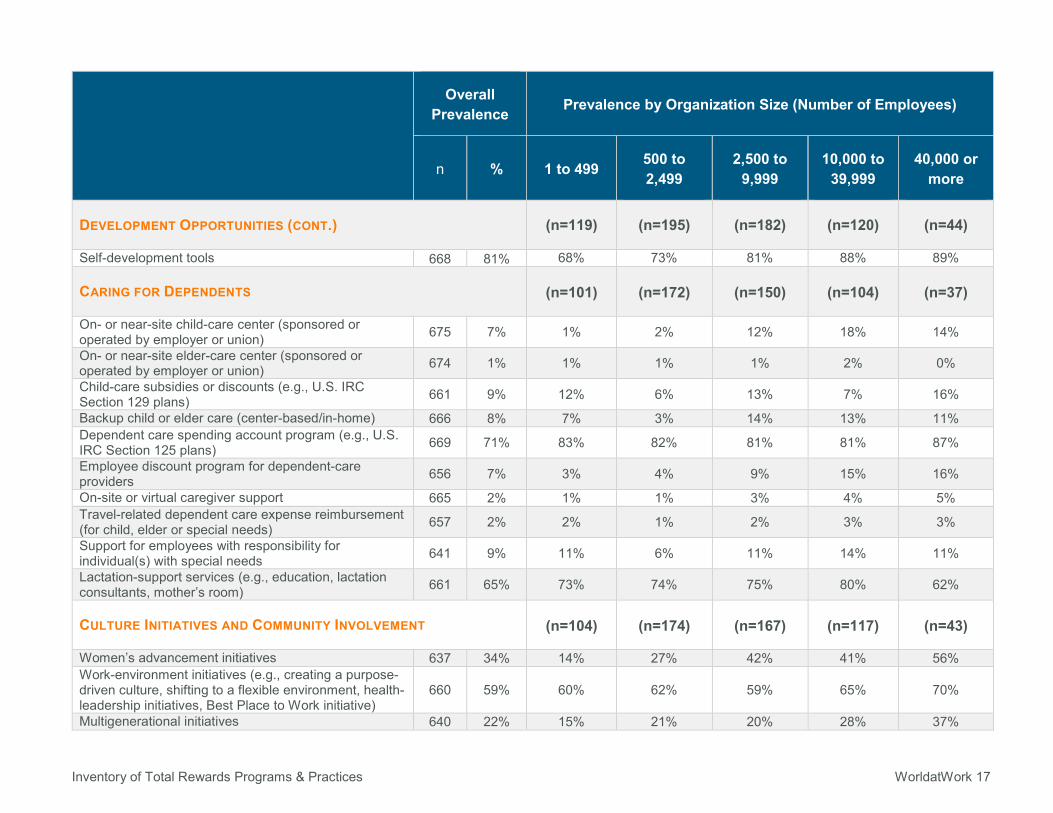
Self-development tools 668 81% 68% 73% 81% 88% 89%
CARING FOR DEPENDENTS (n=101) (n=172) (n=150) (n=104) (n=37)
On- or near-site child-care center (sponsored or operated by employer or union) 675 7% 1% 2% 12% 18% 14%
On- or near-site elder-care center (sponsored or operated by employer or union) 674 1% 1% 1% 1% 2% 0%
Child-care subsidies or discounts (e.g., U.S. IRC Section 129 plans) 661 9% 12% 6% 13% 7% 16%
Backup child or elder care (center-based/in-home) 666 8% 7% 3% 14% 13% 11% Dependent care spending account program (e.g., U.S. IRC Section 125 plans) 669 71% 83% 82% 81% 81% 87%
Employee discount program for dependent-care providers 656 7% 3% 4% 9% 15% 16%
On-site or virtual caregiver support 665 2% 1% 1% 3% 4% 5% Travel-related dependent care expense reimbursement (for child, elder or special needs) 657 2% 2% 1% 2% 3% 3%
Support for employees with responsibility for individual(s) with special needs 641 9% 11% 6% 11% 14% 11%
Lactation-support services (e.g., education, lactation consultants, mother’s room) 661 65% 73% 74% 75% 80% 62%
CULTURE INITIATIVES AND COMMUNITY INVOLVEMENT (n=104) (n=174) (n=167) (n=117) (n=43)
Women’s advancement initiatives 637 34% 14% 27% 42% 41% 56% Work-environment initiatives (e.g., creating a purpose-driven culture, shifting to a flexible environment, health-leadership initiatives, Best Place to Work initiative)
660 59% 60% 62% 59% 65% 70%
Multigenerational initiatives 640 22% 15% 21% 20% 28% 37%
Inventory of Total Rewards Programs & Practices WorldatWork 18
Overall Prevalence Prevalence by Organization Size (Number of Employees)
n % 1 to 499 500 to 2,499
2,500 to 9,999
10,000 to 39,999
40,000 or more
CULTURE INITIATIVES AND COMMUNITY INVOLVEMENT (CONT.) (n=104) (n=174) (n=167) (n=117) (n=43)
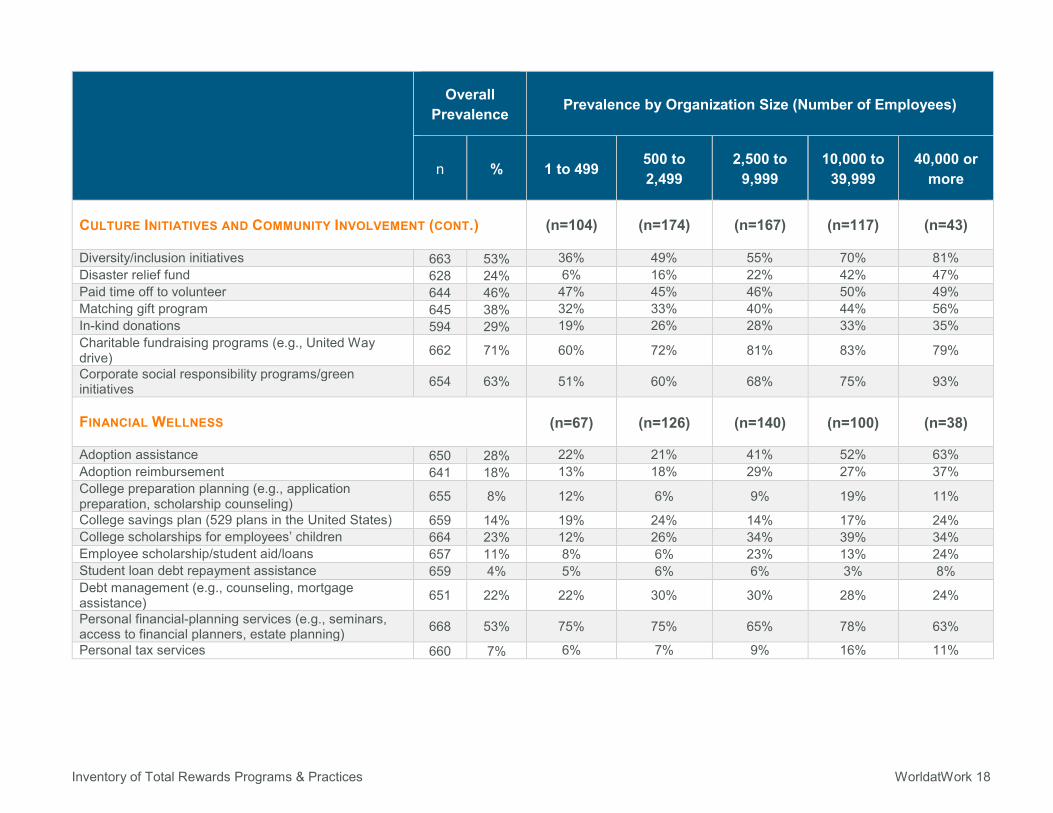
Diversity/inclusion initiatives 663 53% 36% 49% 55% 70% 81% Disaster relief fund 628 24% 6% 16% 22% 42% 47% Paid time off to volunteer 644 46% 47% 45% 46% 50% 49% Matching gift program 645 38% 32% 33% 40% 44% 56% In-kind donations 594 29% 19% 26% 28% 33% 35% Charitable fundraising programs (e.g., United Way drive) 662 71% 60% 72% 81% 83% 79%
Corporate social responsibility programs/green initiatives 654 63% 51% 60% 68% 75% 93%
FINANCIAL WELLNESS (n=67) (n=126) (n=140) (n=100) (n=38)
Adoption assistance 650 28% 22% 21% 41% 52% 63% Adoption reimbursement 641 18% 13% 18% 29% 27% 37% College preparation planning (e.g., application preparation, scholarship counseling) 655 8% 12% 6% 9% 19% 11%
College savings plan (529 plans in the United States) 659 14% 19% 24% 14% 17% 24% College scholarships for employees’ children 664 23% 12% 26% 34% 39% 34% Employee scholarship/student aid/loans 657 11% 8% 6% 23% 13% 24% Student loan debt repayment assistance 659 4% 5% 6% 6% 3% 8% Debt management (e.g., counseling, mortgage assistance) 651 22% 22% 30% 30% 28% 24%
Personal financial-planning services (e.g., seminars, access to financial planners, estate planning) 668 53% 75% 75% 65% 78% 63%
Personal tax services 660 7% 6% 7% 9% 16% 11%
Inventory of Total Rewards Programs & Practices WorldatWork 19
Overall Prevalence Prevalence by Organization Size (Number of Employees)
n % 1 to 499 500 to 2,499
2,500 to 9,999
10,000 to 39,999
40,000 or more
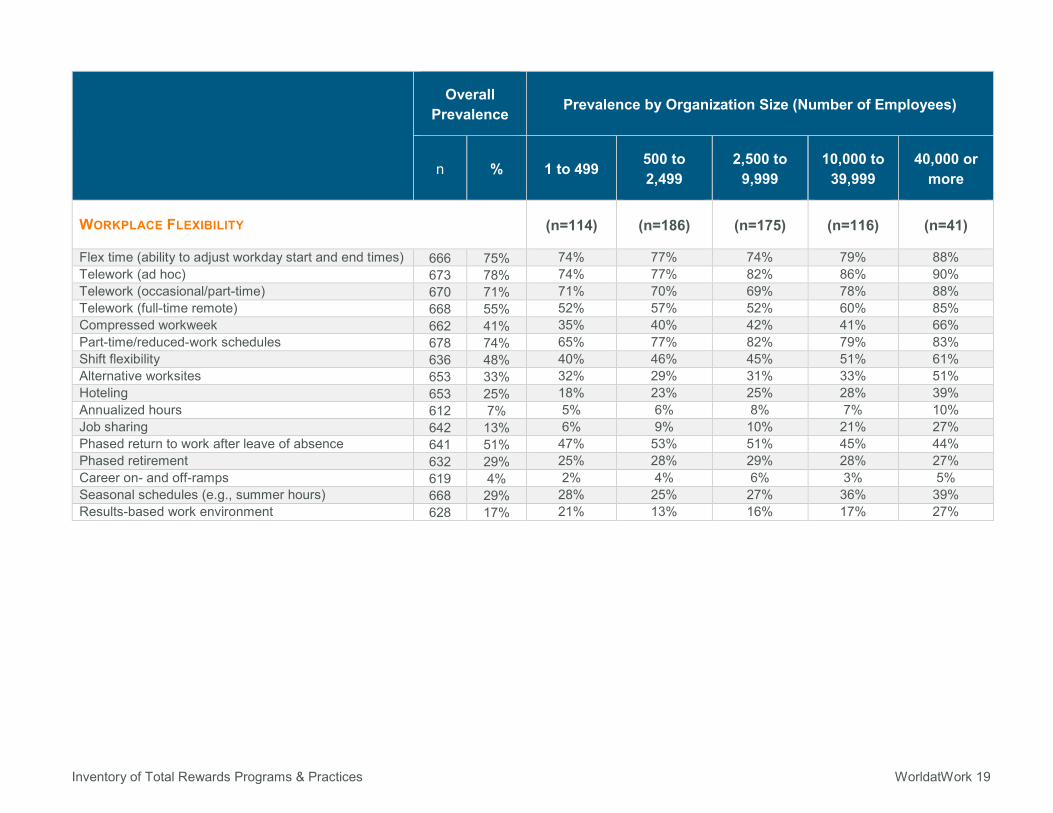
WORKPLACE FLEXIBILITY (n=114) (n=186) (n=175) (n=116) (n=41)
Flex time (ability to adjust workday start and end times) 666 75% 74% 77% 74% 79% 88% Telework (ad hoc) 673 78% 74% 77% 82% 86% 90% Telework (occasional/part-time) 670 71% 71% 70% 69% 78% 88% Telework (full-time remote) 668 55% 52% 57% 52% 60% 85% Compressed workweek 662 41% 35% 40% 42% 41% 66% Part-time/reduced-work schedules 678 74% 65% 77% 82% 79% 83% Shift flexibility 636 48% 40% 46% 45% 51% 61% Alternative worksites 653 33% 32% 29% 31% 33% 51% Hoteling 653 25% 18% 23% 25% 28% 39% Annualized hours 612 7% 5% 6% 8% 7% 10% Job sharing 642 13% 6% 9% 10% 21% 27% Phased return to work after leave of absence 641 51% 47% 53% 51% 45% 44% Phased retirement 632 29% 25% 28% 29% 28% 27% Career on- and off-ramps 619 4% 2% 4% 6% 3% 5% Seasonal schedules (e.g., summer hours) 668 29% 28% 25% 27% 36% 39% Results-based work environment 628 17% 21% 13% 16% 17% 27%
Inventory of Total Rewards Programs & Practices WorldatWork 20
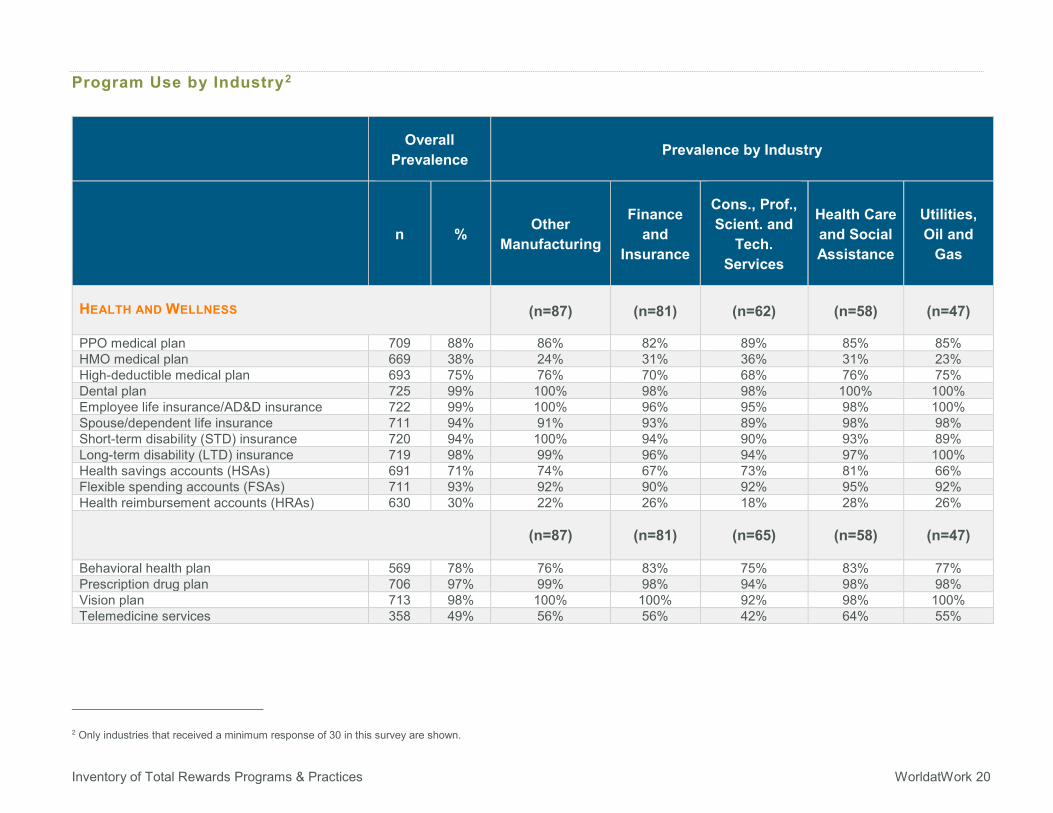
Program Use by Industry2
Overall Prevalence Prevalence by Industry
n % Other Manufacturing
Finance and
Insurance
Cons., Prof., Scient. and
Tech. Services
Health Care and Social Assistance
Utilities, Oil and
Gas
HEALTH AND WELLNESS (n=87) (n=81) (n=62) (n=58) (n=47)
PPO medical plan 709 88% 86% 82% 89% 85% 85% HMO medical plan 669 38% 24% 31% 36% 31% 23% High-deductible medical plan 693 75% 76% 70% 68% 76% 75% Dental plan 725 99% 100% 98% 98% 100% 100% Employee life insurance/AD&D insurance 722 99% 100% 96% 95% 98% 100% Spouse/dependent life insurance 711 94% 91% 93% 89% 98% 98% Short-term disability (STD) insurance 720 94% 100% 94% 90% 93% 89% Long-term disability (LTD) insurance 719 98% 99% 96% 94% 97% 100% Health savings accounts (HSAs) 691 71% 74% 67% 73% 81% 66% Flexible spending accounts (FSAs) 711 93% 92% 90% 92% 95% 92% Health reimbursement accounts (HRAs) 630 30% 22% 26% 18% 28% 26%
(n=87) (n=81) (n=65) (n=58) (n=47)
Behavioral health plan 569 78% 76% 83% 75% 83% 77% Prescription drug plan 706 97% 99% 98% 94% 98% 98% Vision plan 713 98% 100% 100% 92% 98% 100% Telemedicine services 358 49% 56% 56% 42% 64% 55%
2 Only industries that received a minimum response of 30 in this survey are shown.
Inventory of Total Rewards Programs & Practices WorldatWork 21
Overall Prevalence Prevalence by Industry
n % Other Manufacturing
Finance and
Insurance
Cons., Prof., Scient. and
Tech. Services
Health Care and Social Assistance
Utilities, Oil and
Gas
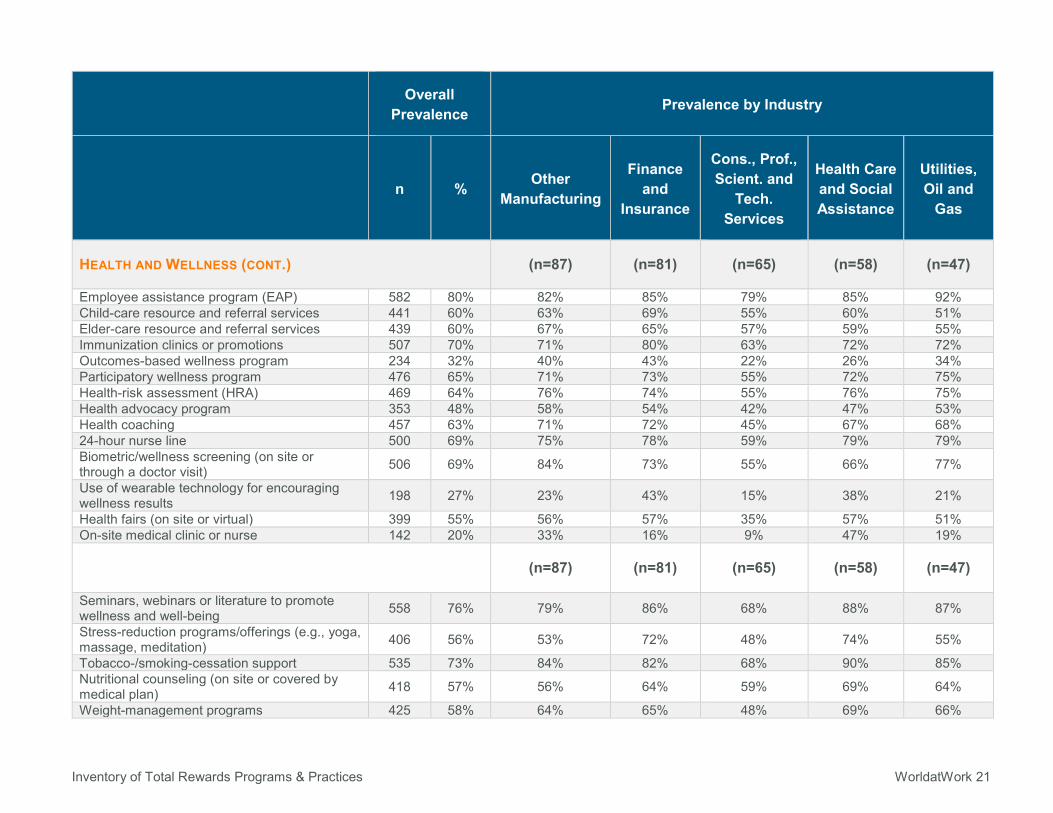
HEALTH AND WELLNESS (CONT.) (n=87) (n=81) (n=65) (n=58) (n=47)
Employee assistance program (EAP) 582 80% 82% 85% 79% 85% 92% Child-care resource and referral services 441 60% 63% 69% 55% 60% 51% Elder-care resource and referral services 439 60% 67% 65% 57% 59% 55% Immunization clinics or promotions 507 70% 71% 80% 63% 72% 72% Outcomes-based wellness program 234 32% 40% 43% 22% 26% 34% Participatory wellness program 476 65% 71% 73% 55% 72% 75% Health-risk assessment (HRA) 469 64% 76% 74% 55% 76% 75% Health advocacy program 353 48% 58% 54% 42% 47% 53% Health coaching 457 63% 71% 72% 45% 67% 68% 24-hour nurse line 500 69% 75% 78% 59% 79% 79% Biometric/wellness screening (on site or through a doctor visit) 506 69% 84% 73% 55% 66% 77%
Use of wearable technology for encouraging wellness results 198 27% 23% 43% 15% 38% 21%
Health fairs (on site or virtual) 399 55% 56% 57% 35% 57% 51% On-site medical clinic or nurse 142 20% 33% 16% 9% 47% 19%
(n=87) (n=81) (n=65) (n=58) (n=47)
Seminars, webinars or literature to promote wellness and well-being 558 76% 79% 86% 68% 88% 87%
Stress-reduction programs/offerings (e.g., yoga, massage, meditation) 406 56% 53% 72% 48% 74% 55%
Tobacco-/smoking-cessation support 535 73% 84% 82% 68% 90% 85% Nutritional counseling (on site or covered by medical plan) 418 57% 56% 64% 59% 69% 64%
Weight-management programs 425 58% 64% 65% 48% 69% 66%
Inventory of Total Rewards Programs & Practices WorldatWork 22
Overall Prevalence Prevalence by Industry
n % Other Manufacturing
Finance and
Insurance
Cons., Prof., Scient. and
Tech. Services
Health Care and Social Assistance
Utilities, Oil and
Gas
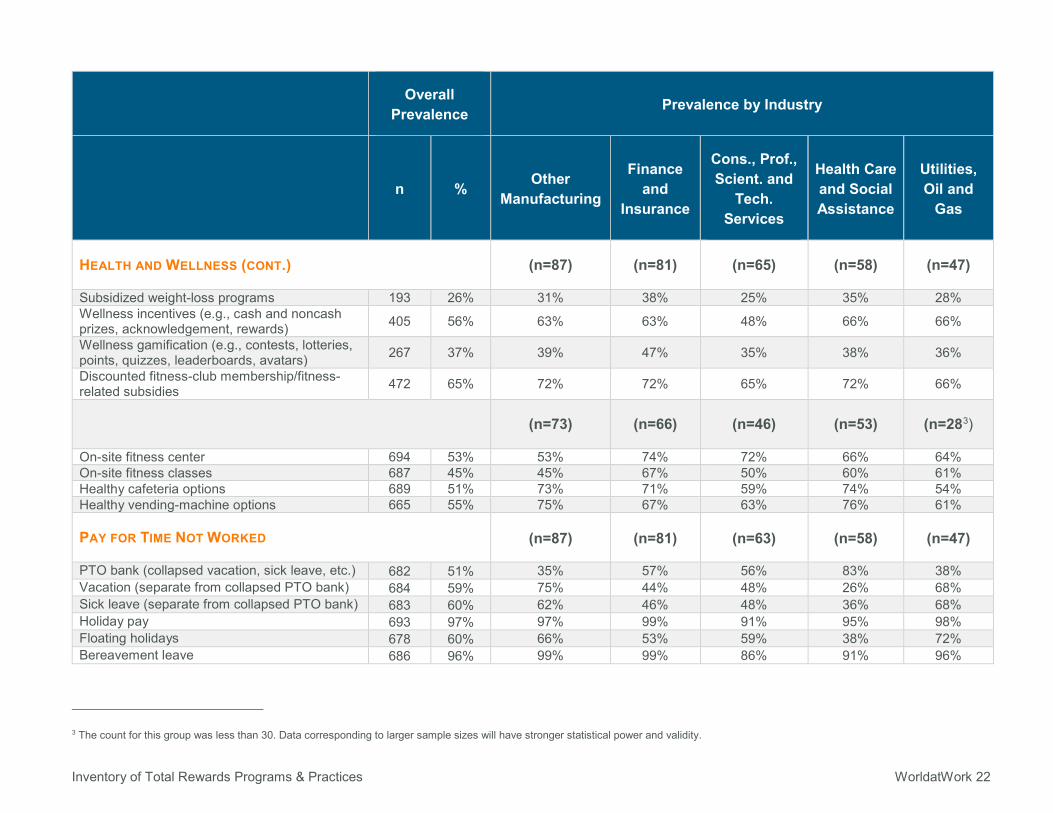
HEALTH AND WELLNESS (CONT.) (n=87) (n=81) (n=65) (n=58) (n=47)
Subsidized weight-loss programs 193 26% 31% 38% 25% 35% 28% Wellness incentives (e.g., cash and noncash prizes, acknowledgement, rewards) 405 56% 63% 63% 48% 66% 66%
Wellness gamification (e.g., contests, lotteries, points, quizzes, leaderboards, avatars) 267 37% 39% 47% 35% 38% 36%
Discounted fitness-club membership/fitness-related subsidies 472 65% 72% 72% 65% 72% 66%
(n=73) (n=66) (n=46) (n=53) (n=283)
On-site fitness center 694 53% 53% 74% 72% 66% 64% On-site fitness classes 687 45% 45% 67% 50% 60% 61% Healthy cafeteria options 689 51% 73% 71% 59% 74% 54% Healthy vending-machine options 665 55% 75% 67% 63% 76% 61%
PAY FOR TIME NOT WORKED (n=87) (n=81) (n=63) (n=58) (n=47)
PTO bank (collapsed vacation, sick leave, etc.) 682 51% 35% 57% 56% 83% 38% Vacation (separate from collapsed PTO bank) 684 59% 75% 44% 48% 26% 68% Sick leave (separate from collapsed PTO bank) 683 60% 62% 46% 48% 36% 68% Holiday pay 693 97% 97% 99% 91% 95% 98% Floating holidays 678 60% 66% 53% 59% 38% 72% Bereavement leave 686 96% 99% 99% 86% 91% 96%
3 The count for this group was less than 30. Data corresponding to larger sample sizes will have stronger statistical power and validity.
Inventory of Total Rewards Programs & Practices WorldatWork 23
Overall Prevalence Prevalence by Industry
n % Other Manufacturing
Finance and
Insurance
Cons., Prof., Scient. and
Tech. Services
Health Care and Social Assistance
Utilities, Oil and
Gas
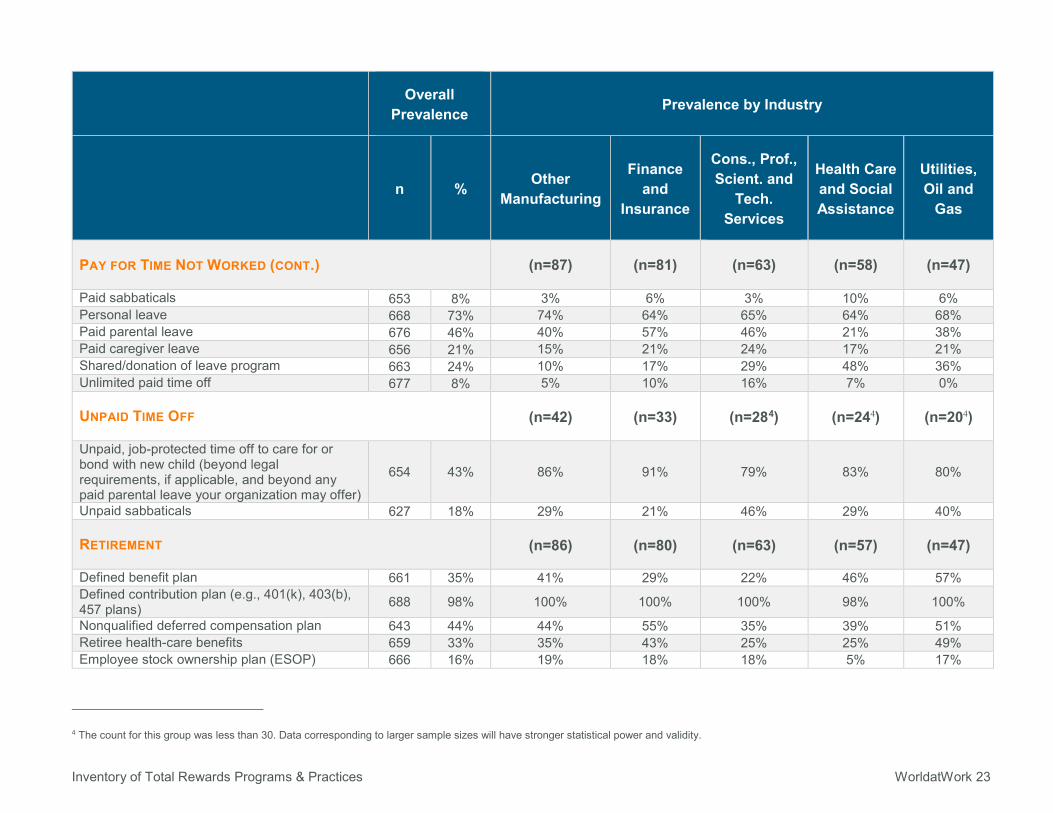
PAY FOR TIME NOT WORKED (CONT.) (n=87) (n=81) (n=63) (n=58) (n=47)
Paid sabbaticals 653 8% 3% 6% 3% 10% 6% Personal leave 668 73% 74% 64% 65% 64% 68% Paid parental leave 676 46% 40% 57% 46% 21% 38% Paid caregiver leave 656 21% 15% 21% 24% 17% 21% Shared/donation of leave program 663 24% 10% 17% 29% 48% 36% Unlimited paid time off 677 8% 5% 10% 16% 7% 0%
UNPAID TIME OFF (n=42) (n=33) (n=284) (n=244) (n=204)
Unpaid, job-protected time off to care for or bond with new child (beyond legal requirements, if applicable, and beyond any paid parental leave your organization may offer)
654 43% 86% 91% 79% 83% 80%
Unpaid sabbaticals 627 18% 29% 21% 46% 29% 40%
RETIREMENT (n=86) (n=80) (n=63) (n=57) (n=47)
Defined benefit plan 661 35% 41% 29% 22% 46% 57% Defined contribution plan (e.g., 401(k), 403(b), 457 plans) 688 98% 100% 100% 100% 98% 100%
Nonqualified deferred compensation plan 643 44% 44% 55% 35% 39% 51% Retiree health-care benefits 659 33% 35% 43% 25% 25% 49% Employee stock ownership plan (ESOP) 666 16% 19% 18% 18% 5% 17%
4 The count for this group was less than 30. Data corresponding to larger sample sizes will have stronger statistical power and validity.
Inventory of Total Rewards Programs & Practices WorldatWork 24
Overall Prevalence Prevalence by Industry
n % Other Manufacturing
Finance and
Insurance
Cons., Prof., Scient. and
Tech. Services
Health Care and Social Assistance
Utilities, Oil and
Gas
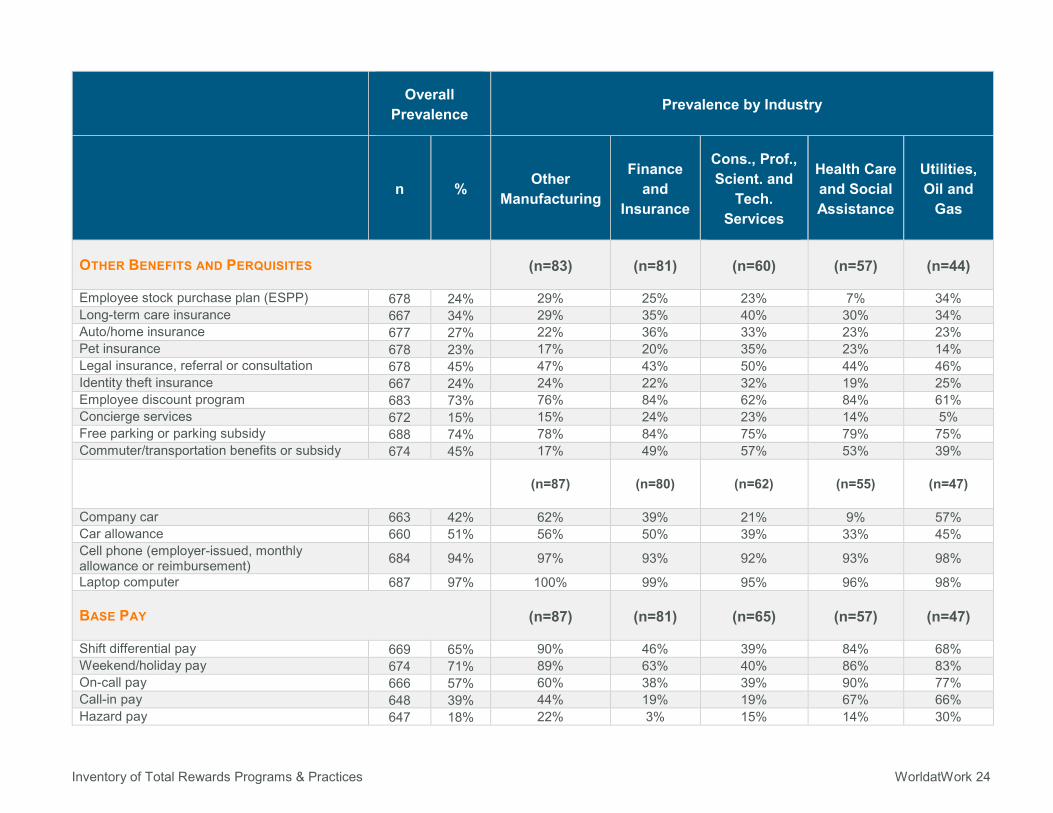
OTHER BENEFITS AND PERQUISITES (n=83) (n=81) (n=60) (n=57) (n=44)
Employee stock purchase plan (ESPP) 678 24% 29% 25% 23% 7% 34% Long-term care insurance 667 34% 29% 35% 40% 30% 34% Auto/home insurance 677 27% 22% 36% 33% 23% 23% Pet insurance 678 23% 17% 20% 35% 23% 14% Legal insurance, referral or consultation 678 45% 47% 43% 50% 44% 46% Identity theft insurance 667 24% 24% 22% 32% 19% 25% Employee discount program 683 73% 76% 84% 62% 84% 61% Concierge services 672 15% 15% 24% 23% 14% 5% Free parking or parking subsidy 688 74% 78% 84% 75% 79% 75% Commuter/transportation benefits or subsidy 674 45% 17% 49% 57% 53% 39%
(n=87) (n=80) (n=62) (n=55) (n=47)
Company car 663 42% 62% 39% 21% 9% 57% Car allowance 660 51% 56% 50% 39% 33% 45% Cell phone (employer-issued, monthly allowance or reimbursement) 684 94% 97% 93% 92% 93% 98%
Laptop computer 687 97% 100% 99% 95% 96% 98%
BASE PAY (n=87) (n=81) (n=65) (n=57) (n=47)
Shift differential pay 669 65% 90% 46% 39% 84% 68% Weekend/holiday pay 674 71% 89% 63% 40% 86% 83% On-call pay 666 57% 60% 38% 39% 90% 77% Call-in pay 648 39% 44% 19% 19% 67% 66% Hazard pay 647 18% 22% 3% 15% 14% 30%
Inventory of Total Rewards Programs & Practices WorldatWork 25
Overall Prevalence Prevalence by Industry
n % Other Manufacturing
Finance and
Insurance
Cons., Prof., Scient. and
Tech. Services
Health Care and Social Assistance
Utilities, Oil and
Gas
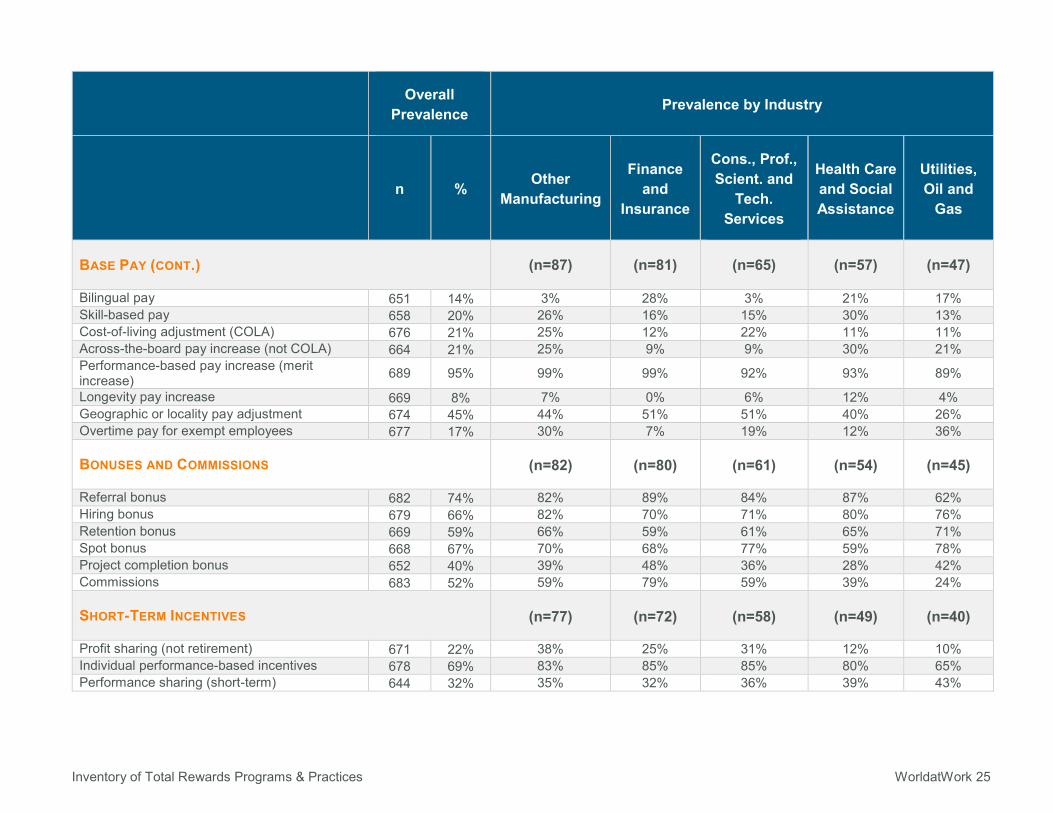
BASE PAY (CONT.) (n=87) (n=81) (n=65) (n=57) (n=47)
Bilingual pay 651 14% 3% 28% 3% 21% 17% Skill-based pay 658 20% 26% 16% 15% 30% 13% Cost-of-living adjustment (COLA) 676 21% 25% 12% 22% 11% 11% Across-the-board pay increase (not COLA) 664 21% 25% 9% 9% 30% 21% Performance-based pay increase (merit increase) 689 95% 99% 99% 92% 93% 89%
Longevity pay increase 669 8% 7% 0% 6% 12% 4% Geographic or locality pay adjustment 674 45% 44% 51% 51% 40% 26% Overtime pay for exempt employees 677 17% 30% 7% 19% 12% 36%
BONUSES AND COMMISSIONS (n=82) (n=80) (n=61) (n=54) (n=45)
Referral bonus 682 74% 82% 89% 84% 87% 62% Hiring bonus 679 66% 82% 70% 71% 80% 76% Retention bonus 669 59% 66% 59% 61% 65% 71% Spot bonus 668 67% 70% 68% 77% 59% 78% Project completion bonus 652 40% 39% 48% 36% 28% 42% Commissions 683 52% 59% 79% 59% 39% 24%
SHORT-TERM INCENTIVES (n=77) (n=72) (n=58) (n=49) (n=40)
Profit sharing (not retirement) 671 22% 38% 25% 31% 12% 10% Individual performance-based incentives 678 69% 83% 85% 85% 80% 65% Performance sharing (short-term) 644 32% 35% 32% 36% 39% 43%
Inventory of Total Rewards Programs & Practices WorldatWork 26
Overall Prevalence Prevalence by Industry
n % Other Manufacturing
Finance and
Insurance
Cons., Prof., Scient. and
Tech. Services
Health Care and Social Assistance
Utilities, Oil and
Gas
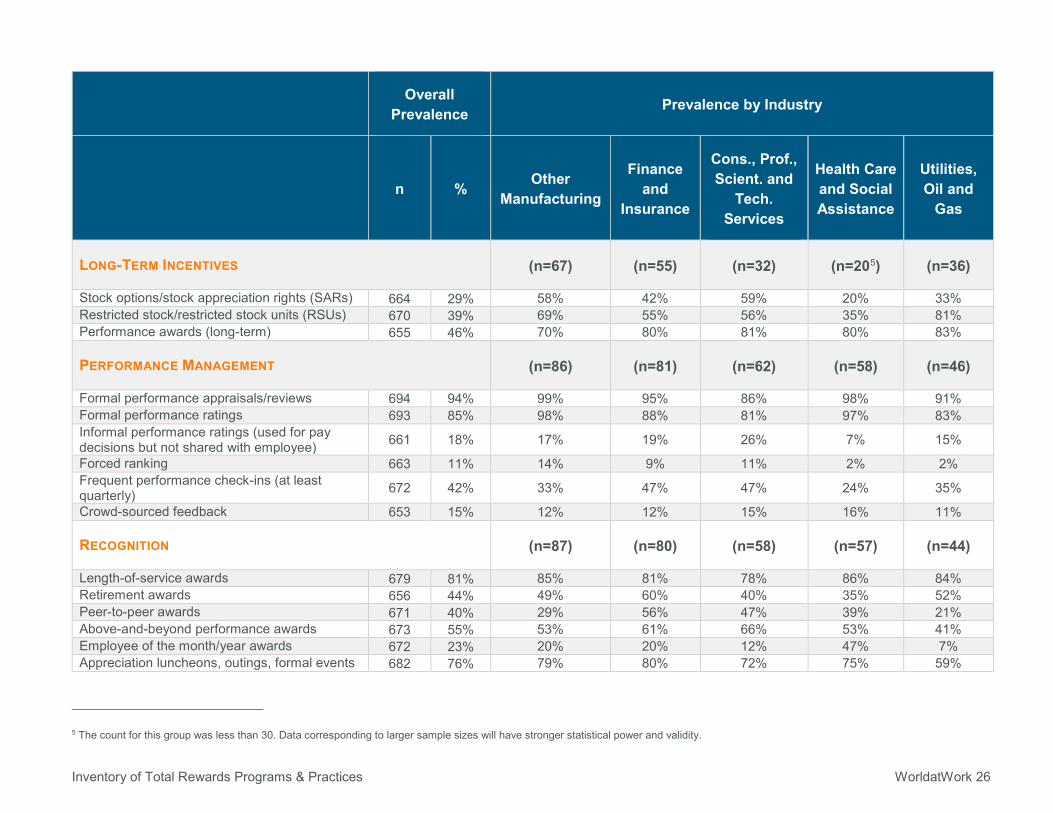
LONG-TERM INCENTIVES (n=67) (n=55) (n=32) (n=205) (n=36)
Stock options/stock appreciation rights (SARs) 664 29% 58% 42% 59% 20% 33% Restricted stock/restricted stock units (RSUs) 670 39% 69% 55% 56% 35% 81% Performance awards (long-term) 655 46% 70% 80% 81% 80% 83%
PERFORMANCE MANAGEMENT (n=86) (n=81) (n=62) (n=58) (n=46)
Formal performance appraisals/reviews 694 94% 99% 95% 86% 98% 91% Formal performance ratings 693 85% 98% 88% 81% 97% 83% Informal performance ratings (used for pay decisions but not shared with employee) 661 18% 17% 19% 26% 7% 15%
Forced ranking 663 11% 14% 9% 11% 2% 2% Frequent performance check-ins (at least quarterly) 672 42% 33% 47% 47% 24% 35%
Crowd-sourced feedback 653 15% 12% 12% 15% 16% 11%
RECOGNITION (n=87) (n=80) (n=58) (n=57) (n=44)
Length-of-service awards 679 81% 85% 81% 78% 86% 84% Retirement awards 656 44% 49% 60% 40% 35% 52% Peer-to-peer awards 671 40% 29% 56% 47% 39% 21% Above-and-beyond performance awards 673 55% 53% 61% 66% 53% 41% Employee of the month/year awards 672 23% 20% 20% 12% 47% 7% Appreciation luncheons, outings, formal events 682 76% 79% 80% 72% 75% 59%
5 The count for this group was less than 30. Data corresponding to larger sample sizes will have stronger statistical power and validity.
Inventory of Total Rewards Programs & Practices WorldatWork 27
Overall Prevalence Prevalence by Industry
n % Other Manufacturing
Finance and
Insurance
Cons., Prof., Scient. and
Tech. Services
Health Care and Social Assistance
Utilities, Oil and
Gas
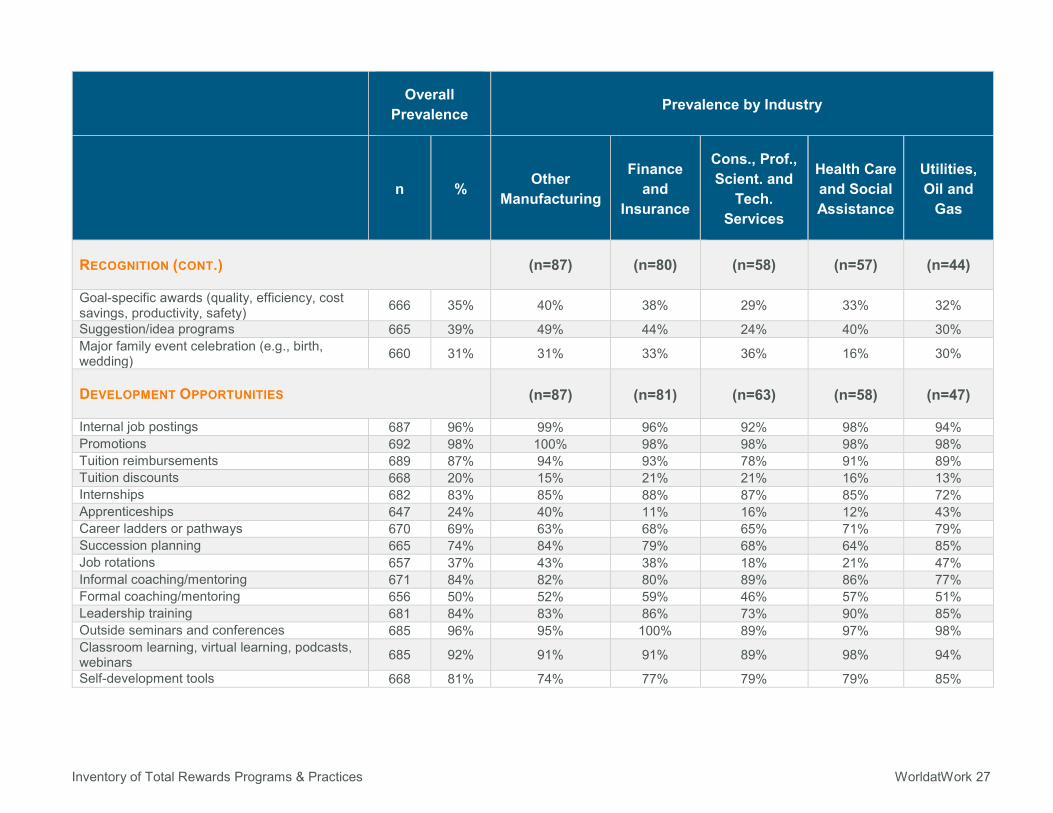
RECOGNITION (CONT.) (n=87) (n=80) (n=58) (n=57) (n=44)
Goal-specific awards (quality, efficiency, cost savings, productivity, safety) 666 35% 40% 38% 29% 33% 32%
Suggestion/idea programs 665 39% 49% 44% 24% 40% 30% Major family event celebration (e.g., birth, wedding) 660 31% 31% 33% 36% 16% 30%
DEVELOPMENT OPPORTUNITIES (n=87) (n=81) (n=63) (n=58) (n=47)
Internal job postings 687 96% 99% 96% 92% 98% 94% Promotions 692 98% 100% 98% 98% 98% 98% Tuition reimbursements 689 87% 94% 93% 78% 91% 89% Tuition discounts 668 20% 15% 21% 21% 16% 13% Internships 682 83% 85% 88% 87% 85% 72% Apprenticeships 647 24% 40% 11% 16% 12% 43% Career ladders or pathways 670 69% 63% 68% 65% 71% 79% Succession planning 665 74% 84% 79% 68% 64% 85% Job rotations 657 37% 43% 38% 18% 21% 47% Informal coaching/mentoring 671 84% 82% 80% 89% 86% 77% Formal coaching/mentoring 656 50% 52% 59% 46% 57% 51% Leadership training 681 84% 83% 86% 73% 90% 85% Outside seminars and conferences 685 96% 95% 100% 89% 97% 98% Classroom learning, virtual learning, podcasts, webinars 685 92% 91% 91% 89% 98% 94%
Self-development tools 668 81% 74% 77% 79% 79% 85%
Inventory of Total Rewards Programs & Practices WorldatWork 28
Overall Prevalence Prevalence by Industry
n % Other Manufacturing
Finance and
Insurance
Cons., Prof., Scient. and
Tech. Services
Health Care and Social Assistance
Utilities, Oil and
Gas
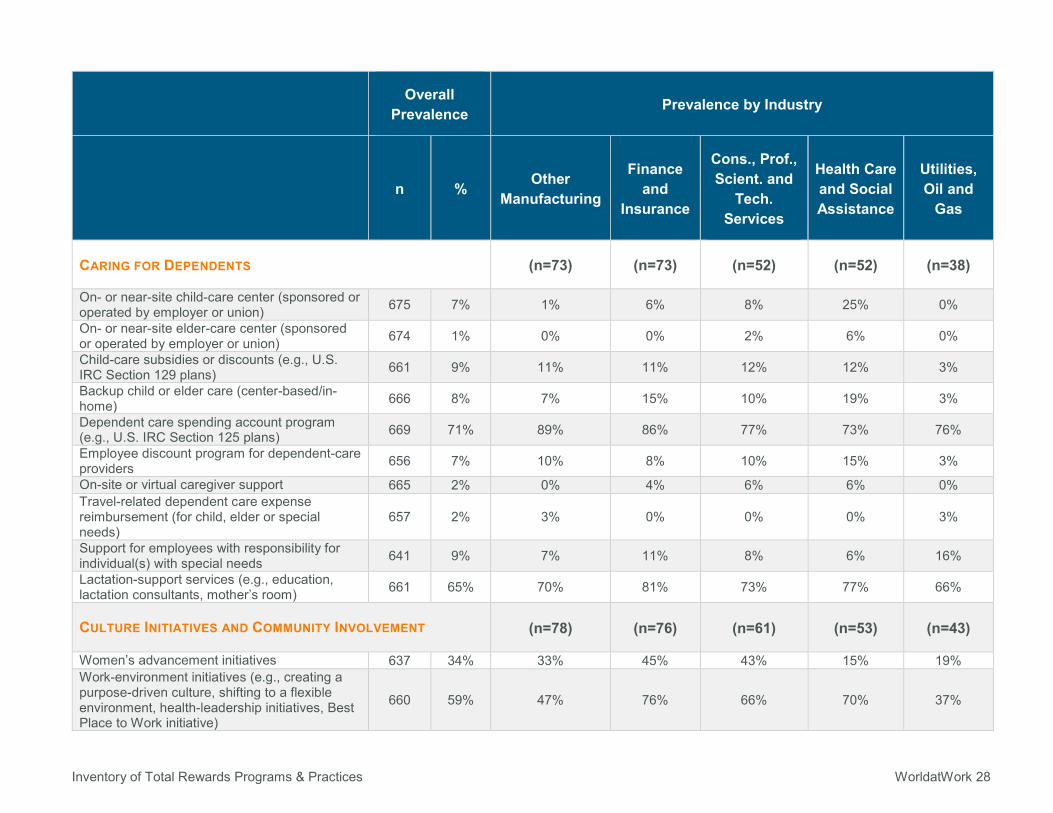
CARING FOR DEPENDENTS (n=73) (n=73) (n=52) (n=52) (n=38)
On- or near-site child-care center (sponsored or operated by employer or union) 675 7% 1% 6% 8% 25% 0%
On- or near-site elder-care center (sponsored or operated by employer or union) 674 1% 0% 0% 2% 6% 0%
Child-care subsidies or discounts (e.g., U.S. IRC Section 129 plans) 661 9% 11% 11% 12% 12% 3%
Backup child or elder care (center-based/in-home) 666 8% 7% 15% 10% 19% 3%
Dependent care spending account program (e.g., U.S. IRC Section 125 plans) 669 71% 89% 86% 77% 73% 76%
Employee discount program for dependent-care providers 656 7% 10% 8% 10% 15% 3%
On-site or virtual caregiver support 665 2% 0% 4% 6% 6% 0% Travel-related dependent care expense reimbursement (for child, elder or special needs)
657 2% 3% 0% 0% 0% 3%
Support for employees with responsibility for individual(s) with special needs 641 9% 7% 11% 8% 6% 16%
Lactation-support services (e.g., education, lactation consultants, mother’s room) 661 65% 70% 81% 73% 77% 66%
CULTURE INITIATIVES AND COMMUNITY INVOLVEMENT (n=78) (n=76) (n=61) (n=53) (n=43)
Women’s advancement initiatives 637 34% 33% 45% 43% 15% 19% Work-environment initiatives (e.g., creating a purpose-driven culture, shifting to a flexible environment, health-leadership initiatives, Best Place to Work initiative)
660 59% 47% 76% 66% 70% 37%
Inventory of Total Rewards Programs & Practices WorldatWork 29
Overall Prevalence Prevalence by Industry
n % Other Manufacturing
Finance and
Insurance
Cons., Prof., Scient. and
Tech. Services
Health Care and Social Assistance
Utilities, Oil and
Gas
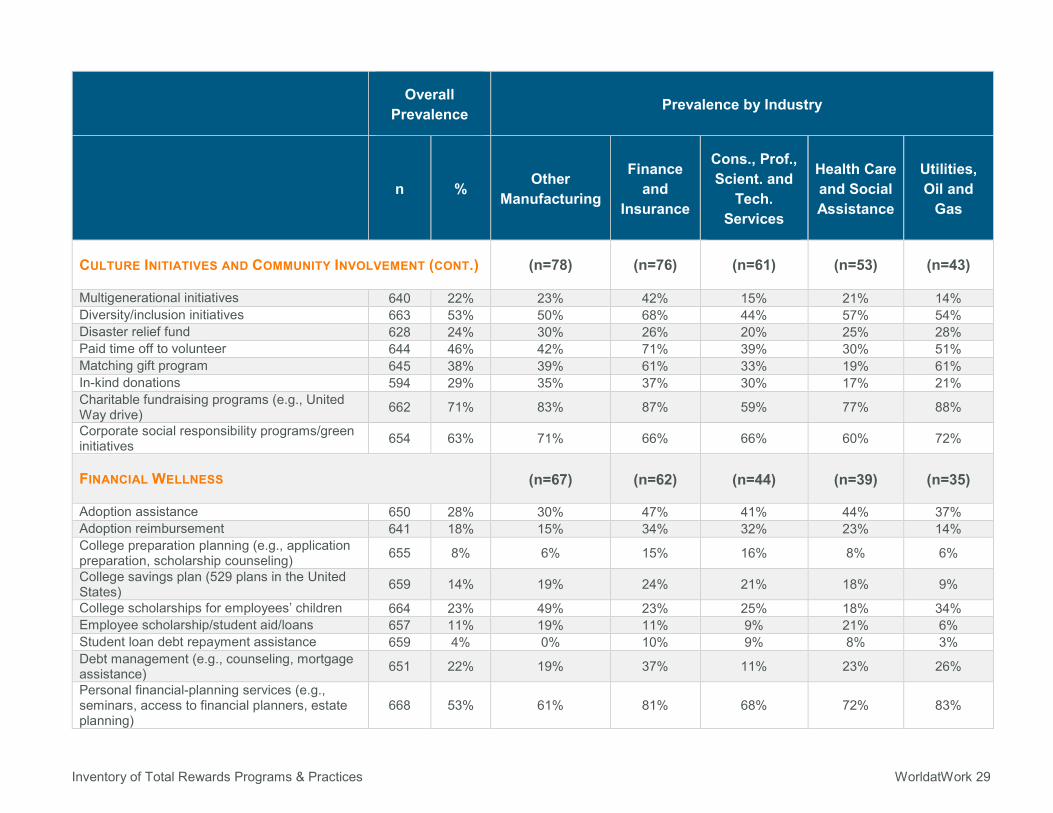
CULTURE INITIATIVES AND COMMUNITY INVOLVEMENT (CONT.) (n=78) (n=76) (n=61) (n=53) (n=43)
Multigenerational initiatives 640 22% 23% 42% 15% 21% 14% Diversity/inclusion initiatives 663 53% 50% 68% 44% 57% 54% Disaster relief fund 628 24% 30% 26% 20% 25% 28% Paid time off to volunteer 644 46% 42% 71% 39% 30% 51% Matching gift program 645 38% 39% 61% 33% 19% 61% In-kind donations 594 29% 35% 37% 30% 17% 21% Charitable fundraising programs (e.g., United Way drive) 662 71% 83% 87% 59% 77% 88%
Corporate social responsibility programs/green initiatives 654 63% 71% 66% 66% 60% 72%
FINANCIAL WELLNESS (n=67) (n=62) (n=44) (n=39) (n=35)
Adoption assistance 650 28% 30% 47% 41% 44% 37% Adoption reimbursement 641 18% 15% 34% 32% 23% 14% College preparation planning (e.g., application preparation, scholarship counseling) 655 8% 6% 15% 16% 8% 6%
College savings plan (529 plans in the United States) 659 14% 19% 24% 21% 18% 9%
College scholarships for employees’ children 664 23% 49% 23% 25% 18% 34% Employee scholarship/student aid/loans 657 11% 19% 11% 9% 21% 6% Student loan debt repayment assistance 659 4% 0% 10% 9% 8% 3% Debt management (e.g., counseling, mortgage assistance) 651 22% 19% 37% 11% 23% 26%
Personal financial-planning services (e.g., seminars, access to financial planners, estate planning)
668 53% 61% 81% 68% 72% 83%
Inventory of Total Rewards Programs & Practices WorldatWork 30
Overall Prevalence Prevalence by Industry
n % Other Manufacturing
Finance and
Insurance
Cons., Prof., Scient. and
Tech. Services
Health Care and Social Assistance
Utilities, Oil and
Gas
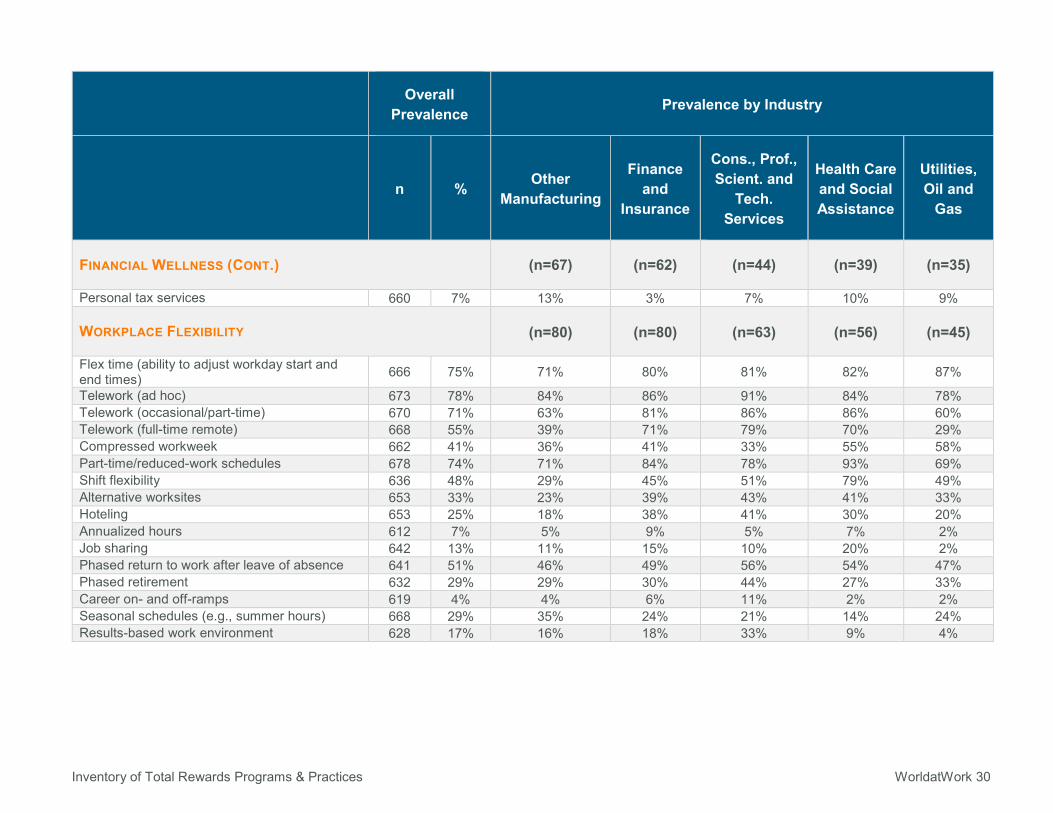
FINANCIAL WELLNESS (CONT.) (n=67) (n=62) (n=44) (n=39) (n=35)
Personal tax services 660 7% 13% 3% 7% 10% 9%
WORKPLACE FLEXIBILITY (n=80) (n=80) (n=63) (n=56) (n=45)
Flex time (ability to adjust workday start and end times) 666 75% 71% 80% 81% 82% 87%
Telework (ad hoc) 673 78% 84% 86% 91% 84% 78% Telework (occasional/part-time) 670 71% 63% 81% 86% 86% 60% Telework (full-time remote) 668 55% 39% 71% 79% 70% 29% Compressed workweek 662 41% 36% 41% 33% 55% 58% Part-time/reduced-work schedules 678 74% 71% 84% 78% 93% 69% Shift flexibility 636 48% 29% 45% 51% 79% 49% Alternative worksites 653 33% 23% 39% 43% 41% 33% Hoteling 653 25% 18% 38% 41% 30% 20% Annualized hours 612 7% 5% 9% 5% 7% 2% Job sharing 642 13% 11% 15% 10% 20% 2% Phased return to work after leave of absence 641 51% 46% 49% 56% 54% 47% Phased retirement 632 29% 29% 30% 44% 27% 33% Career on- and off-ramps 619 4% 4% 6% 11% 2% 2% Seasonal schedules (e.g., summer hours) 668 29% 35% 24% 21% 14% 24% Results-based work environment 628 17% 16% 18% 33% 9% 4%
Inventory of Total Rewards Programs & Practices WorldatWork 31
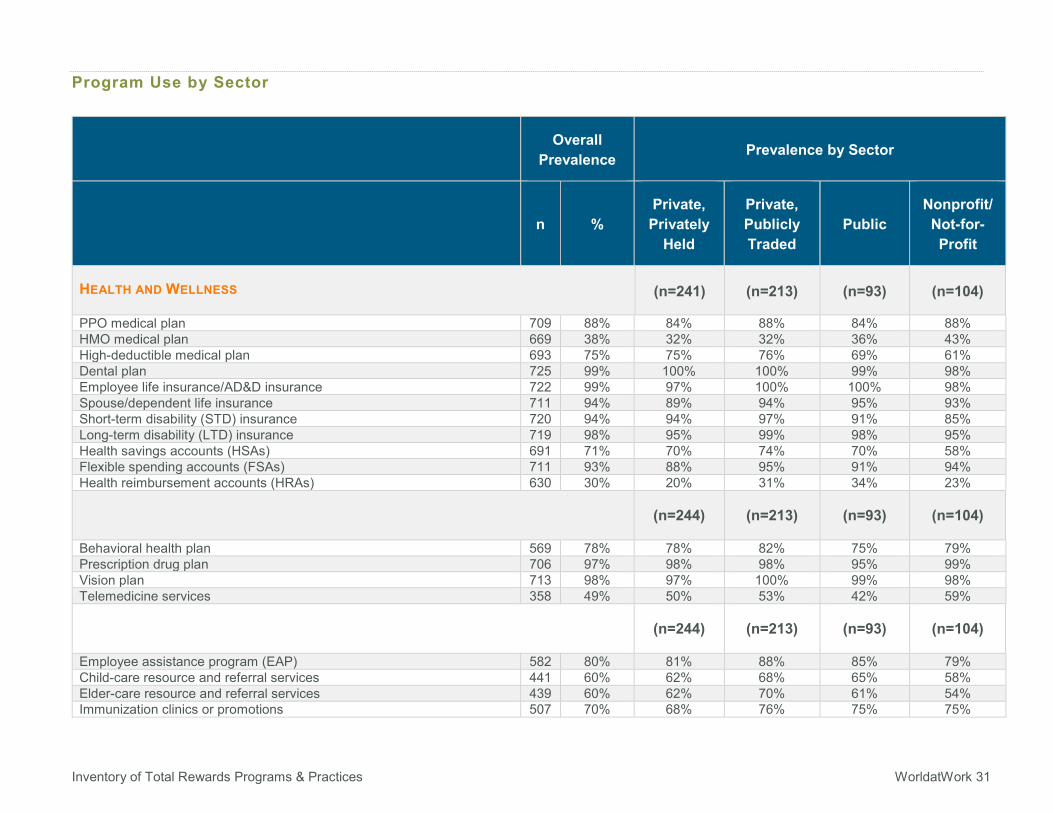
Program Use by Sector
Overall Prevalence Prevalence by Sector
n % Private, Privately
Held
Private, Publicly Traded
Public Nonprofit/ Not-for-Profit
HEALTH AND WELLNESS (n=241) (n=213) (n=93) (n=104)
PPO medical plan 709 88% 84% 88% 84% 88% HMO medical plan 669 38% 32% 32% 36% 43% High-deductible medical plan 693 75% 75% 76% 69% 61% Dental plan 725 99% 100% 100% 99% 98% Employee life insurance/AD&D insurance 722 99% 97% 100% 100% 98% Spouse/dependent life insurance 711 94% 89% 94% 95% 93% Short-term disability (STD) insurance 720 94% 94% 97% 91% 85% Long-term disability (LTD) insurance 719 98% 95% 99% 98% 95% Health savings accounts (HSAs) 691 71% 70% 74% 70% 58% Flexible spending accounts (FSAs) 711 93% 88% 95% 91% 94% Health reimbursement accounts (HRAs) 630 30% 20% 31% 34% 23%
(n=244) (n=213) (n=93) (n=104)
Behavioral health plan 569 78% 78% 82% 75% 79% Prescription drug plan 706 97% 98% 98% 95% 99% Vision plan 713 98% 97% 100% 99% 98% Telemedicine services 358 49% 50% 53% 42% 59%
(n=244) (n=213) (n=93) (n=104)
Employee assistance program (EAP) 582 80% 81% 88% 85% 79% Child-care resource and referral services 441 60% 62% 68% 65% 58% Elder-care resource and referral services 439 60% 62% 70% 61% 54% Immunization clinics or promotions 507 70% 68% 76% 75% 75%
Inventory of Total Rewards Programs & Practices WorldatWork 32
Overall Prevalence Prevalence by Sector
n % Private, Privately
Held
Private, Publicly Traded
Public Nonprofit/ Not-for-Profit
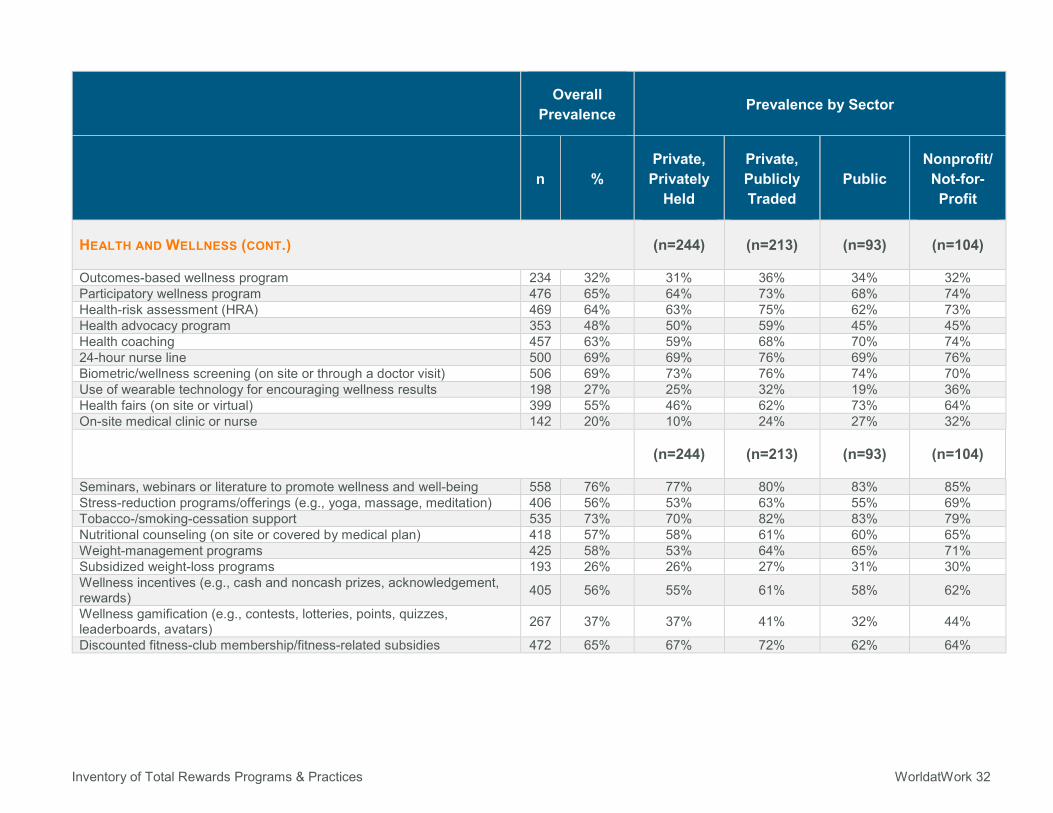
HEALTH AND WELLNESS (CONT.) (n=244) (n=213) (n=93) (n=104)
Outcomes-based wellness program 234 32% 31% 36% 34% 32% Participatory wellness program 476 65% 64% 73% 68% 74% Health-risk assessment (HRA) 469 64% 63% 75% 62% 73% Health advocacy program 353 48% 50% 59% 45% 45% Health coaching 457 63% 59% 68% 70% 74% 24-hour nurse line 500 69% 69% 76% 69% 76% Biometric/wellness screening (on site or through a doctor visit) 506 69% 73% 76% 74% 70% Use of wearable technology for encouraging wellness results 198 27% 25% 32% 19% 36% Health fairs (on site or virtual) 399 55% 46% 62% 73% 64% On-site medical clinic or nurse 142 20% 10% 24% 27% 32%
(n=244) (n=213) (n=93) (n=104)
Seminars, webinars or literature to promote wellness and well-being 558 76% 77% 80% 83% 85% Stress-reduction programs/offerings (e.g., yoga, massage, meditation) 406 56% 53% 63% 55% 69% Tobacco-/smoking-cessation support 535 73% 70% 82% 83% 79% Nutritional counseling (on site or covered by medical plan) 418 57% 58% 61% 60% 65% Weight-management programs 425 58% 53% 64% 65% 71% Subsidized weight-loss programs 193 26% 26% 27% 31% 30% Wellness incentives (e.g., cash and noncash prizes, acknowledgement, rewards) 405 56% 55% 61% 58% 62%
Wellness gamification (e.g., contests, lotteries, points, quizzes, leaderboards, avatars) 267 37% 37% 41% 32% 44%
Discounted fitness-club membership/fitness-related subsidies 472 65% 67% 72% 62% 64%
Inventory of Total Rewards Programs & Practices WorldatWork 33
Overall Prevalence Prevalence by Sector
n % Private, Privately
Held
Private, Publicly Traded
Public Nonprofit/ Not-for-Profit
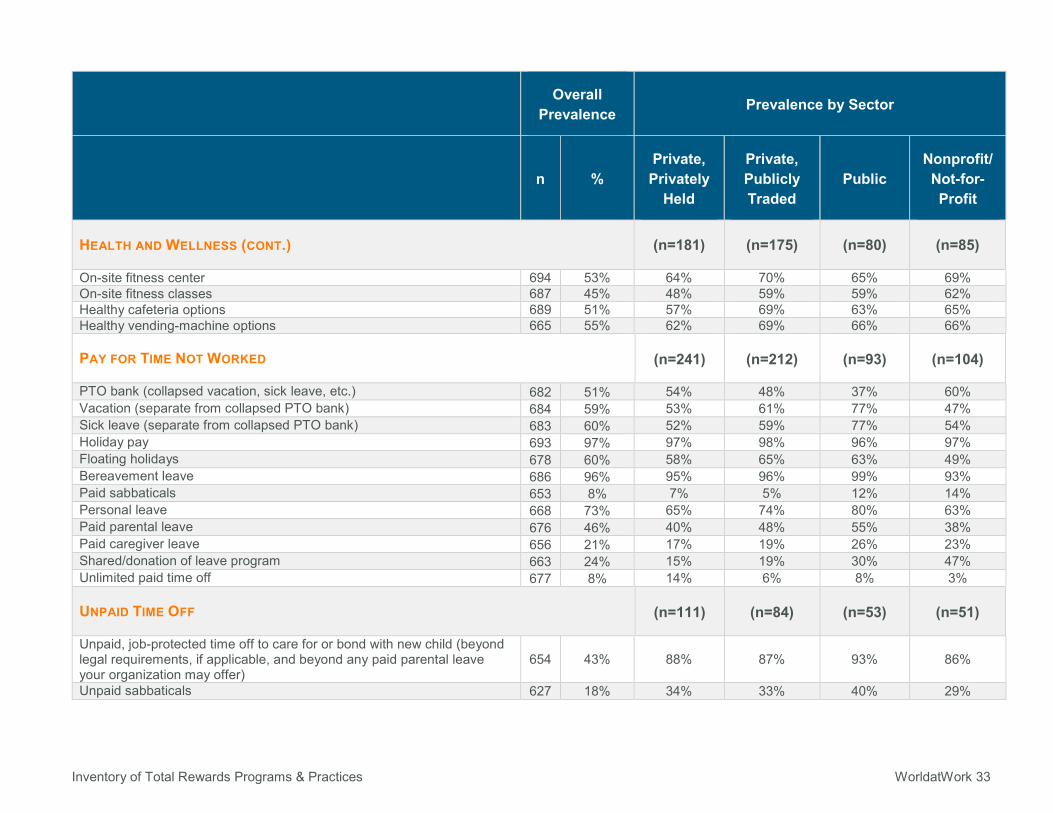
HEALTH AND WELLNESS (CONT.) (n=181) (n=175) (n=80) (n=85)
On-site fitness center 694 53% 64% 70% 65% 69% On-site fitness classes 687 45% 48% 59% 59% 62% Healthy cafeteria options 689 51% 57% 69% 63% 65% Healthy vending-machine options 665 55% 62% 69% 66% 66%
PAY FOR TIME NOT WORKED (n=241) (n=212) (n=93) (n=104)
PTO bank (collapsed vacation, sick leave, etc.) 682 51% 54% 48% 37% 60% Vacation (separate from collapsed PTO bank) 684 59% 53% 61% 77% 47% Sick leave (separate from collapsed PTO bank) 683 60% 52% 59% 77% 54% Holiday pay 693 97% 97% 98% 96% 97% Floating holidays 678 60% 58% 65% 63% 49% Bereavement leave 686 96% 95% 96% 99% 93% Paid sabbaticals 653 8% 7% 5% 12% 14% Personal leave 668 73% 65% 74% 80% 63% Paid parental leave 676 46% 40% 48% 55% 38% Paid caregiver leave 656 21% 17% 19% 26% 23% Shared/donation of leave program 663 24% 15% 19% 30% 47% Unlimited paid time off 677 8% 14% 6% 8% 3%
UNPAID TIME OFF (n=111) (n=84) (n=53) (n=51)
Unpaid, job-protected time off to care for or bond with new child (beyond legal requirements, if applicable, and beyond any paid parental leave your organization may offer)
654 43% 88% 87% 93% 86%
Unpaid sabbaticals 627 18% 34% 33% 40% 29%
Inventory of Total Rewards Programs & Practices WorldatWork 34
Overall Prevalence Prevalence by Sector
n % Private, Privately
Held
Private, Publicly Traded
Public Nonprofit/ Not-for-Profit
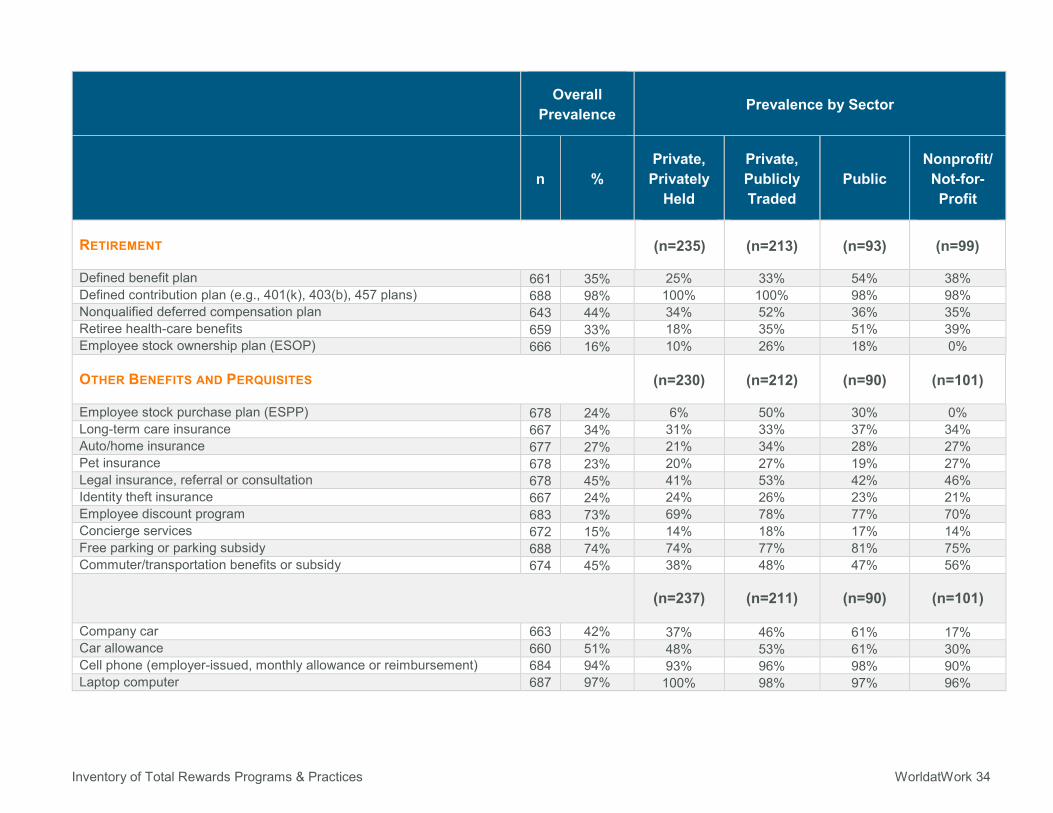
RETIREMENT (n=235) (n=213) (n=93) (n=99)
Defined benefit plan 661 35% 25% 33% 54% 38% Defined contribution plan (e.g., 401(k), 403(b), 457 plans) 688 98% 100% 100% 98% 98% Nonqualified deferred compensation plan 643 44% 34% 52% 36% 35% Retiree health-care benefits 659 33% 18% 35% 51% 39% Employee stock ownership plan (ESOP) 666 16% 10% 26% 18% 0%
OTHER BENEFITS AND PERQUISITES (n=230) (n=212) (n=90) (n=101)
Employee stock purchase plan (ESPP) 678 24% 6% 50% 30% 0% Long-term care insurance 667 34% 31% 33% 37% 34% Auto/home insurance 677 27% 21% 34% 28% 27% Pet insurance 678 23% 20% 27% 19% 27% Legal insurance, referral or consultation 678 45% 41% 53% 42% 46% Identity theft insurance 667 24% 24% 26% 23% 21% Employee discount program 683 73% 69% 78% 77% 70% Concierge services 672 15% 14% 18% 17% 14% Free parking or parking subsidy 688 74% 74% 77% 81% 75% Commuter/transportation benefits or subsidy 674 45% 38% 48% 47% 56%
(n=237) (n=211) (n=90) (n=101)
Company car 663 42% 37% 46% 61% 17% Car allowance 660 51% 48% 53% 61% 30% Cell phone (employer-issued, monthly allowance or reimbursement) 684 94% 93% 96% 98% 90% Laptop computer 687 97% 100% 98% 97% 96%
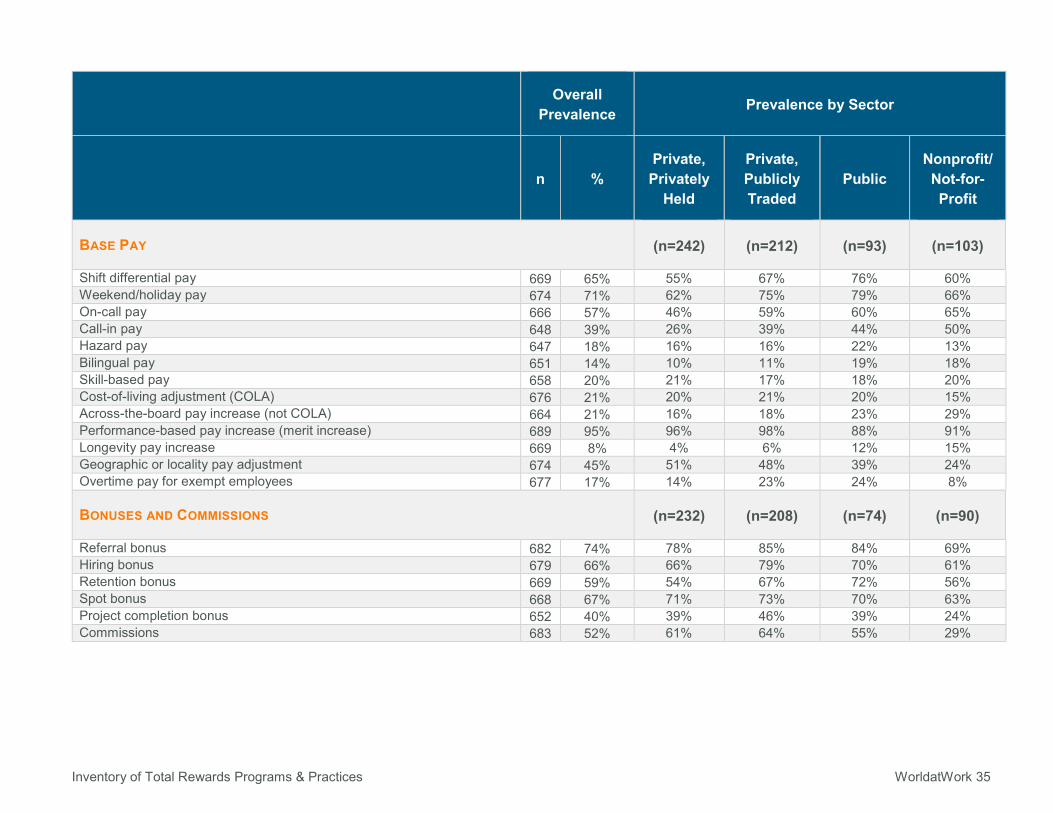
Inventory of Total Rewards Programs & Practices WorldatWork 35
Overall Prevalence Prevalence by Sector
n % Private, Privately
Held
Private, Publicly Traded
Public Nonprofit/ Not-for-Profit
BASE PAY (n=242) (n=212) (n=93) (n=103)
Shift differential pay 669 65% 55% 67% 76% 60% Weekend/holiday pay 674 71% 62% 75% 79% 66% On-call pay 666 57% 46% 59% 60% 65% Call-in pay 648 39% 26% 39% 44% 50% Hazard pay 647 18% 16% 16% 22% 13% Bilingual pay 651 14% 10% 11% 19% 18% Skill-based pay 658 20% 21% 17% 18% 20% Cost-of-living adjustment (COLA) 676 21% 20% 21% 20% 15% Across-the-board pay increase (not COLA) 664 21% 16% 18% 23% 29% Performance-based pay increase (merit increase) 689 95% 96% 98% 88% 91% Longevity pay increase 669 8% 4% 6% 12% 15% Geographic or locality pay adjustment 674 45% 51% 48% 39% 24% Overtime pay for exempt employees 677 17% 14% 23% 24% 8%
BONUSES AND COMMISSIONS (n=232) (n=208) (n=74) (n=90)
Referral bonus 682 74% 78% 85% 84% 69% Hiring bonus 679 66% 66% 79% 70% 61% Retention bonus 669 59% 54% 67% 72% 56% Spot bonus 668 67% 71% 73% 70% 63% Project completion bonus 652 40% 39% 46% 39% 24% Commissions 683 52% 61% 64% 55% 29%
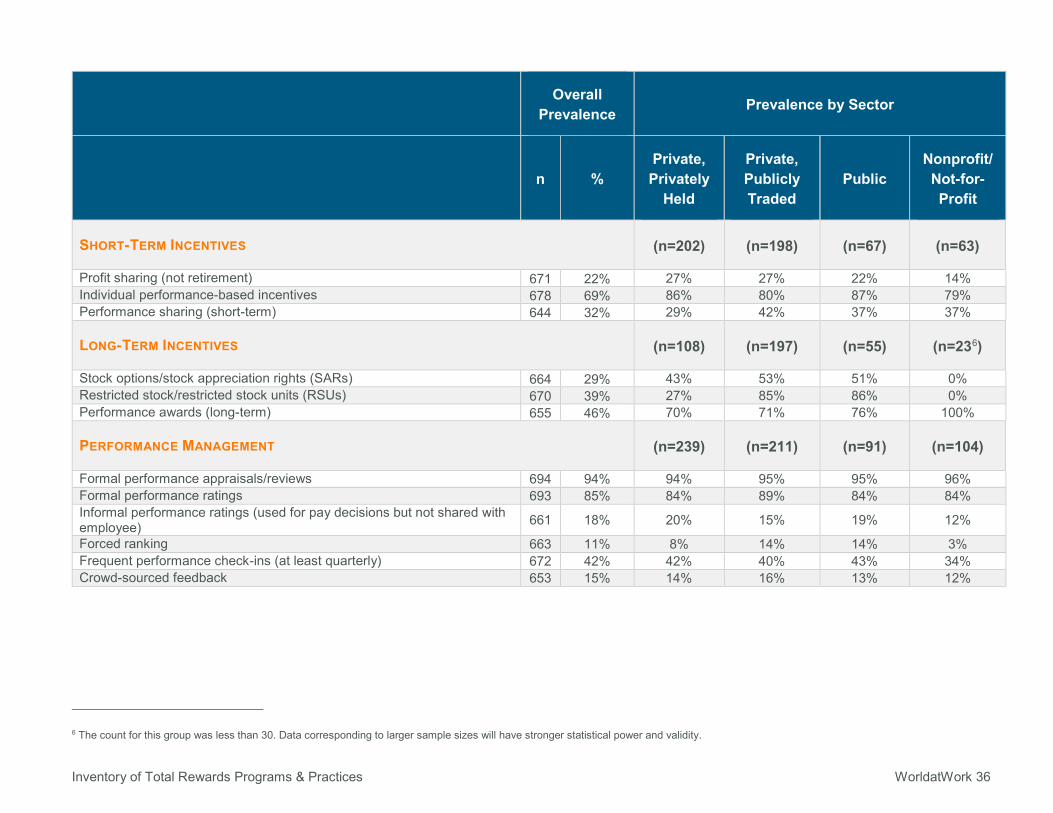
Inventory of Total Rewards Programs & Practices WorldatWork 36
Overall Prevalence Prevalence by Sector
n % Private, Privately
Held
Private, Publicly Traded
Public Nonprofit/ Not-for-Profit
SHORT-TERM INCENTIVES (n=202) (n=198) (n=67) (n=63)
Profit sharing (not retirement) 671 22% 27% 27% 22% 14% Individual performance-based incentives 678 69% 86% 80% 87% 79% Performance sharing (short-term) 644 32% 29% 42% 37% 37%
LONG-TERM INCENTIVES (n=108) (n=197) (n=55) (n=236)
Stock options/stock appreciation rights (SARs) 664 29% 43% 53% 51% 0% Restricted stock/restricted stock units (RSUs) 670 39% 27% 85% 86% 0% Performance awards (long-term) 655 46% 70% 71% 76% 100%
PERFORMANCE MANAGEMENT (n=239) (n=211) (n=91) (n=104)
Formal performance appraisals/reviews 694 94% 94% 95% 95% 96% Formal performance ratings 693 85% 84% 89% 84% 84% Informal performance ratings (used for pay decisions but not shared with employee) 661 18% 20% 15% 19% 12%
Forced ranking 663 11% 8% 14% 14% 3% Frequent performance check-ins (at least quarterly) 672 42% 42% 40% 43% 34% Crowd-sourced feedback 653 15% 14% 16% 13% 12%
6 The count for this group was less than 30. Data corresponding to larger sample sizes will have stronger statistical power and validity.
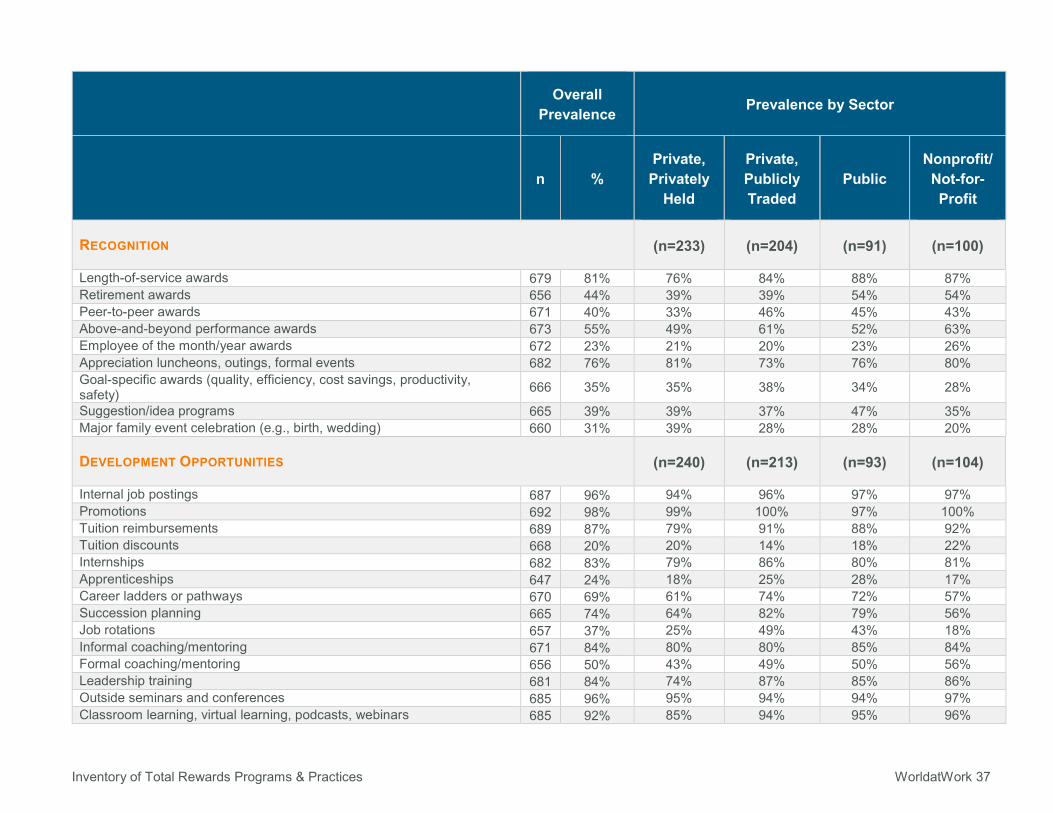
Inventory of Total Rewards Programs & Practices WorldatWork 37
Overall Prevalence Prevalence by Sector
n % Private, Privately
Held
Private, Publicly Traded
Public Nonprofit/ Not-for-Profit
RECOGNITION (n=233) (n=204) (n=91) (n=100)
Length-of-service awards 679 81% 76% 84% 88% 87% Retirement awards 656 44% 39% 39% 54% 54% Peer-to-peer awards 671 40% 33% 46% 45% 43% Above-and-beyond performance awards 673 55% 49% 61% 52% 63% Employee of the month/year awards 672 23% 21% 20% 23% 26% Appreciation luncheons, outings, formal events 682 76% 81% 73% 76% 80% Goal-specific awards (quality, efficiency, cost savings, productivity, safety) 666 35% 35% 38% 34% 28%
Suggestion/idea programs 665 39% 39% 37% 47% 35% Major family event celebration (e.g., birth, wedding) 660 31% 39% 28% 28% 20%
DEVELOPMENT OPPORTUNITIES (n=240) (n=213) (n=93) (n=104)
Internal job postings 687 96% 94% 96% 97% 97% Promotions 692 98% 99% 100% 97% 100% Tuition reimbursements 689 87% 79% 91% 88% 92% Tuition discounts 668 20% 20% 14% 18% 22% Internships 682 83% 79% 86% 80% 81% Apprenticeships 647 24% 18% 25% 28% 17% Career ladders or pathways 670 69% 61% 74% 72% 57% Succession planning 665 74% 64% 82% 79% 56% Job rotations 657 37% 25% 49% 43% 18% Informal coaching/mentoring 671 84% 80% 80% 85% 84% Formal coaching/mentoring 656 50% 43% 49% 50% 56% Leadership training 681 84% 74% 87% 85% 86% Outside seminars and conferences 685 96% 95% 94% 94% 97% Classroom learning, virtual learning, podcasts, webinars 685 92% 85% 94% 95% 96%
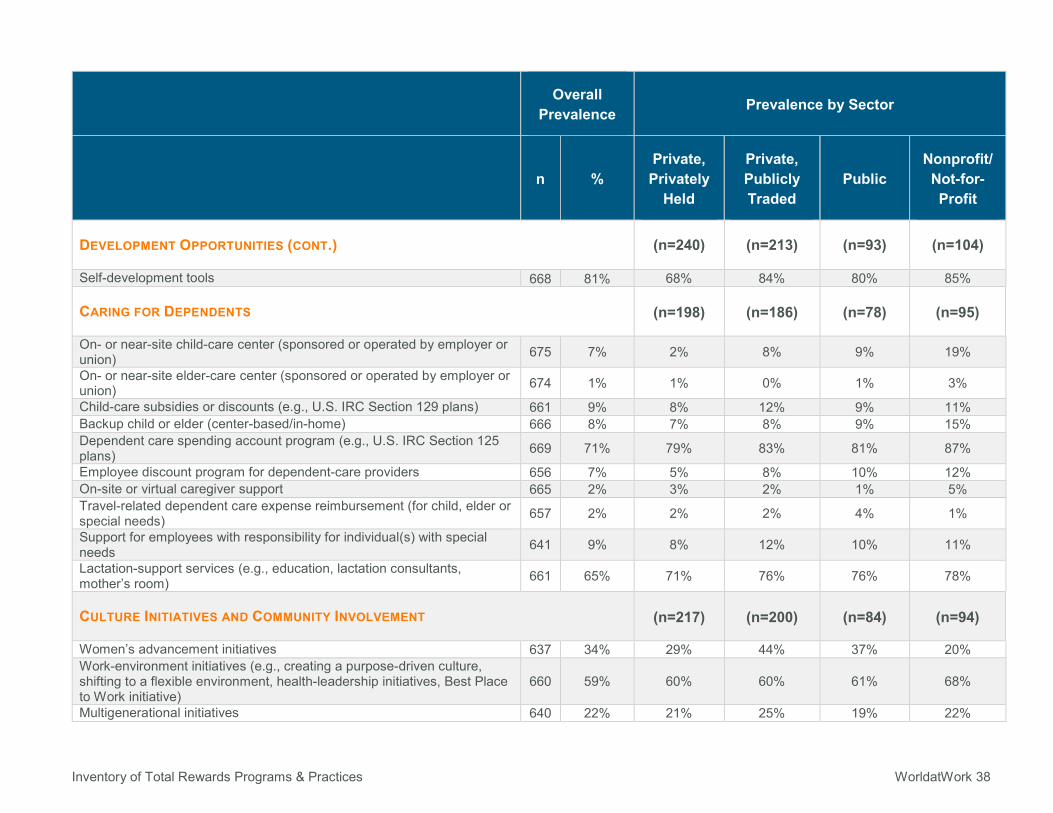
Inventory of Total Rewards Programs & Practices WorldatWork 38
Overall Prevalence Prevalence by Sector
n % Private, Privately
Held
Private, Publicly Traded
Public Nonprofit/ Not-for-Profit
DEVELOPMENT OPPORTUNITIES (CONT.) (n=240) (n=213) (n=93) (n=104)
Self-development tools 668 81% 68% 84% 80% 85%
CARING FOR DEPENDENTS (n=198) (n=186) (n=78) (n=95)
On- or near-site child-care center (sponsored or operated by employer or union) 675 7% 2% 8% 9% 19%
On- or near-site elder-care center (sponsored or operated by employer or union) 674 1% 1% 0% 1% 3%
Child-care subsidies or discounts (e.g., U.S. IRC Section 129 plans) 661 9% 8% 12% 9% 11% Backup child or elder (center-based/in-home) 666 8% 7% 8% 9% 15% Dependent care spending account program (e.g., U.S. IRC Section 125 plans) 669 71% 79% 83% 81% 87%
Employee discount program for dependent-care providers 656 7% 5% 8% 10% 12% On-site or virtual caregiver support 665 2% 3% 2% 1% 5% Travel-related dependent care expense reimbursement (for child, elder or special needs) 657 2% 2% 2% 4% 1%
Support for employees with responsibility for individual(s) with special needs 641 9% 8% 12% 10% 11%
Lactation-support services (e.g., education, lactation consultants, mother’s room) 661 65% 71% 76% 76% 78%
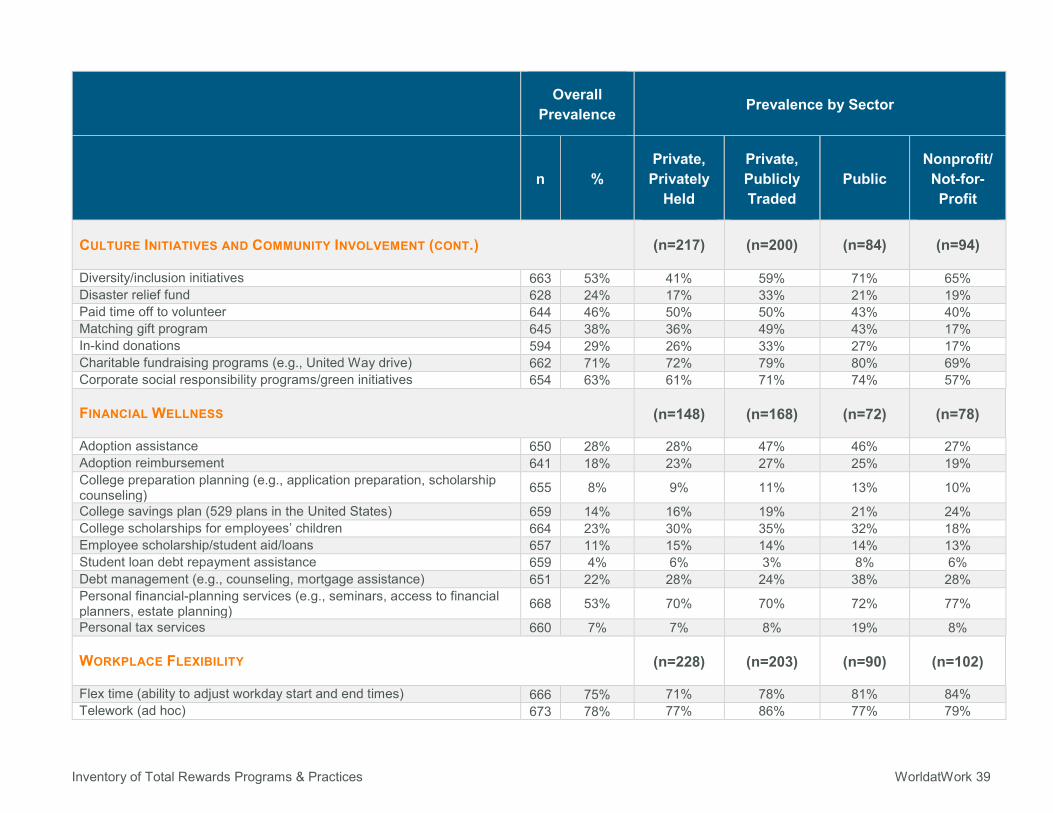
CULTURE INITIATIVES AND COMMUNITY INVOLVEMENT (n=217) (n=200) (n=84) (n=94)
Women’s advancement initiatives 637 34% 29% 44% 37% 20% Work-environment initiatives (e.g., creating a purpose-driven culture, shifting to a flexible environment, health-leadership initiatives, Best Place to Work initiative)
660 59% 60% 60% 61% 68%
Multigenerational initiatives 640 22% 21% 25% 19% 22%
Inventory of Total Rewards Programs & Practices WorldatWork 39
Overall Prevalence Prevalence by Sector
n % Private, Privately
Held
Private, Publicly Traded
Public Nonprofit/ Not-for-Profit
CULTURE INITIATIVES AND COMMUNITY INVOLVEMENT (CONT.) (n=217) (n=200) (n=84) (n=94)
Diversity/inclusion initiatives 663 53% 41% 59% 71% 65% Disaster relief fund 628 24% 17% 33% 21% 19% Paid time off to volunteer 644 46% 50% 50% 43% 40% Matching gift program 645 38% 36% 49% 43% 17% In-kind donations 594 29% 26% 33% 27% 17% Charitable fundraising programs (e.g., United Way drive) 662 71% 72% 79% 80% 69% Corporate social responsibility programs/green initiatives 654 63% 61% 71% 74% 57%
FINANCIAL WELLNESS (n=148) (n=168) (n=72) (n=78)
Adoption assistance 650 28% 28% 47% 46% 27% Adoption reimbursement 641 18% 23% 27% 25% 19% College preparation planning (e.g., application preparation, scholarship counseling) 655 8% 9% 11% 13% 10%
College savings plan (529 plans in the United States) 659 14% 16% 19% 21% 24% College scholarships for employees’ children 664 23% 30% 35% 32% 18% Employee scholarship/student aid/loans 657 11% 15% 14% 14% 13% Student loan debt repayment assistance 659 4% 6% 3% 8% 6% Debt management (e.g., counseling, mortgage assistance) 651 22% 28% 24% 38% 28% Personal financial-planning services (e.g., seminars, access to financial planners, estate planning) 668 53% 70% 70% 72% 77%
Personal tax services 660 7% 7% 8% 19% 8%
WORKPLACE FLEXIBILITY (n=228) (n=203) (n=90) (n=102)
Flex time (ability to adjust workday start and end times) 666 75% 71% 78% 81% 84% Telework (ad hoc) 673 78% 77% 86% 77% 79%
Inventory of Total Rewards Programs & Practices WorldatWork 40
Overall Prevalence Prevalence by Sector
n % Private, Privately
Held
Private, Publicly Traded
Public Nonprofit/ Not-for-Profit
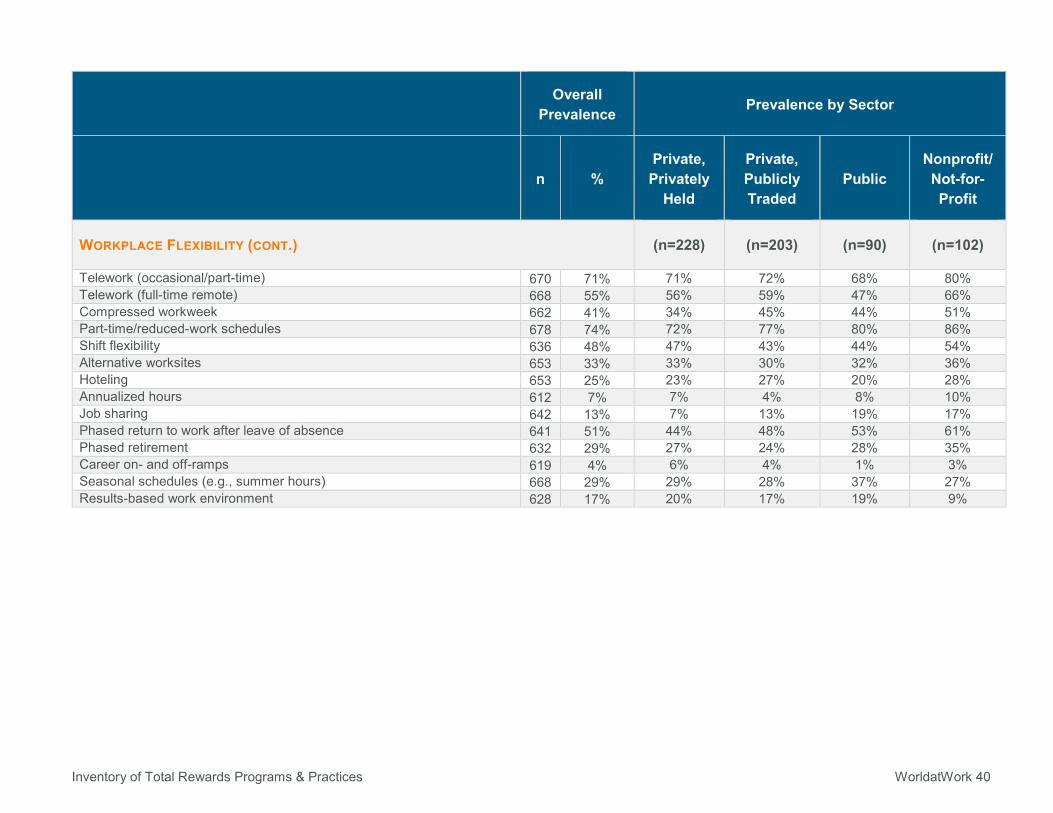
WORKPLACE FLEXIBILITY (CONT.) (n=228) (n=203) (n=90) (n=102)
Telework (occasional/part-time) 670 71% 71% 72% 68% 80% Telework (full-time remote) 668 55% 56% 59% 47% 66% Compressed workweek 662 41% 34% 45% 44% 51% Part-time/reduced-work schedules 678 74% 72% 77% 80% 86% Shift flexibility 636 48% 47% 43% 44% 54% Alternative worksites 653 33% 33% 30% 32% 36% Hoteling 653 25% 23% 27% 20% 28% Annualized hours 612 7% 7% 4% 8% 10% Job sharing 642 13% 7% 13% 19% 17% Phased return to work after leave of absence 641 51% 44% 48% 53% 61% Phased retirement 632 29% 27% 24% 28% 35% Career on- and off-ramps 619 4% 6% 4% 1% 3% Seasonal schedules (e.g., summer hours) 668 29% 29% 28% 37% 27% Results-based work environment 628 17% 20% 17% 19% 9%
Inventory of Total Rewards Programs & Practices WorldatWork 41
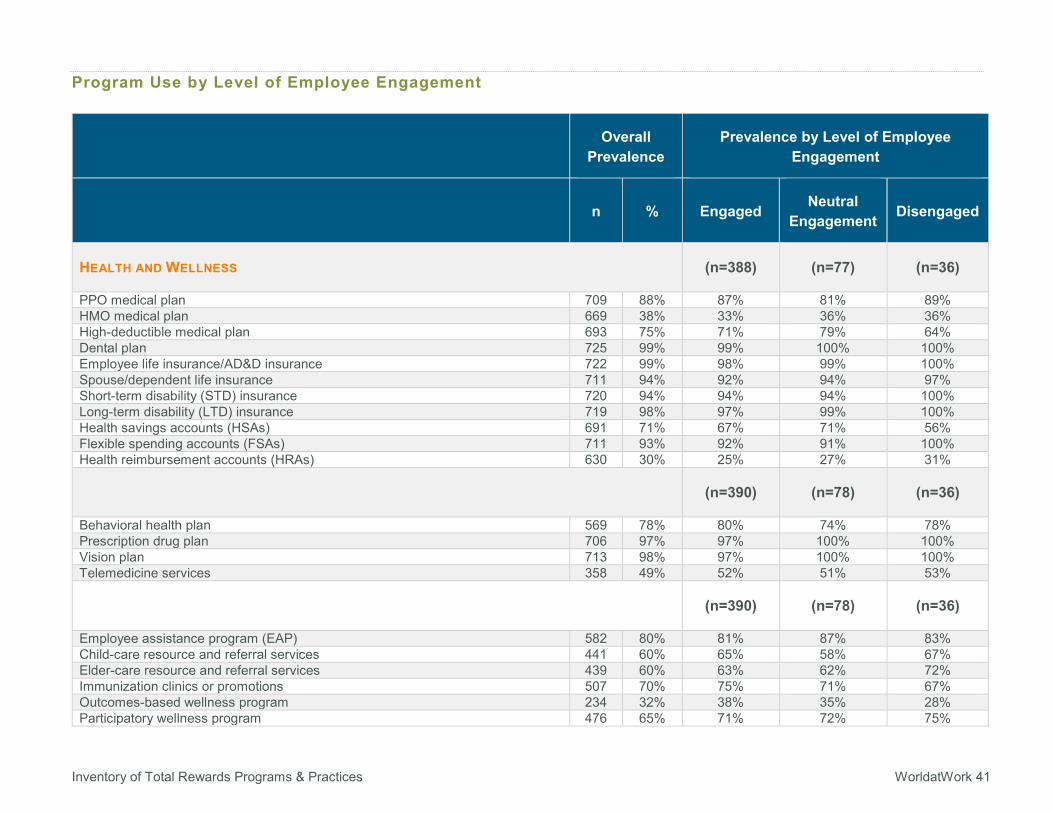
Program Use by Level of Employee Engagement
Overall Prevalence
Prevalence by Level of Employee Engagement
n % Engaged Neutral Engagement Disengaged
HEALTH AND WELLNESS (n=388) (n=77) (n=36)
PPO medical plan 709 88% 87% 81% 89% HMO medical plan 669 38% 33% 36% 36% High-deductible medical plan 693 75% 71% 79% 64% Dental plan 725 99% 99% 100% 100% Employee life insurance/AD&D insurance 722 99% 98% 99% 100% Spouse/dependent life insurance 711 94% 92% 94% 97% Short-term disability (STD) insurance 720 94% 94% 94% 100% Long-term disability (LTD) insurance 719 98% 97% 99% 100% Health savings accounts (HSAs) 691 71% 67% 71% 56% Flexible spending accounts (FSAs) 711 93% 92% 91% 100% Health reimbursement accounts (HRAs) 630 30% 25% 27% 31%
(n=390) (n=78) (n=36)
Behavioral health plan 569 78% 80% 74% 78% Prescription drug plan 706 97% 97% 100% 100% Vision plan 713 98% 97% 100% 100% Telemedicine services 358 49% 52% 51% 53%
(n=390) (n=78) (n=36)
Employee assistance program (EAP) 582 80% 81% 87% 83% Child-care resource and referral services 441 60% 65% 58% 67% Elder-care resource and referral services 439 60% 63% 62% 72% Immunization clinics or promotions 507 70% 75% 71% 67% Outcomes-based wellness program 234 32% 38% 35% 28% Participatory wellness program 476 65% 71% 72% 75%
Inventory of Total Rewards Programs & Practices WorldatWork 42
Overall Prevalence
Prevalence by Level of Employee Engagement
n % Engaged Neutral Engagement Disengaged
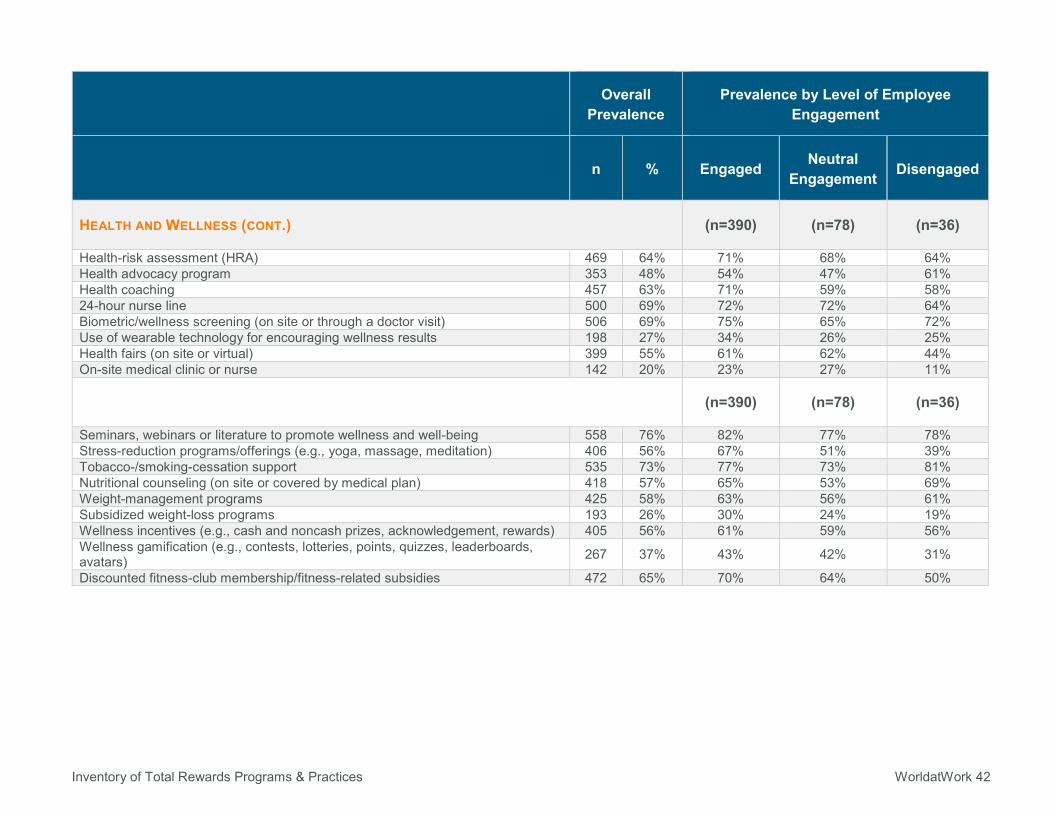
HEALTH AND WELLNESS (CONT.) (n=390) (n=78) (n=36)
Health-risk assessment (HRA) 469 64% 71% 68% 64% Health advocacy program 353 48% 54% 47% 61% Health coaching 457 63% 71% 59% 58% 24-hour nurse line 500 69% 72% 72% 64% Biometric/wellness screening (on site or through a doctor visit) 506 69% 75% 65% 72% Use of wearable technology for encouraging wellness results 198 27% 34% 26% 25% Health fairs (on site or virtual) 399 55% 61% 62% 44% On-site medical clinic or nurse 142 20% 23% 27% 11%
(n=390) (n=78) (n=36)
Seminars, webinars or literature to promote wellness and well-being 558 76% 82% 77% 78% Stress-reduction programs/offerings (e.g., yoga, massage, meditation) 406 56% 67% 51% 39% Tobacco-/smoking-cessation support 535 73% 77% 73% 81% Nutritional counseling (on site or covered by medical plan) 418 57% 65% 53% 69% Weight-management programs 425 58% 63% 56% 61% Subsidized weight-loss programs 193 26% 30% 24% 19% Wellness incentives (e.g., cash and noncash prizes, acknowledgement, rewards) 405 56% 61% 59% 56% Wellness gamification (e.g., contests, lotteries, points, quizzes, leaderboards, avatars) 267 37% 43% 42% 31%
Discounted fitness-club membership/fitness-related subsidies 472 65% 70% 64% 50%
Inventory of Total Rewards Programs & Practices WorldatWork 43
Overall Prevalence
Prevalence by Level of Employee Engagement
n % Engaged Neutral Engagement Disengaged
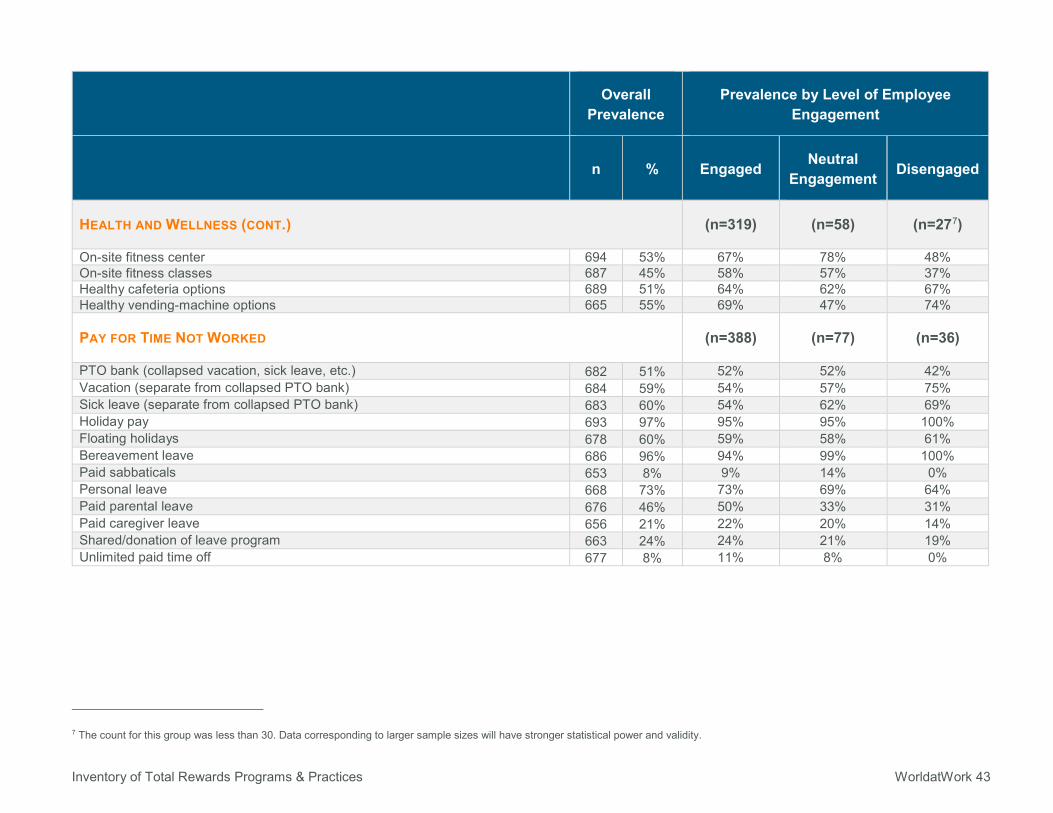
HEALTH AND WELLNESS (CONT.) (n=319) (n=58) (n=277)
On-site fitness center 694 53% 67% 78% 48% On-site fitness classes 687 45% 58% 57% 37% Healthy cafeteria options 689 51% 64% 62% 67% Healthy vending-machine options 665 55% 69% 47% 74%
PAY FOR TIME NOT WORKED (n=388) (n=77) (n=36)
PTO bank (collapsed vacation, sick leave, etc.) 682 51% 52% 52% 42% Vacation (separate from collapsed PTO bank) 684 59% 54% 57% 75% Sick leave (separate from collapsed PTO bank) 683 60% 54% 62% 69% Holiday pay 693 97% 95% 95% 100% Floating holidays 678 60% 59% 58% 61% Bereavement leave 686 96% 94% 99% 100% Paid sabbaticals 653 8% 9% 14% 0% Personal leave 668 73% 73% 69% 64% Paid parental leave 676 46% 50% 33% 31% Paid caregiver leave 656 21% 22% 20% 14% Shared/donation of leave program 663 24% 24% 21% 19% Unlimited paid time off 677 8% 11% 8% 0%
7 The count for this group was less than 30. Data corresponding to larger sample sizes will have stronger statistical power and validity.
Inventory of Total Rewards Programs & Practices WorldatWork 44
Overall Prevalence
Prevalence by Level of Employee Engagement
n % Engaged Neutral Engagement Disengaged
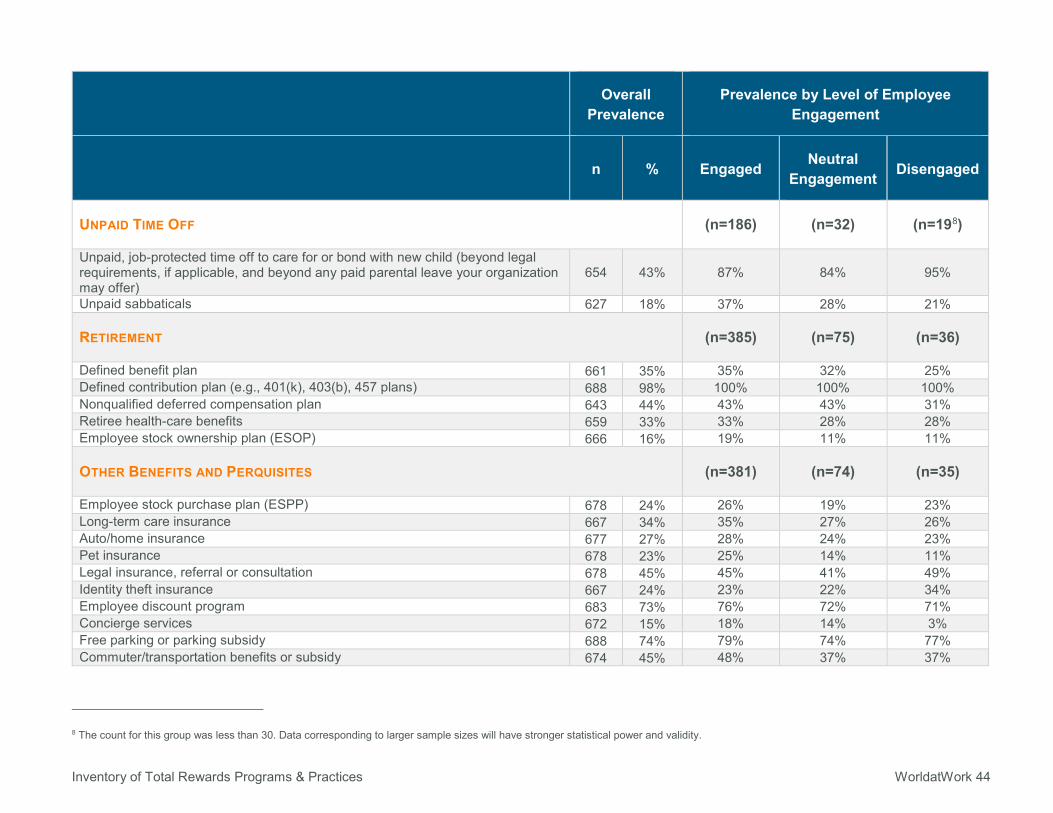
UNPAID TIME OFF (n=186) (n=32) (n=198)
Unpaid, job-protected time off to care for or bond with new child (beyond legal requirements, if applicable, and beyond any paid parental leave your organization may offer)
654 43% 87% 84% 95%
Unpaid sabbaticals 627 18% 37% 28% 21%
RETIREMENT (n=385) (n=75) (n=36)
Defined benefit plan 661 35% 35% 32% 25% Defined contribution plan (e.g., 401(k), 403(b), 457 plans) 688 98% 100% 100% 100% Nonqualified deferred compensation plan 643 44% 43% 43% 31% Retiree health-care benefits 659 33% 33% 28% 28% Employee stock ownership plan (ESOP) 666 16% 19% 11% 11%
OTHER BENEFITS AND PERQUISITES (n=381) (n=74) (n=35)
Employee stock purchase plan (ESPP) 678 24% 26% 19% 23% Long-term care insurance 667 34% 35% 27% 26% Auto/home insurance 677 27% 28% 24% 23% Pet insurance 678 23% 25% 14% 11% Legal insurance, referral or consultation 678 45% 45% 41% 49% Identity theft insurance 667 24% 23% 22% 34% Employee discount program 683 73% 76% 72% 71% Concierge services 672 15% 18% 14% 3% Free parking or parking subsidy 688 74% 79% 74% 77% Commuter/transportation benefits or subsidy 674 45% 48% 37% 37%
8 The count for this group was less than 30. Data corresponding to larger sample sizes will have stronger statistical power and validity.
Inventory of Total Rewards Programs & Practices WorldatWork 45
Overall Prevalence
Prevalence by Level of Employee Engagement
n % Engaged Neutral Engagement Disengaged
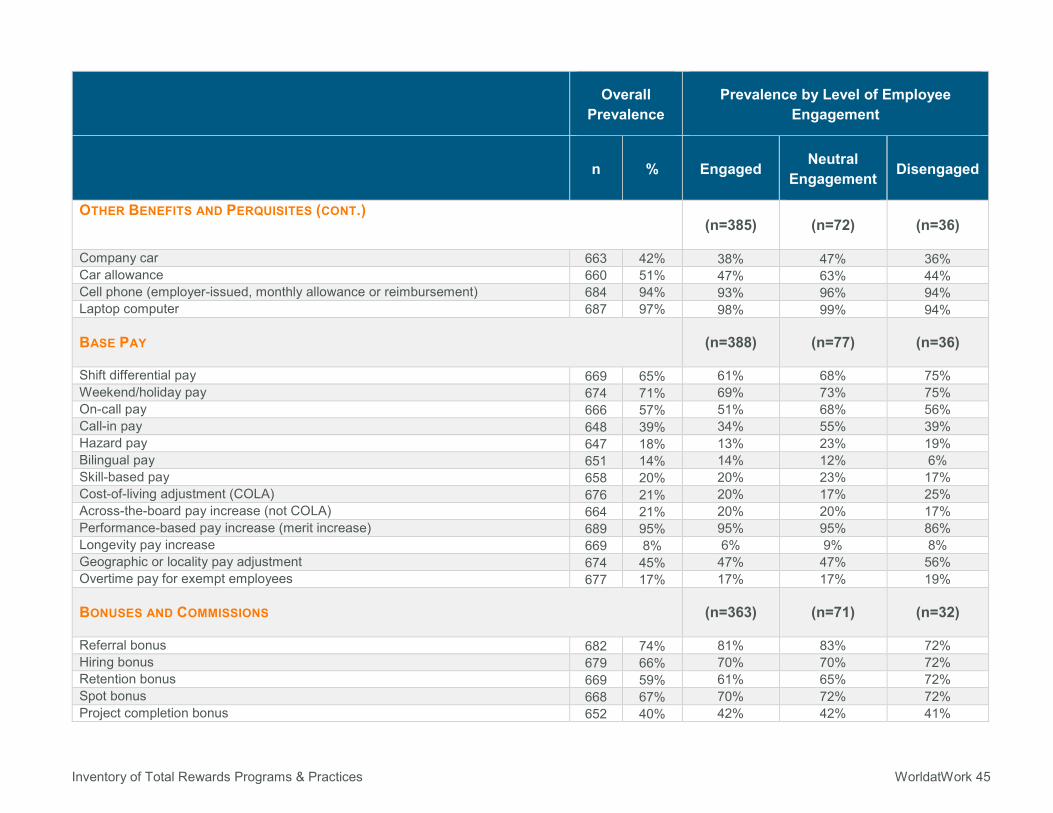
OTHER BENEFITS AND PERQUISITES (CONT.)
(n=385) (n=72) (n=36)
Company car 663 42% 38% 47% 36% Car allowance 660 51% 47% 63% 44% Cell phone (employer-issued, monthly allowance or reimbursement) 684 94% 93% 96% 94% Laptop computer 687 97% 98% 99% 94%
BASE PAY (n=388) (n=77) (n=36)
Shift differential pay 669 65% 61% 68% 75% Weekend/holiday pay 674 71% 69% 73% 75% On-call pay 666 57% 51% 68% 56% Call-in pay 648 39% 34% 55% 39% Hazard pay 647 18% 13% 23% 19% Bilingual pay 651 14% 14% 12% 6% Skill-based pay 658 20% 20% 23% 17% Cost-of-living adjustment (COLA) 676 21% 20% 17% 25% Across-the-board pay increase (not COLA) 664 21% 20% 20% 17% Performance-based pay increase (merit increase) 689 95% 95% 95% 86% Longevity pay increase 669 8% 6% 9% 8% Geographic or locality pay adjustment 674 45% 47% 47% 56% Overtime pay for exempt employees 677 17% 17% 17% 19%
BONUSES AND COMMISSIONS (n=363) (n=71) (n=32)
Referral bonus 682 74% 81% 83% 72% Hiring bonus 679 66% 70% 70% 72% Retention bonus 669 59% 61% 65% 72% Spot bonus 668 67% 70% 72% 72% Project completion bonus 652 40% 42% 42% 41%
Inventory of Total Rewards Programs & Practices WorldatWork 46
Overall Prevalence
Prevalence by Level of Employee Engagement
n % Engaged Neutral Engagement Disengaged
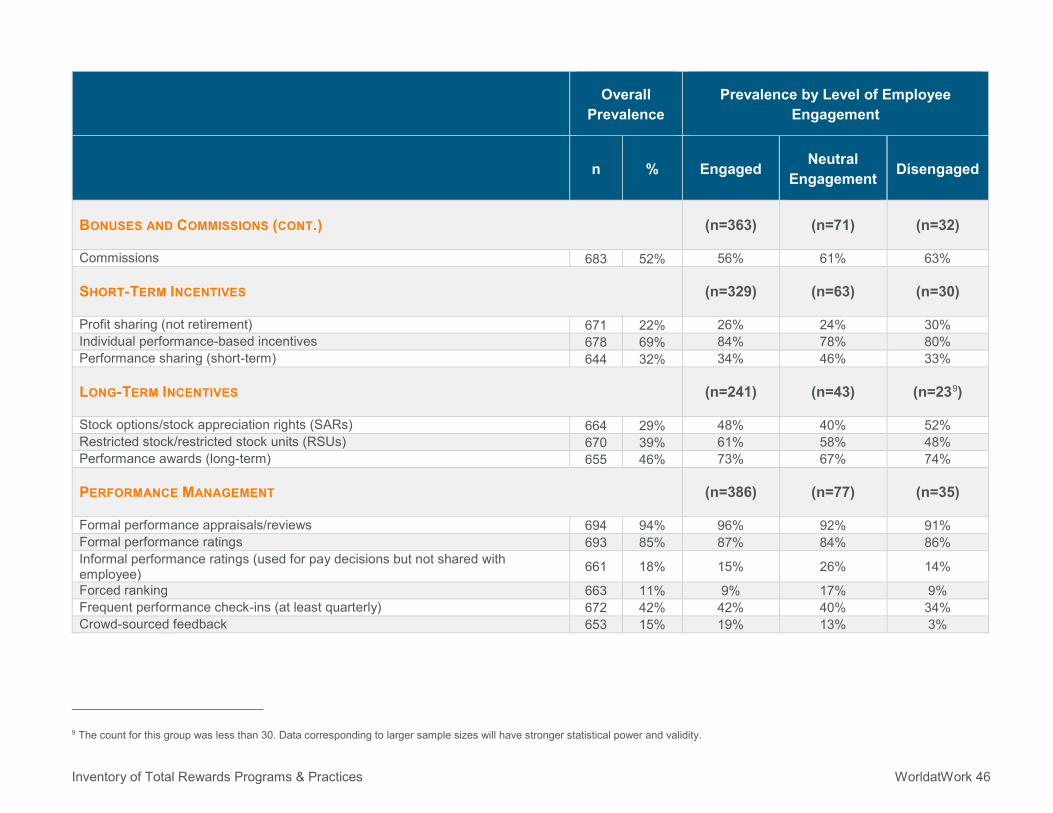
BONUSES AND COMMISSIONS (CONT.) (n=363) (n=71) (n=32)
Commissions 683 52% 56% 61% 63%
SHORT-TERM INCENTIVES (n=329) (n=63) (n=30)
Profit sharing (not retirement) 671 22% 26% 24% 30% Individual performance-based incentives 678 69% 84% 78% 80% Performance sharing (short-term) 644 32% 34% 46% 33%
LONG-TERM INCENTIVES (n=241) (n=43) (n=239)
Stock options/stock appreciation rights (SARs) 664 29% 48% 40% 52% Restricted stock/restricted stock units (RSUs) 670 39% 61% 58% 48% Performance awards (long-term) 655 46% 73% 67% 74%
PERFORMANCE MANAGEMENT (n=386) (n=77) (n=35)
Formal performance appraisals/reviews 694 94% 96% 92% 91% Formal performance ratings 693 85% 87% 84% 86% Informal performance ratings (used for pay decisions but not shared with employee) 661 18% 15% 26% 14%
Forced ranking 663 11% 9% 17% 9% Frequent performance check-ins (at least quarterly) 672 42% 42% 40% 34% Crowd-sourced feedback 653 15% 19% 13% 3%
9 The count for this group was less than 30. Data corresponding to larger sample sizes will have stronger statistical power and validity.
Inventory of Total Rewards Programs & Practices WorldatWork 47
Overall Prevalence
Prevalence by Level of Employee Engagement
n % Engaged Neutral Engagement Disengaged
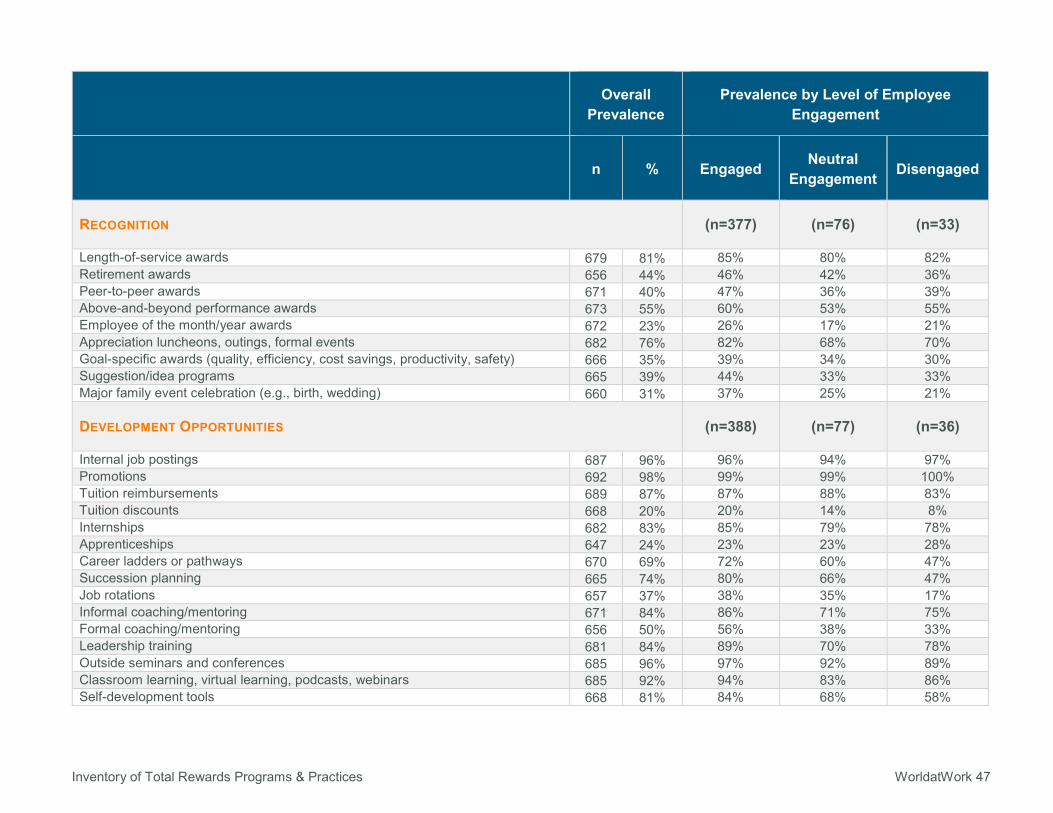
RECOGNITION (n=377) (n=76) (n=33)
Length-of-service awards 679 81% 85% 80% 82% Retirement awards 656 44% 46% 42% 36% Peer-to-peer awards 671 40% 47% 36% 39% Above-and-beyond performance awards 673 55% 60% 53% 55% Employee of the month/year awards 672 23% 26% 17% 21% Appreciation luncheons, outings, formal events 682 76% 82% 68% 70% Goal-specific awards (quality, efficiency, cost savings, productivity, safety) 666 35% 39% 34% 30% Suggestion/idea programs 665 39% 44% 33% 33% Major family event celebration (e.g., birth, wedding) 660 31% 37% 25% 21%
DEVELOPMENT OPPORTUNITIES (n=388) (n=77) (n=36)
Internal job postings 687 96% 96% 94% 97% Promotions 692 98% 99% 99% 100% Tuition reimbursements 689 87% 87% 88% 83% Tuition discounts 668 20% 20% 14% 8% Internships 682 83% 85% 79% 78% Apprenticeships 647 24% 23% 23% 28% Career ladders or pathways 670 69% 72% 60% 47% Succession planning 665 74% 80% 66% 47% Job rotations 657 37% 38% 35% 17% Informal coaching/mentoring 671 84% 86% 71% 75% Formal coaching/mentoring 656 50% 56% 38% 33% Leadership training 681 84% 89% 70% 78% Outside seminars and conferences 685 96% 97% 92% 89% Classroom learning, virtual learning, podcasts, webinars 685 92% 94% 83% 86% Self-development tools 668 81% 84% 68% 58%
Inventory of Total Rewards Programs & Practices WorldatWork 48
Overall Prevalence
Prevalence by Level of Employee Engagement
n % Engaged Neutral Engagement Disengaged
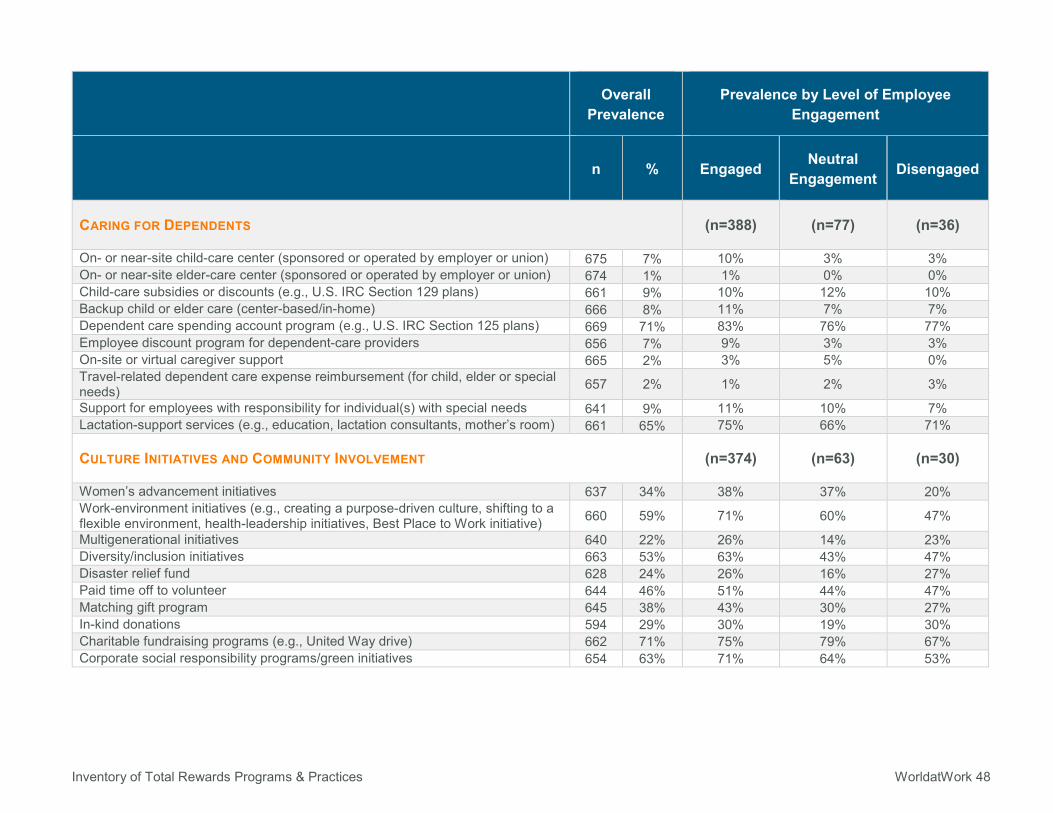
CARING FOR DEPENDENTS (n=388) (n=77) (n=36)
On- or near-site child-care center (sponsored or operated by employer or union) 675 7% 10% 3% 3% On- or near-site elder-care center (sponsored or operated by employer or union) 674 1% 1% 0% 0% Child-care subsidies or discounts (e.g., U.S. IRC Section 129 plans) 661 9% 10% 12% 10% Backup child or elder care (center-based/in-home) 666 8% 11% 7% 7% Dependent care spending account program (e.g., U.S. IRC Section 125 plans) 669 71% 83% 76% 77% Employee discount program for dependent-care providers 656 7% 9% 3% 3% On-site or virtual caregiver support 665 2% 3% 5% 0% Travel-related dependent care expense reimbursement (for child, elder or special needs) 657 2% 1% 2% 3%
Support for employees with responsibility for individual(s) with special needs 641 9% 11% 10% 7% Lactation-support services (e.g., education, lactation consultants, mother’s room) 661 65% 75% 66% 71%
CULTURE INITIATIVES AND COMMUNITY INVOLVEMENT (n=374) (n=63) (n=30)
Women’s advancement initiatives 637 34% 38% 37% 20% Work-environment initiatives (e.g., creating a purpose-driven culture, shifting to a flexible environment, health-leadership initiatives, Best Place to Work initiative) 660 59% 71% 60% 47%
Multigenerational initiatives 640 22% 26% 14% 23% Diversity/inclusion initiatives 663 53% 63% 43% 47% Disaster relief fund 628 24% 26% 16% 27% Paid time off to volunteer 644 46% 51% 44% 47% Matching gift program 645 38% 43% 30% 27% In-kind donations 594 29% 30% 19% 30% Charitable fundraising programs (e.g., United Way drive) 662 71% 75% 79% 67% Corporate social responsibility programs/green initiatives 654 63% 71% 64% 53%
Inventory of Total Rewards Programs & Practices WorldatWork 49
Overall Prevalence
Prevalence by Level of Employee Engagement
n % Engaged Neutral Engagement Disengaged
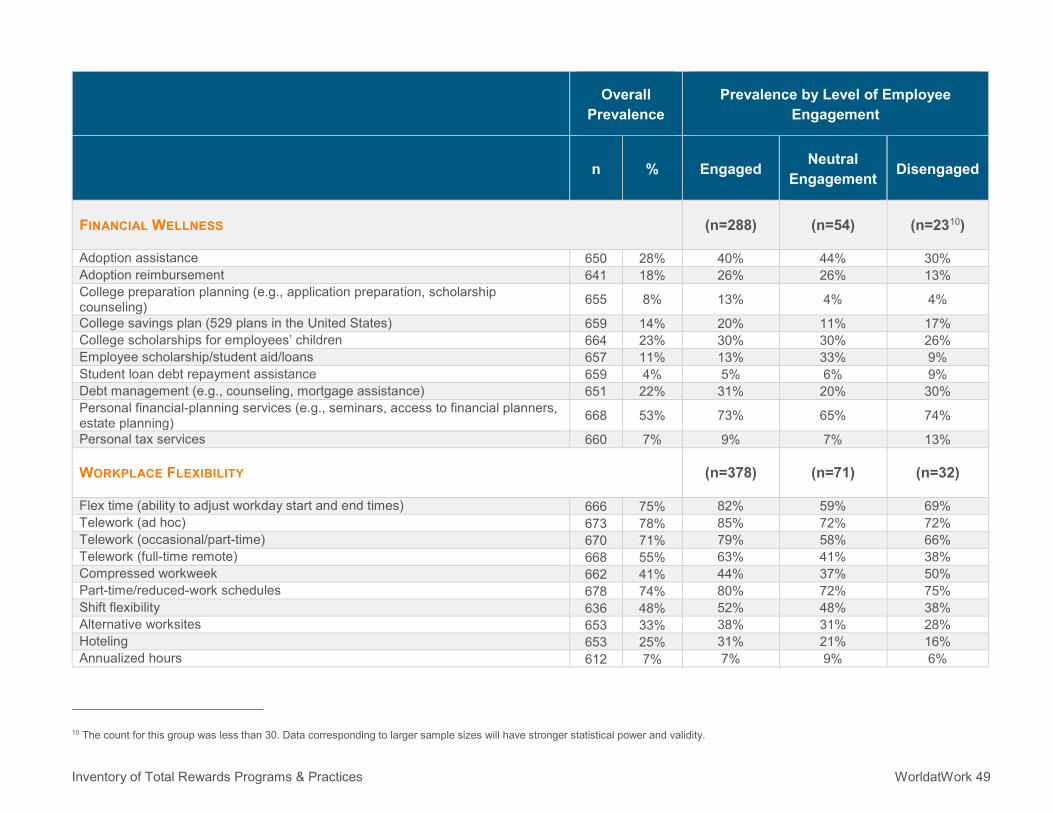
FINANCIAL WELLNESS (n=288) (n=54) (n=2310)
Adoption assistance 650 28% 40% 44% 30% Adoption reimbursement 641 18% 26% 26% 13% College preparation planning (e.g., application preparation, scholarship counseling) 655 8% 13% 4% 4%
College savings plan (529 plans in the United States) 659 14% 20% 11% 17% College scholarships for employees’ children 664 23% 30% 30% 26% Employee scholarship/student aid/loans 657 11% 13% 33% 9% Student loan debt repayment assistance 659 4% 5% 6% 9% Debt management (e.g., counseling, mortgage assistance) 651 22% 31% 20% 30% Personal financial-planning services (e.g., seminars, access to financial planners, estate planning) 668 53% 73% 65% 74%
Personal tax services 660 7% 9% 7% 13%
WORKPLACE FLEXIBILITY (n=378) (n=71) (n=32)
Flex time (ability to adjust workday start and end times) 666 75% 82% 59% 69% Telework (ad hoc) 673 78% 85% 72% 72% Telework (occasional/part-time) 670 71% 79% 58% 66% Telework (full-time remote) 668 55% 63% 41% 38% Compressed workweek 662 41% 44% 37% 50% Part-time/reduced-work schedules 678 74% 80% 72% 75% Shift flexibility 636 48% 52% 48% 38% Alternative worksites 653 33% 38% 31% 28% Hoteling 653 25% 31% 21% 16% Annualized hours 612 7% 7% 9% 6%
10 The count for this group was less than 30. Data corresponding to larger sample sizes will have stronger statistical power and validity.
Inventory of Total Rewards Programs & Practices WorldatWork 50
Overall Prevalence
Prevalence by Level of Employee Engagement
n % Engaged Neutral Engagement Disengaged
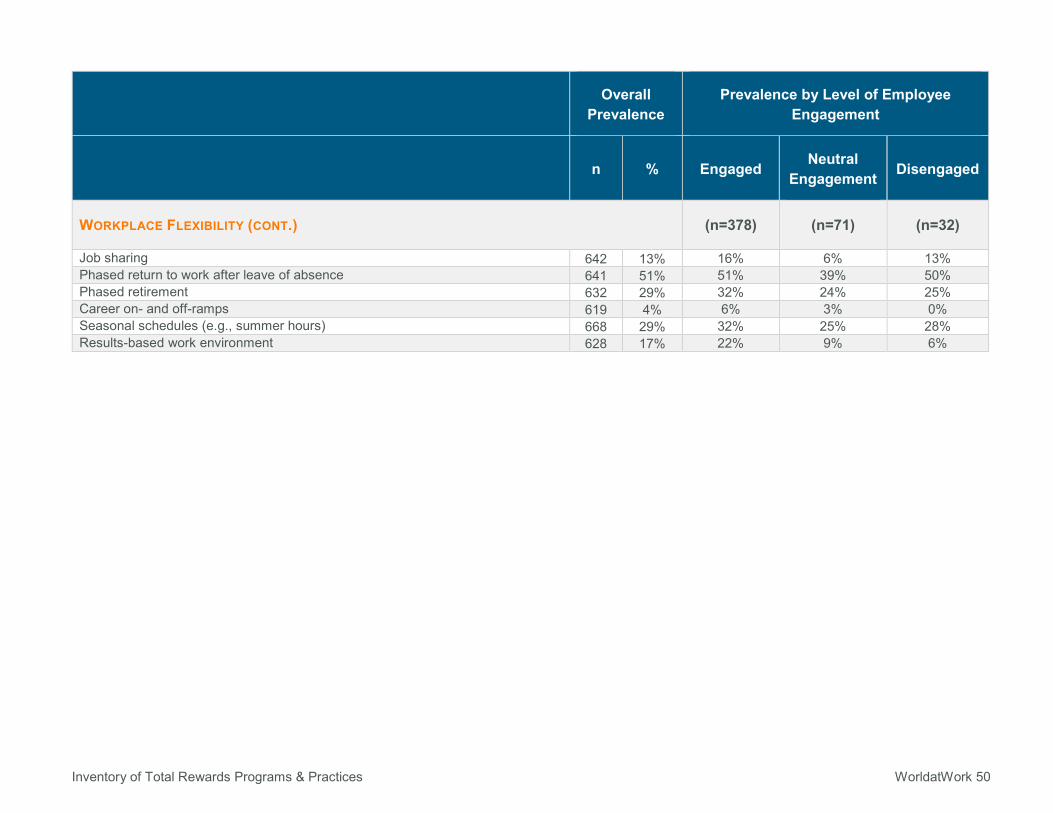
WORKPLACE FLEXIBILITY (CONT.) (n=378) (n=71) (n=32)
Job sharing 642 13% 16% 6% 13% Phased return to work after leave of absence 641 51% 51% 39% 50% Phased retirement 632 29% 32% 24% 25% Career on- and off-ramps 619 4% 6% 3% 0% Seasonal schedules (e.g., summer hours) 668 29% 32% 25% 28% Results-based work environment 628 17% 22% 9% 6%
Inventory of Total Rewards Programs & Practices WorldatWork 51
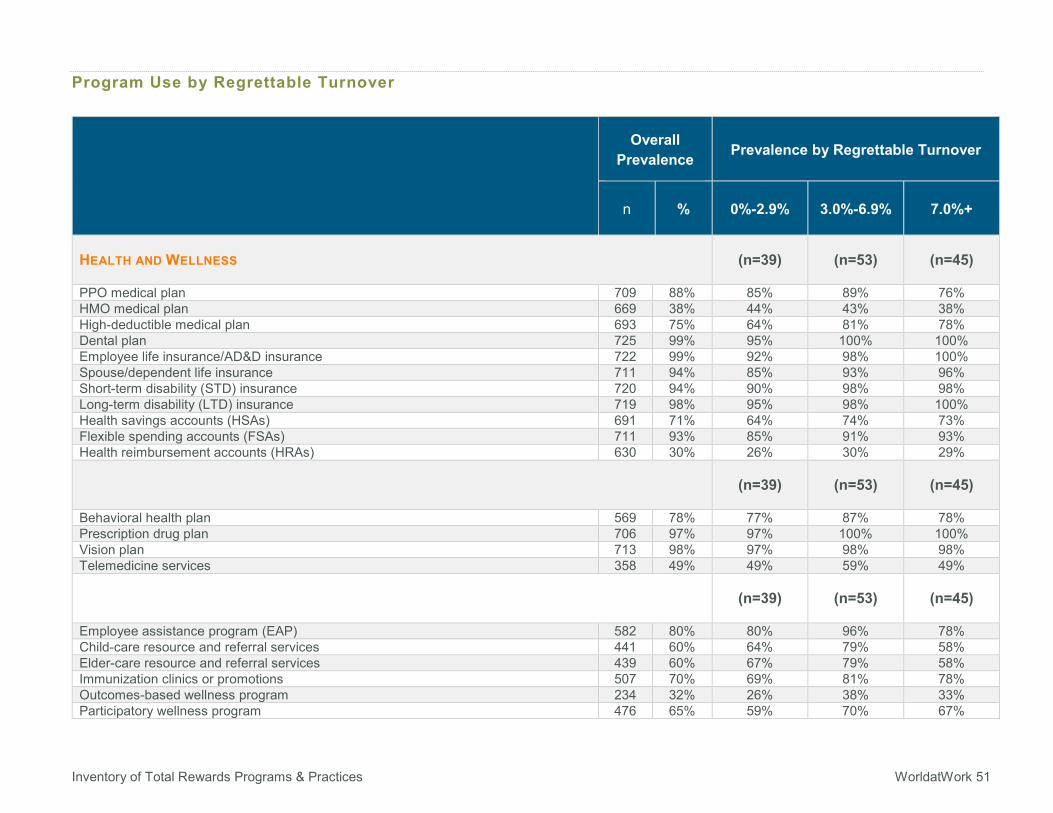
Program Use by Regrettable Turnover
Overall Prevalence Prevalence by Regrettable Turnover
n % 0%-2.9% 3.0%-6.9% 7.0%+
HEALTH AND WELLNESS (n=39) (n=53) (n=45)
PPO medical plan 709 88% 85% 89% 76% HMO medical plan 669 38% 44% 43% 38% High-deductible medical plan 693 75% 64% 81% 78% Dental plan 725 99% 95% 100% 100% Employee life insurance/AD&D insurance 722 99% 92% 98% 100% Spouse/dependent life insurance 711 94% 85% 93% 96% Short-term disability (STD) insurance 720 94% 90% 98% 98% Long-term disability (LTD) insurance 719 98% 95% 98% 100% Health savings accounts (HSAs) 691 71% 64% 74% 73% Flexible spending accounts (FSAs) 711 93% 85% 91% 93% Health reimbursement accounts (HRAs) 630 30% 26% 30% 29%
(n=39) (n=53) (n=45)
Behavioral health plan 569 78% 77% 87% 78% Prescription drug plan 706 97% 97% 100% 100% Vision plan 713 98% 97% 98% 98% Telemedicine services 358 49% 49% 59% 49%
(n=39) (n=53) (n=45)
Employee assistance program (EAP) 582 80% 80% 96% 78% Child-care resource and referral services 441 60% 64% 79% 58% Elder-care resource and referral services 439 60% 67% 79% 58% Immunization clinics or promotions 507 70% 69% 81% 78% Outcomes-based wellness program 234 32% 26% 38% 33% Participatory wellness program 476 65% 59% 70% 67%
Inventory of Total Rewards Programs & Practices WorldatWork 52
Overall Prevalence Prevalence by Regrettable Turnover
n % 0%-2.9% 3.0%-6.9% 7.0%+
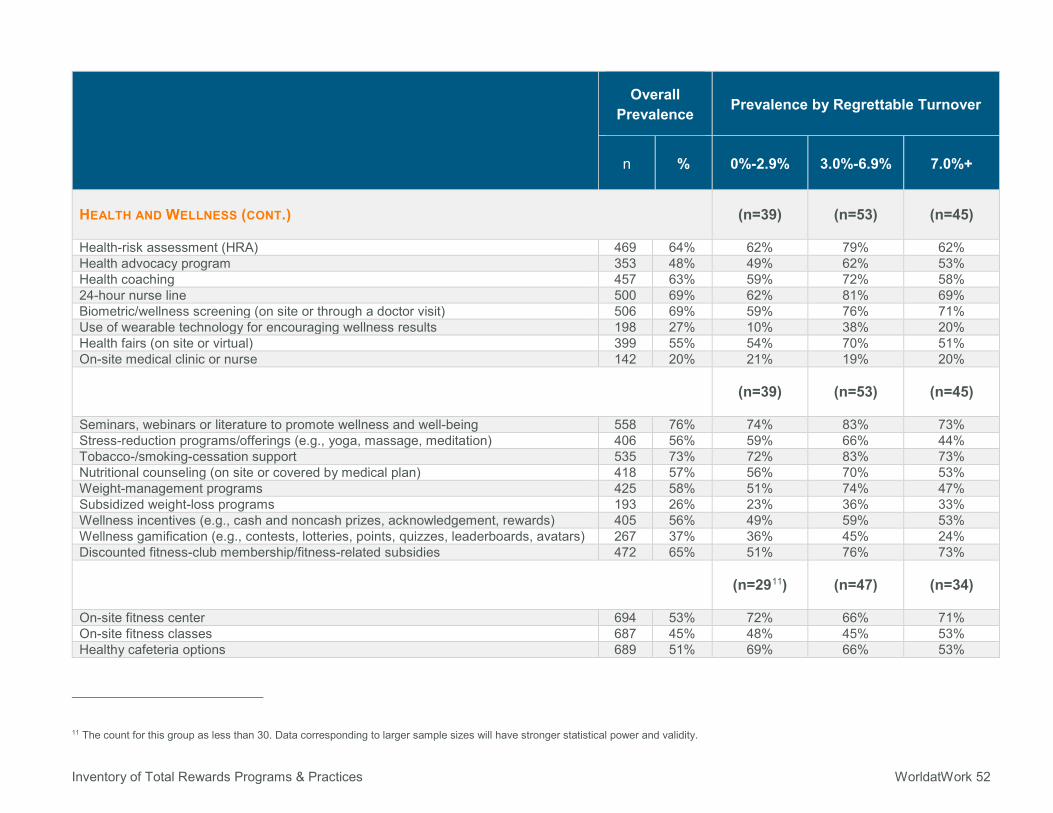
HEALTH AND WELLNESS (CONT.) (n=39) (n=53) (n=45)
Health-risk assessment (HRA) 469 64% 62% 79% 62% Health advocacy program 353 48% 49% 62% 53% Health coaching 457 63% 59% 72% 58% 24-hour nurse line 500 69% 62% 81% 69% Biometric/wellness screening (on site or through a doctor visit) 506 69% 59% 76% 71% Use of wearable technology for encouraging wellness results 198 27% 10% 38% 20% Health fairs (on site or virtual) 399 55% 54% 70% 51% On-site medical clinic or nurse 142 20% 21% 19% 20%
(n=39) (n=53) (n=45)
Seminars, webinars or literature to promote wellness and well-being 558 76% 74% 83% 73% Stress-reduction programs/offerings (e.g., yoga, massage, meditation) 406 56% 59% 66% 44% Tobacco-/smoking-cessation support 535 73% 72% 83% 73% Nutritional counseling (on site or covered by medical plan) 418 57% 56% 70% 53% Weight-management programs 425 58% 51% 74% 47% Subsidized weight-loss programs 193 26% 23% 36% 33% Wellness incentives (e.g., cash and noncash prizes, acknowledgement, rewards) 405 56% 49% 59% 53% Wellness gamification (e.g., contests, lotteries, points, quizzes, leaderboards, avatars) 267 37% 36% 45% 24% Discounted fitness-club membership/fitness-related subsidies 472 65% 51% 76% 73%
(n=2911) (n=47) (n=34)
On-site fitness center 694 53% 72% 66% 71% On-site fitness classes 687 45% 48% 45% 53% Healthy cafeteria options 689 51% 69% 66% 53%
11 The count for this group as less than 30. Data corresponding to larger sample sizes will have stronger statistical power and validity.
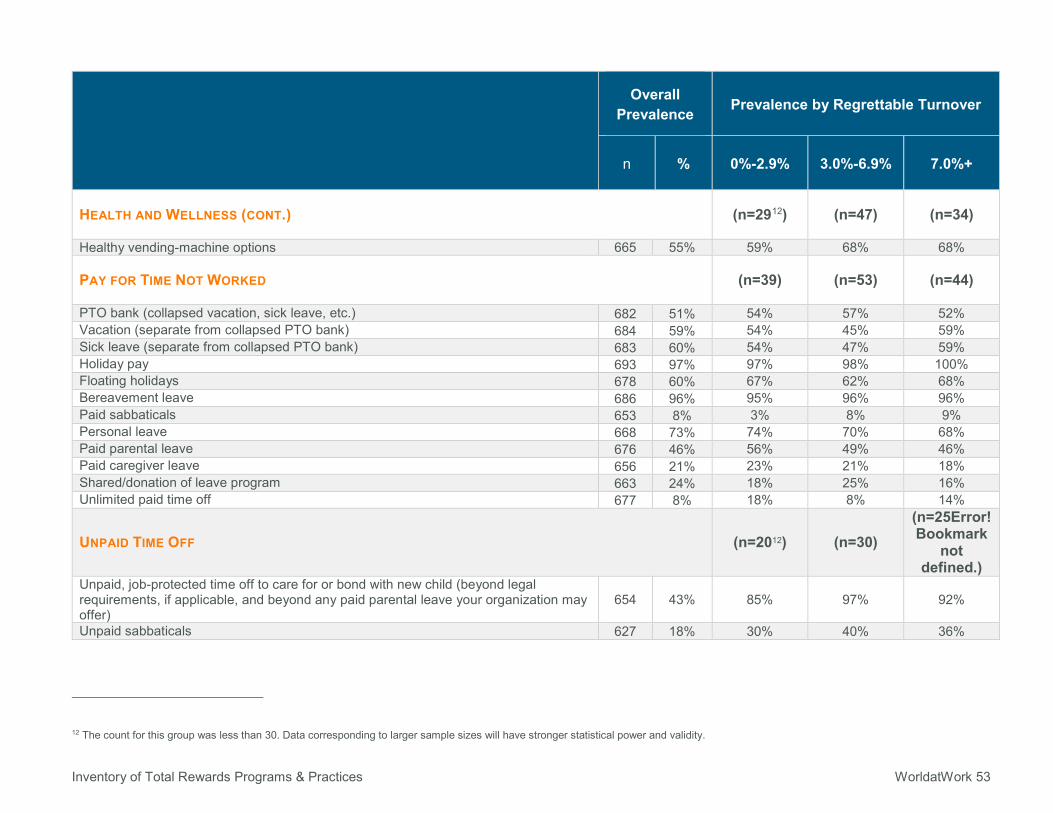
Inventory of Total Rewards Programs & Practices WorldatWork 53
Overall Prevalence Prevalence by Regrettable Turnover
n % 0%-2.9% 3.0%-6.9% 7.0%+
HEALTH AND WELLNESS (CONT.) (n=2912) (n=47) (n=34)
Healthy vending-machine options 665 55% 59% 68% 68%
PAY FOR TIME NOT WORKED (n=39) (n=53) (n=44)
PTO bank (collapsed vacation, sick leave, etc.) 682 51% 54% 57% 52% Vacation (separate from collapsed PTO bank) 684 59% 54% 45% 59% Sick leave (separate from collapsed PTO bank) 683 60% 54% 47% 59% Holiday pay 693 97% 97% 98% 100% Floating holidays 678 60% 67% 62% 68% Bereavement leave 686 96% 95% 96% 96% Paid sabbaticals 653 8% 3% 8% 9% Personal leave 668 73% 74% 70% 68% Paid parental leave 676 46% 56% 49% 46% Paid caregiver leave 656 21% 23% 21% 18% Shared/donation of leave program 663 24% 18% 25% 16% Unlimited paid time off 677 8% 18% 8% 14%
UNPAID TIME OFF (n=2012) (n=30) (n=25Error! Bookmark
not defined.)
Unpaid, job-protected time off to care for or bond with new child (beyond legal requirements, if applicable, and beyond any paid parental leave your organization may offer)
654 43% 85% 97% 92%
Unpaid sabbaticals 627 18% 30% 40% 36%
12 The count for this group was less than 30. Data corresponding to larger sample sizes will have stronger statistical power and validity.
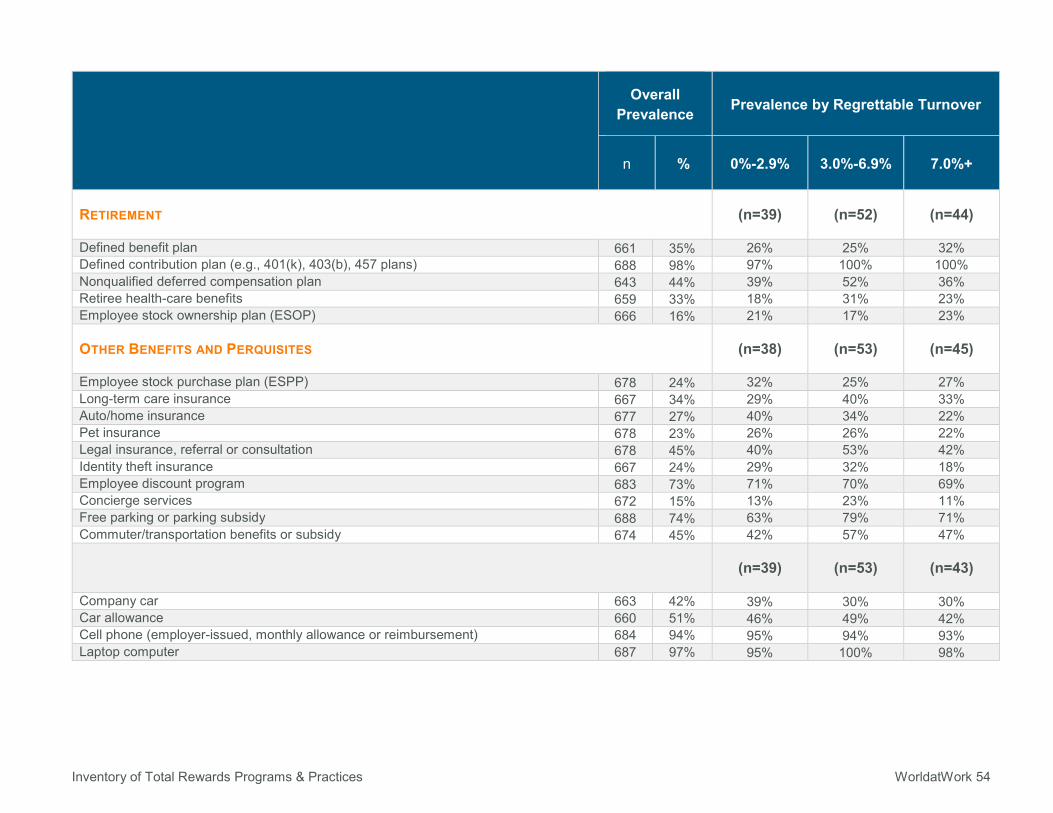
Inventory of Total Rewards Programs & Practices WorldatWork 54
Overall Prevalence Prevalence by Regrettable Turnover
n % 0%-2.9% 3.0%-6.9% 7.0%+
RETIREMENT (n=39) (n=52) (n=44)
Defined benefit plan 661 35% 26% 25% 32% Defined contribution plan (e.g., 401(k), 403(b), 457 plans) 688 98% 97% 100% 100% Nonqualified deferred compensation plan 643 44% 39% 52% 36% Retiree health-care benefits 659 33% 18% 31% 23% Employee stock ownership plan (ESOP) 666 16% 21% 17% 23%
OTHER BENEFITS AND PERQUISITES (n=38) (n=53) (n=45)
Employee stock purchase plan (ESPP) 678 24% 32% 25% 27% Long-term care insurance 667 34% 29% 40% 33% Auto/home insurance 677 27% 40% 34% 22% Pet insurance 678 23% 26% 26% 22% Legal insurance, referral or consultation 678 45% 40% 53% 42% Identity theft insurance 667 24% 29% 32% 18% Employee discount program 683 73% 71% 70% 69% Concierge services 672 15% 13% 23% 11% Free parking or parking subsidy 688 74% 63% 79% 71% Commuter/transportation benefits or subsidy 674 45% 42% 57% 47%
(n=39) (n=53) (n=43)
Company car 663 42% 39% 30% 30% Car allowance 660 51% 46% 49% 42% Cell phone (employer-issued, monthly allowance or reimbursement) 684 94% 95% 94% 93% Laptop computer 687 97% 95% 100% 98%
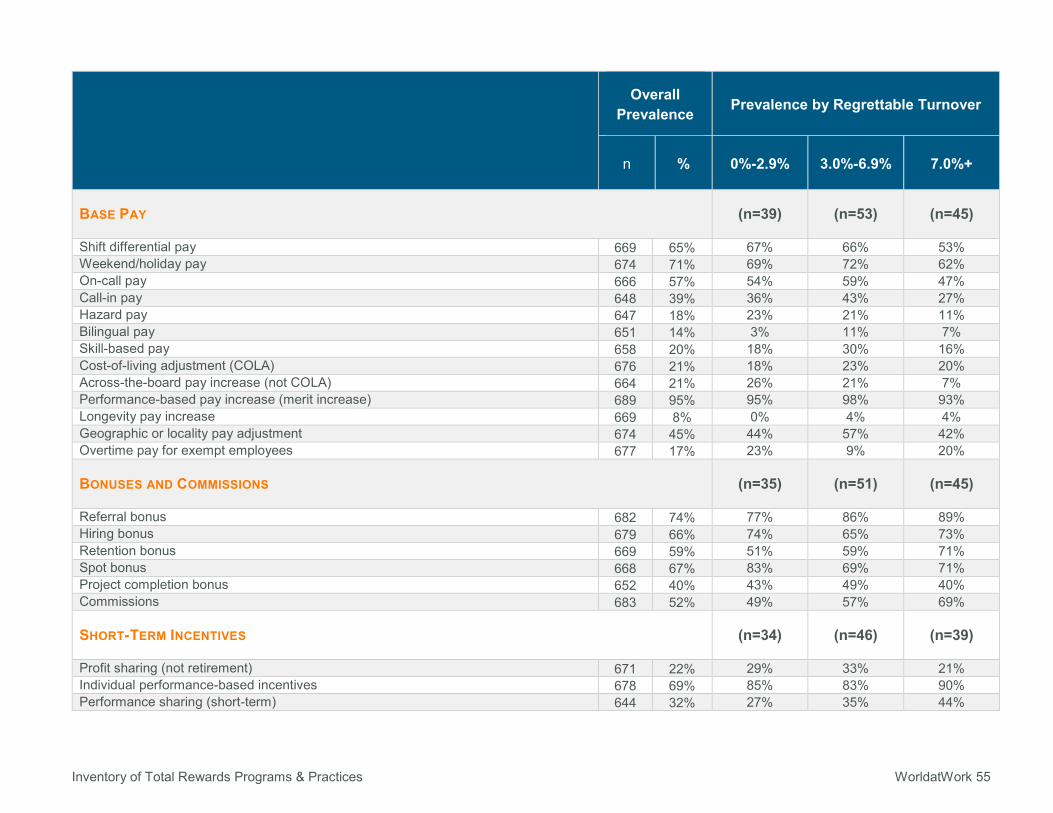
Inventory of Total Rewards Programs & Practices WorldatWork 55
Overall Prevalence Prevalence by Regrettable Turnover
n % 0%-2.9% 3.0%-6.9% 7.0%+
BASE PAY (n=39) (n=53) (n=45)
Shift differential pay 669 65% 67% 66% 53% Weekend/holiday pay 674 71% 69% 72% 62% On-call pay 666 57% 54% 59% 47% Call-in pay 648 39% 36% 43% 27% Hazard pay 647 18% 23% 21% 11% Bilingual pay 651 14% 3% 11% 7% Skill-based pay 658 20% 18% 30% 16% Cost-of-living adjustment (COLA) 676 21% 18% 23% 20% Across-the-board pay increase (not COLA) 664 21% 26% 21% 7% Performance-based pay increase (merit increase) 689 95% 95% 98% 93% Longevity pay increase 669 8% 0% 4% 4% Geographic or locality pay adjustment 674 45% 44% 57% 42% Overtime pay for exempt employees 677 17% 23% 9% 20%
BONUSES AND COMMISSIONS (n=35) (n=51) (n=45)
Referral bonus 682 74% 77% 86% 89% Hiring bonus 679 66% 74% 65% 73% Retention bonus 669 59% 51% 59% 71% Spot bonus 668 67% 83% 69% 71% Project completion bonus 652 40% 43% 49% 40% Commissions 683 52% 49% 57% 69%
SHORT-TERM INCENTIVES (n=34) (n=46) (n=39)
Profit sharing (not retirement) 671 22% 29% 33% 21% Individual performance-based incentives 678 69% 85% 83% 90% Performance sharing (short-term) 644 32% 27% 35% 44%
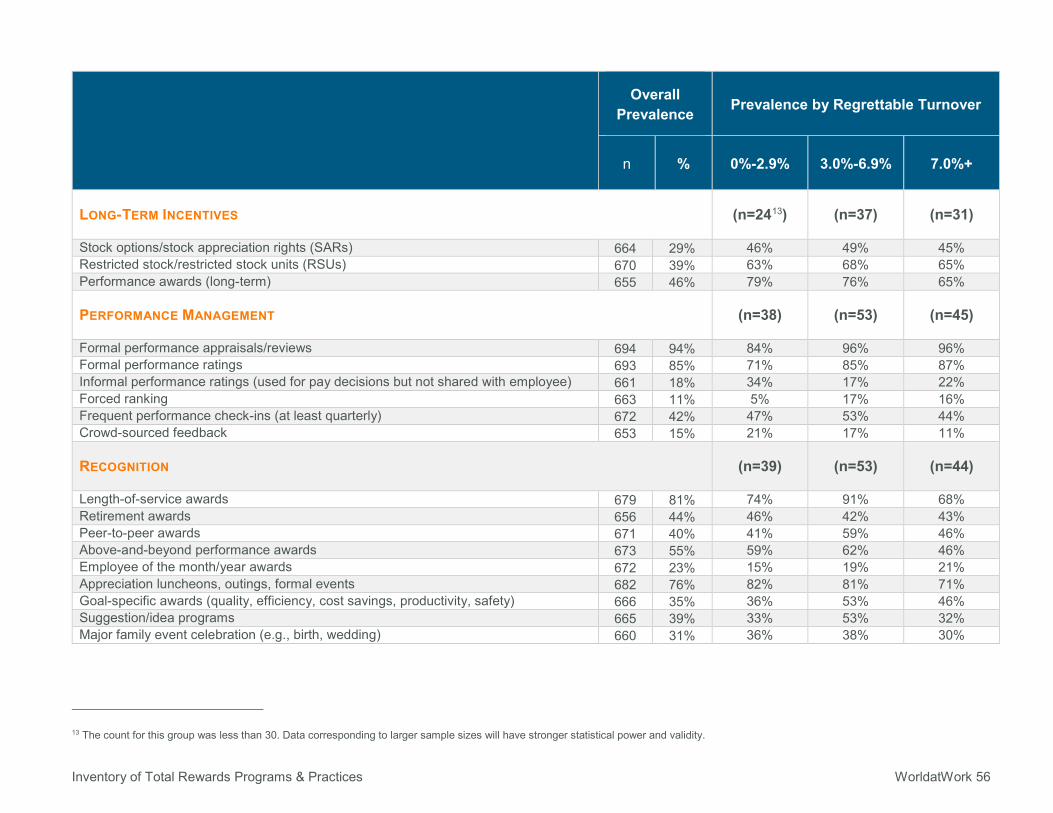
Inventory of Total Rewards Programs & Practices WorldatWork 56
Overall Prevalence Prevalence by Regrettable Turnover
n % 0%-2.9% 3.0%-6.9% 7.0%+
LONG-TERM INCENTIVES (n=2413) (n=37) (n=31)
Stock options/stock appreciation rights (SARs) 664 29% 46% 49% 45% Restricted stock/restricted stock units (RSUs) 670 39% 63% 68% 65% Performance awards (long-term) 655 46% 79% 76% 65%
PERFORMANCE MANAGEMENT (n=38) (n=53) (n=45)
Formal performance appraisals/reviews 694 94% 84% 96% 96% Formal performance ratings 693 85% 71% 85% 87% Informal performance ratings (used for pay decisions but not shared with employee) 661 18% 34% 17% 22% Forced ranking 663 11% 5% 17% 16% Frequent performance check-ins (at least quarterly) 672 42% 47% 53% 44% Crowd-sourced feedback 653 15% 21% 17% 11%
RECOGNITION (n=39) (n=53) (n=44)
Length-of-service awards 679 81% 74% 91% 68% Retirement awards 656 44% 46% 42% 43% Peer-to-peer awards 671 40% 41% 59% 46% Above-and-beyond performance awards 673 55% 59% 62% 46% Employee of the month/year awards 672 23% 15% 19% 21% Appreciation luncheons, outings, formal events 682 76% 82% 81% 71% Goal-specific awards (quality, efficiency, cost savings, productivity, safety) 666 35% 36% 53% 46% Suggestion/idea programs 665 39% 33% 53% 32% Major family event celebration (e.g., birth, wedding) 660 31% 36% 38% 30%
13 The count for this group was less than 30. Data corresponding to larger sample sizes will have stronger statistical power and validity.
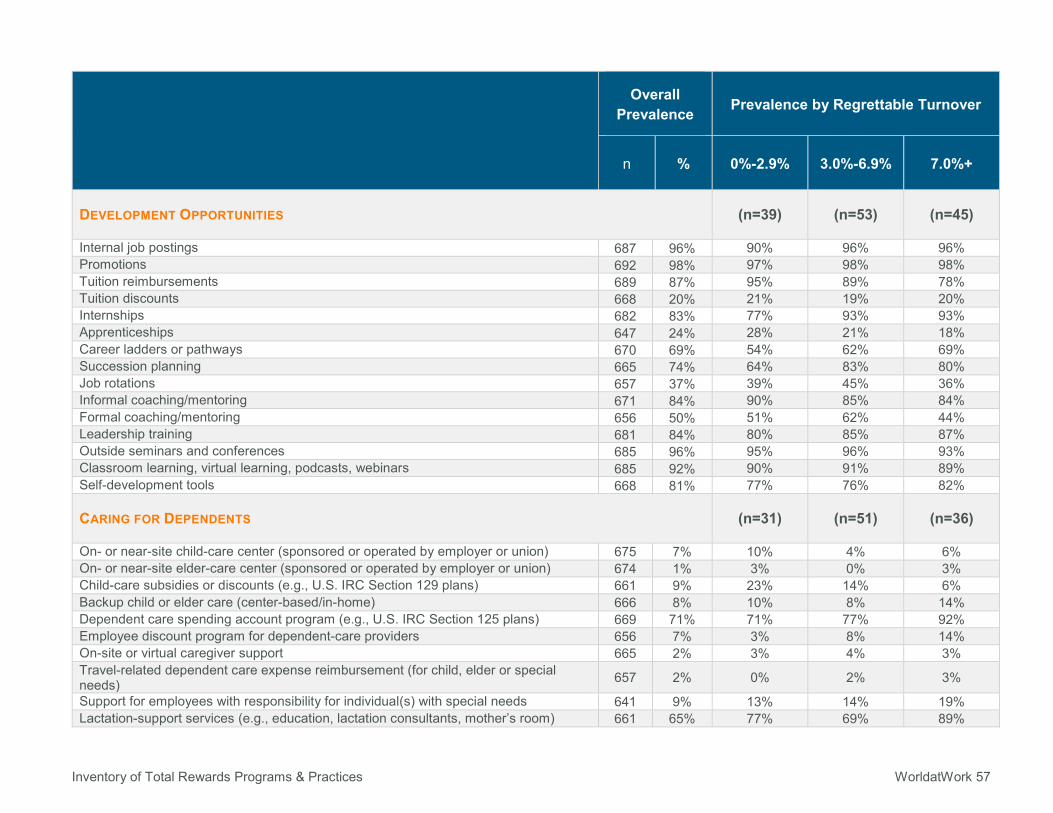
Inventory of Total Rewards Programs & Practices WorldatWork 57
Overall Prevalence Prevalence by Regrettable Turnover
n % 0%-2.9% 3.0%-6.9% 7.0%+
DEVELOPMENT OPPORTUNITIES (n=39) (n=53) (n=45)
Internal job postings 687 96% 90% 96% 96% Promotions 692 98% 97% 98% 98% Tuition reimbursements 689 87% 95% 89% 78% Tuition discounts 668 20% 21% 19% 20% Internships 682 83% 77% 93% 93% Apprenticeships 647 24% 28% 21% 18% Career ladders or pathways 670 69% 54% 62% 69% Succession planning 665 74% 64% 83% 80% Job rotations 657 37% 39% 45% 36% Informal coaching/mentoring 671 84% 90% 85% 84% Formal coaching/mentoring 656 50% 51% 62% 44% Leadership training 681 84% 80% 85% 87% Outside seminars and conferences 685 96% 95% 96% 93% Classroom learning, virtual learning, podcasts, webinars 685 92% 90% 91% 89% Self-development tools 668 81% 77% 76% 82%
CARING FOR DEPENDENTS (n=31) (n=51) (n=36)
On- or near-site child-care center (sponsored or operated by employer or union) 675 7% 10% 4% 6% On- or near-site elder-care center (sponsored or operated by employer or union) 674 1% 3% 0% 3% Child-care subsidies or discounts (e.g., U.S. IRC Section 129 plans) 661 9% 23% 14% 6% Backup child or elder care (center-based/in-home) 666 8% 10% 8% 14% Dependent care spending account program (e.g., U.S. IRC Section 125 plans) 669 71% 71% 77% 92% Employee discount program for dependent-care providers 656 7% 3% 8% 14% On-site or virtual caregiver support 665 2% 3% 4% 3% Travel-related dependent care expense reimbursement (for child, elder or special needs) 657 2% 0% 2% 3%
Support for employees with responsibility for individual(s) with special needs 641 9% 13% 14% 19% Lactation-support services (e.g., education, lactation consultants, mother’s room) 661 65% 77% 69% 89%
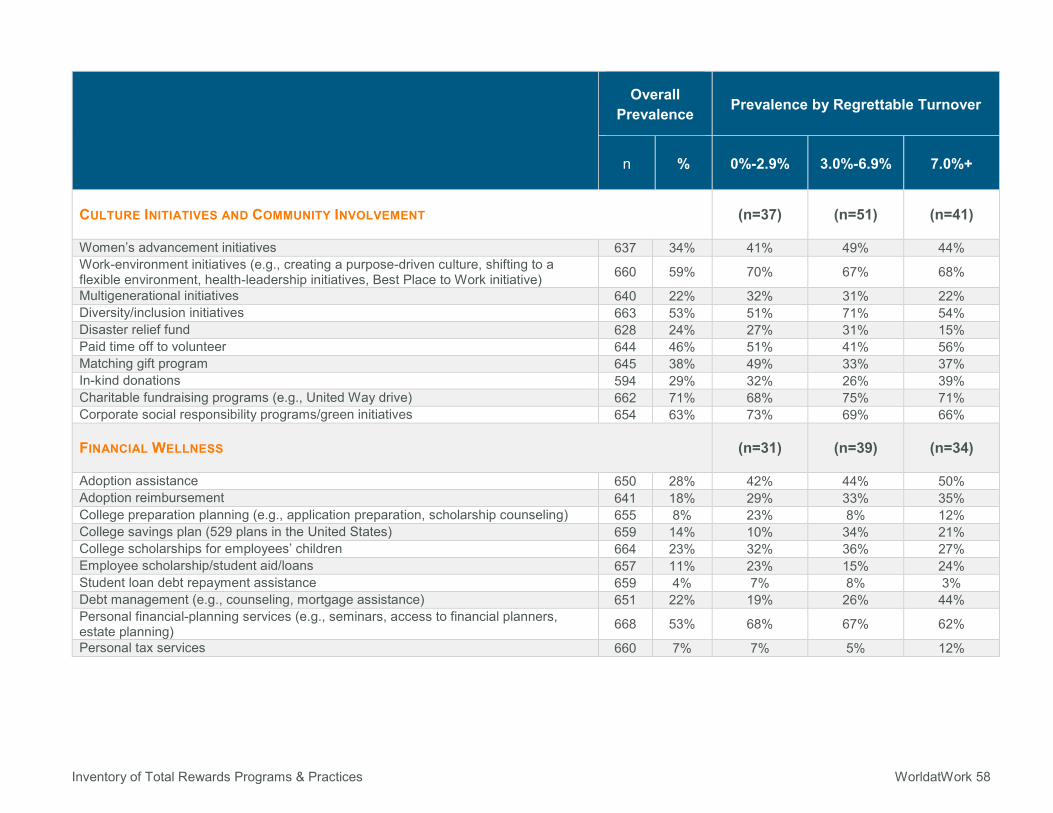
Inventory of Total Rewards Programs & Practices WorldatWork 58
Overall Prevalence Prevalence by Regrettable Turnover
n % 0%-2.9% 3.0%-6.9% 7.0%+
CULTURE INITIATIVES AND COMMUNITY INVOLVEMENT (n=37) (n=51) (n=41)
Women’s advancement initiatives 637 34% 41% 49% 44% Work-environment initiatives (e.g., creating a purpose-driven culture, shifting to a flexible environment, health-leadership initiatives, Best Place to Work initiative) 660 59% 70% 67% 68%
Multigenerational initiatives 640 22% 32% 31% 22% Diversity/inclusion initiatives 663 53% 51% 71% 54% Disaster relief fund 628 24% 27% 31% 15% Paid time off to volunteer 644 46% 51% 41% 56% Matching gift program 645 38% 49% 33% 37% In-kind donations 594 29% 32% 26% 39% Charitable fundraising programs (e.g., United Way drive) 662 71% 68% 75% 71% Corporate social responsibility programs/green initiatives 654 63% 73% 69% 66%
FINANCIAL WELLNESS (n=31) (n=39) (n=34)
Adoption assistance 650 28% 42% 44% 50% Adoption reimbursement 641 18% 29% 33% 35% College preparation planning (e.g., application preparation, scholarship counseling) 655 8% 23% 8% 12% College savings plan (529 plans in the United States) 659 14% 10% 34% 21% College scholarships for employees’ children 664 23% 32% 36% 27% Employee scholarship/student aid/loans 657 11% 23% 15% 24% Student loan debt repayment assistance 659 4% 7% 8% 3% Debt management (e.g., counseling, mortgage assistance) 651 22% 19% 26% 44% Personal financial-planning services (e.g., seminars, access to financial planners, estate planning) 668 53% 68% 67% 62%
Personal tax services 660 7% 7% 5% 12%
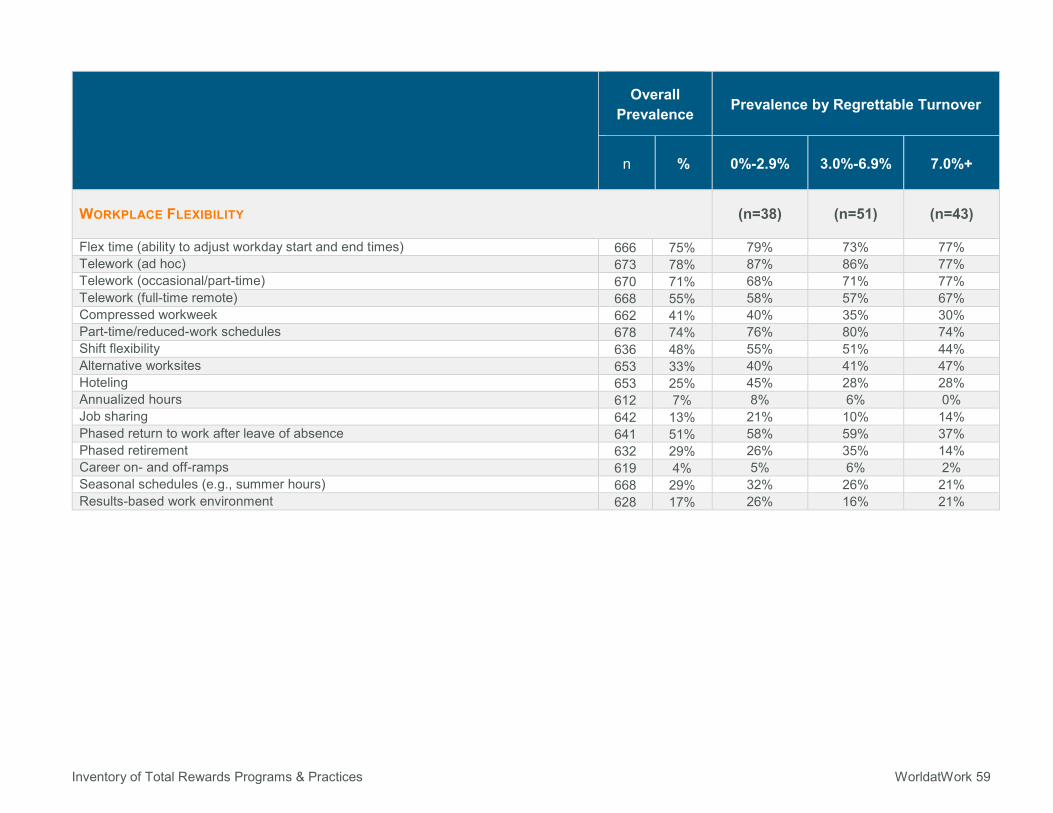
Inventory of Total Rewards Programs & Practices WorldatWork 59
Overall Prevalence Prevalence by Regrettable Turnover
n % 0%-2.9% 3.0%-6.9% 7.0%+
WORKPLACE FLEXIBILITY (n=38) (n=51) (n=43)
Flex time (ability to adjust workday start and end times) 666 75% 79% 73% 77% Telework (ad hoc) 673 78% 87% 86% 77% Telework (occasional/part-time) 670 71% 68% 71% 77% Telework (full-time remote) 668 55% 58% 57% 67% Compressed workweek 662 41% 40% 35% 30% Part-time/reduced-work schedules 678 74% 76% 80% 74% Shift flexibility 636 48% 55% 51% 44% Alternative worksites 653 33% 40% 41% 47% Hoteling 653 25% 45% 28% 28% Annualized hours 612 7% 8% 6% 0% Job sharing 642 13% 21% 10% 14% Phased return to work after leave of absence 641 51% 58% 59% 37% Phased retirement 632 29% 26% 35% 14% Career on- and off-ramps 619 4% 5% 6% 2% Seasonal schedules (e.g., summer hours) 668 29% 32% 26% 21% Results-based work environment 628 17% 26% 16% 21%
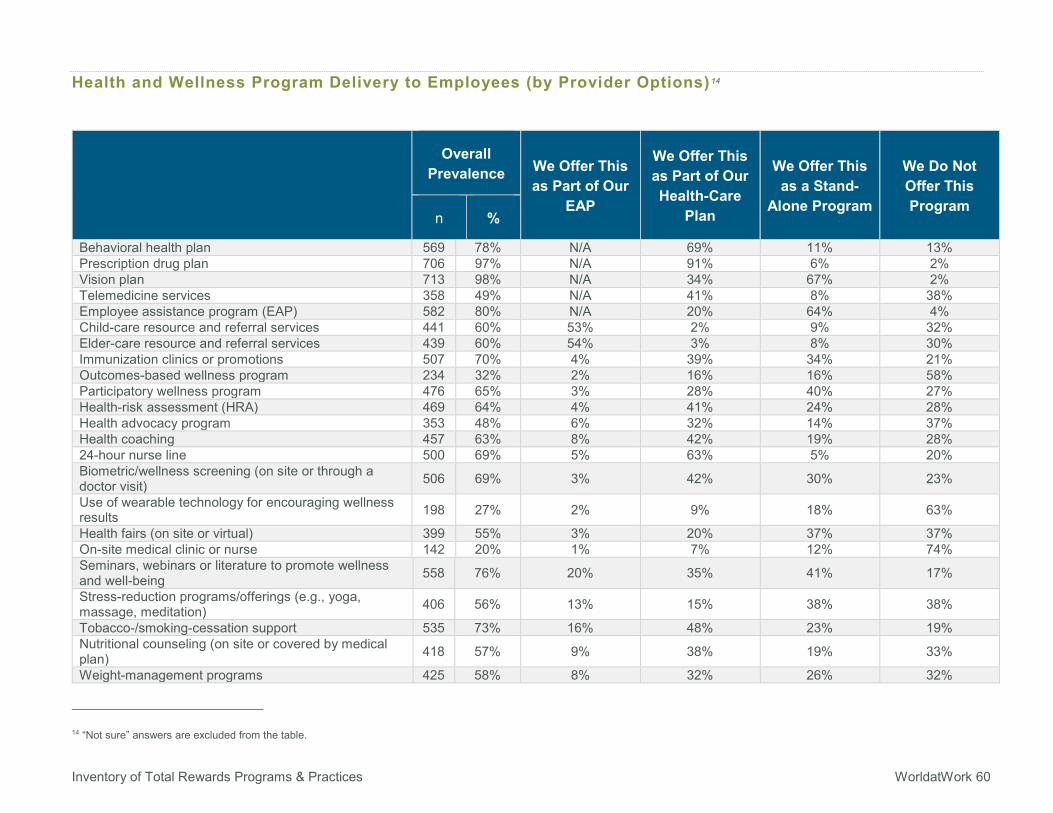
Inventory of Total Rewards Programs & Practices WorldatWork 60
Health and Wellness Program Delivery to Employees (by Provider Options) 14
Overall Prevalence We Offer This
as Part of Our EAP
We Offer This as Part of Our Health-Care
Plan
We Offer This as a Stand-
Alone Program
We Do Not Offer This Program
n %
Behavioral health plan 569 78% N/A 69% 11% 13% Prescription drug plan 706 97% N/A 91% 6% 2% Vision plan 713 98% N/A 34% 67% 2% Telemedicine services 358 49% N/A 41% 8% 38% Employee assistance program (EAP) 582 80% N/A 20% 64% 4% Child-care resource and referral services 441 60% 53% 2% 9% 32% Elder-care resource and referral services 439 60% 54% 3% 8% 30% Immunization clinics or promotions 507 70% 4% 39% 34% 21% Outcomes-based wellness program 234 32% 2% 16% 16% 58% Participatory wellness program 476 65% 3% 28% 40% 27% Health-risk assessment (HRA) 469 64% 4% 41% 24% 28% Health advocacy program 353 48% 6% 32% 14% 37% Health coaching 457 63% 8% 42% 19% 28% 24-hour nurse line 500 69% 5% 63% 5% 20% Biometric/wellness screening (on site or through a doctor visit) 506 69% 3% 42% 30% 23%
Use of wearable technology for encouraging wellness results 198 27% 2% 9% 18% 63%
Health fairs (on site or virtual) 399 55% 3% 20% 37% 37% On-site medical clinic or nurse 142 20% 1% 7% 12% 74% Seminars, webinars or literature to promote wellness and well-being 558 76% 20% 35% 41% 17% Stress-reduction programs/offerings (e.g., yoga, massage, meditation) 406 56% 13% 15% 38% 38% Tobacco-/smoking-cessation support 535 73% 16% 48% 23% 19% Nutritional counseling (on site or covered by medical plan) 418 57% 9% 38% 19% 33% Weight-management programs 425 58% 8% 32% 26% 32%
14 “Not sure” answers are excluded from the table.
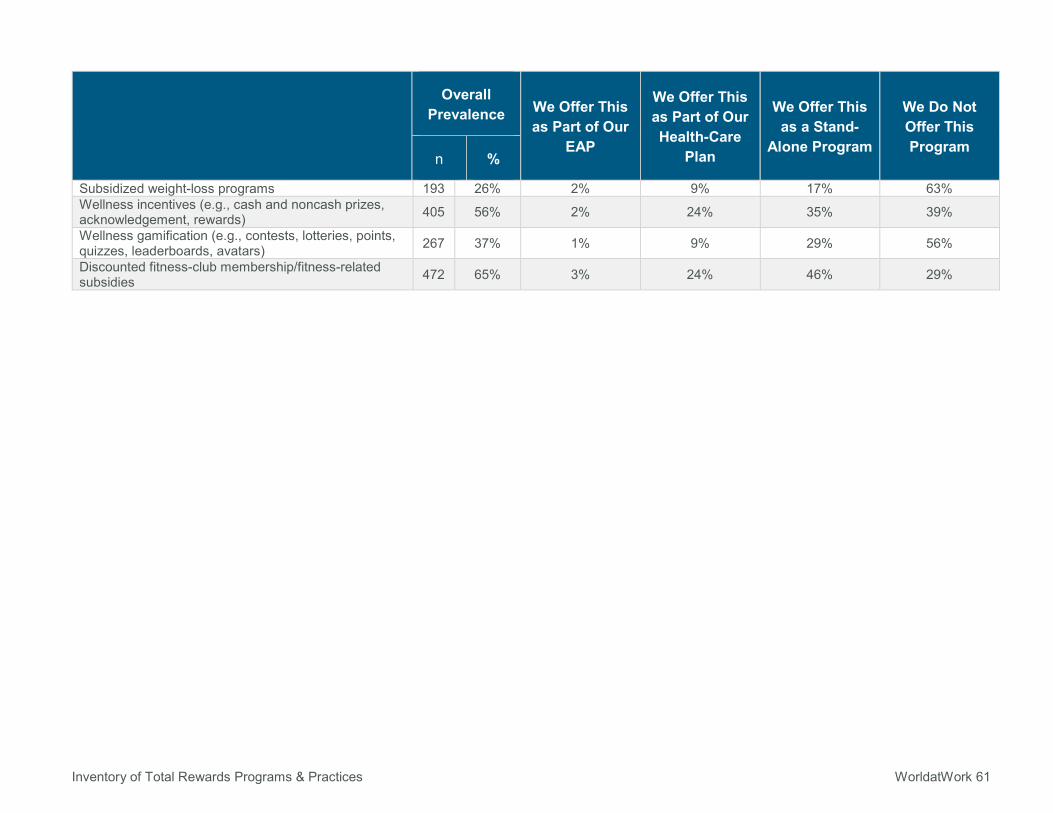
Inventory of Total Rewards Programs & Practices WorldatWork 61
Overall Prevalence We Offer This
as Part of Our EAP
We Offer This as Part of Our Health-Care
Plan
We Offer This as a Stand-
Alone Program
We Do Not Offer This Program
n %
Subsidized weight-loss programs 193 26% 2% 9% 17% 63% Wellness incentives (e.g., cash and noncash prizes, acknowledgement, rewards) 405 56% 2% 24% 35% 39% Wellness gamification (e.g., contests, lotteries, points, quizzes, leaderboards, avatars) 267 37% 1% 9% 29% 56% Discounted fitness-club membership/fitness-related subsidies 472 65% 3% 24% 46% 29%
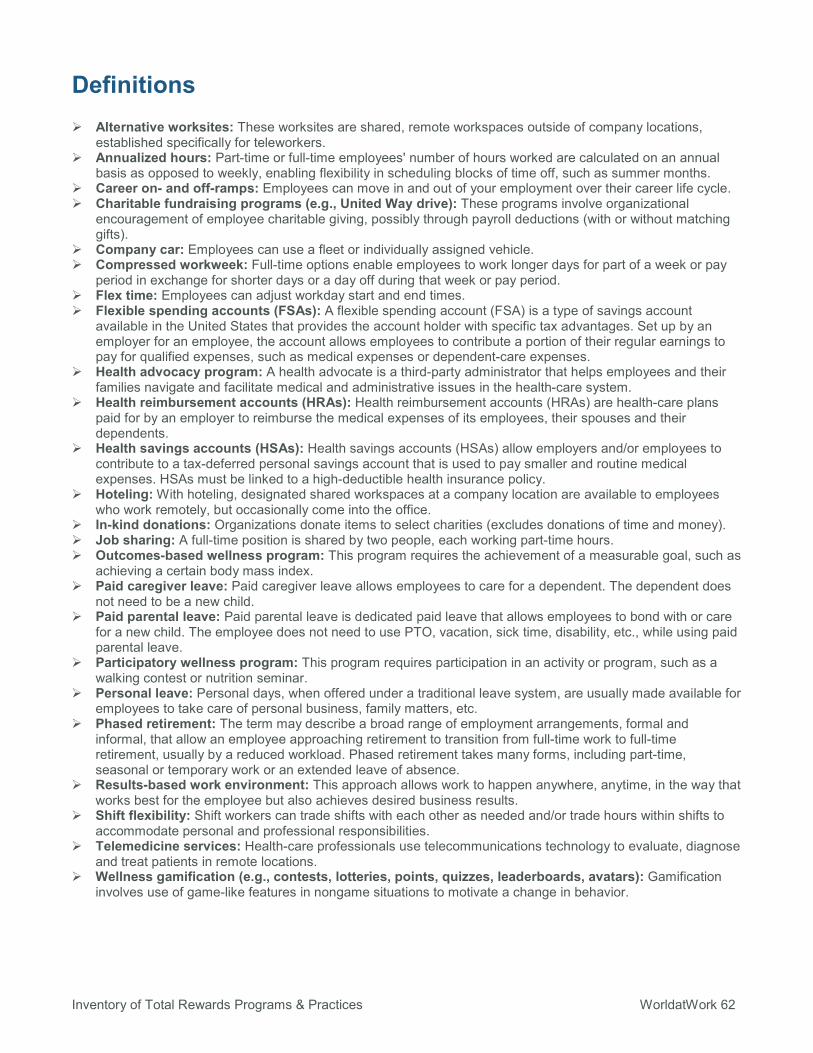
Inventory of Total Rewards Programs & Practices WorldatWork 62
Definitions ¾ Alternative worksites: These worksites are shared, remote workspaces outside of company locations,
established specifically for teleworkers. ¾ Annualized hours: Part-time or full-time employees' number of hours worked are calculated on an annual
basis as opposed to weekly, enabling flexibility in scheduling blocks of time off, such as summer months. ¾ Career on- and off-ramps: Employees can move in and out of your employment over their career life cycle. ¾ Charitable fundraising programs (e.g., United Way drive): These programs involve organizational
encouragement of employee charitable giving, possibly through payroll deductions (with or without matching gifts).
¾ Company car: Employees can use a fleet or individually assigned vehicle. ¾ Compressed workweek: Full-time options enable employees to work longer days for part of a week or pay
period in exchange for shorter days or a day off during that week or pay period. ¾ Flex time: Employees can adjust workday start and end times. ¾ Flexible spending accounts (FSAs): A flexible spending account (FSA) is a type of savings account
available in the United States that provides the account holder with specific tax advantages. Set up by an employer for an employee, the account allows employees to contribute a portion of their regular earnings to pay for qualified expenses, such as medical expenses or dependent-care expenses.
¾ Health advocacy program: A health advocate is a third-party administrator that helps employees and their families navigate and facilitate medical and administrative issues in the health-care system.
¾ Health reimbursement accounts (HRAs): Health reimbursement accounts (HRAs) are health-care plans paid for by an employer to reimburse the medical expenses of its employees, their spouses and their dependents.
¾ Health savings accounts (HSAs): Health savings accounts (HSAs) allow employers and/or employees to contribute to a tax-deferred personal savings account that is used to pay smaller and routine medical expenses. HSAs must be linked to a high-deductible health insurance policy.
¾ Hoteling: With hoteling, designated shared workspaces at a company location are available to employees who work remotely, but occasionally come into the office.
¾ In-kind donations: Organizations donate items to select charities (excludes donations of time and money). ¾ Job sharing: A full-time position is shared by two people, each working part-time hours. ¾ Outcomes-based wellness program: This program requires the achievement of a measurable goal, such as
achieving a certain body mass index. ¾ Paid caregiver leave: Paid caregiver leave allows employees to care for a dependent. The dependent does
not need to be a new child. ¾ Paid parental leave: Paid parental leave is dedicated paid leave that allows employees to bond with or care
for a new child. The employee does not need to use PTO, vacation, sick time, disability, etc., while using paid parental leave.
¾ Participatory wellness program: This program requires participation in an activity or program, such as a walking contest or nutrition seminar.
¾ Personal leave: Personal days, when offered under a traditional leave system, are usually made available for employees to take care of personal business, family matters, etc.
¾ Phased retirement: The term may describe a broad range of employment arrangements, formal and informal, that allow an employee approaching retirement to transition from full-time work to full-time retirement, usually by a reduced workload. Phased retirement takes many forms, including part-time, seasonal or temporary work or an extended leave of absence.
¾ Results-based work environment: This approach allows work to happen anywhere, anytime, in the way that works best for the employee but also achieves desired business results.
¾ Shift flexibility: Shift workers can trade shifts with each other as needed and/or trade hours within shifts to accommodate personal and professional responsibilities.
¾ Telemedicine services: Health-care professionals use telecommunications technology to evaluate, diagnose and treat patients in remote locations.
¾ Wellness gamification (e.g., contests, lotteries, points, quizzes, leaderboards, avatars): Gamification involves use of game-like features in nongame situations to motivate a change in behavior.
Inventory of Total Rewards Programs & Practices WorldatWork 63
Participating Organizations AAA Arizona Inc. AAM ABB Abiomed Inc. AccentCare Inc. ACI Worldwide Actelion Pharmaceuticals US Inc. Activision Blizzard Addepar ADT ADTRAN Inc. AdvantageCare Physicians Adventist Health System Aerojet Rocketdyne AFCC Aflac AgStar Financial Services AIPSO Air Liquide Airbus Helicopters Inc. Alaska Communications Albemarle Corp. Albert Einstein College
of Medicine Alion Science and Technology Alkermes Alliance Data Alliant Energy Corp. Allianz Worldwide Partners Alta Resources Altice USA AM Castle & Co. American Red Cross American Seafoods Group AmeriGas Propane Inc. Andersen Corp. Angie's List Anheuser-Busch Employees'
Credit Union ANON Apogee Enterprises Inc. Apptio Aramark Uniform Services Archrock Inc. Arizona Public Service Armstrong World Industries ArrMaz ARUP Laboratories Asahi Kasei Plastics North
America Inc. Associated Bank ATI Atmos Energy Corp. ATS Aurora Health Care
Automobile Club of Southern California
Avendra LLC Baker Hughes Ball Aerospace &
Technologies Corp. Banco Popular Puerto Rico Banfield Pet Hospitals Bank of the West Banner Health Barry Callebaut BayCare Health System BCBSNC BeachFleischman PC Bel Brands USA Bethany Christian Services Big Lots Blackboard Inc. Blucora Blue Cross Blue Shield
of Nebraska BlueCross BlueShield of
Rhode Island BlueCross BlueShield of
South Carolina BluePearl Veterinary Partners BMC Software Boston Medical Center Bottle Rocket LLC Bridgepoint Education Brigham Young University Broadridge Financial
Solutions Inc. Brown University Bucknell University Bunge Cabot Microelectronics Corp. Canon Solutions America Canon Virginia Inc. Capital Power Corp. CareerBuilder LLC Cargill Carriage Services Inc. Caterpillar Financial
Services Corp. CDI Centene Central Arizona Project Chapters Health System Chart Industries Chestnut Hill Realty Children's Health Christus Health City of Columbia City of Georgetown City of Naperville
City of Seattle Clean Harbors Cleveland Clinic CME Group CNH Industrial Colgate Palmolive Community Health Plan
of Washington CommunityAmerica Credit Union ConAgra Foods ConnectiCare Inc. CoorsTek Inc. Corix Group of Companies County of Albemarle County of Chester County of Kent Craftworks Restaurants and
Breweries Inc. Crawford and Co. CSAA IG CSX CWS Corporate Housing DayNine Consulting DCI-Artform Dealertrack Technologies Delhaize America Derry Township
Municipal Authority Dex Media Inc. Diana Kaplan Discover Financial Services Dominion Dorey-Reagan & Associates Draeger DRS Technologies Inc. DynCorp International Easter Seals Southern California Eaton ECM Publishers Inc. Elbit Systems of America Eli Lilly and Co. Emerus Holdings Inc. Emory Healthcare Empire Southwest LLC Employers Resource Association Encore Capital Group Engility Engineered Controls International Ensco PLC Enterprise Bank Equity Office Ericsson Inc. ESCO Corp. ESL Federal Credit Union Essendant Ethan Allen Global Inc.
Inventory of Total Rewards Programs & Practices WorldatWork 64
EVO Payments International Exactech Inc. Excentus Experian Express Scripts F5 Networks FCA Federal Reserve Bank of NY Ferguson Enterprises Inc. FirstEnergy Corp Fluor Federal Petroleum FMC Fortive Corp. Freeport LNG
Development LP Fresenius Kabi USA, LLC Galderma Laboratories LP GECU GEF Seniors Housing Gemalto Genomic Health Geokinetics Geonerco Management LLC Glassdoor GLOBALFOUNDRIES GM Golden Rain Foundation Goodman Networks Gordon and Betty
Moore Foundation Grande Cheese Co. Great Canadian Gaming Corp. Great River Energy Halcón Resources Hasbro Inc. Haselden Construction Hayashi Telempu North America
Corp. Hazelden Betty
Ford Foundation HD Supply HDR Inc. Health New England Helzberg Diamonds Hemophilia of Georgia Hines Interest LP Hitachi Data Systems Homesite Insurance Honeywell FM&T Horizon BlueCross BlueShield
of NJ Hourigan Construction HP Hood LLC Huntington National Bank Hutchinson Technology Inc. Hydranautics Hyster-Yale Group Hyundai Capital America iCIMS
IDEXX Laboratories IKEA IM Flash Technologies ImmunoGen IMT Residential inContact Inc. Indiana University Health Infor Ingredion Inc. Innovative Compensation and
Benefits Concepts Intact Financial Corp. Inter-Coastal Electronics Inc. J.J. Keller & Associates Inc. Jama Software Jo-Ann Stores LLC Johanson Group Jordan Valley Water
Conservancy District JTI JustFab Kaiser Permanente Kaman Corp. Kansas City Southern Railway KAR Auction Services Inc. Keystone Foods Konica Minolta Business
Solutions USA Inc. Lamoda Laredo Petroleum Inc. Latham & Watkins LLP Legg Mason Inc. Lehigh Valley
Health Network LEO Pharma Leprino Foods Level 3 Communications Lexicon Pharmaceuticals Inc. LexisNexis Risk Solutions Liberty Global Life & Specialty Ventures Lions Clubs International London Health Sciences Centre Lonza Lower Colorado River Authority Lumentum LyondellBasell Industries Maersk Line Agency Magellan Health Make-A-Wish America Manhattan Associates Inc. Maricopa County Marriott Vacations Worldwide Mars Inc. MARTA Masonite International Mastercard Worldwide Mattel Matthews, Young &
Associates Inc. McLane Co. Inc. MD Anderson Cancer Center Meda Pharmaceuticals Medical College
of Wisconsin Memorial Sloan Kettering
Cancer Center Mercy Health Merrill Corp. Mersen USA Bn Corp. MetaBank Metro Mold & Design Midland State Bancorp Inc. MidMichigan Health Midstates Petroleum Miraca Life Sciences Mission Produce Inc. Missouri Department
of Conservation MITRE Moog Inc. Moraine Park Technical College Mubea MultiCare Health System NAMSA National Pen Co. LLC National Western Life
Insurance Co. Nationstar Mortgage Nautilus Inc. Navistar Inc. NBA Nebraska Public Power District Nestle USA Neustar Nexeo Solutions Nexteer Automotive Noodles & Co. Nordson Corp. Nordstrom Norgren Inc. Noridian Mutual Insurance Co. Northern Trust NorthStar Financial Services
Group LLC Northwest Permanente PC Novo Nordisk Inc. Novozymes North America Nu Skin Enterprises NuStar NW Natural NWEA NxStage Medical Inc. NYCB Oceaneering International Inc. OCI Enterprises Ohio Gas Co. Olympus Americas
Inventory of Total Rewards Programs & Practices WorldatWork 65
Omaha Public Power District ON Semiconductor ONEOK Inc. ORAU Oxford University Press Pandora Jewelry Panera Bread Co. PATH Paycor Payless ShoeSource Inc. PayScale Pekin Insurance PeopleFluent Perkins Coie Pfaudler Pharmavite Pindrop LLC Pinnacle Foods Pitkin County PNM Resources Inc. Polycom Port of Seattle Portola Pharmaceuticals Inc. PPL Corp. PRA Health Sciences Prime Therapeutics Project HOPE ProQuest Provident Bank Public Service Enterprise Group Puffer-Sweiven QAD Inc. Qorvo Qualcomm Quantum Corp. Raffa RAI Ralis Red Hat Inc. Regions Hospital Republic Airways Holdings RGA Robert W. Baird & Co. Robertshaw Rockwater Energy Solutions Inc. Rockwell Automation Inc. Rubicon Project Inc. Rubino Consulting Services SAF-HOLLAND Inc. SAIC Saint Luke's Health System Salt River Project Savers Inc. SCANA Services Schneider Electric SchoolsFirst FCU
SCNM Semtech Serta Simmons Bedding SFC SICK Inc. Sidley Austin LLP SilverStone Group Simpson Manufacturing Co. Inc. SM Energy Co. Snap-on Inc. Solar Turbines Southwest Research Institute Splunk St. Lawrence Seaway
Management Corp. Stage Stores Inc. Stamats StandardAero State of Oregon,
Executive Branch State of South Dakota STIHL Inc. Superior Energy Services SurveyMonkey Susan G. Komen Sutherland Global Services Sutter Health Synacor Inc. Synapse Product Development SYNNEX T-Mobile Teck Resources TEP Terracon Consultants Inc. Terrapure Environmental Texas Children's Hospital Texas Instruments The Allstate Corp. The Boeing Co. The Coca-Cola Co. The Hershey Co. The Johns Hopkins U/Applied
Physics Lab The Law Society of
Upper Canada The Marcus Corp. The MITRE Corp. The National Academies of
Sciences, Engineering, and Medicine
The Polyclinic The Port Authority of New York
and New Jersey The Taubman Co. The Timken Co. The Toro Co.
The Vollrath Co. LLC The YMCA of Greater Rochester Thirty-One Gifts Toppan Photomasks Inc. Toshiba Medical Research
Institute USA Inc. Tower International TransCanada USA Services Tucson Electric Power Company Tufts Health Plan Tulane University U.S. Bank UMass Memorial Umicore Unified Grocers Inc. University of California, Office of
the President University of Massachusetts
Medical School U.S. Pharmacopeial Convention US Ecology Inc. USG Corp. UW Health Vector Security Vectren Verisign Inc. Videotron Virginia Mason Medical Center Vital Decisions LLC Volvo VWGoA Chattanooga
Operations LLC Washoe County Waste Management WECC Wellesley College Wellmark BlueCross BlueShield WellSpan Health Western National
Insurance Group Westfield Group Westinghouse Electric Co. LLC Whataburger Williams Scotsman Inc. Wilson Group Wilson Sporting Goods Co. Wintrust Financial Corp. Woodard & Curran WR Grace WVU Hospitals Wycliffe Seed Co. Xcel Energy Xero Inc. Youngevity Zimmer Biomet
Inventory of Total Rewards Programs & Practices WorldatWork 66
Index
24
24-hour nurse line11, 21, 32, 42, 52, 60
A
Above-and-beyond performance awards .. 16, 26, 37, 47, 56
Across-the-board pay increase (not COLA) .. 14, 25, 35, 45, 55
Adoption assistance .. 18, 29, 39, 49, 58
Adoption reimbursement 18, 29, 39, 49, 58
Alternative worksites 19, 30, 40, 49, 59
Annualized hours . 19, 30, 40, 49, 59
Appreciation luncheons, outings, formal events 16, 26, 37, 47, 56
Apprenticeships ... 16, 27, 37, 47, 57
Auto/home insurance 13, 24, 34, 44, 54
B
Backup child- or elder-care (center-based/in-home) ... 17, 28, 38, 48, 57
Behavioral health plan .... 10, 20, 31, 41, 51, 60
Bereavement leave ... 12, 22, 33, 43, 53
Bilingual pay.... 14, 25, 35, 45, 55 Biometric/wellness screening
(on site or through a doctor visit) ................................... 60
Biometric/wellness screening
(on-site or through a doctor visit) ........... 11, 21, 32, 42, 52
C
Call-in pay ....... 14, 24, 35, 45, 55 Career ladders or pathways .. 16,
27, 37, 47, 57 Career on- and off-ramps 19, 30,
40, 50, 59 Charitable fundraising programs
(e.g., United Way drive) .... 18, 29, 39, 48, 58
Child-care resource and referral services 11, 21, 31, 41, 51, 60
Child-care subsidies or discounts (e.g., U.S. IRC Section 129 plans) 17, 28, 38, 48, 57
Classroom learning, virtual learning, podcasts, webinars ................... 16, 27, 37, 47, 57
College preparation planning (e.g., application preparation, scholarship counseling) .... 18, 29, 39, 49, 58
College savings plan (529 plans in the U.S.) . 18, 29, 39, 49, 58
College scholarships for employees’ children ... 18, 29, 39, 49, 58
Commissions . 15, 25, 35, 45, 46, 55
Commuter/transportation benefits or subsidy 14, 24, 34, 44, 54
Compressed workweek ... 19, 30, 40, 49, 59
Concierge services .... 13, 24, 34, 44, 54
Corporate social responsibility
programs/green initiatives 18, 29, 39, 48, 58
Cost-of-living adjustment (COLA) ........ 14, 25, 35, 45, 55
Crowd-sourced feedback 15, 26, 36, 46, 56
D
Debt management (e.g., counseling, mortgage assistance) .. 18, 29, 39, 49, 58
Defined benefit plan .. 13, 23, 34, 44, 54
Defined contribution plan (e.g., 401(k), 403(b), 457 plans) . 13, 23, 34, 44, 54
Dental plan ..... 10, 20, 31, 41, 51 Dependent care spending
account program (e.g., U.S. IRC Section 125 plans) . 17, 28, 38, 48, 57
Disaster relief fund .... 18, 29, 39, 48, 58
Discounted fitness-club membership/fitness-related subsidies.... 12, 22, 32, 42, 52, 61
Diversity/inclusion initiatives 18, 29, 39, 48, 58
E
Elder-care resource and referral services 11, 21, 31, 41, 51, 60
Employee assistance program (EAP)..... 11, 21, 31, 41, 51, 60
Employee discount program . 13, 17, 24, 28, 34, 38, 44, 48, 54, 57
Inventory of Total Rewards Programs & Practices WorldatWork 67
Employee discount program for dependent-care providers 17, 28, 38, 48, 57
Employee life insurance/AD&D .................... 10, 20, 31, 41, 51
Employee of the month/year awards ........ 16, 26, 37, 47, 56
Employee scholarship/student aid/loans ..... 18, 29, 39, 49, 58
Employee stock ownership plan (ESOP) ......... 13, 23, 34, 44, 54
Employee stock purchase plan (ESPP) ......... 13, 24, 34, 44, 54
F
Flex time (ability to adjust workday start and end times) .................... 19, 30, 39, 49, 59
Flexible spending accounts (FSAs) .......... 10, 20, 31, 41, 51
Floating holidays .. 12, 22, 33, 43, 53
Forced ranking 15, 26, 36, 46, 56 Formal coaching/mentoring . 16,
27, 37, 47, 57 Formal performance
appraisals/reviews 15, 26, 36, 46, 56
Formal performance ratings . 15, 26, 36, 46, 56
Free parking or parking subsidy .................... 14, 24, 34, 44, 54
Frequent performance check-ins (at least quarterly) 15, 26, 36, 46, 56
G
Geographic or locality pay adjustment . 14, 25, 35, 45, 55
Goal-specific awards (quality, efficiency, cost savings, productivity, safety) ... 16, 27, 37, 47, 56
H
Hazard pay ..... 14, 24, 35, 45, 55 Health advocacy program11, 21,
32, 42, 52, 60, 62 Health coaching .. 11, 21, 32, 42,
52, 60 Health fairs (on site or virtual)60 Health fairs (on-site or virtual)
................... 11, 21, 32, 42, 52 Health reimbursement accounts
(HRAs) ........ 10, 20, 31, 41, 51 Health savings accounts (HSAs)
................... 10, 20, 31, 41, 51 Health-risk assessment (HRA)11,
21, 32, 42, 52, 60 Healthy cafeteria options 12, 22,
33, 43, 52 Healthy vending machine
options ....... 12, 22, 33, 43, 53 High-deductible medical plan 10,
20, 31, 41, 51 Hiring bonus ... 15, 25, 35, 45, 55 HMO medical plan .... 10, 20, 31,
41, 51 Holiday pay .... 12, 22, 33, 43, 53 Hoteling .......... 19, 30, 40, 49, 59
I
Identity theft insurance .. 13, 24, 34, 44, 54
Immunization clinics or promotions 11, 21, 31, 41, 51, 60
Individual performance-based incentives ... 15, 25, 36, 46, 55
Informal coaching/mentoring ................... 16, 27, 37, 47, 57
Informal performance ratings (used for pay decisions but not shared with employee) ................... 15, 26, 36, 46, 56
In-kind donations 18, 29, 39, 48, 58
Internal job postings .. 16, 27, 37, 47, 57
Internships ...... 16, 27, 37, 47, 57
J
Job rotations ... 16, 27, 37, 47, 57 Job sharing ..... 19, 30, 40, 50, 59
L
Lactation-support services (e.g., education, lactation consultants, mother’s room) ................... 17, 28, 38, 48, 57
Leadership training .... 16, 27, 37, 47, 57
Legal insurance, referral or consultation 13, 24, 34, 44, 54
Length-of-service awards 16, 26, 37, 47, 56
Longevity pay increase .... 14, 25, 35, 45, 55
Long-term care insurance 13, 24, 34, 44, 54
Long-term disability (LTD) insurance .... 10, 20, 31, 41, 51
M
Major family event celebration (e.g., birth, wedding) ... 16, 27, 37, 47, 56
Matching gift program .... 18, 29, 39, 48, 58
Multigenerational initiatives . 17, 29, 38, 48, 58
N
Nonqualified deferred compensation plan 13, 23, 34, 44, 54
Nutritional counseling (on site or covered by medical plan) ........................................... 60
Inventory of Total Rewards Programs & Practices WorldatWork 68
Nutritional counseling (on-site or covered by medical plan) .................... 11, 21, 32, 42, 52
O
On- or near-site child-care center (sponsored or operated by employer or union) ......... 17, 28, 38, 48, 57
On- or near-site elder-care center (sponsored or operated by employer or union) ......... 17, 28, 38, 48, 57
On-call pay ...... 14, 24, 35, 45, 55 On-site fitness center 12, 22, 33,
43, 52 On-site fitness classes 12, 22, 33,
43, 52 On-site medical clinic or nurse
.............. 11, 21, 32, 42, 52, 60 On-site or virtual caregiver
support ....... 17, 28, 38, 48, 57 Outcomes-based wellness
program ..... 11, 21, 32, 41, 51, 60, 62
Outside seminars and conferences 16, 27, 37, 47, 57
Overtime pay for exempt employees .. 14, 25, 35, 45, 55
P
Paid caregiver leave .. 12, 23, 33, 43, 53
Paid parental leave ... 12, 23, 33, 43, 53
Paid sabbaticals ... 12, 23, 33, 43, 53
Paid time off to volunteer .... 18, 29, 39, 48, 58
Participatory wellness program ........ 11, 21, 32, 41, 51, 60, 62
Part-time/reduced-work schedules .... 19, 30, 40, 49, 59
Peer-to-peer awards . 16, 26, 37, 47, 56
Performance awards (long-term) .......... 15, 26, 36, 46, 56
Performance sharing (short-term) .......... 15, 25, 36, 46, 55
Performance-based pay increase (merit increase) .. 14, 25, 35, 45, 55
Personal financial-planning services (e.g., seminars, access to financial planners, estate planning) .... 18, 29, 39, 49, 58
Personal leave 12, 23, 33, 43, 53 Personal tax services . 18, 30, 39,
49, 58 Pet insurance . 13, 24, 34, 44, 54 Phased retirement .... 19, 30, 40,
50, 59 Phased return to work after
leave of absence ... 19, 30, 40, 50, 59
PPO medical plan 10, 20, 31, 41, 51
Prescription drug plan ..... 10, 20, 31, 41, 51, 60
Profit sharing (not retirement) ................... 15, 25, 36, 46, 55
Project completion bonus ..... 15, 25, 35, 45, 55
Promotions..... 16, 27, 37, 47, 57 PTO bank (collapsed vacation,
sick leave, etc.) 12, 22, 33, 43, 53
R
Referral bonus 15, 25, 35, 45, 55 Restricted stock/restricted stock
units (RSUs) 15, 26, 36, 46, 56 Results-based work
environment ... 19, 30, 40, 50, 59
Retention bonus .. 15, 25, 35, 45, 55
Retiree health-care benefits .. 13, 23, 34, 44, 54
Retirement awards .... 16, 26, 37, 47, 56
S
Seasonal schedules (e.g., summer hours) 19, 30, 40, 50, 59
Self-development tools ... 17, 27, 38, 47, 57
Seminars, webinars or literature to promote wellness and well-being . 11, 21, 32, 42, 52, 60
Shared/donation of leave program ..... 12, 23, 33, 43, 53
Shift differential pay .. 14, 24, 35, 45, 55
Shift flexibility . 19, 30, 40, 49, 59 Short-term disability (STD)
insurance .... 10, 20, 31, 41, 51 Sick leave (separate from
collapsed PTO bank) .... 12, 22, 33, 43, 53
Skill-based pay 14, 25, 35, 45, 55 Spot bonus ..... 15, 25, 35, 45, 55 Spouse/dependent life
insurance .... 10, 20, 31, 41, 51 Stock options/stock
appreciation rights (SARs) . 15, 26, 36, 46, 56
Stress-reduction programs/offerings (e.g., yoga, massage, meditation) ............. 11, 21, 32, 42, 52, 60
Student loan debt repayment assistance ... 18, 29, 39, 49, 58
Subsidized weight-loss programs ... 11, 22, 32, 42, 52, 61
Inventory of Total Rewards Programs & Practices WorldatWork 69
Succession planning .. 16, 27, 37, 47, 57
Suggestion/idea programs .... 16, 27, 37, 47, 56
Support for employees with responsibility for individual(s) with special needs 17, 28, 38, 48, 57
T
Telemedicine services 10, 20, 31, 41, 51, 60, 62
Telework (ad hoc) 19, 30, 39, 49, 59
Telework (full-time remote) . 19, 30, 40, 49, 59
Telework (occasional/part-time) .................... 19, 30, 40, 49, 59
Tobacco-/smoking-cessation support . 11, 21, 32, 42, 52, 60
Travel-related dependent care expense reimbursement (for child, elder or special needs) .................... 17, 28, 38, 48, 57
Tuition discounts . 16, 27, 37, 47, 57
Tuition reimbursements . 16, 27, 37, 47, 57
U
Unlimited paid time off ... 12, 23, 33, 43, 53
Unpaid sabbaticals .... 13, 23, 33, 44, 53
Unpaid, job-protected time off to care for or bond with new child (beyond legal requirements, if applicable, and beyond any paid parental leave your organization may offer) .... 13, 23, 33, 44, 53
Use of wearable technology for encouraging wellness results ............. 11, 21, 32, 42, 52, 60
V
Vacation (separate from collapsed PTO bank) ... 12, 22, 33, 43, 53
Vision plan 10, 20, 31, 41, 51, 60
W
Weekend/holiday pay14, 24, 35, 45, 55
Weight-management programs ............. 11, 21, 32, 42, 52, 60
Wellness gamification (e.g., contests, lotteries, points, quizzes, leaderboards, avatars) 12, 22, 32, 42, 52, 61, 62
Wellness incentives (e.g., cash and noncash prizes, acknowledgement, rewards) ............. 11, 22, 32, 42, 52, 61
Women’s advancement initiatives .... 17, 28, 38, 48, 58
Work-environment initiatives (e.g., creative a purpose-driven culture, shifting to a flexible environment, health-leadership initiatives, Best Place to Work initiative).... 17, 28, 38, 48, 58


