Page 1
Inverse Convolution Method for Periodic Media under Deterministic and Stochastic Condition
Presenter: Xuefeng Li
Authors: Xuefeng Li, Mohamed Ichchou, Abdelmalek Zine,
Noureddine Bouhaddi, Christophe Droz
Email: [email protected]
LTDS - Ecole Centrale de Lyon, France
Page 2
Profile
Currentresearch
Direction: Periodic media, Wave propagating, Vibration control
Supervisors: N.BOUHADDI, M.N.ICHCHOU, A.-M. ZINE
Profile
Research
Name Xuefeng Li
Date Nov. 04, 1993
University Ecole Centrale de Lyon
Lab Vibroacoustics & Complex Media
Research Group in LTDS
Page 3
I. The background of INCOME
II. Inverse methods for wavenumber extraction
III. The theory of 1D deterministic INCOME
IV. Application cases
V. The prospection of 1D stochastic INCOME
Page 4
The background of INCOME
Page 5
Fig.1 Periodic structure
Fig.2 Schematic diagram of the band structure
(a) Band gap (b) Pass band
• Characteristic: Attenuation band• Periodic structure
• K-space---------Dynamical behavior
• Background
✓ Structural optimization in aerospace and civil
engineering: vibration isolation, unable filters.
✓ The arrival estimation for sonar and radar,
protection of electrical power lines and so on.
• Uncertainties---------Practical meaning
Experimental
data
Periodic
sampling
Stochastic
sampling
Inverse
methodsK-space
• Block diagram of Inverse methods
Fig.3 Block diagram of inverse methods
Achieve more realistic k-space characteristics’
identification
1
Page 6
Inverse methods for wavenumber extraction
Page 7
• Existing methods to study periodic structure[1] Shi Zhaifei,
“Periodic structure
theory and its
application in vibration
isolation and vibration
reduction,” C. Science
Press, 2017-06-01.
[2] Droz C , Zhou C ,
Ichchou M , et al, “ A
hybrid wave-mode
formulation for the
vibro-acoustic analysis
of 2D periodic
structures,” J. Journal
of Sound & Vibration,
363:285-302, 2016.
[3] Zhou C,“Wave and
modal approach for
multi-scale analysis of
periodic structures,” D.
Ecole centrale de lyon,
2014.
[4] Wim Desmet,
Mohamed Ichchou et al,
“Mid-frequency CAE
methodologies for mid-
frequency analysis in
vibration and acoustics,”
C. Katholieke
University Leuven,
2012.
2
Page 8
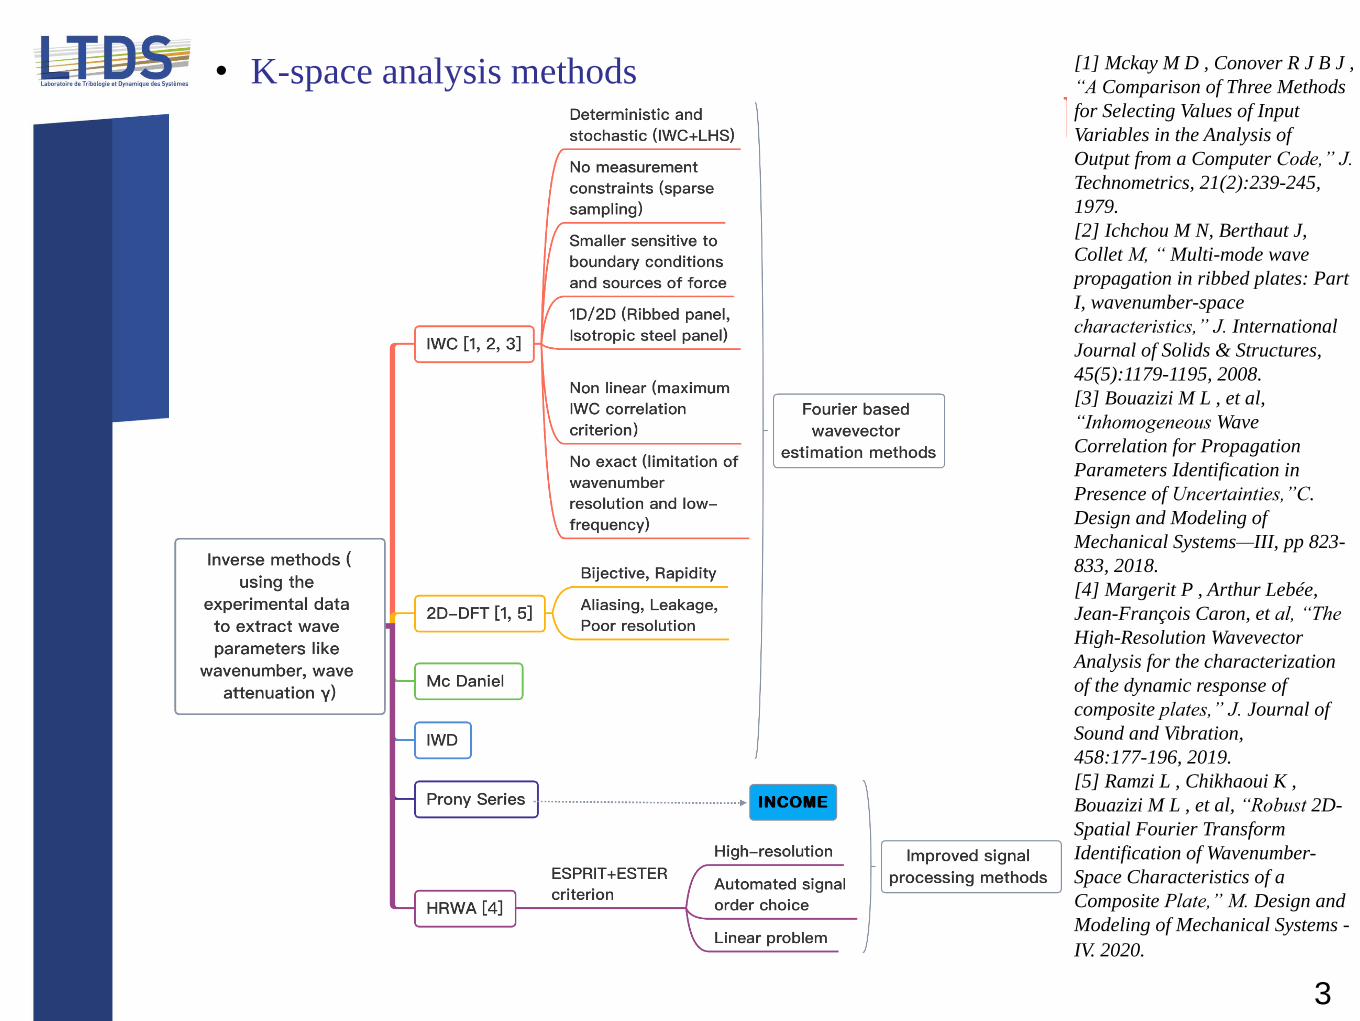
• K-space analysis methods [1] Mckay M D , Conover R J B J ,
“A Comparison of Three Methods
for Selecting Values of Input
Variables in the Analysis of
Output from a Computer Code,” J.
Technometrics, 21(2):239-245,
1979.
[2] Ichchou M N, Berthaut J,
Collet M, “ Multi-mode wave
propagation in ribbed plates: Part
I, wavenumber-space
characteristics,” J. International
Journal of Solids & Structures,
45(5):1179-1195, 2008.
[3] Bouazizi M L , et al,
“Inhomogeneous Wave
Correlation for Propagation
Parameters Identification in
Presence of Uncertainties,”C.
Design and Modeling of
Mechanical Systems—III, pp 823-
833, 2018.
[4] Margerit P , Arthur Lebée,
Jean-François Caron, et al, “The
High-Resolution Wavevector
Analysis for the characterization
of the dynamic response of
composite plates,” J. Journal of
Sound and Vibration,
458:177-196, 2019.
[5] Ramzi L , Chikhaoui K ,
Bouazizi M L , et al, “Robust 2D-
Spatial Fourier Transform
Identification of Wavenumber-
Space Characteristics of a
Composite Plate,” M. Design and
Modeling of Mechanical Systems -
IV. 2020. pp 271-281
3
Page 9
The theory of 1D deterministic INCOME
Page 10
Education
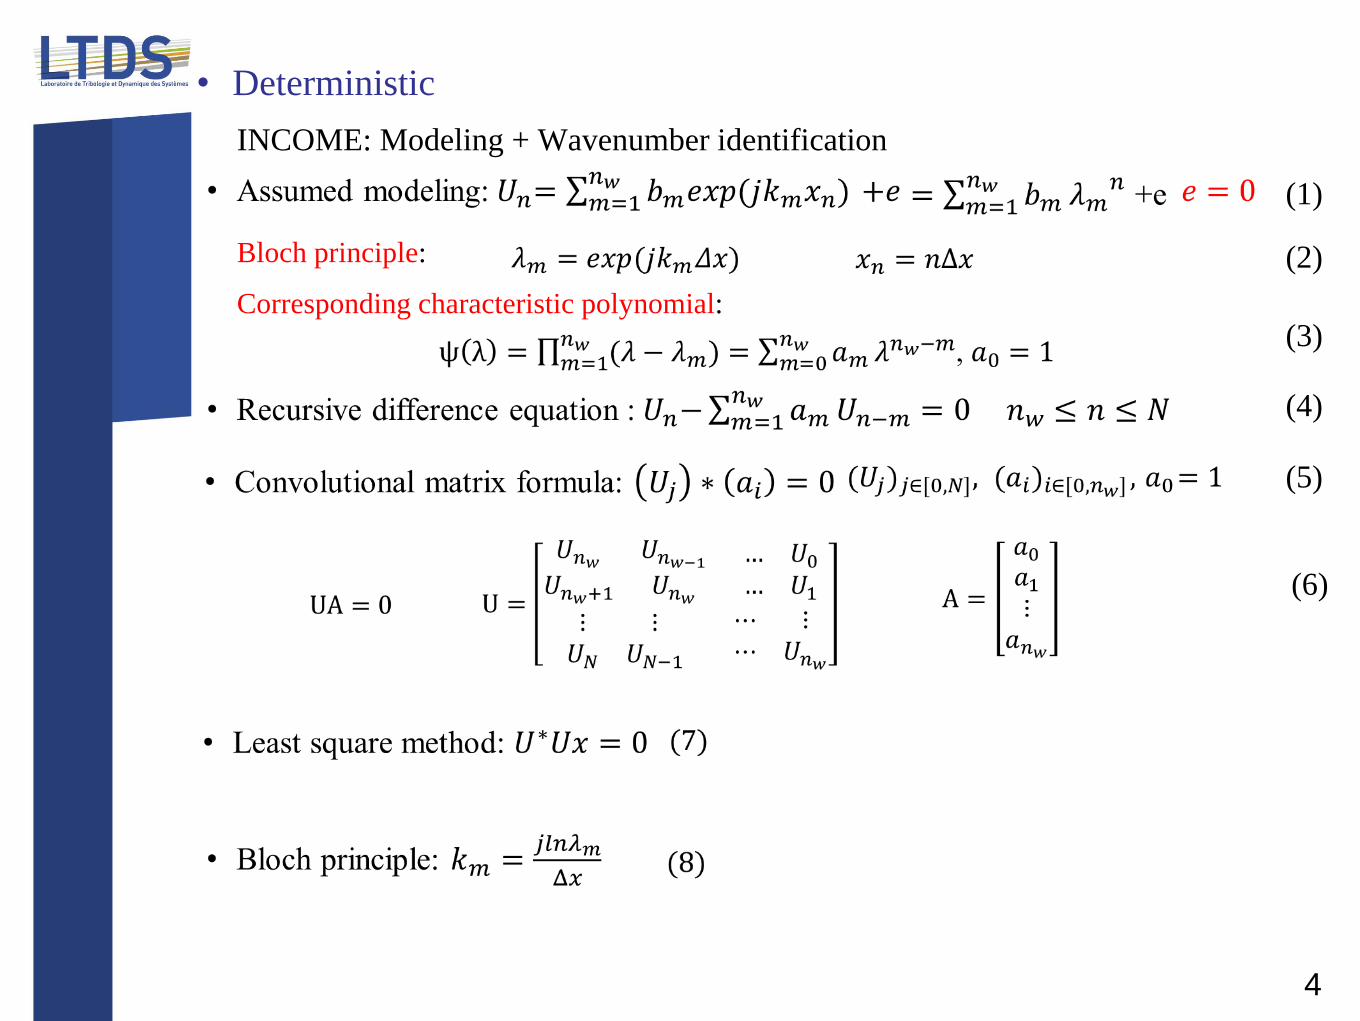
Bloch principle:
INCOME: Modeling + Wavenumber identification
Corresponding characteristic polynomial:
• Deterministic
4
(1)
(2)
(3)
(4)
(5)
(6)
Page 11
Application cases
Page 12
propagating positive wave
F1
• A longitudinal propagating wave case
Fig.4 Longitudinal motion generated by a harmonic point force acting on a finite bar.
5
• Non-dimensional dispersion relation
Fig.5 The real part of dispersion curve Fig.6 The imaginary part of dispersion curve
Page 13
…
F
Fig.7 The model of cantilevered Timoshenko beam with resonators
6
WWFEM: Expected dispersion curve
INCOME: INCOME dispersion curve
• Resonators
Natural frequency of resonators: 500 Hz
Damping of resonators: 0.05
• Harmonic excitation
𝐹 = 10 sin 𝑤𝑡
FEM: Displacement curve
comparison
Page 14
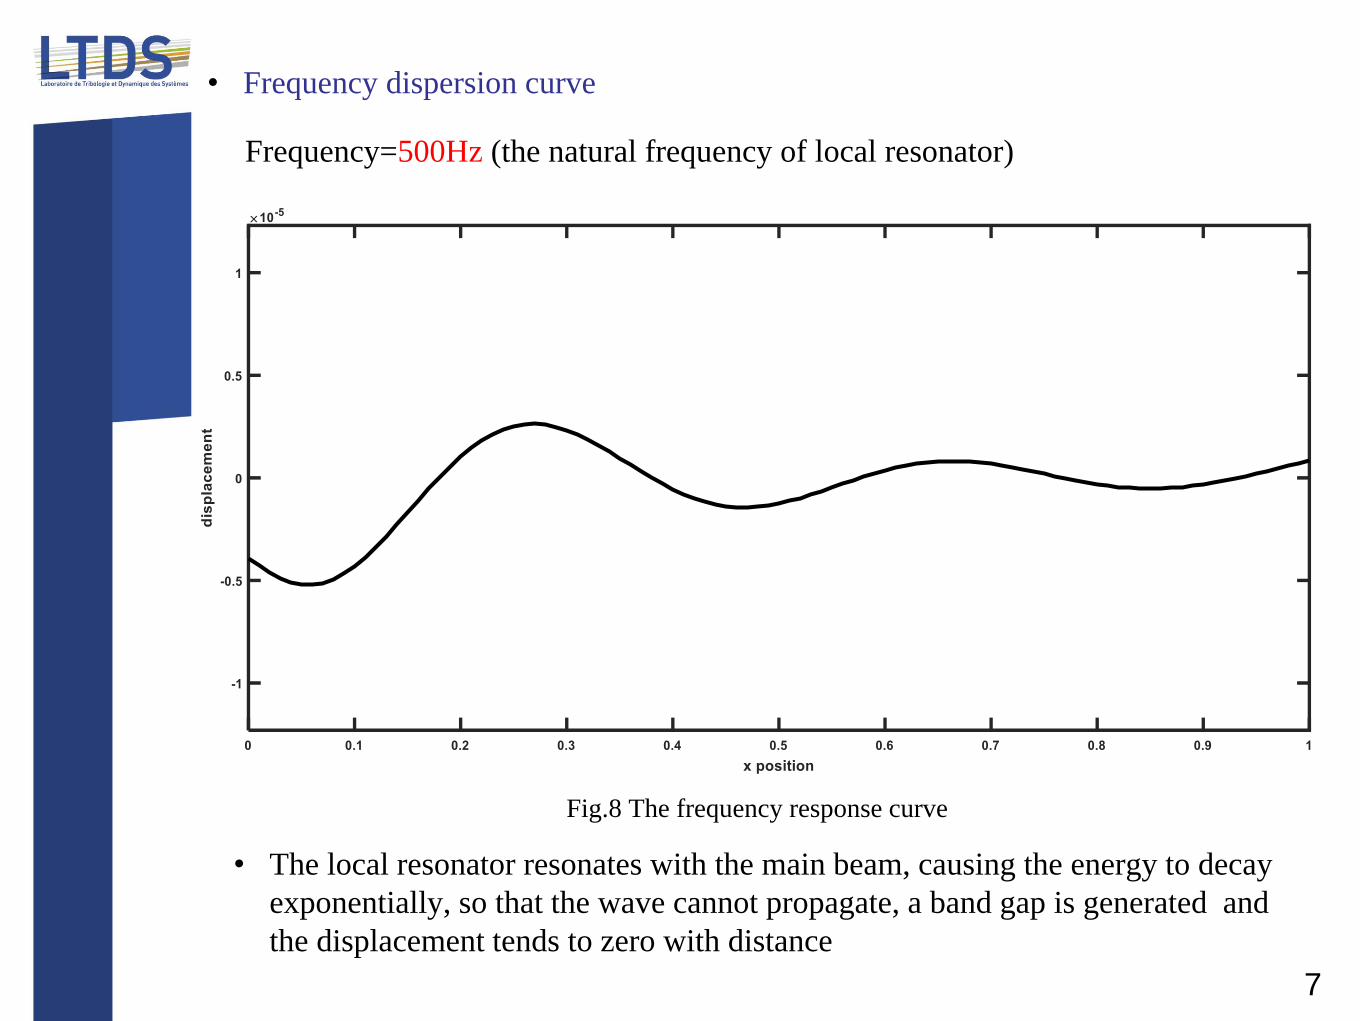
• Frequency dispersion curve
Frequency=500Hz (the natural frequency of local resonator)
• The local resonator resonates with the main beam, causing the energy to decay
exponentially, so that the wave cannot propagate, a band gap is generated and
the displacement tends to zero with distance
Fig.8 The frequency response curve
7
Page 15
• The first band gap: 480Hz---520Hz
Fig.9 The complex dispersion curve of positive propagating wave
8
Band gap
Page 16
The prospection of 1D stochastic INCOME
Page 17
• Assumed modeling
Noise: white Gaussian noiseUncertainty
factorsNon-periodicity measurements
• Wavenumber identification S(ω)
Signal pre-processing
INCOMEAutomated estimation
of signal order
K(ω)
Fig.10 Block diagram of INCOME
9
✓ A sample-based uncertainty
propagating method
✓ An automated estimation of signal
order 𝑛𝑤𝑛𝑤


![Some Inverse Problems in Periodic Homogenization of ... · It was proved by Lions, Papanicolaou and Varadhan [16] that u ...](https://static.documents.pub/doc/80x56/5ae5fc347f8b9a6d4f8c0cc4/some-inverse-problems-in-periodic-homogenization-of-was-proved-by-lions-papanicolaou.jpg)


