Page 1
Archives of Pharmaceutical Sciences Ain Shams University 2020; Vol. 4(2):249-252
Research Article Pharmaceutical Analytical Chemistry
Chemistry
Inversely Calibrated Curvilinear Artificial Neural Network Model for Simultaneous Assay
of Ternary Cardiovascular Drug Mixture
Miranda F. Kamal
*a, Marwa K. El Jamal
b, Azza A. Gazy
c
aDepartment of
Pharmaceutical Analytical Chemistry, Faculty of Pharmacy, Damanhour University, Egypt
bDepartment of Pharmaceutical Analytical Chemistry and Drug Quality Control Beirut Arab University, Faculty of
Pharmacy, Department of Pharmaceutical Technology, Beirut, Lebanon cDepartment of Pharmaceutical Analytical Chemistry and Drug Quality Control Beirut Arab University, Faculty of
Pharmacy, Department of Pharmaceutical Technology, Beirut, Lebanon
ABSTRACT
Novel chemometric design, tailored for pre-clinical multiple drug screening, goals for bioanalytical future scope. A
highly sensitive, non-linear multivariate Artificial Neural Network (ANN) is developed and applied for
simultaneous spectrophotometric determination of three commonly concomitant cardiovascular drugs in a laboratory
made mixtures and spiked human plasma samples. Ticagrelor, Irbesartan, and Hydrochlorothiazide have been
simultaneously quantified in the curvilinear ranges of 0-30 µg/mL, 0-10 µg/mL, and 0-3 µg/mL respectively.
Highly overlapping Near UV absorption spectra of three drugs, in the region of 215-280 nm, have been recorded 1-
nm range in synthetic ternary mixtures and trained iteratively. By inversely relating the concentration matrix (x-
block) with its corresponding absorption one (y-block), gradient-descent back-propagation ANN calibration could be
computed and optimized. All proposed mathematical modeling was manipulated using MATLAB® 2007, reaching
down to sixth order exponential Mean Square Error, MSE. To validate, an independent set of ternary synthetic
mixtures has been constructed and examined, where excellent recovery results have been obtained. Furthermore, the
application of the suggested model to varying ratios of synthetic ternary mixtures as well as spiked plasma samples
has resulted in accurate, precise, and robust estimations with no background interference. ANN method was
compared to a reference HPLC method; Student's t-test and F-variance ratio were calculated and showed the
insignificant difference. This chemometric approach is an eco-friendly green assay, time-saving, and economic
method. It initiates a pathway for clinical drug screening through affordable spectroscopic instrumentation.
Keywords: Artificial Intelligence; UV-Spectrophotometry; Ticagrelor; Irbesartan; Hydrochlorothiazide; spiked
plasma; Non-linear range.
*Correspondence | Miranda F. Kamal; Department of Pharmaceutical Analytical Chemistry, Faculty of Pharmacy, Damanhour University,
Egypt. Email: [email protected]
Citation | Kamal MF, El Jamal MK, Gazy AA, 2020. Inversely Calibrated Curvilinear Artificial Neural Network Model for Simultaneous Assay
of Ternary Cardiovascular Drug Mixture. Arch Pharm Sci ASU 4(2): 249-252
DOI: 10.21608/aps.2020.45025.1042
Print ISSN: 2356-8380. Online ISSN: 2356-8399.
Received 22 October 2020. Accepted 26 December 2020.
Copyright: ©2020 Kamal et al. This is an open-access article licensed under a Creative Commons Attribution 4.0 International License (CC BY
4.0), which permits unrestricted use, distribution, and reproduction in any medium, provided the original author(s) and source are credited.
Published by: Ain Shams University, Faculty of Pharmacy
1. INTRODUCTION
Although Spectrometric drug assays are still
the most applicable in quality control
laboratories, their application is highly limited at
the demand of high sensitivity and resolving
much complicated overlaps. Intelligent spectral
data analysis is no longer welfare for analysts [1].
Statistical data analysis, artificial intelligence,
mathematical optimization, and machine learning
are core competencies of chemometric trials for
drug analysis in multicomponent complex
Page 2
Kamal et al., Arch Pharm Sci ASU 4(2): 249-252
250
formulations [2, 3]. Besides, being ecofriendly
and green methods [4], Artificial neural networks
(ANNs) or connectionist systems work like
human brains, collect joined units or nodes
known as artificial neurons, which handle the
neurons in the human brain. Each junction, like
synapses in real brains, can send a signal to other
neurons. In ANN manipulations, the "signal" is
data and each neuro signal is calculated by non-
linear function [5].
ANN abilities, as a machine learning
computational mathematical pattern, is classified
a subcategory of; function approximation,
regression analysis, data processing,
classification, sequential decision making, and
reaching robotics control. Predictive analytics by
the ANN calibration model can be efficiently
applied for non-linear relationships, quantitative
analysis of complex pharmaceutical matrices, and
highly overlapped spectral data. Yet unresolved
data sets could be identified using ANNs [6, 7].
ANNs have processed in vitro in vivo
correlations [8, 9]. Networks have also been
applied to pharmacokinetic data sets [10] and
different pharmaceutical drug combinations have
been assayed by ANNs [11-13].
Antihypertensive treatment reduces the risk of
cardiovascular infarctions. Recent cardiac
guidelines recommend combination therapy,
rather than monotherapy [14]. Antithrombic
agents synergize with antihypertensive
combinations for long term treatment [15].
Alternatively, screening for potential drug-drug
interactions, contraindications, or both, and by
making therapeutic recommendations aimed at
achieving optimal response without increasing
the potential for adverse drug reactions,
especially among elderly patients and those with
multiple medical conditions. High demand for
accurate and sensitive analysis as well as being
economic, affordable, and green one.
The antihypertensive, Irbesartan (IRB), or 2-
butyl-3-[[2′-(1H-tetrazole-5-yl)[1,1′-biphenyl]-4-
yl]-methyl1-3-diazaspiro-[4,4]-non-1-en-4-one,
(Fig. 1), is an angiotensin II blocker. It blocks
AT1 receptors, reducing the effects of
angiotensin II [16].
Fig. 1. Chemical Structure of Irbesartan
The antihypertensive, Hydrochlorothiazide
(HCT), or 6-chloro-3,4-dihydro-2H-1,2,4-
benzothiadiazine-7-sulphonamide-1,1-dioxide,
(Fig. 2), promotes excretion of sodium and
chloride through the kidney. It also prevents
stone formation [16].
Fig. 2. Chemical Structure of Hydrochlorothiazide
The orally active antithrombic, Ticagrelor
(TICA), or (1S,2S,3R,5S)-3-[7-{[(1R,2S)-2-(3,4-
difluorophenyl)cyclopropyl]amino}-5-
(propylthio)-3H-[1,2,3]-triazolo [4,5-d]
Page 3
Artificial Neural Network Model for Assay of Ternary Cardiovascular Drug Mixture 251
pyrimidin-3-yl]-5-(2-hydroxyethoxycyclo
pentane-1,2-diol 2, was FDA approved 2011
(Fig. 3). It inhibits platelet activation and
aggregation mediated by the P2Y12 ADP-
receptor1. Thus it lowers the rate of thrombotic
cardiovascular infarction in patients with acute
coronary syndrome [16].
Fig. 3. Chemical Structure of Ticagrelor
Literature states different analytical
techniques for IRB determination using UV-
Spectrophotometry [17], and RP-HPLC [18].
Also, determined in human plasma by LC [19].
In presence of HCT, IRB has been determined
spectrophotometrically [20], RP-HPLC [21, 22],
and thermometrically [23]. Both HCT and IRB
mixture was simultaneously quantified in
biological fluids [24, 25]. Other IRB
combinations have been assayed
chromatographically [26, 27]. HCT, as a single
component, has been determined UV-
spectrophotometrically [28], and LC [29]. HCT
combination mixtures have been resolved either
by LC [30] or thermometrically [31]. TICA has
been assayed by UV-spectrophotometry [32]. As
well as in plasma samples, it has been determined
by LC-MS [33] and LC-MS-MS [34].
Literature reveals the simultaneous
determination of IRB, HCT, and TICA ternary
mixtures by RP-LC, and spectrophotometrically
[35, 36]. Meanwhile, the present work is the first
to use iterative neural modeling for the three
drugs' non-linear UV spectra, starting at zero
µg/mL quantification. The proposed model
permits their determination in plasma samples
spectrophotometrically without prior
chromatographic separation, coming over the
latter references.
2. MATERIALS AND METHODS
2.1. Apparatus
Thermo Spectronic UV-Vis
spectrophotometer connected to Harvest
computer system was used. Absorption spectra
were measured in 1-cm quartz cells. The
absorbance data was displayed on EXCEL sheets
and processed using MATLAB software.
2.2. Materials and Reagents
TICA was purchased from AstraZeneca. IRB
and HCT were obtained from Accord-UK LTD,
London.
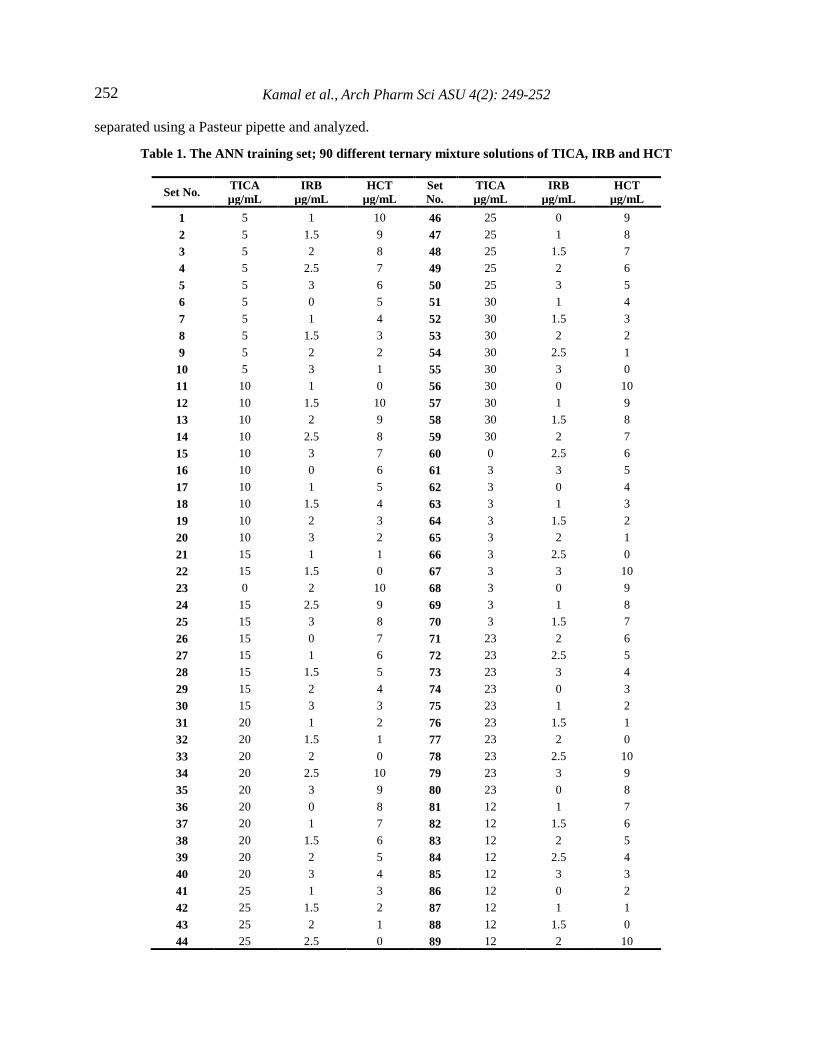
2.3. Standard Solutions
Standard stock solutions, 100 µg/mL, of each
of TICA, IRB, and HCT were separately and
accurately prepared in ethanol. Different aliquots
were micropippetted from each stock solution to
form a set of 90 standard ternary mixtures. A
wide range of drug concentrations was stated in
each synthetic mixture as in Table 1.
2.4. Preparation of Spiked Plasma Samples
Plasma from the blood bank (Biuret,
Lebanon) was purchased and kept at −20 °C.
Gentle heating and shaking were required at the
time of analysis. K3 EDTA was added for
protein precipitation. Here, 400 μL of plasma
samples were taken separately into a serial tube
and vortexed for 3 min after being spiked with
ternary mixture solution (in ethanol) at different
concentration ratios. Then, the total amount of
ethanol was brought to 1 mL by evaporation
under a stream of nitrogen and vortexed for 3
min. The mixtures were centrifuged for 20 min at
4500 rpm, the supernatants were carefully
Page 4
Kamal et al., Arch Pharm Sci ASU 4(2): 249-252
252
separated using a Pasteur pipette and analyzed.
Table 1. The ANN training set; 90 different ternary mixture solutions of TICA, IRB and HCT
Set No. TICA
µg/mL
IRB
µg/mL
HCT
µg/mL
Set
No.
TICA
µg/mL
IRB
µg/mL
HCT
µg/mL
1 5 1 10 46 25 0 9
2 5 1.5 9 47 25 1 8
3 5 2 8 48 25 1.5 7
4 5 2.5 7 49 25 2 6
5 5 3 6 50 25 3 5
6 5 0 5 51 30 1 4
7 5 1 4 52 30 1.5 3
8 5 1.5 3 53 30 2 2
9 5 2 2 54 30 2.5 1
10 5 3 1 55 30 3 0
11 10 1 0 56 30 0 10
12 10 1.5 10 57 30 1 9
13 10 2 9 58 30 1.5 8
14 10 2.5 8 59 30 2 7
15 10 3 7 60 0 2.5 6
16 10 0 6 61 3 3 5
17 10 1 5 62 3 0 4
18 10 1.5 4 63 3 1 3
19 10 2 3 64 3 1.5 2
20 10 3 2 65 3 2 1
21 15 1 1 66 3 2.5 0
22 15 1.5 0 67 3 3 10
23 0 2 10 68 3 0 9
24 15 2.5 9 69 3 1 8
25 15 3 8 70 3 1.5 7
26 15 0 7 71 23 2 6
27 15 1 6 72 23 2.5 5
28 15 1.5 5 73 23 3 4
29 15 2 4 74 23 0 3
30 15 3 3 75 23 1 2
31 20 1 2 76 23 1.5 1
32 20 1.5 1 77 23 2 0
33 20 2 0 78 23 2.5 10
34 20 2.5 10 79 23 3 9
35 20 3 9 80 23 0 8
36 20 0 8 81 12 1 7
37 20 1 7 82 12 1.5 6
38 20 1.5 6 83 12 2 5
39 20 2 5 84 12 2.5 4
40 20 3 4 85 12 3 3
41 25 1 3 86 12 0 2
42 25 1.5 2 87 12 1 1
43 25 2 1 88 12 1.5 0
44 25 2.5 0 89 12 2 10
Page 5
Artificial Neural Network Model for Assay of Ternary Cardiovascular Drug Mixture 253
45 0 3 10 90 12 2.5 5
ANN; Artificial Neural Network – TICA; Ticagrelor – IRB; Irbesartan – HCT; Hydrochlorothiazide addition of organic solvent + centrifugation + evaporation + addition of mobile phase)
2.5. Construction of ANN Model
Modeling access related both the
concentrations of the ternary drug mixture
(TICA, IRB, and HCT) and their corresponding
absorbance values, in a wide non-linear range,
independent of Beer's law. As a start, the
multivariate ternary model was constructed based
on a training set; 90 mixtures of standard drugs,
followed by ANN optimization through a
predictive five-level three-factor design. These
135 sample mixtures were split into 90 training
mixtures (for building the models) and 45
validation mixtures (for measuring the predictive
power of the model). The concentration set;
training set, of 90 synthetic mixtures containing
TICA, IRB, and HCT in the concentration range
of 0-30 µg/mL, 0-10 µg/mL, and 0-3 µg/mL,
respectively in ethanol were prepared. Their
absorption spectra (A; x-block, conc.; y-block) of
the mixture set were plotted and recorded (66-
wavelength points) in the spectral range of 215-
280 nm (Fig. 4).
Fig. 4. Absorption curves of 9 μg.mL-1 TICA (….), 6
μg.mL-1 HCT ( ___ black line), and 1.25 μg.mL-1 IRB
(grey line) in ethanol
ANN chemometric calibration was computed in a
non-linear relationship between triple vector (3
concentration set) and their corresponding A
readings (y-block).
2.6. ANN Optimization
Various topological networks were iteratively
run for optimization. A training network of 120
neurons in the input layer, 50 neurons in hidden
layers, and three outputs for the calibration and
prediction steps was found to be suitable for the
construction of ANN calibration for the
simultaneous quantitative prediction of the three
co-administrated drugs in laboratory prepared
mixtures and spiked plasma samples.
2.7. Study for ANN Optimization parameters
Transfer function; it is chosen according to
the nature of trained data. Being non-linear (A vs
conc). Correlation, Log sigmoid activation
function has been used for hidden and output
layers.
Gradient descent training neural network has
been backpropagated (Fig. 5). Thus, the mean
square error, MSE, between the network output
and the actual values was minimized.
Page 6
Kamal et al., Arch Pharm Sci ASU 4(2): 249-252
254
Fig. 5. Training Plot of the proposed Artificial Neural
Network
The learning rate initialized for the network
was 0.5. The learning coefficient (Lc) masters
the connection weights variation during the
learning phase. Hidden neurons number (HNN)
affected the convoluted performance of the
output error function during the learning process.
Different training functions showed no
significant difference in their performance (i.e.
root mean square error of prediction (RMSEP)
was not affected). M-training algorithm was
chosen.
Iterative propagations were run to optimize
regression of the targeted values versus the real
outputs. As shown, Fig. 6 is an illustrative
regression plot taken for one of these run
propagations.
Fig. 6. Regression Plot of the proposed Artificial Neural
Network
Upon application of an optimized calibration
model, Mean Square Error (MSE) and network
Epochs were correlated. The least MSE recorded
a value of 1.49 x10⁻⁶
as shown in the
“Performance Plot” of the proposed network
(Fig. 7).
3. Results and Discussion
3.1. Method Validation
To validate the predictability of the present
model, ANN was run to estimate the
concentration of three analytes in 45 synthetic
mixtures (validation set) containing different
ratios of drugs within the previously trained
ranges. Validation and training sets are
independent. Satisfactory results have been
obtained for all mixtures. Mean recovery results
and relative standard deviations are shown in
Table 2.
Page 7
Artificial Neural Network Model for Assay of Ternary Cardiovascular Drug Mixture 255
Fig. 7. Performance Plot of the proposed Artificial
Neural Network
3.2. Application
3.2.1. Analysis of Laboratory made mixtures
Laboratory made mixtures were prepared and
analyzed by the proposed ANN method. The
assay results revealed satisfactory accuracy and
precision as indicated from % recovery, SD, and
RSD % (Table 3). This table also represents a
statistical comparison between the assay of
TICA, IRB, and HCT in their synthetic mixtures
by the proposed assisted ANN method and a
developed HPLC method [35], using the
student’s t-test and the variance ratio F-test.
Since the calculated t- and F- values for each
drug did not exceed the theoretical ones [37, 38],
this indicated no significant difference between
the applied methods for determination of the
three drugs in a laboratory made mixtures.
Table 2. Recovery results of ANN validation set; 45 synthetic ternary mixtures of TICA, IRB and HCT
Set No.
Concentration (µg/mL) Recovery (%)
Actual Predicted
TICA IRB HCT TICA IRB HCT TICA IRB HCT
1 5 1 10 5.1 1 10 102 100 100
2 5 2 8 5 2.1 8 100 105 100
3 5 3 6 5.1 3.1 6 102 103.3 100
4 5 1 4 5 1 3.9 100 100 97.5
5 5 2 2 5 1.9 2.1 100 95 105
6 10 1.5 10 10 1.4 10 100 93.3 100
7 10 2.5 8 10 2.5 8 100 100 100
8 10 0 6 9.7 0 6 97 100 100
9 10 1.5 4 10 1.5 3.8 100 100 95
10 10 3 2 10.3 2.9 2 103 96.7 100
11 15 1.5 0 15 1.5 0 100 100 100
12 15 2.5 9 14.9 2.5 8.6 99.3 100 95.6
13 15 0 7 15 0 7 100 100 100
14 15 1.5 5 15 1.5 5 100 100 100
15 15 3 3 14.5 3 3 96.7 100 100
16 20 1.5 1 20.6 1.5 1 103 100 100
17 20 2.5 10 20.1 2.6 9.7 100.5 104 97
18 20 0 8 20 0 7.9 100 100 98.7
19 20 1.5 6 20 1.5 6 100 100 100
20 20 3 4 20.2 3.2 4.1 101 106.7 102.5
21 25 1 3 25.4 1 3 101.6 100 100
22 25 2 1 25.4 1.9 1 101.6 95 100
23 25 3 10 25.3 3 9.8 101.2 100 98
24 25 1 8 25.3 1 8.1 101.2 100 101.2
25 25 2 6 25.2 2.1 6 100.8 105 100
26 30 1 4 30.3 1 4.2 101 100 105
27 30 2 2 30.3 2.1 2.1 101 105 105
Page 8
Kamal et al., Arch Pharm Sci ASU 4(2): 249-252
256
28 30 3 0 30.1 3 0 100.3 100 100
29 30 1 9 30.2 1 9.1 100.7 100 101.1
30 30 2 7 30.3 2 7 101 100 100
31 3 3 5 3 3 4.8 100 100 96
32 3 1 3 3 1 3 100 100 100
33 3 2 1 3 2 1 100 100 100
34 3 3 10 3 3 10.1 100 100 101
35 3 1 8 3 1 8.1 100 100 101.2
36 23 2 6 23.1 2 6.2 100.4 100 103.3
37 23 3 4 23 3 3.8 100 100 95
38 23 1 2 23.2 1 2 100.8 100 100
39 23 2 0 23.1 2 0 100.4 100 100
40 23 2.5 10 23.2 2.4 10.1 100.8 96 101
41 23 0 8 23.3 0 7.9 101.3 100 98.7
42 12 1.5 6 12 1.5 6.1 100 100 101.7
43 12 2.5 4 12.1 2.5 4.1 100.8 100 102.5
44 12 1.5 0 12.1 1.5 0 100.8 100 100
45 12 2.5 5 12.1 2.4 4.7 100.8 96 94
Mean 100.46 100.26 99.91
RSD 1.11 2.51 2.36
ANN; Artificial Neural Network – TICA; Ticagrelor – IRB; Irbesartan – HCT; Hydrochlorothiazide – RSD; Relative Standard Deviation
Table 3. Assay results for TICA, IRB and HCT in their laboratory made mixtures using the proposed ANN
method
Ratio
TICA+IRB+HCT
µg/mL
9:1.5:5
Mean Recovery ± SDa
RSD %b
Er %c
HPLC (230 nm) ANNs
TICA
Mean Recovery ± SDa
RSD %b
Er %c
**t-test
**F-test
98.76 ± 0.45
0.45
-1.01
––
––
99.85 ± 1.13
0.45
-1.01
2.01
6.3
IRB
Mean Recovery ± SDa
RSD %b
Er %c
**t-test
**F-test
98.99 ± 0.87
0.87
-1.01
––
––
100.05 ± 1.53
0.87
-1.01
1.35
3.09
HCT
Mean Recovery ± SDa
RSD %b
Er %c
**t-test
**F-test
99.08 ± 0.61
0.61
-0.92
––
––
98.23 ± 1.21
0.61
-0.92
1.42
3.93
Page 9
Artificial Neural Network Model for Assay of Ternary Cardiovascular Drug Mixture 257
ANN; Artificial Neural Network – TICA; Ticagrelor – IRB; Irbesartan – HCT; Hydrochlorothiazide a Mean ± SD for the five determinations; b% Relative standard deviation; c% Relative error
**Theoretical values of t- and F- at P = 0.05 are 2.13 and 6.93, respectively 3.2.2. Analysis of Spiked Plasma Samples
Absorbance data of ternary mixture (full
scan), in three spiked human plasma samples,
was applied to the ANN calibration model. Each
sample was scanned for three successive times,
satisfactory results were obtained (Table 4).
3.3. Conclusion
As it is known, analysts tend to use linear
calibration systems. On the other hand, non-
linear calibration models are necessary for the
spectral quantitative analysis of complex
pharmaceutical matrices due to small deviations
from linearity, some interactions due to
excipients or interfering components, and the
need for high sensitivity. The proposed method
used a feed-forward back propagation neural
network to predict blood serum concentration
levels of TICA, IRB, and HCT in spiked plasma
samples. The results of the study show that the
neural network has the predictive capability and
able to accurately predict drug concentration
levels in spiked human plasma making it
interchangeable tools for effectively estimating
concentration levels. In addition to accuracy, the
neural network application has the advantage of
producing results empirically, without the need
for developing statistical prediction models.
Table 4. Assay results for TICA, IRB and HCT mixtures in spiked plasma samples using the proposed ANN
method
ANN; Artificial Neural Network – TICA; Ticagrelor – IRB; Irbesartan – HCT; Hydrochlorothiazide a Mean ± SD for the five determinations; b% Relative standard deviation; c% Relative error
List of Abbreviations
ANN, Artificial Neural Network; TICA,
Ticagrelor; IRB, Irbesartan; HCT,
Hydrochlorothiazide; HNN, hidden neurons
number; Lc, Learning coefficient; RMSEP, Root
mean square error of prediction; MSE, Mean
square error.
Declarations
Availability of data and materials
All data generated or analyzed during this
study are included in this published article [and
its supplementary information files].
Competing interests
Concentration
Added
µg/mL
concentration found
µg/mL
Mean Recovery ± SDa
RSD %b
Er %c
TICA IRB HCT TICA IRB HCT TICA IRB HCT
30 3 10 30.30 3.00 10.30
101.00±1.01
1.00
1.00
100.00±0.9
0.90
0.00
103.00±1.00
0.97
3.00
30 2.5 6 30.20 2.45 5.87
100.70±0.85
0.84
0.70
98.00±1.41
1.44
-2.00
97.80±1.21
1.23
-2.20
5 1 2 5.10 1.01 1.99
102.00±0.55
0.54
2.00
101.00±0.31
0.31
1.00
99.50±0.81
0.81
-0.50
Page 10
Kamal et al., Arch Pharm Sci ASU 4(2): 249-252
250
The authors declare that they have no
competing interests.
Funding
All laboratory requirements; instrumentation,
reagents, and solvents were funded by Beirut
Arab University, Lebanon.
Authors' contributions
A.A.G pointed out the idea of the assay, gave
the plan of work, and revised the output data.
M.F.K controlled the mathematical
manifestations, arranged the chemometric steps
(practical and data handling), and wrote the final
manuscript.
M. J. worked out all practical experiments
and prepared for manuscript writing by summing
up tables and figures.
Acknowledgments
This work has been supported by Beirut Arab
University, Lebanon.
4. REFERENCES
1. Kiralj R, Ferriera M. The past, present, and future of
chemometrics worldwide: Some etymological,
linguistic, and bibliometric investigations. J
Chemomet 2006;20:247–272.
https://onlinelibrary.wiley.com/doi/abs/10.1002/ce
m.1001
2. Wrecksin et al. Comparison of Chemometric
Problems in Food Analysis using Non-Linear
Methods. Molecules 2020;25:13, 3025.
https://www.mdpi.com/1420-3049/25/13/3025
3. El Gindy A, Hadad GM. Chemometrics in
Pharmaceutical Analysis: An Introduction,
Review, and Future Perspectives. J AOAC Inter
2012;95:609–623.
https://pubmed.ncbi.nlm.nih.gov/22816252/
4. Miguel de la Guardia SG. Handbook of Green
Analytical Chemistry. 1st ed. New York: Wiley &
sons; 2012. http://download.e-
bookshelf.de/download/0000/5956/47/L-G-
0000595647- 0002363170. pdf
5. Hung Sung K. Decision making in Artificial
Intelligence. J Korean Med Sci 2020; 6:35, 1.
https://jkms.org/DOIx.php?id=10.3346/jkms.2020.
35.e1
6. Sutariya V, Groshev A, Sadana P, Bhatia D, Pathak
Y. Artificial Neural Network in Drug Delivery and
Pharmaceutical Research. The Open
Bioinformatics Journal 2013;7(Suppl-1, M5):49–
62.
https://benthamopen.com/contents/pdf/TOBIOIJ/T
OBIOIJ-7-49.pdf
7. Santos DL. FTIR Spectroscopy as a possible rapid
tool to evaluate abiotic stress effects on pineapple
by-products. Appl Sci 2019; 9: 4141.
https://www.mdpi.com/2076-3417/9/19/4141
8. Maran JP, Sivakumar V, Thirugnanasambandham
K, Sridhar R. ANN and Response Surface
Methodology Modeling in Mass Transfer
Parameters Prediction during Osmotic Dehydration
of Carica Papaya L. Alexandria Engineering
Journal 2013; 52:507–516.
https://www.researchgate.net/deref/http%3A%2F%
2Fdx.doi.org%2F10.1016%2Fj.aej.2013.06.007
9. Darwish HW, Attia MI, Abdelhameed AS, Alanazi
AM, Bakheit AH. Comparative ANNs with
different Input layers and GA-PLS study for
simultaneous spectrofluorimetric determination of
melatonin and pyridoxine in the presence of
melatonin’s impurity. Molecules 2013; 18:974–
996. https://doi.org/10.3390/molecules18010974
10. Tolle KM, Chen H, Chow HH. Estimating
drug/plasma concentration levels by applying
neural networks to pharmacokinetic data sets.
Artificial Intelligence Lab, Department of MIS,
University of Arizona, 2000; 30:139–152.
https://doi.org/10.1016/S0167-9236(00)00094-4
11. Darwish HW. Application of smart
spectrophotometric methods and artificial neural
network for the simultaneous quantitation of
Olmesartan Medoxamil, Amlodipine Besylate, and
Hydrochlorothiazide in their combined
pharmaceutical dosage form. Chemistry Central
Journal 2013; 7:22.
Page 11
Artificial Neural Network Model for Assay of Ternary Cardiovascular Drug Mixture 251
https://dx.doi.org/10.1186%2F1752-153X-7-22
12. Dinc E, Üstundag Ö. Quantitative Analysis of
Hydrochlorothiazide and Losartan Potassium in A
Binary Mixture by Artificial Neural Network.
FABAD J Pharm Sci 2010; 35:133-141.
http://dergi.fabad.org.tr/pdf/volum35/issue3/133-
141.pdf
13. Elkady EF. Simultaneous Spectrophotometric
determination of Diclofenac Potassium and
Methocarbamol in a binary mixture using
chemometric techniques and artificial neural
networks. Drug Testing and Analysis 2011; 3:228–
233.
https://onlinelibrary.wiley.com/doi/pdf/10.1002/dta
.216
14. Neutel MD. A Comparison of the Efficacy and
Safety of Irbesartan/Hydrochlorothiazide
Combination Therapy with Irbesartan
Monotherapy in the Treatment of Moderate or
Severe Hypertension in Diabetic and Obese
Hypertensive Patients: A Post-Hoc Analysis
Review.Postgraduate Medicine 2015;123,4: 126-
134 https://doi.org/10.3810/pgm.2011.07.2312
15. Dabrowski R. Use of antiplatelet and
anticoagulant drugs in hypertension. European
Society of Cardiology 2015; 13: 37.
https://www.escardio.org/Journals/E-Journal-of-
Cardiology-Practice/Volume-13/use-of-
antiplatelet-and-anticoagulant-drugs-in-
hypertension
16.Lacy CF, Armstrong LL, Goldman MP, Lance LL.
Drug Information Handbook. 12th
ed. Lexi-Comp
Inc, 2005.
17. RamakrishnaV.S. and Rambabu C. Visible
Spectrophotometric Methods for the Determination
of Irbesartan in pharmaceutical formulations. Int J
of Pharmacy and Pharmaceutical Sciences
2012;4:86,87.https://www.researchgate.net/publica
tion/289016051
18. Sahoo SK et al. Validated RP-HPLC Method for
Simultaneous Estimation of Irbesartan and
Hydrochlorothiazide in Tablet Dosage Form. Int J
Pharma Res Health Sci 2017; 5 (5): 1419-23
http://www.pharmahealthsciences.net/pdfs/volume
5-issue52017/15.vol5-issue5-2017-MS-15464.pdf
19. Virani Petal. Irbesartan : A Review on Analytical
Method and its Determination in Pharmaceuticals
and Biological Matrix. Inventi Rapid-Pharm
Analysis & Quality Assurance 2014.
http://inventi.in/journal/article/rapid/4/11216/phar
m-analysis-quality-assurance/pi#
20. Patel KR, Patel SA, Darji VC. Simultaneous
Spectrophotometric Estimation of Irbesartan and
Hydrochlorothiazide in tablets. Int Res J Pharm
2011;2: 202–207.
https://irjponline.com/admin/php/uploads/vol-
issue3/35.pdf
21. Raja B, Himasri P, Ramadevi B. RP-HPLC
Method for the Simultaneous Estimation of
Irbesartan and Hydrochlorothiazide in
Pharmaceutical Dosage Form. Int. Res J Pharm
App Sci 2012; 2(3):29–38.
http://www.irjpas.com/File_Folder/Raja%2029-
38.pdf
22. Elshanawane AA, Abdelaziz LM, Kamal MM,
Hafez HM. Quantitative determination of four
angiotensin-II-receptor antagonists in presence of
hydrochlorothiazide by a gradient technique HPLC
in their pharmaceutical preparations. Journal of
Liquid Chromatography & Related Technologies
2013; 37:171–186.
https://doi.org/10.1080/10826076.2012.738620
23. Vujić Z, Mulavdić N, Smajić M, Brborić J,
Stankovic P. Simultaneous analysis of Irbesartan
and Hydrochlorothiazide: An improved HPLC
method with the aid of a chemometric protocol.
Molecules 2012; 17: 3461–3474.
https://doi.org/10.3390/molecules17033461
24. Peeyush J, Bhardwaj YR, Kishore D. A Liquid
Chromatography-Tandem Mass Spectrometry
based method for the Simultaneous Determination
of Irbesartan and Hydrochlorothiazide in Human
Plasma. Int J Drug dev and Res 2013;5:169–173.
https://www.ijddr.in/
25. Hammouda MEA., El-enin MAA., El-sherbiny
DT., El-was saw DR, El-ashy SM. Simultaneous
Determination of Irbesartan and
Hydrochlorothiazide in Pharmaceutical
Page 12
Kamal et al., Arch Pharm Sci ASU 4(2): 249-252
252
Preparations and Spiked Human Plasma Using
Microemulsion Liquid. Inter j of adv in pharm res
2013;4:1944–1959.
26. Swamy GK, Kumar J, Rao JV. A validated
reverse phase HPLC method for the simultaneous
estimation of Irbesartan and Amlodipine in the
pharmaceutical dosage form. World Journal of
Pharmacy and Pharmaceutical Sciences
2014;3:996–1007.
27. Virani P, Sojitra R, Raj H, Jain V.
Chromatographic method for Irbesartan and its
combination with another drug. Journal of Critical
Reviews 2015; 2:4–8.
28. Hapse SA, Wagh VS, Kadaskar PT, Dokhe MD,
Shirsath AS. Spectrophotometric estimation and
validation of hydrochlorothiazide in tablet dosage
forms by using different solvents. Pharma Chemica
2012;4:10–14.
http://derpharmachemica.com/archive.html
29. Bhagwate S, Gaikwad NJ. Stability indicating
HPLC method for the determination of
|Hydrochlorothiazide in the pharmaceutical dosage
form. J of Applied Pharmaceutical Science
2013;3:88–92. DOI: 10.7324/JAPS.2013.30215
30. Bhatia R, Katoch S, Kumar D. Review Article
Determination of hydrochlorothiazide and drugs in
its combination by HPLC. Journal of Chemical and
Pharmaceutical Research 2015;7:184–190.
https://www.jocpr.com/abstract/determination-of-
hydrochlorothiazide-and-drugs-in-its-combination-
by-hplc-5948.html
31. Sivasubramanian L, Ks L. Spectrophotometric
Multicomponent Analysis of Telmisartan,
Hydrochlorothiazide, and Ramipril in
Pharmaceutical Formulations By Chemometric
Techniques. World Journal of Pharmacy and
Pharmaceutical Sciences 2015; 4:536–550.
https://www.researchgate.net/publication/2733175
81_
32. Pandya D, Patel M, Ghediya R, Shah A, Khunt R.
UV-Vis Spectrophotometric Assay determination
of oral antiplatelet Ticagrelor drug in the
pharmaceutical formulation : Application to
content uniformity. J of Chem and Pharm Res
2016; 8:316–321.
https://www.researchgate.net/publication/3035504
30
33. Sillen H, Cook MDP. Determination of Ticagrelor
and two metabolites in plasma samples by liquid
chromatography and mass spectrometry. J
Chromatogr B Analyt Technol Biomed Life Sci
2010;878:2299–2306.
https://doi.org/10.1016/j.jchromb.2010.06.018
34. Sillen H, Cook M, Davis P. Determination of
unbound Ticagrelor and its active metabolite (AR-
C124910XX) in human plasma by equilibrium
dialysis and LC-MS/MS. J Chromatogr B
2011;879:2315–2322.
https://doi.org/10.1016/j.jchromb.2011.06.023
35. El Jamal MK, Gazy AA. Analysis of Three
Cardiovascular Drugs in Their Ternary Mixture
Using Green Analytical Methodology of Smart
Spectrophotometric Methods And RP-HPLC
Method. Int J of Pharmacy and Pharm Sci
2016;8:8, 243-50.
https://innovareacademics.in/journals/index.php/ijp
ps/article/view/12390.
36. El Jamal MK, Gazy AA. Selective H-point
Standard Addition and Double Divisor Ratio
Derivative Chemometric Methods For
Determination Of Ternary Mixture Of
Cardiovascular Drugs. BAU Journal - Health and
Wellbeing 2019;2: 1,9.
https://digitalcommons.bau.edu.lb/hwbjournal/vol2/iss
1/9
37. ICH Harmonized Tripartite guideline, Validation
of Analytical Procedures text and Methodology Q2
(R1) Current Step 4 version, Parent guideline dated
27 November (Complementary guideline on
Methodology dated 6 November 1996 incorporated
on November 20 Geneva.
38. Miller JN, Miller JC. Statistics and Chemometrics
for Analytical Chemistry. 5th Aufl., London,
Pearson Prentice Hall, 2005.