NREL is a national laboratory of the U.S. Department of Energy Office of Energy Efficiency & Renewable Energy Operated by the Alliance for Sustainable Energy, LLC This report is available at no cost from the National Renewable Energy Laboratory (NREL) at www.nrel.gov/publications. Contract No. DE-AC36-08GO28308 Inverter Ground Fault Overvoltage Testing Andy Hoke, Austin Nelson, and Sudipta Chakraborty National Renewable Energy Laboratory Justin Chebahtah, Trudie Wang, and Michael McCarty SolarCity Corporation Technical Report NREL/TP-5D00-64173 August 2015
Transcript
NREL is a national laboratory of the U.S. Department of Energy Office of Energy Efficiency & Renewable Energy Operated by the Alliance for Sustainable Energy, LLC
This report is available at no cost from the National Renewable Energy Laboratory (NREL) at www.nrel.gov/publications.
Contract No. DE-AC36-08GO28308
Inverter Ground Fault Overvoltage Testing Andy Hoke, Austin Nelson, and Sudipta Chakraborty National Renewable Energy Laboratory
Justin Chebahtah, Trudie Wang, and Michael McCarty SolarCity Corporation
Technical Report NREL/TP-5D00-64173 August 2015
NREL is a national laboratory of the U.S. Department of Energy Office of Energy Efficiency & Renewable Energy Operated by the Alliance for Sustainable Energy, LLC
This report is available at no cost from the National Renewable Energy Laboratory (NREL) at www.nrel.gov/publications.
Contract No. DE-AC36-08GO28308
National Renewable Energy Laboratory 15013 Denver West Parkway Golden, CO 80401 303-275- www.nrel.gov
Inverter Ground Fault Overvoltage Testing Andy Hoke, Austin Nelson, and Sudipta Chakraborty National Renewable Energy Laboratory
Justin Chebahtah, Trudie Wang, and Michael McCarty SolarCity Corporation
Prepared under Task No. ST13.IN11
Technical Report NREL/TP-5D00-64173 August 2015
NOTICE
This report was prepared as an account of work sponsored by an agency of the United States government. Neither the United States government nor any agency thereof, nor any of their employees, makes any warranty, express or implied, or assumes any legal liability or responsibility for the accuracy, completeness, or usefulness of any information, apparatus, product, or process disclosed, or represents that its use would not infringe privately owned rights. Reference herein to any specific commercial product, process, or service by trade name, trademark, manufacturer, or otherwise does not necessarily constitute or imply its endorsement, recommendation, or favoring by the United States government or any agency thereof. The views and opinions of authors expressed herein do not necessarily state or reflect those of the United States government or any agency thereof.
This report is available at no cost from the National Renewable Energy Laboratory (NREL) at www.nrel.gov/publications.
Available electronically at SciTech Connect http:/www.osti.gov/scitech
Available for a processing fee to U.S. Department of Energy and its contractors, in paper, from:
U.S. Department of Energy Office of Scientific and Technical Information P.O. Box 62 Oak Ridge, TN 37831-0062 OSTI http://www.osti.gov Phone: 865.576.8401 Fax: 865.576.5728 Email: [email protected]
Available for sale to the public, in paper, from:
U.S. Department of Commerce National Technical Information Service 5301 Shawnee Road Alexandria, VA 22312 NTIS http://www.ntis.gov Phone: 800.553.6847 or 703.605.6000 Fax: 703.605.6900 Email: [email protected]
Cover Photos by Dennis Schroeder: (left to right) NREL 26173, NREL 18302, NREL 19758, NREL 29642, NREL 19795.
NREL prints on paper that contains recycled content.
Acknowledgments The National Renewable Energy Laboratory (NREL) thanks SolarCity and the U.S. Department of Energy (DOE) Solar Energy Technologies Office for cost-share funding of this work.
Additionally, the authors would like to thank Frances Bell, Krutak Kamdar, Brian Zimmerly, and Ryan Hanley from SolarCity; Colton Ching, Anthony Hong, Demy Bucaneg, Marc Asano, Reid Ueda, Shaun Imada, Kandice Kubojiri, Steven Rymsha, Melanie Higa, and Riley Ceria from the Hawaiian Electric Companies; Ben York and Aminul Huque from the Electric Power Research Institute; Phil Barker of Nova Energy Specialists; and Mariko Shirazi and Adam Bailey of NREL for their valuable input and support. We also thank the members of the Forum on Inverter Grid Integration Issues (FIGII, formerly known as the Industry Task Force on Effective Grounding, ITFEG), led by Brian Lydic of Fronius USA, for providing the test plan that served as the basis for the test procedure used in this study. Finally, we are greatly indebted to Michael Ropp of Northern Plains Power Technologies for his background work, valuable technical input, and detailed review of report drafts.
This report is available at no cost from the National Renewable Energy Laboratory (NREL) at www.nrel.gov/publications.
ii
Executive Summary Various interconnection challenges exist when connecting distributed PV into the electrical distribution grid in terms of safety, reliability, and stability of electric power systems. One of the urgent areas for additional research - as identified by inverter manufacturers, installers, and utilities – is the potential for transient overvoltage from PV inverters. In one stage of a cooperative research and development agreement, NREL is working with SolarCity to address two specific types of transient overvoltage: load rejection overvoltage (LRO) and ground fault overvoltage (GFO). Additional partners in this effort include the Hawaiian Electric Companies, Northern Plains Power Technologies, and the Electric Power Research Institute. This report describes testing conducted at NREL to determine the duration and magnitude of transient overvoltages created by several commercial PV inverters during ground fault conditions. For this work, a test plan developed by the Forum on Inverter Grid Integration Issues (FIGII) has been implemented in a custom test setup at NREL. Load rejection overvoltage test results were reported previously in a separate technical report. The GFO tests were completed on three commercial inverters: a single-stage, three-phase string inverter; a dual-stage, three-phase string inverter, and a three-phase assembly of single-phase microinverters. All inverters tested had transformerless topologies. The dual-stage, three-phase string inverter was also tested with two different transformers connected at its output: a wye-grounded:wye-grounded transformer and a delta:wye-grounded transformer. Each inverter was tested at unity power factor and at minimum leading and lagging power factors. Results confirm previous theoretical analyses asserting that inverters do not drive ground-fault overvoltages in the same way that synchronous machines do, although they can do so to a limited extent in certain scenarios1. The total voltage duration and the maximum continuous time above various line-neutral voltage thresholds are presented here, as well as other test parameters. We also present brief investigations into the effects of changing inverter overvoltage and overfrequency trip settings, the effect of anti-islanding controls, and the effect of delta- and wye-connected loads. Finally, we quantify line-line overvoltage magnitudes and durations as well, showing that three-phase inverters can cause low levels of line-neutral overvoltage due to power rejection from the faulted phase to the unfaulted phases.
It is very important to note that the GFO test method used here is designed to scientifically investigate inverter-driven GFO, and is not designed to exactly emulate ground-fault conditions on a real distribution feeder. Therefore the test procedure and test results are not intended for certification testing. Also note that these tests do not attempt to investigate the wide range of possible load conditions and circuit configurations that may be present on a feeder during a ground fault. Instead, the intent is to create conditions that isolate the inverter ground fault response from other effects.
1 Inverters can drive overvoltages via other mechanisms, such as power rejection to unfaulted phases (explained below in this report) and load rejection overvoltage (see http://www.nrel.gov/docs/fy15osti/63510.pdf).
This report is available at no cost from the National Renewable Energy Laboratory (NREL) at www.nrel.gov/publications.
Contents Acknowledgments ................................................................................................................................... i Executive Summary ............................................................................................................................... ii Contents ................................................................................................................................................. iii Tables .................................................................................................................................................... vi
1 Introduction ........................................................................................................................................... 1 2 Test Procedures.................................................................................................................................... 3
2.1 GFO Test Procedure ........................................................................................................................ 4 2.2 GFO Data Reporting ........................................................................................................................ 7 2.3 Test Inverters and Test Equipment Description ............................................................................... 8
3 Test Results ........................................................................................................................................ 11 3.1 RLC Load Tuning .......................................................................................................................... 11 3.2 Total Time Above Voltage Thresholds .......................................................................................... 13 3.3 Maximum Continuous Time Above Voltage Thresholds .............................................................. 17 3.4 Maximum Instantaneous Overvoltage ........................................................................................... 19 3.5 Trip Time / Time to Disconnect ..................................................................................................... 22 3.6 Waveforms of Interest.................................................................................................................... 24 3.7 Effect of Voltage and Frequency Trip Settings ............................................................................. 39 3.8 Comparison of GFO Test Versions: AI Enabled vs. AI Disabled ................................................. 42 3.9 Tests with Transformers ................................................................................................................ 45 3.10 Tests with Delta-connected Load ............................................................................................ 59 3.11 Line to Line Voltage Analysis ................................................................................................. 66
4 Conclusions and Future Work .......................................................................................................... 74 References ............................................................................................................................................ 76
This report is available at no cost from the National Renewable Energy Laboratory (NREL) at www.nrel.gov/publications.
iv
Figures Figure 1: Generalized schematic of GFO test setup ...................................................................................................... 4 Figure 2: Generalized schematic of GFO test setup with transformer ........................................................................... 5 Figure 3: Example waveform depicting how test result data is defined ........................................................................ 8 Figure 4: Example plot of overvoltage duration as a function of voltage threshold level and power factor for a single
test inverter ........................................................................................................................................................... 14 Figure 5: Cumulative overvoltage durations for Inverter 1 ......................................................................................... 15 Figure 6: Cumulative overvoltage durations for Inverter 2 ......................................................................................... 16 Figure 7: Cumulative overvoltage durations for Inverter 3. Note vertical range extends to only 0.25 ms. ................ 16 Figure 8: Maximum continuous overvoltage durations for Inverter 1 ......................................................................... 18 Figure 9: Maximum continuous overvoltage duration times for Inverter 2 ................................................................. 18 Figure 10: Maximum continuous overvoltage duration times for Inverter 3 ............................................................... 19 Figure 11: Maximum instantaneous overvoltage vs. power factor for Inverter 1 ........................................................ 20 Figure 12: Maximum instantaneous overvoltage vs. power factor for Inverter 2 ........................................................ 21 Figure 13: Maximum instantaneous overvoltage vs. power factor for Inverter 3 ........................................................ 21 Figure 14: Trip time as a function of power factor for Inverter 1 ................................................................................ 23 Figure 15: Trip time as a function of power factor for Inverter 2 ................................................................................ 23 Figure 16: Trip time as a function of power factor for Inverter 3 ................................................................................ 24 Figure 17: Inverter 1 waveform at unity power factor (test SC0005) .......................................................................... 25 Figure 18: Symmetrical components of Inverter 1 voltage waveforms at unity power factor (test SC0005) .............. 26 Figure 19: A close-up of the waveforms in Figure 17 at the time of the fault ............................................................. 27 Figure 20: Inverter 1 test with longest cumulative overvoltage (SAO0003) ............................................................... 28 Figure 21: Symmetrical components of the voltage for Inverter 1 test with longest cumulative overvoltage
(SAO0003) ........................................................................................................................................................... 29 Figure 22: One of the mildest overvoltages produced by Inverter 1 (SBU0005) ........................................................ 29 Figure 23: Typical line to line voltages of Inverter 1 (SCO0005) ............................................................................... 30 Figure 24: Inverter 2 baseline islanding test (EI_0007) ............................................................................................... 30 Figure 25: Close-up of island transient in Inverter 2 baseline islanding test (EI_0007) .............................................. 31 Figure 26: Inverter 2 waveforms showing fast output shutdown (EB_0003) .............................................................. 32 Figure 27: Inverter 2 waveforms showing longer run-on (EC+_0003) ....................................................................... 32 Figure 28: Symmetrical voltage components for Inverter 2 test with longer run-on (EC+_0003) .............................. 33 Figure 29: Inverter 2 waveforms showing the longest overvoltage at the 110% level (EC+_0001) ........................... 33 Figure 30: Symmetrical components of Inverter 2 voltages for the test with longest overvoltage at the 110% level
(EC+_0001) .......................................................................................................................................................... 34 Figure 31: Inverter 2 waveforms with the maximum instantaneous overvoltage (EB_0005) ..................................... 34 Figure 32: Inverter 2 line to line voltages during a typical test (EC+_0003)............................................................... 35 Figure 33: Inverter 2 line to line waveforms for the test with the longest cumulative overvoltage (EC+_0001) ........ 35 Figure 34: Inverter 3 baseline islanding test (NILD0000) ........................................................................................... 36 Figure 35: Close-up of island transient in Inverter 3 baseline islanding test (NILD0000) .......................................... 36 Figure 36: Typical Inverter 3 waveform (NC_0003) ................................................................................................... 37 Figure 37: A variation of the typical Inverter 3 waveform (NB_0002) ....................................................................... 38 Figure 38: Inverter 3 worst-case peak overvoltage (NA_0006) ................................................................................... 38 Figure 39: Inverter 3 showing no overvoltage at all (NC_0004) ................................................................................. 39 Figure 40: Inverter 3 line to line voltages during a typical test (NC_0003) ................................................................ 39 Figure 41: Examining the dependence of GFO response on voltage and frequency trip settings for Inverter 1 ......... 41 Figure 42: Examining the dependence of peak overvoltage on trip settings for Inverter 1 ......................................... 41 Figure 43: Examining the dependence of ground-fault disconnection time on trip settings for Inverter 1 .................. 42 Figure 44: Baseline anti-islanding test for Inverter 1 (SA1A0001) ............................................................................. 43 Figure 45: Anti-islanding test with AI controls disabled for Inverter 1 (ILND0000) .................................................. 43 Figure 46: Comparison of GFO test results for Inverter 1 using test Version 1 (Islanded) and Version 2
(Immediate). ......................................................................................................................................................... 44 Figure 47: Comparison of GFO test maximum overvoltage and trip time for Inverter 1 using test Version 1
(Islanded) and Version 2 (Immediate). ................................................................................................................. 44 Figure 48: GFO test of Inverter 1 using test Version 2 (AI enabled) (SA1A0003). .................................................... 45 Figure 49: Cumulative overvoltage durations for tests with and without transformers ............................................... 47
This report is available at no cost from the National Renewable Energy Laboratory (NREL) at www.nrel.gov/publications.
v
Figure 50: Continuous overvoltage durations for tests with and without transformers ............................................... 48 Figure 51: Peak overvoltages for tests with and without transformers ........................................................................ 48 Figure 52: Trip times for tests with and without transformers..................................................................................... 49 Figure 53: Typical unity power factor test with Y:Y transformer (SA_Y0002) .......................................................... 50 Figure 54: Symmetrical components of a typical unity power factor test with Y:Y transformer (SA_Y0002)........... 51 Figure 55: Typical lagging power factor test with D:Y transformer (SAOD0000) ..................................................... 52 Figure 55: Symmetrical voltage components for a typical lagging power factor test with D:Y transformer
(SAOD0000) ........................................................................................................................................................ 53 Figure 56: Typical leading power factor test with D:Y transformer (SBUD0001)...................................................... 54 Figure 57: Typical leading power factor test with D:Y transformer, zoomed in (SBUD0001) ................................... 55 Figure 58: Comparison of overvoltage durations with AI disabled and enabled, with D:Y transformer .................... 56 Figure 59: Comparison of peak overvoltages and trip times with AI disabled and enabled, with D:Y transformer ... 56 Figure 60: Typical unity power factor test with D:Y transformer and AI enabled (AY1D0011) ................................ 57 Figure 61: A less common response type for unity power factor tests with D:Y transformer and AI enabled
(AY1D0008) ......................................................................................................................................................... 58 Figure 62: A typical lagging power factor test with D:Y transformer and AI enabled (ADOD0006) ......................... 59 Figure 63: A typical test with D:Y transformer and delta load, with AI disabled (S_DD0001) .................................. 62 Figure 64: A typical test with D:Y transformer and delta load, with AI disabled (S_DD0001) .................................. 63 Figure 63: Symmetrical components during a typical test with D:Y transformer and delta load, with AI disabled
(S_DD0001) ......................................................................................................................................................... 64 Figure 65: A typical test with no transformer and delta load, with AI disabled (S1U_0003) ...................................... 65 Figure 66: Line to line overvoltages for Inverter 1, with and without voltage and frequency ride-through ................ 67 Figure 67: Line-line voltages in a typical test with no transformer (SCO0005). ......................................................... 68 Figure 68: Line-line voltages showing slightly increasing voltage and current magnitudes (SCO0003) .................... 69 Figure 69: Line to line overvoltages for Inverter 2 ...................................................................................................... 70 Figure 70: Line-line voltages for a typical test of Inverter 2 (EC_0005). Note that currents and voltages remain
near-nominal, in contrast to those of Inverter 1. Also note that DC current falls and acquires a strong 120 Hz component after the fault because one of the phases (phase C) is no longer exporting power. ............................ 70
Figure 71: Peak line-line voltages for Inverter 3 ......................................................................................................... 71 Figure 72: Cumulative line to line overvoltage times for tests with transformers. Tests with delta-wye transformers
are shown both with AI disabled and AI enabled, to emphasize that worst-case overvoltages are mitigated by having AI on. ........................................................................................................................................................ 72
Figure 73: Peak line to line overvoltages for tests with transformers .......................................................................... 72 Figure 74: Current and line to line voltage waveforms for a test with delta-wye transformer and AI disabled
(SD1D0004). Note the increase in current magnitudes at the inverter output due to power rejection to the unfaulted phases. .................................................................................................................................................. 73
This report is available at no cost from the National Renewable Energy Laboratory (NREL) at www.nrel.gov/publications.
vi
Tables Table 1: GFO Test Versions .......................................................................................................................................... 3 Table 2. Overvoltage threshold levels ........................................................................................................................... 7 Table 3: Basic test inverter specifications ..................................................................................................................... 9 Table 4: Transformer configurations for additional tests ............................................................................................... 9 Table 5: Inverter 1 Load Settings – Unity Power Factor ............................................................................................. 12 Table 6: Inverter 1 Load Settings – Leading Power Factor ......................................................................................... 12 Table 7: Inverter 1 Load Settings – Lagging Power Factor ......................................................................................... 12 Table 8: Inverter 2 Load Settings – Unity Power Factor ............................................................................................. 12 Table 9: Inverter 2 Load Settings – Leading Power Factor ......................................................................................... 13 Table 10: Inverter 2 Load Settings – Lagging Power Factor ....................................................................................... 13 Table 11: Inverter 3 Load Settings – Unity Power Factor ........................................................................................... 13 Table 12: Maximum total time above each voltage threshold (ms) ............................................................................. 14 Table 13: Average total time above each voltage threshold (ms) ................................................................................ 15 Table 14: Maximum continuous time above each voltage threshold (ms) .................................................................. 17 Table 15: Average of maximum continuous times above each voltage threshold (ms) ............................................... 17 Table 16: Maxima of maximum instantaneous voltage measurements (% of nominal peak)...................................... 19 Table 17: Average of maximum instantaneous voltage measurements (% of nominal peak) ..................................... 20 Table 18: Maximum time to disconnect for all inverters (ms)..................................................................................... 22 Table 19: Average time to disconnect for all inverters (ms) ........................................................................................ 22 Table 20: Inverter 1 default voltage and frequency trip settings (IEEE 1547-2003) ................................................... 40 Table 21: Inverter 1 widened voltage and frequency trip settings ............................................................................... 40 Table 22: Maximum total time (ms) above each voltage threshold – transformers ..................................................... 46 Table 23: Average total time (ms) above each voltage threshold – transformers ........................................................ 46 Table 24: Maximum continuous time (ms) above each voltage threshold with and without transformers.................. 47 Table 25: Average continuous time (ms) above each voltage threshold with and without transformers ..................... 47 Table 26: Maximum total time (ms) above each voltage threshold with D:Y transformer – AI off and AI on ........... 55 Table 27: Average maximum total time (ms) above each voltage threshold with D:Y transformer – AI off and
AI on ..................................................................................................................................................................... 56 Table 28: Maximum total time (ms) above each voltage threshold with delta load, with AI disabled ........................ 60 Table 29: Average total time (ms) above each voltage threshold with delta load, with AI disabled ........................... 60 Table 30: Maximum continuous time (ms) above each voltage threshold with delta load, with AI disabled ............. 61 Table 31: Average maximum continuous time (ms) above each voltage threshold with delta load, with AI disabled 61 Table 32: Maximum total time (ms) above each voltage threshold with D:Y transformer and delta load – AI off and
AI on ..................................................................................................................................................................... 65 Table 33: Average total time (ms) above each voltage threshold with D:Y transformer and delta load – AI off and
AI on ..................................................................................................................................................................... 66
This report is available at no cost from the National Renewable Energy Laboratory (NREL) at www.nrel.gov/publications.
1
1 Introduction The proliferation of inverter-coupled technologies such as solar photovoltaics (PV) on electric distribution systems has resulted in new opportunities to optimize distribution power systems and has created new challenges to prevent unstable or damaging conditions. This project addresses an urgent utility concern: the potential for transient or temporary overvoltage (TOV) from inverter-based generation such as solar PV. Transient or temporary overvoltage is of concern because of the potential to cause damage to nearby equipment and loads [1], [2]. There are two types of TOV that are of primary concern for inverter-coupled generation: load rejection overvoltage (LRO) and ground fault overvoltage (GFO) [3]. This report focuses on experimental testing of GFO. LRO testing was covered separately in previous publications [4], [5]. GFO can occur on a three-phase distribution system following a single line to ground fault: voltage-source generation may enforce line-to-line voltage relationships resulting in an overvoltage with respect to neutral on the un-faulted phases. Some previous work has been interpreted (or misinterpreted) to recommended uniform GFO mitigation measures for all distributed energy resources, both machine-based and inverter-based [1]. However, other authors have indicated that while GFO is a concern with synchronous machine generation and can be mitigated through effective grounding2, the same is not necessarily true for inverter-based generation [3]. GFO can be a concern for inverter sources in some cases, but it is generally more easily mitigated and is less of a problem than GFO of synchronous rotating machines. Inverters, which are best modeled as current sources from the grid’s perspective, do not enforce the line-to-line voltage relationship at their output terminals and hence should not cause GFO in the same way as synchronous machines. Moreover, in the scenarios where inverters could contribute to GFO, effective grounding – as defined in IEEE 142 [7] – is not expected to solve the problem [3]. This result has been confirmed through simulation but has not been previously verified experimentally. The testing described herein is intended to fill that gap by experimentally evaluating in what scenarios PV inverters cause GFO, and to what extent. As such, the test plan used is designed to isolate the response of the PV inverter to a ground fault, and not to exactly simulate the wide range of ground fault conditions possible on real distribution feeders. The test result analysis focuses primarily on line to neutral voltages, which are of concern in classic GFO response, but also delves briefly into line to line voltage responses. Symmetrical components are plotted for selected tests to provide insight into the effect that removal of zero sequence components through effective grounding would have on ground fault responses.
2 Definitions of effective grounding vary. See the IEEE C62.92 series, for example [6]. According to some definitions, a system is considered effectively grounded if a ground fault does not produce overvoltages above a certain level; in some cases inverters may inherently fulfil this definition. In practice, effective grounding requirements may be fulfilled by installing grounding transformers, a practice that is sometimes very useful and sometimes not. Detailed definitions of effective grounding and recommendations for effective grounding solutions are beyond the scope of this report.
This report is available at no cost from the National Renewable Energy Laboratory (NREL) at www.nrel.gov/publications.
2
This report describes GFO testing of a selection of common PV inverters in accordance with a newly-developed test plan. An industry group known as the Forum on Inverter Grid Integration Issues (FIGII), which consists of members from inverter manufacturers, utilities, consultants, and research labs, developed the test plan through a consensus-based process. A total of three inverters were tested, and one of the inverters was also tested with wye-grounded:wye-grounded (Y:Y) and delta:wye-grounded (D:Y) transformers connected between the test inverter and the ground fault location. While the largest inverter tested here is rated at 20 kW, the physical effects tested are not functions of inverter size, so conclusions drawn from testing are representative of all current-controlled inverters (a category that includes the vast majority of grid-tied PV inverters). The testing described here serves to provide feedback to stakeholders and is being used to provide input to inverter model development. An upcoming publication will further analyze the theory behind inverter ground fault responses and expand on the results presented here [8]. It is worth briefly reviewing what happens in a typical field scenario following a single line-to-ground fault. Distribution circuits and faults vary widely, but some elements are common to most single line to ground faults. When a single line to ground fault occurs, the fault often causes an upstream breaker or recloser to open, isolating the faulted part of the circuit from the rest of the grid. If there is distributed generation in the isolated (islanded) section, the generation will briefly power any load within the island until the generator’s controller recognizes the island and ceases power exportation. This can result in TOV via two mechanisms, mentioned above. The mechanism of primary concern to this report is GFO, in which a three-wire generator can cause a zero-sequence voltage to appear when feeding a four-wire circuit during a single phase to ground fault. The second TOV mechanism, LRO, occurs if the generation to load ratio within the island is greater than unity. Both of these mechanisms can occur together following a single line to ground fault if an island forms with more generation than load. LRO can also occur on its own when an island forms in the absence of a single line to ground fault, as quantified in [4], [5]. This report describes experiments designed to characterize inverter GFO response in isolation from LRO and other transient effects, to the extent possible.
This report is available at no cost from the National Renewable Energy Laboratory (NREL) at www.nrel.gov/publications.
3
2 Test Procedures The test procedure used to evaluate the behavior of inverters in ground fault scenarios is based on a GFO test plan written by the FIGII working group. This test plan was designed to allow the inverter’s ground fault response to be observed for as long as possible, and in isolation from the islanding event. The specific test procedures used at NREL, which include one test version that adheres very closely to the FIGII procedure and another modified test version, are described below. Both test versions use a resonant load to allow the inverter-load circuit to be as stable as possible when the ground fault is created with the grid simulator disconnected. Briefly, the GFO test consists of four steps:
1. Connect the test inverter to the test setup as shown in Figure 1.
2. Tune the resistive-inductive-capacitive (RLC) load so that the current from the grid simulator (also known as the Simulated Area EPS (electric power system) [9]) is nearly zero and so that the load resonates at 60 Hz with a qualify factor (QF) of roughly unity.
3. Remove the grid simulator from the circuit, creating an island. Steps 1 through 3 are very similar to the IEEE 1547.1 test for unintentional islanding [10].
4. Create the ground fault and record voltage waveforms.
These four steps are broken down into a detailed test procedure in the next subsection.
Ideally the test is performed with the inverter’s anti-islanding (AI) controls disabled. This allows a stable inverter-load island to form following step 3 before the ground fault is created, which in turn allows the ground fault behavior to persist (within the constraints of inverter protection settings) and to be observed in the absence of other dynamics.
One test inverter was not able to disable AI, and another uses a type of controller that cannot readily form a stable island (i.e. the AI method is integral to the controls). When testing these two inverters, the fault was formed immediately after the grid simulator was removed (within half of a 60 Hz line cycle) using an automatic relay circuit.
Hence there are two versions of the GFO test, as shown in Table 1. Version 1, with AI disabled, is the preferred version, as written by FIGII.
Table 1: GFO Test Versions
GFO Test Version
Priority AI control status
Time between island creation and fault
Comments
Version 1 Primary Disabled Requires ability to form stable island. No separate baseline test needed.
Version 2 Backup Active 3-5 milliseconds May be difficult to separate island transient from ground-fault behavior.
Requires AI testing as baseline.
This report is available at no cost from the National Renewable Energy Laboratory (NREL) at www.nrel.gov/publications.
4
Recall that the intent of these tests is not to replicate the range of load and circuit conditions that are found in the field, but rather to observe the inverter’s ground fault behavior with minimal interference from other phenomena. Cases where the generation to load ratio varies from unity are not tested here because it would not be possible to form a stable island, and thus it would be difficult to clearly see the effect in the tests. In cases where the generation to load ratio is greater than one when a ground fault occurs, the inverter behavior would be a combination of its ground fault response and the LRO response, as characterized in [4], [5]. As in [4] and [5], the duration of this combined response would likely be short, especially in cases of higher generation to load ratio.
The detailed test procedure is described below. Much of the language is taken directly from the FIGII test procedure document, which in turn borrowed some language from IEEE Std 1547.1.
2.1 GFO Test Procedure For these tests, any active voltage regulation features available in the equipment under test (EUT, i.e. the inverter) were disabled. Also, if any of the inverters tested as part of this work had required an external or separate transformer, the transformer would have been connected between the EUT and the load specified in Figure 1 and would have been considered part of the product being tested. None of the inverters tested required external transformers, although where indicated some tests were performed with transformers connected between the EUT and the rest of the circuit to determine the impact of the transformer configuration on GFO.
Figure 1: Generalized schematic of GFO test setup
The test circuit was configured as shown in Figure 1. The neutral connection (grounded conductor) was unaffected by the operation of switch S1. The balanced load circuit shown in the figure was applied from each phase to neutral (wye configuration) unless otherwise indicated. Switch S1 was gang-operated and multi-pole. Switch S2 was applied between one phase and ground. Inverters 1 and 3 are believed to have no low-impedance power connection to neutral. Inverter 2, however, is believed to have a power connection to neutral.
This report is available at no cost from the National Renewable Energy Laboratory (NREL) at www.nrel.gov/publications.
5
The test setup for tests with transformers is shown in Figure 2; it differs from Figure 1 only in the insertion of a three-phase transformer between the EUT and S2. All line to neutral voltages on both sides of the transformer were measured. For delta-wye transformer tests, the delta side faced the fault location (S2). All transformer neutral connections were grounded.
Figure 2: Generalized schematic of GFO test setup with transformer
Each EUT was connected according to the instructions and specifications provided by the manufacturer. All EUT input source parameters were set to the nominal operating conditions for the EUT. All EUT settings were set to default values unless otherwise indicated, with two exceptions: 1) AI controls were disabled if running test Version 1, and 2) the 300-second countdown timer to begin power export was disabled in order to shorten the time between tests.
The test sequence for test Version 1 was as follows, with modifications for Version 2 shown in blue:
a) Connect the EUT according to the instructions and specifications provided by the manufacturer.
b) Set all EUT input source parameters to the nominal operating conditions for the EUT. c) Set (or verify) all EUT parameters to the nominal operating settings. Island detection
functions were disabled for this test, if possible. (If running Version 2, leave island detection functions enabled.)
d) Set the EUT (including the input source as necessary) to provide 100% of its rated output power.
e) Record all applicable settings. f) Set the simulated EPS to the EUT nominal voltage ± 2% and nominal frequency ± 0.1
Hz. g) Adjust the islanding load circuit in Figure 1 to provide a quality factor Qf of at least 1.0
(when Qf is equal to 1.0, the following applies: PqL = PqC = 1.0 × P). The value of Qf is to be determined by using the following equations as appropriate:
EUTSimulated Area EPS
S1
RLC Load S2
Transformer
This report is available at no cost from the National Renewable Energy Laboratory (NREL) at www.nrel.gov/publications.
6
=
or
= ×
where
Qf is the quality factor of the parallel RLC resonant load, R is the effective load resistance ( C is effective load capacitance (F), L is effective load inductance (H), PqL is the reactive power per phase consumed by the inductive load component (VARS), PqC is the reactive power per phase consumed by the capacitive load component (VARS), P is the real output power per phase of the unit (W),
The inductance and capacitance are to be calculated using the following equations:
=2 × × × ×
= ×
2 × × ×
where V is the nominal voltage across each phase of the RLC load (V) (for loads connected phase to phase, V is the nominal line-line voltage; for loads connected phase to neutral, V is the nominal phase-neutral voltage), f is frequency (Hz).
When tuning for the current balance in this step with a non-unity output power factor EUT, there will be an imbalance between the L and C load components to account for the EUT reactive current. The EUT reactive output current shall be measured and algebraically added to the appropriate reactive load component when calculating Qf.
h) Close switch S1 and wait until the EUT produces the desired power level. i) Adjust R, L, and C until the fundamental frequency current through switch S1 is less than
2% of the rated current of the EUT on a steady-state basis in each phase. j) Open switch S1 and allow a stable island to form with voltage within 10% of nominal
and frequency within 0.5% of nominal. If running Version 2 (anti-islanding enabled), do not wait for a stable island to form.
k) Begin recording the voltage measurement. l) Close switch S2 and record the voltage until the EUT ceases to energize the RLC load or
until voltage has stabilized. If running Version 2, close switch S2 immediately after opening switch S1 to maximize the island duration.
m) Repeat the test four times for a total of five tests.
This report is available at no cost from the National Renewable Energy Laboratory (NREL) at www.nrel.gov/publications.
7
n) Repeat steps e) through m) with switch S2 connected to the other phases until all phases have been tested.
o) Repeat steps e) through n) at the minimum power factors for the EUT, both capacitive and inductive.
Requirements The EUT input sources used were capable of supplying at least 150% of the maximum input power rating of the EUT over the entire range of EUT input voltages. The test and measurement equipment recorded each phase current and each phase-to-neutral and phase-to-phase voltage over the duration of the test. A sampling frequency of at least 10 kHz was required. Sampling frequencies of 50 kHz were used in most tests unless otherwise indicated. The equations for Qf are based upon an ideal parallel RLC circuit. For this reason, non-inductive resistors, low loss (high Q) inductors, and capacitors with low effective series resistance and effective series inductance were utilized in the test circuit. Power ratings of resistors were conservatively chosen to minimize thermally induced drift in resistance values during the course of the test. 2.2 GFO Data Reporting A voltage-duration curve was created using sampled instantaneous voltage measurements during the complete transient time of the inverter. The number of voltage measurements above the voltage levels provided in Table 2 was multiplied by the sample interval, resulting in that voltage threshold’s total duration. The voltage-duration curve is a plot of all points (voltage, duration) derived from this process. Because classic GFO affects line-neutral voltages, all results reported herein are for line-neutral voltages unless otherwise indicated.
Table 2. Overvoltage threshold levels
Instantaneous Voltage (% of nominal peak)
170 140 130 120 110
The voltage levels shown in Table 2 are significantly modified from voltage levels in what is known as the CBEMA3 curve, or its successor the ITIC4 curve, both of which describe the tolerance of electronic equipment to voltage surges of varying durations. The voltage levels have been modified to better characterize inverter behavior across the range of voltage levels expected during testing. FIGII working group members generally agreed that the CBEMA and 3 Computer Business Equipment Manufacturers Association 4 Information Technology Industry Council
This report is available at no cost from the National Renewable Energy Laboratory (NREL) at www.nrel.gov/publications.
8
ITIC curves may not actually be appropriate for evaluating inverter behavior in transient overvoltage scenarios because they were not designed for that purpose. However, more appropriate curves are not known to have been developed, and their development would require significant research and consensus building. Also note that the voltage levels used here differ from those used in the LRO testing presented in [4] in that they are more concentrated at lower overvoltage levels to provide better granularity to the analysis at the expected TOV levels. In addition, the longest time that the voltage exceeded each of the limits in Table 2 continuously was recorded for each of the test settings. The distinction between the total voltage duration and the maximum continuous duration is depicted in Figure 3. For waveforms that exceed a defined voltage threshold during multiple parts of the cycle (either positive or negative polarity), the total voltage duration will always be greater than the maximum continuous time. For the example waveform given, the total voltage duration would be recorded as the sum of t1, t2, and t3. Since t2 is the longest continuous time the voltage exceeds the threshold, t2 would be recorded for the longest continuous duration metric.
Figure 3: Example waveform depicting how test result data is defined
In addition to the voltage duration metrics described, the absolute value of the maximum instantaneous voltage measurement recorded at any time during the transient event is reported (as represented by the voltage at point P in Figure 3), as well as the trip time (represented by ttrip). For the purposes of these tests, the trip time was defined as the time between switch S2 closing and the EUT current dropping below a threshold and never again exceeding that threshold.
2.3 Test Inverters and Test Equipment Description The basic specifications for the test inverters are given in Table 3. For the purposes of this report, the inverter manufacturer and model number are not given, and inverters are given a generic
-2
-1.5
-1
-0.5
0
0.5
1
1.5
2
0 0.005 0.01 0.015 0.02 0.025 0.03 0.035
Volta
ge (p
er u
nit)
Time (sec)
ttrip
t1 t3
t2
P
This report is available at no cost from the National Renewable Energy Laboratory (NREL) at www.nrel.gov/publications.
9
name (“Inverter 1”, Inverter 2”, …). As seen in Table 3, a variety of inverter topologies and power levels have been selected for this study.
When describing leading and lagging power factor throughout this report, the generator reference frame is used: current is defined as positive when leaving the inverter. Hence lagging power factor operation corresponds to sourcing of reactive power (sometimes called overexcited operation in analogy to rotating machine controls), and leading power factor operation corresponds to sinking of reactive power (analogous to underexcited machine operation). To avoid confusion, this explanation is reiterated in each section of this report.
For Inverter 1, the minimum power factor was 0.8, both leading and lagging. Inverter 2 can operate at nearly any power factor, but the minimum power factor listed in the data sheet was 0.8 (both leading and lagging), so 0.8 was used as the minimum power factor for GFO testing purposes. Inverter 3 can only operate at unity power factor.
Table 3: Basic test inverter specifications
Voltage
Configuration Nameplate
Power Additional
Information Test
Version Minimum
Leading PF Minimum
Lagging PF Inverter
1 480 V Three
Phase 12.0 kW Dual stage, transformerless
1 0.8 0.8
Inverter 2
480 V Three Phase 20.0 kW Single stage,
transformerless 2 0.8 0.8
Inverter 3
208 V Three Phase 4.5 kW
(18) 250 W microinverters in a
three-phase configuration
2 NA NA
Table 4 shows the configurations of the two transformers used for additional tests of Inverter 1. Only Inverter 1 was tested with transformers.
Table 4: Transformer configurations for additional tests
Transformer Configuration Transformer Rated Power Turns Ratio
Inverter 1 Wye-grounded:Wye-grounded 30 kVA 1:1
Inverter 1 Delta:Wye-grounded (Wye on inverter side) 30 kVA 1:1
The major test and measurement equipment used in this testing were as follows:
Grid Simulator: Ametek MX45 45 kVA AC power supply (bi-directional)
DC Input Source (central/string inverters): MagnaPower MTD1000-250 DC power supply
This report is available at no cost from the National Renewable Energy Laboratory (NREL) at www.nrel.gov/publications.
10
DC Input Source (microinverters): TerraSAS PV supply, 14x ETS60X14C-PVF and 4x ETS80X10.5C-PVF modules
Load Banks: LoadTec 250 kVA RLC load bank, wye-connected. Minimum load step sizes at 480 VAC are 50 W and 50 VARs, both capacitive and inductive.
Yokogawa DL750E Scopecorder, calibration date 08/2014, 701260 modules for power measurements, 701250 modules for signal measurements. AC voltages directly input to sensing modules.
Yokogawa DL850E Scopecorder, calibration date 08/2014, 720210/701250 modules for power measurements, 701267 modules for signal measurements. AC voltages directly input to sensing modules.
Hioki 9693 AC/DC current probes with 6590 transducers
Yokogawa 701930 current probes (10 mV/A, 150/500 A maximum)
Fluke 87 RMS multimeter
This report is available at no cost from the National Renewable Energy Laboratory (NREL) at www.nrel.gov/publications.
11
3 Test Results All test results for GFO testing are provided in the following sections for each of the three test inverters. Each section contains mean values and maximum/minimum values for each of the inverter/load power test settings, across a typical total of 21 tests (seven for each phase) at each setting. While the test procedure called for five tests per phase, in many cases seven tests were run. The first sections contain data about total overvoltage durations, maximum continuous overvoltage durations, maximum voltage measurements, and trip times, focusing on line to neutral voltages. Representative waveforms and waveforms of particular interest are provided in the subsequent section for each test inverter. Representative island transition waveforms are also presented, as these serve as a baseline under test Version 2. Finally, the following comparative analyses are presented:
Default voltage and frequency trip settings versus wide trip settings
Test Version 1 (AI disabled) versus test Version 2 (AI enabled)
No transformer versus Y:Y transformer versus D:Y transformer
Wye-connected load versus delta-connected load
Analysis of line to line voltages
3.1 RLC Load Tuning The power and reactive power settings of the RLC load for each test category are given in Table 5 through Table 11. Note that these settings refer to the power of the load bank itself rather than the entire circuit, which contains some additional resistance, inductance, and capacitance. For this reason when the circuit is tuned so that inverter real power matches circuit power dissipation, the load bank real power is always somewhat less than the inverter output power. For non-unity power factor tests, the real power values are further reduced because the inverters curtailed active power in order to produce reactive power. Inverter 3 was not capable of operating at non-unity power factor.
Also note that the exact tuning of the load is not as crucial in GFO tests as it is in unintentional islanding tests: in GFO tests the purpose of the island is primarily to allow the inverter to run without being connected to an AC voltage source. This is true of both Version 1 (AI disabled) and Version 2 (AI enabled) of the GFO test. Nevertheless, load quality factors of nearly 1.0 or slightly higher were used.
Each phase of the load bank employed was individually tunable, and in many tests each phase was individually tuned to minimize fundamental frequency current from the grid simulator (i.e. to optimize the matching between load and generation). When per-phase load values are not given, the load was balanced. Unless otherwise stated, the tests described below used the load bank settings given in the following tables, where P is the real power setting, QL is the inductive reactive power setting, and QC is the capacitive reactive power setting:
This report is available at no cost from the National Renewable Energy Laboratory (NREL) at www.nrel.gov/publications.
12
Table 5: Inverter 1 Load Settings – Unity Power Factor
P (kW) 11.4
QL (kVAR) 12.3
QC (kVAR) 12.0
Table 6: Inverter 1 Load Settings – Leading5 Power Factor
P (kW) 9.3
QL (kVAR) 8.5
QC (kVAR) 15.5
Table 7: Inverter 1 Load Settings – Lagging Power Factor
Phase A Phase B Phase C
P (kW) 2.95 5.25 2.83
QL (kVAR) 5.25 5.25 5.25
QC (kVAR) 2.85 2.75 2.70
Table 8: Inverter 2 Load Settings – Unity Power Factor
Phase A Phase B Phase C
P (kW) 6.25 6.15 6.05
QL (kVAR) 6.65 6.65 6.65
QC (kVAR) 6.85 6.65 6.85
5 The generator reference frame is used in this report: lagging power factor corresponds to sourcing reactive power, and leading power factor corresponds to sinking reactive power.
This report is available at no cost from the National Renewable Energy Laboratory (NREL) at www.nrel.gov/publications.
13
Table 9: Inverter 2 Load Settings – Leading5 Power Factor
Phase A Phase B Phase C
P (kW) 4.80 4.70 4.70
QL (kVAR) 3.50 3.50 3.0
QC (kVAR) 7.35 7.35 7.35
Table 10: Inverter 2 Load Settings – Lagging5 Power Factor
Phase A Phase B Phase C
P (kW) 5.00 5.00 4.80
QL (kVAR) 7.85 7.85 7.75
QC (kVAR) 3.50 3.50 3.50
Table 11: Inverter 3 Load Settings – Unity Power Factor
Phase A Phase B Phase C
P (kW) 1.35 1.35 1.35
QL (kVAR) 1.55 1.65 1.55
QC (kVAR) 1.50 1.55 1.50
3.2 Total Time Above Voltage Thresholds The total overvoltage duration curves for each of the three test inverters are provided below. These plots display the total amount of time that the voltage at the AC terminals exceeded each of the voltage thresholds given in Table 2. Each measurement is inclusive of higher threshold limits; for example, time above the 120% threshold includes time above the 130%, 140%, and 170% thresholds. Each measurement represents the total time that any of the three phases exceeded a given threshold (the sum of the three phases).
An example overvoltage duration plot is shown in Figure 4. The legend shows each of the three inverter power factor settings, and a plot is given at each of these test settings for each voltage threshold. Each whisker plot shows the average (mean) value of the test runs, along with the maximum and minimum values of these tests.
This report is available at no cost from the National Renewable Energy Laboratory (NREL) at www.nrel.gov/publications.
14
Figure 4: Example plot of overvoltage duration as a function of voltage threshold level and power factor6 for a single test inverter
The overall test data are summarized in Table 12 and Table 13, which contain all of the information about averages and maxima that is contained in individual inverter plots. All time measurements are reported in milliseconds (ms). Inverter 3 was not capable of operating at non-unity power factor. For the standard wye-load tests without transformers, no overvoltage levels reached the 170% threshold, and all overvoltage times were quite brief. Most of the overvoltages above 120% were due to a very brief initial current spike through the fault rather than to longer time-scale effects, as will be clear from the voltage waveforms presented further below.
Table 12: Maximum total time above each voltage threshold (ms)
6 The generator reference frame is used in this report: lagging power factor corresponds to sourcing reactive power, and leading power factor corresponds to sinking reactive power.
>110% >120% >130% >140%0
0.5
1
1.5
2
2.5
3
3.5
4
Overvoltage Level (% Nominal)
Tota
l Tim
e A
bove
Thr
esho
ld (m
s)
Power Factor
1.00.8 Leading0.8 Lagging
Maximum, mean, and minimum time above the indicated voltage level across all tests at the indicated power factor. Here, the voltage level is 110% and the PF is 0.8 lagging.
This report is available at no cost from the National Renewable Energy Laboratory (NREL) at www.nrel.gov/publications.
15
Table 13: Average total time above each voltage threshold (ms)
A plot of the voltage duration ranges for Inverter 1 is shown in Figure 5. The largest measured overvoltage duration above 110% of nominal was under 4 ms and the largest duration above 120% of nominal was under 1 ms. Overvoltage durations tended to be longest for lagging power factor and shortest for leading power factor, and this inverter had few overvoltage measurements above the 140% threshold.
Figure 5: Cumulative overvoltage durations for Inverter 1
A plot of the overvoltage duration ranges for Inverter 2 is shown in Figure 6. Nearly all overvoltage cumulative durations were below 1 ms. The largest measured overvoltage duration above 110% of nominal was 6.4 ms. This inverter spent very little time above the 120% threshold. Like Inverter 1, Inverter 2 also shows worst-case overvoltages with lagging power factor.
>110% >120% >130% >140%0
0.5
1
1.5
2
2.5
3
3.5
4
Overvoltage Level (% Nominal)
Tota
l Tim
e A
bove
Thr
esho
ld (m
s)
Power Factor
1.00.8 Leading0.8 Lagging
This report is available at no cost from the National Renewable Energy Laboratory (NREL) at www.nrel.gov/publications.
16
Figure 6: Cumulative overvoltage durations for Inverter 2
A plot of the voltage duration ranges for Inverter 3 is shown in Figure 7. This inverter is not capable of operating at non-unity power factor, so only unity power factor results are shown. The largest measured overvoltage duration above 110% of nominal was under 0.25 ms. This inverter showed the shortest overvoltage durations of the three inverters.
Figure 7: Cumulative overvoltage durations for Inverter 3. Note vertical range extends to only 0.25 ms.
All three inverters produced very short cumulative overvoltages, totaling below half of an AC line cycle in all cases shown above. Tests with transformers and with delta-connected loads have not been included above and are described later.
>110% >120% >130% >140%0
1
2
3
4
5
6
7
Overvoltage Level (% Nominal)
Tota
l Tim
e A
bove
Thr
esho
ld (m
s)
1.00.8 Leading0.8 Lagging
Power Factor
>110% >120% >130% >140%0
0.05
0.1
0.15
0.2
0.25
Overvoltage Level (% Nominal)
Tota
l Tim
e A
bove
Thr
esho
ld (m
s)
Power Factor
1.0
This report is available at no cost from the National Renewable Energy Laboratory (NREL) at www.nrel.gov/publications.
17
3.3 Maximum Continuous Time Above Voltage Thresholds Summaries of the maximum and average of the maximum continuous time spent above each voltage threshold are shown in Table 14 and Table 15. Since no instantaneous voltage measurement exceeded 170% of nominal, only the 110%/120%/130%/140% thresholds are reported in these tables. As described earlier, the maximum continuous time variables by definition are less than or equal to the total time durations reported in the previous section. Averages and maxima are calculated from a set of tests (typically 21, seven for each phase) executed at each loading ratio. This data set shows the maximum continuous time that any individual phase voltage exceeded a given threshold. It is possible that the maximum continuous overvoltage occurred on different phases for different voltage thresholds. No inverter exceeded 2 ms continuously above any threshold for any of these transformerless, wye-load tests.
Table 14: Maximum continuous time above each voltage threshold (ms)
A plot of the maximum continuous overvoltage duration ranges for Inverter 1 is shown in Figure 8. The largest measured continuous overvoltage duration above 110% of nominal was under 1.7 ms. Again, worst-case overvoltage durations occurred for lagging power factor operation.
7 The generator reference frame is used in this report: lagging power factor corresponds to sourcing reactive power, and leading power factor corresponds to sinking reactive power.
This report is available at no cost from the National Renewable Energy Laboratory (NREL) at www.nrel.gov/publications.
18
Figure 8: Maximum continuous overvoltage durations for Inverter 1
A plot of the maximum continuous overvoltage duration ranges for Inverter 2 is shown in Figure 9. The largest measured continuous overvoltage duration above 110% of nominal was under 1.2 ms. Again, worst-case overvoltage duration came at lagging power factor.
Figure 9: Maximum continuous overvoltage duration times for Inverter 2
>110% >120% >130% >140%0
0.2
0.4
0.6
0.8
1
1.2
1.4
1.6
1.8
Overvoltage Level (% Nominal)
Max
imum
Con
tinuo
us T
ime
Abo
ve T
hres
hold
(ms)
Power Factor
1.00.8 leading0.8 lagging
>110% >120% >130% >140%0
0.2
0.4
0.6
0.8
1
1.2
1.4
Overvoltage Level (% Nominal)
Max
imum
Con
tinuo
us T
ime
Abo
ve T
hres
hold
(ms)
1.00.8 leading0.8 lagging
Power Factor
This report is available at no cost from the National Renewable Energy Laboratory (NREL) at www.nrel.gov/publications.
19
A plot of the maximum continuous overvoltage duration ranges for Inverter 3 is shown in Figure 10. The largest measured continuous overvoltage duration above 110% of nominal was under 2 ms. This inverter had consistently short continuous overvoltage times.
Figure 10: Maximum continuous overvoltage duration times for Inverter 3
3.4 Maximum Instantaneous Overvoltage This section presents data on the maximum instantaneous overvoltage measurement recorded at any point during the fault transient event. Averages and maximums across (typically) 21 different tests at each power factor are provided in Table 16 and Table 17. The plots in this section and the next display the parameter of interest as a function of inverter power factor. Each plot shows the average across all tests at a given power factor (red “X”) as well as the individual test data points (blue circles). As discussed below with the voltage waveforms, the peak overvoltage is typically due to the very brief fault transient (rather than to a quasi-steady-state sinusoidal overvoltage typically associated with GFO) and is highly dependent on where in the sinusoid the fault occurs.
Table 16: Maxima of maximum instantaneous voltage measurements (% of nominal peak)
8 The generator reference frame is used in this report: lagging power factor corresponds to sourcing reactive power, and leading power factor corresponds to sinking reactive power.
>110% >120% >130% >140%0
0.02
0.04
0.06
0.08
0.1
0.12
0.14
0.16
0.18
0.2
Overvoltage Level (% Nominal)
Max
imum
Con
tinuo
us T
ime
Abo
ve T
hres
hold
(ms)
Power Factor
1.0
This report is available at no cost from the National Renewable Energy Laboratory (NREL) at www.nrel.gov/publications.
20
Table 17: Average of maximum instantaneous voltage measurements (% of nominal peak)
The maximum instantaneous overvoltages measured as a function of power factor for Inverter 1 are found in Figure 11. Peak overvoltages fell in a wide range starting as low as 113% above nominal, and going as high as 151% of nominal. (Note: this could also be phrased as 51% above nominal.) As with overvoltage durations, maximum voltage levels tend to be somewhat worse at lagging power factor.
Figure 11: Maximum instantaneous overvoltage vs. power factor for Inverter 1
The maximum instantaneous overvoltages measured as a function of power factor for Inverter 2 are found in Figure 12. Peak voltages cover a wide range starting well within ANSI Range A and going as high as 138% of nominal. Inverter 2 tended to have slightly lower instantaneous overvoltage levels compared to the other two inverters. For this inverter, lagging power factor tests did not show higher overvoltage levels, though they did show somewhat longer overvoltage durations.
1.0 0.8 Leading 0.8 Lagging110
115
120
125
130
135
140
145
150
155
Inverter Power Factor
Max
imum
Ove
rvol
tage
(% n
omin
al)
Test DataAverages
This report is available at no cost from the National Renewable Energy Laboratory (NREL) at www.nrel.gov/publications.
21
Figure 12: Maximum instantaneous overvoltage vs. power factor for Inverter 2
The maximum instantaneous overvoltages measured for Inverter 3 are found in Figure 13. The maximum voltage measured during any of the tests of Inverter 3 was 156% of nominal, and the lowest maximum voltage was very near to the nominal voltage. Recall, as mentioned previously and shown in Figure 10, that the higher overvoltages had very short durations; the highest peak overvoltages lasted only one sample cycle (0.02 ms).
Figure 13: Maximum instantaneous overvoltage vs. power factor for Inverter 3
1.0 0.8 Leading 0.8 Lagging100
110
120
130
140
Inverter Power Factor
Max
imum
Ove
rvol
tage
(% n
omin
al)
Test DataAverages
1.0100
110
120
130
140
150
160
Inverter Power Factor
Max
imum
Ove
rvol
tage
(% n
omin
al)
Test DataAverages
This report is available at no cost from the National Renewable Energy Laboratory (NREL) at www.nrel.gov/publications.
22
3.5 Trip Time / Time to Disconnect This section shows data about the trip time (also called time to disconnect or run-on time) for each test inverter as a function of power factor. For the purposes of this testing, the trip time was defined as the time from switch S2 closing (see Figure 1) until the time that each phase current ceased to exceed a threshold of 3 A peak. This threshold was chosen empirically as the optimal level to detect inverter turn-off given signal noise and offset. Maxima and averages across typically 21 different tests at each power factor are provided in Table 18 and Table 19. Inverters 1 and 3 tended to disconnect after two AC line cycles. Inverter 2 displayed a binary behavior, sometimes disconnecting in under one cycle but sometimes running for roughly ten cycles at near-nominal line-neutral voltage magnitude.
Table 18: Maximum time to disconnect for all inverters (ms)
Individual plots of all test points and average trip times as a function of power factor are shown in Figure 14 through Figure 16. The binary behavior of Inverter 2 is evident: it has both the longest and the shortest trips times of the three inverters. Its behavior depends on the magnitude of the initial voltage spike due to the fault current, with large voltage spikes producing rapid shutdown and smaller spikes often leading to longer run-on time. Note that the longer run-on times would likely not occur in real-world scenarios without the balanced load:generation ratio required by the test plan. Nevertheless these run-on times are all under 12 line cycles and are not concerning given the near-nominal voltage levels. The trip times of Inverters 1 and 3 were more predictable and were always under 3 line cycles.
9 The generator reference frame is used in this report: lagging power factor corresponds to sourcing reactive power, and leading power factor corresponds to sinking reactive power.
This report is available at no cost from the National Renewable Energy Laboratory (NREL) at www.nrel.gov/publications.
23
Figure 14: Trip time as a function of power factor for Inverter 1
Figure 15: Trip time as a function of power factor for Inverter 2
1.0 0.8 Leading 0.8 Lagging22
24
26
28
30
32
34
36
Inverter Power Factor
Trip
Tim
es (m
s)
Test DataAverages
1.0 0.8 Leading 0.8 Lagging0
50
100
150
200
Inverter Power Factor
Trip
Tim
es (m
s)
Test DataAverages
This report is available at no cost from the National Renewable Energy Laboratory (NREL) at www.nrel.gov/publications.
24
Figure 16: Trip time as a function of power factor for Inverter 3
3.6 Waveforms of Interest This section shows a selection of waveforms showing inverter behavior during the ground fault event for each of the test inverters. Each inverter had unique responses to the fault event, but the responses can be grouped into similar and repeatable response types. This section contains some waveforms that are considered typical inverter responses, along with others that had a unique or outlying response. This section is not meant to be an exhaustive report on all waveform characteristics, but instead is meant to provide insights into the differences between inverter responses. In general, GFO test results were much more consistent and contained fewer outliers than LRO test results presented in [4]. This section also presents plots of symmetrical component for selected tests to provide insight into the effect grounding transformers would have on the inverter ground fault responses.
Each waveform plot shows the AC terminal voltages, inverter current, DC bus voltage, and the auxiliary contact signal (labeled “Aux”) showing when switch S2 closed, creating the fault (see Figure 1). The closing of switch S2 actually occurs 2-4 ms after Aux goes low, as is clear from the abrupt change in the faulted phase voltage in many plots. Note that trip times presented above are measured from the actual fault time rather than from the time the Aux signal goes low. Each plot also has horizontal lines showing the 110%, 120%, and 130% voltage threshold levels (when necessary). The interval of time where the maximum continuous overvoltage at each voltage threshold occurs is highlighted in each waveform. The alphanumeric name given in parentheses in each waveform caption corresponds to the raw data file name.
This section also presents unintentional islanding test waveforms for Inverters 2 and 3, which were primarily tested using test Version 2. These AI tests serve as baselines for the GFO tests under Version 2, which initiates the ground fault immediately following the creation of the island.
1.05
10
15
20
25
30
35
Inverter Power Factor
Trip
Tim
es (m
s)
Test DataAverages
This report is available at no cost from the National Renewable Energy Laboratory (NREL) at www.nrel.gov/publications.
25
Inverter 1 Waveforms
Figure 17 shows a typical response of Inverter 1 with annotations to point out salient features. For this test the inverter was operating at unity power factor and the fault occurred on phase C. At the time of the fault (just after 2.3 s), the faulted phase voltage, which was negative, went immediately to near zero, and the other two phase voltages rose by nearly the same amount. This created a significant but very brief overvoltage on phase B, which was near its peak. After the brief spike, all three inverter currents returned to nearly nominal-magnitude sinusoids with noticeable harmonics, and the two unfaulted phase voltages continued on sinusoidal trajectories with noticeable unbalance. This unbalance led to some overvoltage on phase A at the 110% level, but only on the positive half of the sinusoid. There was no overvoltage on the other phase. After about two AC cycles, the inverter stopped gating, evidenced by the abrupt cutoff of current around 2.33 s. The unfaulted phase voltages displayed a decaying resonance at 60 Hz after the inverter stopped exporting current. This resonance was driven by the RLC load, and as expected for a circuit with quality factor near unity, the resonance lasts about one line cycle.
Figure 17: Inverter 1 waveform at unity power factor (test SC0005)
Figure 18 shows the symmetrical component magnitudes of the voltage waveforms in Figure 17. The positive sequence component drops from 1.0 pu (per unit) before the fault to about 0.7 pu for the two line cycles following the fault before the inverter disconnects. During those two line cycles, both the negative and the zero sequence components rise from near zero to about 0.35 pu.
Initial spike on unfaultedphase due to fault itself
Unity PF, phase C shorted (Test SC0005)
Minor TOV
Inverter stops gating
RLC load resonates
Fault occurs here
This report is available at no cost from the National Renewable Energy Laboratory (NREL) at www.nrel.gov/publications.
26
In the “traditional” GFOV mechanism normally associated with synchronous machines (derived neutral point shift), nearly all of the unbalanced voltage would appear in the zero sequence. The split between negative and zero sequences seen in Figure 18 indicates that this unbalance is not caused by a derived neutral point shift.
Figure 18: Symmetrical components of Inverter 1 voltage waveforms at unity power factor (test SC0005)
Both the waveforms and the symmetrical components in this response were fairly typical for this inverter regardless of power factor and faulted phase. The magnitude of the brief overvoltage spike at the time of the fault varied depending on the voltages of the faulted and unfaulted phases at the time of the fault, and the exact shape of the voltage waveforms varied as well.
Note that all of the highest overvoltages recorded in the sections above (for all three inverters) were due to the brief initial spike at the time of the fault, and not to sinusoidal overvoltages typically associated with GFO. In a real feeder ground fault scenario the grid source is still present during the initial ground fault, so this spike would typically be driven by a combination of grid-sourced current and current sourced by any inverters connected to the feeder. The longest duration overvoltages are due to sinusoidal overvoltage, but the magnitudes of sinusoidal overvoltage are consistently low.
It is worthwhile to examine the fault voltage spike briefly. Figure 19 shows a zoomed in view of the spike. When phase C was shorted, its voltage rose nearly 200 V in one sample period (20 µs). Phases A and B both rose by roughly 100 V in the same time. This indicates that a large ground fault current flowing through the very small neutral-to-ground impedance caused a very brief drop in the neutral voltage of roughly 100 V – the neutral point essentially met phase C halfway, ending up 100 V below ground potential, temporarily. So, while the voltages relative to earth ground on phases A and B likely changed very little, the phase-neutral voltages VAN and VBN, which are what was measured, both changed by 100 V. In the case of phase A, which was already negative, VAN simply became less negative. But in the case of phase B, which was positive and near its peak, the voltage VBN suddenly spiked by 100 V. This spike died out fairly quickly (with some ringing) as the fault current decayed.
Time (sec)
2.25 2.3 2.35 2.4
Seq
uenc
e vo
ltage
(pu)
0
0.2
0.4
0.6
0.8
1
positive
negative
zero
This report is available at no cost from the National Renewable Energy Laboratory (NREL) at www.nrel.gov/publications.
27
It is worth noting that in this experimental setup only a few meters of cable separated the inverter from the fault location, so the impedance between the fault and the inverter is very low. In a typical field ground fault, there would be higher impedance between the inverter and the fault (and the grid itself would also typically still be connected during the fault). So the fault voltage spikes recorded here should not be taken to be representative of field conditions, which would likely see lower fault current contributions from the inverter. This is significant because it shows that the initial spike is partially attributable to the fault itself, rather than to the inverter, though the inverter does source some of the fault current, with the rest coming from the resonant load itself. The fact that some of the fault current comes from the load explains why lagging power factor tests tended to have higher voltage spikes: at lagging power factor the parallel RLC load contains more inductance and less capacitance, and hence has higher impedance at very high frequencies. This higher impedance leads to a larger voltage difference between the unfaulted phases and neutral. The current sensors used here were limited in bandwidth to 15 kHz and hence did not register most of the higher-frequency fault current spike.
Figure 19: A close-up of the waveforms in Figure 17 at the time of the fault
This report is available at no cost from the National Renewable Energy Laboratory (NREL) at www.nrel.gov/publications.
28
Figure 20 shows the test with the longest overvoltages at each threshold of the tests summarized above. The inverter was at lagging power factor10 and the fault was on phase A. If the brief current spikes at the time of the fault are excluded, this was the worst-case test result of Inverter 1 (excluding delta load tests and D:Y transformer tests). Figure 21 shows the symmetrical components of the voltage for the same test. As in Figure 18 above, both negative and zero sequences appear after the fault, peaking around 0.35 pu.
It was not uncommon to see almost no overvoltage at all, as seen in Figure 22, where the initial voltage spike did not produce an overvoltage because the faulted phase was near its zero-crossing at the time of the fault. This test was at leading power factor and phase B was faulted. Phase C does exceed the 110% threshold for about 1 ms. Considering that the waveforms shown in Figure 20 and Figure 22 represent the worst-case and the best case respectively and yet are themselves very similar, it is clear that this inverter’s GFO behavior was quite repeatable.
Figure 20: Inverter 1 test with longest cumulative overvoltage (SAO0003)
10 The generator reference frame is used in this report: lagging power factor corresponds to sourcing reactive power, and leading power factor corresponds to sinking reactive power.
This report is available at no cost from the National Renewable Energy Laboratory (NREL) at www.nrel.gov/publications.
29
Figure 21: Symmetrical components of the voltage for Inverter 1 test with longest cumulative overvoltage (SAO0003)
Figure 22: One of the mildest overvoltages produced by Inverter 1 (SBU0005)
Voltage source-like generators such as synchronous machines cause GFO by maintaining line to line voltages following a ground fault. Hence another way of confirming that an inverter is not acting like a voltage source (or a voltage source behind an impedance) is to plot line to line voltages. Figure 23 shows the line to line voltages of a typical Inverter 1 one waveform with phase C shorted. VAB maintains a near nominal magnitude, while the voltages that include the faulted phase, VBC and VCA, drop in magnitude to approximately the nominal line-neutral voltage, as expected for a current source generator. This is another way of demonstrating that this inverter is not causing a neutral-shift GFO. Further analysis of line to line voltages is presented near the end of this report, where is it shown that Inverter 1’s ground fault response contains a low-level line to line transient overvoltage in many scenarios.
This report is available at no cost from the National Renewable Energy Laboratory (NREL) at www.nrel.gov/publications.
30
Figure 23: Typical line to line voltages of Inverter 1 (SCO0005)
Inverter 2 Waveforms
Because Inverter 2 used test Version 2, where the fault is created immediately after the island, several baseline tests were run where the island was created but no fault was created. Figure 24 shows one such test, which was typical of the islanding tests for this inverter. The grid simulator disconnected when the Aux signal went low, and the inverter disconnected less than two seconds later, as required. Figure 25 shows a close-up of the waveforms just before and after the grid disconnected during the same test. The islanding response was very stable, indicating that test Version 2 should give a good idea of this inverter’s ground fault behavior without interference from any islanding transient.
Figure 24: Inverter 2 baseline islanding test (EI_0007)
2.24 2.26 2.28 2.3 2.32 2.34 2.36 2.38 2.4
-600
-400
-200
0
200
400
600
Time (sec)
Vol
tage
(V) o
r Cur
rent
(A)
VAB
IinvAVBC
IinvBVCA
IinvCAuxVdc
2.2 2.4 2.6 2.8 3 3.2
-400
-300
-200
-100
0
100
200
300
400
Time (sec)
Vol
tage
(V) o
r Cur
rent
(A)
VinvAIinvAVinvBIinvBVinvCIinvCAuxVdc
This report is available at no cost from the National Renewable Energy Laboratory (NREL) at www.nrel.gov/publications.
31
Figure 25: Close-up of island transient in Inverter 2 baseline islanding test (EI_0007)
As mentioned above, Inverter 2 showed two types of ground fault responses. In one type, it stopped exporting very quickly following a relatively larger voltage spike (possible tripping on overvoltage or on dv/dt). In the other type, the initial voltage spike tended to be smaller and the inverter continued to operate for about 10 cycles at near nominal voltage on the unfaulted phases, and with near-nominal current on all phases. Figure 26 shows a typical response of the fast disconnect type. This was a unity power factor test with a fault on phase B. Figure 27 shows a typical waveform of the longer run-on variety. The fault was on phase C and the power factor was 0.8 lagging. As with most of these longer run-on tests, there is no overvoltage at any level, even during the initial spike. Note that the current remains at very near nominal amplitude following the initial, brief fault transient. However, the current phase angles are significantly unbalanced and shift significantly over the course of the test. The current on the faulted phase has noticeably greater high-frequency harmonics for the ten cycles after the fault.
2.32 2.34 2.36 2.38 2.4 2.42 2.44
-400
-300
-200
-100
0
100
200
300
400
Time (sec)
Vol
tage
(V) o
r Cur
rent
(A)
VinvAIinvAVinvBIinvBVinvCIinvCAuxVdc
This report is available at no cost from the National Renewable Energy Laboratory (NREL) at www.nrel.gov/publications.
32
Figure 26: Inverter 2 waveforms showing fast output shutdown (EB_0003)
Figure 28 shows the symmetrical components of the voltages for the typical longer run-on test shown in Figure 27. The voltage magnitudes are similar to those of Inverter 1, with the positive sequence dropping to about 0.7 pu while the negative and zero sequences rise to about 0.35 pu for the duration of the test following the fault. Note that the negative sequence increases slightly and the zero sequence decreases slightly as the phase angles of the unfaulted phases drift in the absence of a grid reference. This effect is interesting but not concerning given that no overvoltage occurs. This test is typical of Inverter 2 tests with longer run-on.
This report is available at no cost from the National Renewable Energy Laboratory (NREL) at www.nrel.gov/publications.
33
Figure 28: Symmetrical voltage components for Inverter 2 test with longer run-on (EC+_0003)
Figure 29 shows the waveform with the longest overvoltage (both continuous and cumulative). This test was at lagging power factor and phase C was faulted. The waveforms demonstrate that the overvoltage was due to phase imbalance rather than neutral shift: only one of the two unfaulted phases was above nominal, and the other was below. Also note that the phase angles of the voltages and currents were very unbalanced and shifting following the fault. Figure 30 shows the symmetrical components of the voltage in the same test. As expected, the zero sequence is higher when the two unfaulted phases are nearly in phase and falls when the phase angles begin to correct themselves. The negative sequence component is the dominant component of the voltage for most of the test, so a grounding transformer would have little impact on the overvoltage in this case.
Figure 29: Inverter 2 waveforms showing the longest overvoltage at the 110% level (EC+_0001)
This report is available at no cost from the National Renewable Energy Laboratory (NREL) at www.nrel.gov/publications.
34
Figure 30: Symmetrical components of Inverter 2 voltages for the test with longest overvoltage at the 110%
level (EC+_0001)
Figure 31 shows the waveforms with the worst-case peak overvoltage. This was a unity power factor test with the fault on phase B. The overvoltage was due to the initial fault spike, and its magnitude was due to the timing of the fault: phase B was relatively high (causing a large spike), and phase A was opposite in polarity (causing the spike to increase the absolute magnitude of VAN) and nearly at its negative peak (meaning the fault starts from a relatively large base). Also, recall that this initial spike is likely exaggerated somewhat by the low impedance between the inverter output filter elements and the fault, as explained above. Following the brief spike, the inverter shut down almost immediately.
Figure 31: Inverter 2 waveforms with the maximum instantaneous overvoltage (EB_0005)
Figure 32 shows the line to line voltages from the typical test shown in Figure 27. Figure 33 shows the line to line voltages from the worst-case test shown in Figure 29. In both cases the line to line voltages that include the faulted phase (phase C) fell to approximately the line to neutral magnitude after the fault. Interestingly, in Figure 33 VAB dropped to nearly zero following the fault and then ramped back up to the nominal line to line voltage over the course of
This report is available at no cost from the National Renewable Energy Laboratory (NREL) at www.nrel.gov/publications.
35
the test. This was due to a fault-induced shift in the phase angle of phase B which brought it into phase with phase A briefly, as seen in Figure 29. The angle of phase B then returned to normal over the following 0.1 s, bringing VAB back to nearly its nominal value. Like Inverter 1, this inverter did not cause neutral shift in response to a ground fault.
Figure 32: Inverter 2 line to line voltages during a typical test (EC+_0003)
Figure 33: Inverter 2 line to line waveforms for the test with the longest cumulative overvoltage (EC+_0001)
Inverter 3 Waveforms
Because Inverter 3 used test Version 2, where the fault was created immediately after the island, several baseline tests were run where the island was created but no fault was created. Figure 34 shows one such test. The grid simulator disconnected when the Aux signal goes low, and the inverter disconnected less than two seconds later, as required. Figure 35 shows a close-up of the waveforms just before and after the grid disconnected. The islanding response is very stable,
2.25 2.3 2.35 2.4 2.45 2.5 2.55
-600
-400
-200
0
200
400
600
Time (sec)
Vol
tage
(V) o
r Cur
rent
(A)
VAB
IinvAVBC
IinvBVCA
IinvCAuxVdc
2.2 2.25 2.3 2.35 2.4 2.45 2.5 2.55 2.6-800
-600
-400
-200
0
200
400
600
800
Time (sec)
Vol
tage
(V) o
r Cur
rent
(A)
VAB
IinvAVBC
IinvBVCA
IinvCAuxVdc
This report is available at no cost from the National Renewable Energy Laboratory (NREL) at www.nrel.gov/publications.
36
indicating that test Version 2 should give a good idea of this inverter’s ground fault behavior without interference from any islanding transient.
Figure 34: Inverter 3 baseline islanding test (NILD0000)
Figure 35: Close-up of island transient in Inverter 3 baseline islanding test (NILD0000)
2.2 2.4 2.6 2.8 3 3.2 3.4 3.6 3.8
-150
-100
-50
0
50
100
150
Time (sec)
Vol
tage
(V) o
r Cur
rent
(A)
VinvAIinvAVinvBIinvBVinvCIinvCAuxVdc
2.28 2.3 2.32 2.34 2.36 2.38 2.4 2.42 2.44
-150
-100
-50
0
50
100
150
Time (sec)
Vol
tage
(V) o
r Cur
rent
(A)
VinvAIinvAVinvBIinvBVinvCIinvCAuxVdc
This report is available at no cost from the National Renewable Energy Laboratory (NREL) at www.nrel.gov/publications.
37
Figure 36 shows a typical GFO test response for Inverter 3. In this test, phase C was faulted and the inverter was operating at unity power factor. Following an initial current spike, the microinverters operated for about one line cycle at below-nominal voltage and current before shutting down. Recall that this EUT consists of 18 single-phase microinverters connected in delta (six between each pair of lines). All 12 of the microinverters connected to the faulted phase shut down nearly immediately after the fault, as evidenced by the lack of current on the faulted phase and the reduced voltage and current magnitudes on the remaining phases. Also note that the resonant RLC load itself contributed significant but decaying current – hence the decay in the voltage and current during the one line cycle of inverter operation following the fault.
The run-on time for the test seen in Figure 36 was recorded as 32.7 ms (about two line cycles) rather than the one line cycle seen in the figure. This was due to a small current bump that occurs at time 2.336 s (barely visible in the figure), which was registered as the last inverter operation. The inverters may have been discharging output capacitors or performing other shutdown actions. This behavior is typical of all tests of this inverter and is not at all concerning. It is mentioned simply to explain the apparent discrepancy between the recorded disconnection time and the current waveforms seen in the figure.
Figure 36: Typical Inverter 3 waveform (NC_0003)
Figure 37 shows a common variation on the Inverter 3 ground fault response, with phase B faulted. It differs from the waveform in Figure 36 in that the current from the inverters connected across the unfaulted phases lasted only half of a line cycle. Otherwise it is very similar. There was little variation in the Inverter 3 GFO response from test to test. Figure 38 shows the test with the worst-case peak overvoltage, which was again due to the fault occurring near the peak of a waveform opposite in sign to the faulted phase (phase C). Finally, Figure 39 shows a test displaying no overvoltage at all because the fault occurred near the zero-crossing of the faulted phase (phase C), as happened about 25% of the time with this inverter. The limited variation between worst-case (Figure 38) and best-case (Figure 39) demonstrates the high
This report is available at no cost from the National Renewable Energy Laboratory (NREL) at www.nrel.gov/publications.
39
Figure 39: Inverter 3 showing no overvoltage at all (NC_0004)
Figure 40 shows the line to line voltages of Inverter 3 during the typical test shown in Figure 36. Because most of the microinverters making up the EUT shut down almost immediately after the fault, all three line to line voltages were well below nominal magnitude. No symmetrical component plots are shown for this inverter because it did not produce any fundamental-frequency overvoltage. Like the other two inverters, Inverter 3 did not cause neutral shift GFO.
Figure 40: Inverter 3 line to line voltages during a typical test (NC_0003)
3.7 Effect of Voltage and Frequency Trip Settings This section examines the effects of wider voltage and frequency trip settings on ground fault behavior. Inverter 1 was used for these tests. It is known from past work with a similar inverter from this manufacturer that setting wide voltage and frequency limits has the effect of causing the inverter to deterministically ride through voltage and frequency transients that fall just inside the trip settings. Hence these tests effectively examine the impact of low and high voltage and
This report is available at no cost from the National Renewable Energy Laboratory (NREL) at www.nrel.gov/publications.
40
frequency ride-through (LVRT/HVRT/LFRT/HFRT) on GFO. These effects are important because ride-through is beginning to be required in an increasing number of electrical systems to help ensure grid stability with high PV penetrations. However, because these tests fall outside the official scope of the CRADA, only limited tests were performed.
The tests described in the sections above were performed using the inverter’s default voltage and frequency trip settings for both magnitude and time (shown in Table 20 for Inverter 1), which are compliant with IEEE Std 1547-2003 [9] and hence are representative of nearly all distribution connected inverters in the U.S.. This section compares those test results to the results of 25 additional tests of Inverter 1 with expanded voltage and frequency trip settings (shown in Table 21).
Table 20: Inverter 1 default voltage and frequency trip settings (IEEE 1547-2003)
Magnitude Time
Frequency Trip Settings
Overfrequency 60.5 160 ms Underfrequency 59.3 160 ms
Voltage Trip Settings
Fast Overvoltage 120% 160 ms Slow Overvoltage 110% 1 s Slow Undervoltage 88% 2 s Fast Undervoltage 50% 16 ms
Table 21: Inverter 1 widened voltage and frequency trip settings
Magnitude Time
Frequency Trip Settings
Overfrequency 65 10 s Underfrequency 57 10 s
Voltage Trip Settings
Overvoltage 120% 10 s Undervoltage 50% 10 s
Using the widened trip settings in Table 21, 15 tests were performed at unity power factor, five at 0.8 leading, and five at 0.8 lagging.11 Figure 41 shows a summary plot comparing the tests with default settings to the tests with widened settings. Comparing the cumulative overvoltage times at each level, it is evident that the wider settings had little impact on GFO responses for this inverter. The mild discrepancies between results with the two types of trip settings are attributable to the smaller number of tests with wide settings, rather than to differences in inverter behavior.
11 The generator reference frame is used in this report: lagging power factor corresponds to sourcing reactive power, and leading power factor corresponds to sinking reactive power.
This report is available at no cost from the National Renewable Energy Laboratory (NREL) at www.nrel.gov/publications.
41
Figure 41: Examining the dependence of GFO response on voltage and frequency trip settings for Inverter 1
Figure 42 compares peak instantaneous overvoltages for the two trip setting configurations. Again, no significant differences are present, aside from differences attributable to the lower number of tests with wide settings. Figure 43 compares trip times for the two trip setting configurations, again finding no significant difference.
Figure 42: Examining the dependence of peak overvoltage on trip settings for Inverter 1
>110% >120% >130% >140%0
0.5
1
1.5
2
2.5
3
3.5
4
Overvoltage Level (% Nominal)
Tota
l Tim
e A
bove
Thr
esho
ld (m
s)
Power Factor | Trip Settings
1.0 | Default0.8 Leading | Default0.8 Lagging | Default1.0 | Wide0.8 Leading | Wide0.8 Lagging | Wide
This report is available at no cost from the National Renewable Energy Laboratory (NREL) at www.nrel.gov/publications.
42
Figure 43: Examining the dependence of ground-fault disconnection time on trip settings for Inverter 1
From these limited test results, it does not appear that trip settings affect GFO response for this inverter.
3.8 Comparison of GFO Test Versions: AI Enabled vs. AI Disabled This section compares the results of Version 1 and Version 2 of the GFO test. Recall the there are two related fundamental differences: Version 1 has the inverter’s island detection function disabled and creates the fault during a stable island, whereas Version 2 has island detection enabled and creates the fault immediately after the disconnection of the grid simulator. Both versions use a tuned, resonant RLC load. This section also goes beyond the requirements of the CRADA but was included out of research interest.
For Inverter 1, eleven tests were run using test Version 2, in addition to the tests described above. Two islanding-only tests were also run to establish a baseline. One of those tests is shown in Figure 44. Voltages and currents became somewhat unbalanced within the first two cycles following the disconnection of the grid simulator (indicated by the Aux signal going low, in this plot), and the inverter ran on for about 320 ms. To demonstrate that the unbalance was due to the inverter’s AI controls, the same test is shown with AI disabled in Figure 45. (This unbalance is not present in similar AI tests of Inverters 2 and 3, which use different island detection methods.) With AI disabled the inverter continues to run indefinitely after the grid simulator disconnects.
This report is available at no cost from the National Renewable Energy Laboratory (NREL) at www.nrel.gov/publications.
43
Figure 44: Baseline anti-islanding test for Inverter 1 (SA1A0001)
Figure 45: Anti-islanding test with AI controls disabled for Inverter 1 (ILND0000)
0.25 0.3 0.35 0.4 0.45 0.5 0.55 0.6 0.65 0.7 0.75
-400
-300
-200
-100
0
100
200
300
400
Time (sec)
Vol
tage
(V) o
r Cur
rent
(A)
VinvAIinvAVinvBIinvBVinvCIinvCAuxVdc
2.1 2.15 2.2 2.25 2.3 2.35 2.4 2.45 2.5
-400
-300
-200
-100
0
100
200
300
400
Time (sec)
Vol
tage
(V) o
r Cur
rent
(A)
VinvAIinvAVinvBIinvBVinvCIinvCAuxVdc
This report is available at no cost from the National Renewable Energy Laboratory (NREL) at www.nrel.gov/publications.
44
The unbalance seen in Figure 44 is large enough that it is difficult to separate the islanding behavior from the ground fault behavior for Inverter 1, so test Version 2 would not be particularly appropriate for this inverter. Nevertheless, Figure 46 and Figure 47 compare GFO test results for Version 1 (“Islanded”) and Version 2 (“Immediate”). The overvoltage durations are slightly higher using Version 2 because of the contribution of the AI controls to voltage imbalance, which can be seen in Figure 44: the slight overvoltage due to the AI controls combined with the slight overvoltage due to the fault result in a slightly higher overvoltage than that due to either the island controls or the fault alone. This effect is minor and specific to Inverter 1, and it and does not change the overall conclusion made later in this report that having AI on mitigates the worst-case overvoltages.
Figure 46: Comparison of GFO test results for Inverter 1 using test Version 1 (Islanded) and Version 2
(Immediate).
Figure 47: Comparison of GFO test maximum overvoltage and trip time for Inverter 1 using test Version 1
(Islanded) and Version 2 (Immediate).
Overvoltage Level (% Nominal)
>110% >120% >130% >140%
Tota
l Tim
e A
bove
Thr
esho
ld (m
s)
0
0.5
1
1.5
2
2.5
3
3.5
4
Immediate
Islanded
Overvoltage Level (% Nominal)
>110% >120% >130% >140%Max
imum
Con
tinuo
us T
ime
Abo
ve T
hres
hold
(ms)
0
0.2
0.4
0.6
0.8
1
1.2
1.4
Immediate
Islanded
Immediate Islanded100
110
120
130
140
150
160
Max
imum
Ove
rvol
tage
(% n
omin
al)
Test DataAverages
Immediate Islanded10
15
20
25
30
35
Trip
Tim
es (m
s)
Test DataAverages
This report is available at no cost from the National Renewable Energy Laboratory (NREL) at www.nrel.gov/publications.
45
Figure 48 shows a typical GFO test of Inverter 1 using test Version 2 (AI enabled). Qualitatively the waveforms are very similar to tests of the same inverter using Version 1 (e.g. Figure 17), as were all Version 2 tests. The minor differences between the two test versions for this inverter are not apparent from visual comparison, but show up in statistical analysis, as seen in Figure 46 and Figure 47.
Figure 48: GFO test of Inverter 1 using test Version 2 (AI enabled) (SA1A0003).
3.9 Tests with Transformers When a transformer, especially a D:Y transformer, is inserted between the inverter and the fault location, the results of the GFO test are expected to differ from those described above in which little to no evidence of neutral shift was found. The tests described in this section examine that expectation.
Additional tests with Inverter 1 were performed with a Y:Y transformer (with neutral grounded on both sides) inserted between the inverter and the fault location. A second additional set of tests was also performed with a D:Y transformer between the inverter and the fault (with the delta on the fault side and the wye side grounded). The load neutral on the fault side was also grounded as in all tests, unless otherwise indicated. Only Inverter 1 was tested with transformers.
Unless otherwise indicated, all measurements in this section refer to the primary side of the transformer, when present (i.e. the grid side, which is also the faulted side in all cases). All tests with transformers were performed with the inverter’s voltage and frequency trip limits set wide, as shown in Table 21. The reason for using wide trip settings was to better observe the GFO behavior for as long as possible without the inverter tripping due to overvoltage. This becomes especially relevant when considering trip times with the D:Y transformer below. For these tests, the resonant RLC load was re-tuned for each combination of transformer type and inverter power factor, following the test procedure specified above, maintaining a circuit quality factor near to unity and minimizing the fundamental frequency current from the grid simulator, as in all tests.
Time (sec)
0.24 0.26 0.28 0.3 0.32 0.34 0.36 0.38
Vol
tage
(V) o
r Cur
rent
(A)
-600
-400
-200
0
200
400
600VinvA
IinvA
VinvB
IinvB
VinvC
IinvC
Aux
Vdc
110%
120%
130%
110%
120%
130%
This report is available at no cost from the National Renewable Energy Laboratory (NREL) at www.nrel.gov/publications.
46
Table 22 and Table 23 summarize the maximum and average total times above each of the voltage thresholds for the three power factor12 settings in the three transformer-related cases.13 The Y:Y transformer actually reduced the times spent at each overvoltage level slightly, likely because its impedance reduced the fault current during the initial spike. This effect aside, the Y:Y transformer had negligible impact on total overvoltage durations. The D:Y transformer on the other hand greatly increased total overvoltage durations, especially at unity and lagging power factors, as seen in Figure 49. This is as expected given that the transformer delta blocks the zero-sequence components of the faulted-side voltage, partially masking the fault and the overvoltage from the inverter, as seen in waveform plots later in this section. Note that overvoltage durations on the inverter side of the transformer, which are not included in the table or the figure, were very small in all cases (typically zero, and always below 2 ms). As expected, with the relaying presently included, the inverter did not react to the overvoltages occurring on the other side of the D:Y transformer.
Table 22: Maximum total time (ms) above each voltage threshold – transformers
12 The generator reference frame is used in this report: lagging power factor corresponds to sourcing reactive power, and leading power factor corresponds to sinking reactive power. 13 Note that, for Inverter 1, the table data for tests without transformers shown in this section differs slightly from the table data given in the above sections because in this section, tests with wide trip limits and tests with default trip limits are combined into one dataset that includes all tests without transformers, whereas in the above sections tests with wide trip limits and tests with default trip limits were shown separately.
This report is available at no cost from the National Renewable Energy Laboratory (NREL) at www.nrel.gov/publications.
47
Figure 49: Cumulative overvoltage durations for tests with and without transformers
Table 24 and Table 25 summarize the maximum and average continuous times above each of the voltage thresholds for the three power factor settings in the three transformer-related cases. Again, the Y:Y transformer reduced the times spent at each overvoltage level slightly, likely by reducing fault current during the initial voltage spike. This effect aside, the Y:Y transformer had negligible impact on total overvoltage durations. The D:Y transformer increased maximum continuous overvoltage durations, especially at unity and lagging power factors, but not nearly to the same degree that it increased the cumulative overvoltage times. All continuous overvoltage durations here remained in the single-digit milliseconds or below. Figure 50 displays these effects visually.
Table 24: Maximum continuous time (ms) above each voltage threshold with and without transformers
This report is available at no cost from the National Renewable Energy Laboratory (NREL) at www.nrel.gov/publications.
48
Figure 50: Continuous overvoltage durations for tests with and without transformers
Maximum overvoltages for each test are shown in Figure 51. The Y:Y transformer consistently reduced maximum overvoltages by reducing the fault current. The D:Y transformer had little effect on maximum overvoltage levels, in contrast to its notable effect on cumulative overvoltage times.
Figure 51: Peak overvoltages for tests with and without transformers
Figure 52 shows measured trip times for tests with and without transformers at each power factor setting. Tests without a transformer and tests with a Y:Y transformer had consistently short trip times because in both cases the inverter was able to detect the fault (or the resulting voltage dynamics) easily and disconnect. In the D:Y transformer tests, the run-on times were significantly longer: roughly 600-700 ms in the unity and lagging power factor cases, and just
This report is available at no cost from the National Renewable Energy Laboratory (NREL) at www.nrel.gov/publications.
49
under 10 seconds in the leading power factor case. Recall that the inverter had anti-islanding controls disabled; this 10-second run-on time was reduced to just 30-40 ms in additional tests run with AI enabled, as it is in all grid-connected systems. In addition, the 10-second run-on itself is dictated by the widened frequency disconnection time, which was set to 10 seconds.
Figure 52: Trip times for tests with and without transformers
Several example waveforms from tests with transformers are presented below. Figure 53 shows a unity power factor test with a Y:Y transformer. Following the initial voltage spike, the inverter ran with voltages near nominal on the unfaulted phases on both sides of the transformer for two line cycles. This result was typical of all Y:Y transformer tests, regardless of power factor.
This report is available at no cost from the National Renewable Energy Laboratory (NREL) at www.nrel.gov/publications.
50
Figure 53: Typical unity power factor test with Y:Y transformer (SA_Y0002)
Figure 54 shows the symmetrical components of the voltage on both sides of the transformer. In both locations there is no zero sequence component, reflecting the fact that the two unfaulted phases are held nearly 180 degrees apart by the inverter controls following the fault, as seen in Figure 53. The positive and negative sequences both peak between 0.55 and 0.6 pu following the fault.
2.2 2.25 2.3 2.35 2.4-600
-400
-200
0
200
400
600Primary (grid) side of transformer
Time (sec)
Vol
tage
(V) o
r Cur
rent
(A)
VinvAIinvAVinvBIinvBVinvCIinvCAux110%120%130%
2.2 2.25 2.3 2.35 2.4-600
-400
-200
0
200
400
600Secondary (inverter) side of transformer
Time (sec)
Vol
tage
(V) o
r Cur
rent
(A)
VinvAIinvAVinvBIinvBVinvCIinvCAuxVdc110%120%130%
This report is available at no cost from the National Renewable Energy Laboratory (NREL) at www.nrel.gov/publications.
51
Figure 54: Symmetrical components of a typical unity power factor test with Y:Y transformer (SA_Y0002)
A test with lagging power factor and D:Y transformer is shown in Figure 55. On the grid side of the transformer, the two unfaulted phases (B and C) ran at above-nominal voltages (roughly 105% and 120%, respectively) for about 650 ms. On the inverter side, the two phases that were transformer-coupled to the faulted line ran at about two thirds of nominal voltage, while the third phase, phase C, ran at nearly 120% above nominal. Further investigation would be needed to determine why the inverter shut down consistently around 650 ms. The symmetrical components of the voltage from the same test are shown in Figure 56. On the grid side of the transformer, both negative and zero sequence components arise following the fault and hold relatively steady around 0.38 pu until the inverter disconnects, while the positive sequence falls to roughly 0.75 pu. The symmetrical components have roughly the same magnitudes on the inverter side except that the zero sequence component is not present because the transformer used in this experiment is acting as a grounding transformer on that side. This result was typical of D:Y tests with both lagging and unity power factors.
Time (sec)
2.1 2.2 2.3 2.4 2.5 2.6 2.7 2.8
sequ
ence
(pu)
0
0.5
1Primary (grid) side of transformer
positive
negative
zero
Time (sec)
2.1 2.2 2.3 2.4 2.5 2.6 2.7 2.8
sequ
ence
(pu)
0
0.5
1
1.5Secondary (inverter) side of transformer
positive
negative
zero
This report is available at no cost from the National Renewable Energy Laboratory (NREL) at www.nrel.gov/publications.
52
Figure 55: Typical lagging power factor test with D:Y transformer (SAOD0000)
2.2 2.3 2.4 2.5 2.6 2.7 2.8 2.9 3 3.1 3.2-600
-400
-200
0
200
400
600Primary (grid) side of transformer
Time (sec)
Vol
tage
(V) o
r Cur
rent
(A)
VinvAIinvAVinvBIinvBVinvCIinvCAux110%120%130%
2.2 2.3 2.4 2.5 2.6 2.7 2.8 2.9 3 3.1 3.2-600
-400
-200
0
200
400
600Secondary (inverter) side of transformer
Time (sec)
Vol
tage
(V) o
r Cur
rent
(A)
VinvAIinvAVinvBIinvBVinvCIinvCAuxVdc110%120%130%
This report is available at no cost from the National Renewable Energy Laboratory (NREL) at www.nrel.gov/publications.
53
Figure 56: Symmetrical voltage components for a typical lagging power factor test with D:Y transformer
(SAOD0000)
Figure 55 shows that there is a similar level of overvoltage on the transformer secondary as on the primary, in spite of the fact that this transformer acts as a grounding transformer to the circuit on its secondary side. This is because of the impact of the negative sequence component on the overvoltage, and the fact that the grounding transformer has no impact on the negative sequence voltage. Also, additional results described below indicate that simply enabling the inverter’s anti-islanding controls significantly reduces the duration of any overvoltage in tests such as this. A test with leading power factor and D:Y transformer is shown in Figure 57, and Figure 58 shows a close-up of the time near the fault in the same test. On the grid side of the transformer, the two unfaulted phases (A and C) ran at near-nominal voltages for just under 10 seconds, one just above nominal magnitude and the other just below. On the inverter side, the two phases that were transformer-coupled to the faulted line ran at about two thirds of nominal voltage, while the third phase, phase A, ran close to nominal voltage. This result was typical of D:Y tests with leading power factors. The symmetrical voltage components for this test, which are not shown here, are similar to those in Figure 56 but with slightly lower magnitudes.
Time (sec)
2.2 2.3 2.4 2.5 2.6 2.7 2.8 2.9 3
Seq
uenc
e (p
u)
0
0.5
1Primary (grid) side of transformer
positive
negative
zero
Time (sec)
2.2 2.3 2.4 2.5 2.6 2.7 2.8 2.9 3
Seq
uenc
e (p
u)
0
0.5
1
1.5Secondary (inverter) side of transformer
positive
negative
zero
This report is available at no cost from the National Renewable Energy Laboratory (NREL) at www.nrel.gov/publications.
54
Figure 57: Typical leading power factor test with D:Y transformer (SBUD0001)
2 3 4 5 6 7 8 9 10 11 12-600
-400
-200
0
200
400
600Primary (grid) side of transformer
Time (sec)
Vol
tage
(V) o
r Cur
rent
(A)
VinvAIinvAVinvBIinvBVinvCIinvCAux110%120%130%
2 3 4 5 6 7 8 9 10 11 12-600
-400
-200
0
200
400
600Secondary (inverter) side of transformer
Time (sec)
Vol
tage
(V) o
r Cur
rent
(A)
VinvAIinvAVinvBIinvBVinvCIinvCAuxVdc110%120%130%
This report is available at no cost from the National Renewable Energy Laboratory (NREL) at www.nrel.gov/publications.
55
Figure 58: Typical leading power factor test with D:Y transformer, zoomed in (SBUD0001)
The D:Y tests at unity and lagging power factor described above could be interpreted as violating the ITIC curve at the 120% level. As noted above, it is not clear that the ITIC curve is the appropriate criteria, and this test was not intended as a certification test. Nevertheless, this result could raise concerns for some stakeholders. To alleviate possible concerns, additional tests with anti-islanding controls enabled were conducted using test Version 2. Those tests produced much-reduced overvoltage durations. Table 26 and Table 27 compare the total durations above each voltage threshold for D:Y transformer tests with and without AI controls enabled. Figure 59 compares the total overvoltage times and maximum continuous overvoltage times for tests with AI disabled and test with AI enabled.
Table 26: Maximum total time (ms) above each voltage threshold with D:Y transformer – AI off and AI on
Figure 59: Comparison of overvoltage durations with AI disabled and enabled, with D:Y transformer
Figure 60 compares peak overvoltage levels and trip times with AI disabled versus AI enabled with the D:Y transformer. AI had little effect on peak overvoltages but significantly reduced the longest trip times.
Figure 60: Comparison of peak overvoltages and trip times with AI disabled and enabled, with D:Y
transformer
The next three figures show typical test waveforms using test Version 2 (AI enabled) with a D:Y transformer. At unity power factor there were two distinct types of response, shown in Figure 61 and Figure 62. In Figure 61, the inverter exported current for about three cycles after the fault and the voltages on the unfaulted phases were slightly outside the 110% threshold. In Figure 62,
This report is available at no cost from the National Renewable Energy Laboratory (NREL) at www.nrel.gov/publications.
57
the inverter continued to operate for over 600 ms, similarly to the tests with AI disabled except with a lower voltage magnitude. The response shown in Figure 62 was less common, occurring only twice out of 11 tests.
Figure 61: Typical unity power factor test with D:Y transformer and AI enabled (AY1D0011)
0.25 0.3 0.35 0.4-600
-400
-200
0
200
400
600Primary (grid) side of transformer
Time (sec)
Vol
tage
(V) o
r Cur
rent
(A)
VinvAIinvAVinvBIinvBVinvCIinvCAux110%120%130%
0.25 0.3 0.35 0.4-600
-400
-200
0
200
400
600Secondary (inverter) side of transformer
Time (sec)
Vol
tage
(V) o
r Cur
rent
(A)
VinvAIinvAVinvBIinvBVinvCIinvCAuxVdc110%120%130%
This report is available at no cost from the National Renewable Energy Laboratory (NREL) at www.nrel.gov/publications.
58
Figure 62: A less common response type for unity power factor tests with D:Y transformer and AI enabled
(AY1D0008) The waveform shown in Figure 63 is typical of both leading and lagging power factor tests with D:Y transformer and AI enabled. Phase B was shorted. On the grid side, phase A began to grow in magnitude, producing overvoltages approaching 130%, while phase C began to decrease until the inverter disconnected after about 2 cycles. On the inverter side the phases were unbalanced and shifting in magnitude.
0.2 0.3 0.4 0.5 0.6 0.7 0.8 0.9 1-600
-400
-200
0
200
400
600Primary (grid) side of transformer
Time (sec)
Vol
tage
(V) o
r Cur
rent
(A)
VinvAIinvAVinvBIinvBVinvCIinvCAux110%120%130%
0.2 0.3 0.4 0.5 0.6 0.7 0.8 0.9 1-600
-400
-200
0
200
400
600Secondary (inverter) side of transformer
Time (sec)
Vol
tage
(V) o
r Cur
rent
(A)
VinvAIinvAVinvBIinvBVinvCIinvCAuxVdc110%120%130%
This report is available at no cost from the National Renewable Energy Laboratory (NREL) at www.nrel.gov/publications.
59
Figure 63: A typical lagging power factor test with D:Y transformer and AI enabled (ADOD0006)
The symmetrical components of voltage for tests with anti-islanding enabled are qualitatively similar to those shown for tests with anti-islanding disabled, and are not shown here. 3.10 Tests with Delta-connected Load GFO is typically of concern with wye-connected loads because those are the loads that can be damaged by sustained neutral shift, which exposes them to line-line voltages. However, typical feeders contain some delta-connected loads as well, and systems including delta loads are more prone to neutral shift in ground fault situations. Whereas a current source connected to a wye load is not expected to produce significant GFO in the case of a ground fault, a current source connected to a delta load would indeed produce a neutral shift GFO. While a delta load itself is rated for the full line-line voltage and hence would not be damaged by a neutral shift GFO, a wye-connected load on the same system could be damaged. At the same time, the wye-connected load would likely reduce the magnitude of a GFO. A full analysis of ground fault response on a feeder containing significant current-source generation as well as both wye and delta loads is beyond the scope of this report. However, we do present some limited test results with delta-connected loads in this section. For these tests, the resonant RLC load was re-tuned for each combination of transformer type and inverter power factor, following the test procedure specified above, maintaining a circuit quality factor near to unity and minimizing the fundamental frequency current from the grid simulator, as in all tests.
0.25 0.3 0.35 0.4-600
-400
-200
0
200
400
600Primary (grid) side of transformer
Time (sec)
Vol
tage
(V) o
r Cur
rent
(A)
VinvAIinvAVinvBIinvBVinvCIinvCAux110%120%130%
0.25 0.3 0.35 0.4-600
-400
-200
0
200
400
600Secondary (inverter) side of transformer
Time (sec)
Vol
tage
(V) o
r Cur
rent
(A)
VinvAIinvAVinvBIinvBVinvCIinvCAuxVdc110%120%130%
This report is available at no cost from the National Renewable Energy Laboratory (NREL) at www.nrel.gov/publications.
60
All delta load tests were performed with Inverter 1 using the wide voltage and frequency trip settings shown in Table 21. We first present results using test Version 1 (AI disabled), many of which resulted in high overvoltages and long run-on times. We then present results from test Version 2 (AI enabled) to demonstrate the effect of normal AI controls on the ground fault response. Note that with a delta-connected load, island tuning is more difficult because changing the R, L, or C value on any phase also affects the other phases. In many cases the resulting island, while stable, had significant variation in voltage magnitude between phases. Maximum and average total times above each voltage threshold for delta load tests are shown in Table 28 and Table 29, respectively. No tests were conducted with Y:Y transformer at lagging power factor and delta load due to time limitations. For tests with D:Y transformer and delta
phases on the delta side of the transformer and no overvoltage on the inverter side (though it is important to recall that AI controls were disabled).
Table 28: Maximum total time (ms) above each voltage threshold with delta load, with AI disabled
1.0 1.53 1.30 1.06 0.82 0.25 0.13 0.08 0.06 continuous continuous continuous continuous 0.8 leading 1.98 1.64 1.33 0.98 0.26 0.15 0.11 0.06 continuous continuous continuous continuous 0.8 lagging 3.34 2.37 0.96 0.51 na na na na continuous continuous continuous continuous
Maxima and averages of the maximum continuous time above each voltage threshold across several tests with delta load are shown in Table 30 and Table 31, respectively. As mentioned above, the inverter ran continuously in delta load tests with the D:Y transformer, so the maximum continuous time at each threshold for those tests simply represents the maximum in the recorded window, as shown in the waveform plots below.
14 The generator reference frame is used in this report: lagging power factor corresponds to ourcing reactive power, and leading power factor corresponds to sinking reactive power.
This report is available at no cost from the National Renewable Energy Laboratory (NREL) at www.nrel.gov/publications.
61
Table 30: Maximum continuous time (ms) above each voltage threshold with delta load, with AI disabled
1.0 1.41 1.21 1.00 0.73 0.19 0.13 0.08 0.06 4.69 4.30 3.88 3.42 0.8 leading 1.80 1.51 1.23 0.90 0.22 0.15 0.11 0.06 4.65 4.25 3.75 3.25 0.8 lagging 2.07 1.45 0.83 0.47 na na na na 4.80 4.40 3.99 3.53
Figure 64 shows a typical delta load test with D:Y transformer, and Figure 65 shows the region immediately before and after the fault in the same test. On the delta side of the transformer, the two unfaulted line-neutral voltages ran in steady state near the line-line voltage magnitude following the fault, as expected. Also note the significant imbalance in voltage magnitudes on the delta side of the transformer prior to the fault. As mentioned above, this imbalance is characteristic of inverter-load islands with delta load, partially due to small imbalances between load phases (though the load is nominally tuned the same on all phases in this test) and partially due to the lack of a strong neutral reference for the system, which is only connected to neutral through the inverter. Hence maximum recorded line to neutral overvoltages are partially due to this pre-existing imbalance rather than to the inverter’s ground fault response. We were not able to remove this imbalance by adjusting load tuning, though attempts to do so were not exhaustive. This inherent imbalance makes it somewhat difficult to create a stable island with a delta load. Note that on the inverter side of the transformer all three voltages remained at their nominal settings both before and after the fault, with no transient effects. This test was run at unity power factor, but was typical of all delta load, D:Y transformer tests regardless of power factor.
This report is available at no cost from the National Renewable Energy Laboratory (NREL) at www.nrel.gov/publications.
62
Figure 64: A typical test with D:Y transformer and delta load, with AI disabled (S_DD0001)
2.5 3 3.5 4 4.5-1000
-500
0
500
1000Primary (grid) side of transformer
Time (sec)
Vol
tage
(V) o
r Cur
rent
(A)
VinvAIinvAVinvBIinvBVinvCIinvCAux110%120%130%
2.5 3 3.5 4 4.5-600
-400
-200
0
200
400
600Secondary (inverter) side of transformer
Time (sec)
Vol
tage
(V) o
r Cur
rent
(A)
VinvAIinvAVinvBIinvBVinvCIinvCAuxVdc110%120%130%
This report is available at no cost from the National Renewable Energy Laboratory (NREL) at www.nrel.gov/publications.
63
Figure 65: A typical test with D:Y transformer and delta load, with AI disabled (S_DD0001)
Figure 66 shows the symmetrical components for the test shown above. As expected, the delta-side voltages show a large zero sequence component, which is indicative of the “traditional” derived neutral shift GFOV mechanism. There is a negligible negative sequence component on the delta side because the three-phase load is well-balanced, and thus there ends up being only a positive sequence component on the Yg side.
2.25 2.3 2.35 2.4 2.45 2.5 2.55 2.6-1000
-500
0
500
1000Primary (grid) side of transformer
Time (sec)
Vol
tage
(V) o
r Cur
rent
(A)
VinvAIinvAVinvBIinvBVinvCIinvCAux110%120%130%
2.25 2.3 2.35 2.4 2.45 2.5 2.55 2.6-600
-400
-200
0
200
400
600Secondary (inverter) side of transformer
Time (sec)
Vol
tage
(V) o
r Cur
rent
(A)
VinvAIinvAVinvBIinvBVinvCIinvCAuxVdc110%120%130%
This report is available at no cost from the National Renewable Energy Laboratory (NREL) at www.nrel.gov/publications.
64
Figure 66: Symmetrical components during a typical test with D:Y transformer and delta load, with AI
disabled (S_DD0001) A typical test with no transformer and delta load is shown in Figure 67. Immediately after the fault, the two unfaulted phases began to shift towards high overvoltage levels immediately following the fault, but the inverter shut down almost immediately, as evidenced by the current turn-off immediately after the fault. With no D:Y transformer to block the zero sequence and mask the neutral shift, the inverter responded to the overvoltage by turning off. Most of the measured time at overvoltage actually occurred after the inverter had disconnected: stored energy in the RLC circuit resonated briefly even after the inverter had ceased to export power. Also note that, as in the D:Y test shown above, the voltage magnitudes were significantly unbalanced in the steady-state island preceding the fault.
Time (sec)
2.2 2.3 2.4 2.5 2.6 2.7 2.8 2.9 3
Seq
uenc
e (p
u)
0
0.5
1
1.5Primary (grid) side of transformer
positive
negative
zero
Time (sec)
2.2 2.3 2.4 2.5 2.6 2.7 2.8 2.9 3
Seq
uenc
e (p
u)
0
0.5
1
1.5Secondary (inverter) side of transformer
positive
negative
zero
This report is available at no cost from the National Renewable Energy Laboratory (NREL) at www.nrel.gov/publications.
65
Figure 67: A typical test with no transformer and delta load, with AI disabled (S1U_0003)
Additional tests were conducted with the D:Y transformer and delta-connected load, but with AI controls enabled. As expected, with AI enabled the inverter no longer ran continuously following the fault. However, it did still produce significant total overvoltage durations. While some of the overvoltage durations found in these tests with AI on, delta load, and D:Y transformer may still appear concerning, it is important to recall that these tests involved a combination of two scenarios that are both fairly unusual: a resonant RLC load with high quality factor, and an island consisting of only delta-connected load. The probability of both of these things occurring on a feeder simultaneously followed by a ground fault and grid disconnection that does not disturb the island balance is low. However it is worth investigating in future work whether a combination of delta- and wye-connected loads could lead to potentially damaging overvoltages. Table 32: Maximum total time (ms) above each voltage threshold with D:Y transformer and delta load – AI
3.11 Line to Line Voltage Analysis The preceding results focus on line to neutral voltages, which are classically of concern in three-phase, four-wire ground fault scenarios. This section analyzes an additional overvoltage mechanism that can occur in such scenarios when they include a three-phase current-controlled inverter with an outer power control loop. The vast majority of grid-interactive PV inverters and many storage inverters fall into this category. The overvoltage mechanism, which will be explained and analyzed in detail in an upcoming publication [8], is this: after the fault, the voltage on the faulted phase is nearly zero, so the power on that phase is also near zero. Most three-phase inverters will attempt to maintain relatively constant total AC power output during the fault, so they will increase their output phase currents to compensate for the loss of power export on the faulted phase. This increase in phase currents results in increasing the output power on the unfaulted phases, leading to some degree of transient overvoltage. This TOV will appear in both the line to neutral and the line to line voltages, in contrast to classic GFO. Because this TOV is due to the formation of an inverter-load island where the inverter power exceeds the available load power, it is in fact a subset of LRO. This section analyzes the line to line voltages in several of the scenarios tested above. Figure 68 shows the total line-line overvoltage durations for all wye-load tests of Inverter 1 without transformers. In unity power factor and lagging15 power factor tests, brief overvoltages totaling up to about 2.5 ms at the 110% level were typical, with no overvoltage at higher levels, and no overvoltage for tests at leading power factor. Because Inverter 1 is a fairly typical three-phase inverter, this result is expected. Figure 68 also demonstrates that the use of wide voltage and current trip settings did not exacerbate line to line overvoltages; the overvoltage durations are determined by the time it takes the inverter to recognize the fault condition and disconnect, rather than by the voltage and frequency trip settings. Notably, the brief voltage spike at the time of the fault does not show up in line to line voltages, as expected given than it results from a sharp spike in line to neutral current during the fault. The line to line overvoltages were smaller in magnitude than the line to neutral overvoltages, largely due to the absence of this brief voltage spike.
15 The generator reference frame is used in this report: lagging power factor corresponds to sourcing reactive power, and leading power factor corresponds to sinking reactive power.
This report is available at no cost from the National Renewable Energy Laboratory (NREL) at www.nrel.gov/publications.
67
Figure 68: Line to line overvoltages for Inverter 1, with and without voltage and frequency ride-through
It is also worth noting that line to neutral overvoltages in the same test series (seen in Figure 41) can be partially explained as the cumulative effect of
overvoltages due to power rejection from the unfaulted phases, as visible in line-line voltages (Figure 68).
overvoltages due to the initial voltage spike. The remaining portion of overvoltage that is not explained by these two effects appears to be due to unbalance between the phases and distortion of the voltage waveform due to the fault transient, rather than due to the classic GFO behavior typical of voltage sources. Figure 69 shows typical line-line voltage waveforms for Inverter 1. Note that because the inverter only operates for about two cycles following the fault, and because the voltage waveforms are distorted due to the fault, it is difficult to perceive the quasi-steady-state line to line overvoltage that would be expected to occur if the inverter’s controls did not cease power exportation.
Overvoltage Level (Line-Line, % Nominal)
>110% >120% >130% >140%
Tota
l Tim
e A
bove
Thr
esho
ld (m
s)
0
0.5
1
1.5
2
2.5
1.0 | Default
0.8 Leading | Default
0.8 Lagging | Default
1.0 | Wide
0.8 Leading | Wide
0.8 Lagging | Wide
This report is available at no cost from the National Renewable Energy Laboratory (NREL) at www.nrel.gov/publications.
68
Figure 69: Line-line voltages in a typical test with no transformer (SCO0005).
Figure 70 shows another fairly typical test of Inverter 1, with voltage and current shown on separate scales, and both line to line and line to neutral voltages shown. On this scale it is possible to see that the current magnitude is beginning to increase on all three phases, leading to slight overvoltages on the unfaulted phases (and between the unfaulted lines) for the two cycles before the inverter shuts down, though distortion of the waveforms makes the effect difficult to see. This demonstrates the mechanism of power rejection to the unfaulted phases.
Time (sec)
2.24 2.26 2.28 2.3 2.32 2.34 2.36 2.38
Volta
ge (V
) or C
urre
nt (A
)
-1000
-500
0
500
1000
VAB
IA
VBC
IB
VCA
IC
Aux
Vdc
110%
120%
130%
This report is available at no cost from the National Renewable Energy Laboratory (NREL) at www.nrel.gov/publications.
69
Figure 70: Line-line voltages showing slightly increasing voltage and current magnitudes (SCO0003)
In contrast to Inverter 1, Inverter 2 is not a typical three-phase inverter, but rather consists of three somewhat-independently controlled single-phase inverters in the same enclosure, connected in wye. Hence we would not necessarily expect this inverter to maintain constant output power following a single-phase fault by increasing current on the unfaulted phases. In addition, this unit can also source negative and zero-sequence current. This does indeed turn out to be the case: in the majority of tests the inverter did not show any line to line overvoltage, as seen in Figure 71. Line to line voltage waveforms from a typical test are shown in Figure 72. However in two tests (out of 63 total), brief line to line overvoltages did appear. These two tests skew the averages shown in Figure 71; all other tests showed no line to line overvoltage. These overvoltages were not due to power rejection from the faulted phase, but rather to fault-induced phase shifts between the voltage waveforms lasting for a few line cycles. An example of this type of phase-shift-induced line to line overvoltage was shown previously in Figure 33, and Figure 29 showed the line to neutral voltages for the same test. In addition, Figure 30 showed the symmetrical components, which included significant negative and zero sequence components.
Time (sec)
2.26 2.28 2.3 2.32 2.34 2.36 2.38
L-L
Vol
tage
(V)
-1000
0
1000
vAB
vBC
vCA
2.26 2.28 2.3 2.32 2.34 2.36 2.38
L-N
Vol
tage
(V)
-500
0
500
vA
vB
vC
2.26 2.28 2.3 2.32 2.34 2.36 2.38
Cur
rent
(A)
-50
0
50
IA
IB
IC
This report is available at no cost from the National Renewable Energy Laboratory (NREL) at www.nrel.gov/publications.
70
Figure 71: Line to line overvoltages for Inverter 2
Figure 72: Line-line voltages for a typical test of Inverter 2 (EC_0005). Note that currents and voltages
remain near-nominal, in contrast to those of Inverter 1. Also note that DC current falls and acquires a strong 120 Hz component after the fault because one of the phases (phase C) is no longer exporting power.
In summary, all overvoltages from Inverter 2 were due either to the initial current spike or brief fault-induced imbalances between phases, not to a classic GFO response.
Overvoltage Level (Line-Line, % Nominal)
>110% >120% >130% >140%
Tota
l Tim
e A
bove
Thr
esho
ld (m
s)
0
2
4
6
8
10
1.0
0.8 Leading
0.8 Lagging
Time (sec)
2.25 2.3 2.35 2.4 2.45 2.5 2.55Vol
tage
(V) o
r Cur
rent
(A)
-1000
-500
0
500
1000
VAB
VBC
VCA
Aux
Vdc
110%
120%
130%
Time (sec)
2.25 2.3 2.35 2.4 2.45 2.5 2.55Vol
tage
(V) o
r Cur
rent
(A)
-40
-20
0
20
40
IinvA
IinvB
IinvC
Idc
This report is available at no cost from the National Renewable Energy Laboratory (NREL) at www.nrel.gov/publications.
71
Inverter 3, which was actually an assembly of single-phase delta-connected microinverters, showed no line-line overvoltages in any test. This is emphasized by Figure 73, which shows that peak line to line voltages never exceeded even 102% of nominal. This is as expected for an assembly of independent single-phase inverters, especially given that two thirds of the inverters (those connected to the faulted phase) shut down almost immediately following the fault, as noted previously. In summary, this inverter showed no line to line overvoltage, and all line to neutral overvoltages for this inverter were due solely to the initial spike at the time of the fault.
Figure 73: Peak line-line voltages for Inverter 3
For tests with transformers (all of which used Inverter 1), a summary of cumulative line to line overvoltage times is shown in Figure 74, and peak line to line overvoltage levels are shown in Figure 75. In both figures, tests with delta-wye transformers are shown both with AI disabled and with AI enabled, to emphasize that worst-case overvoltage durations are mitigated by having AI on. All line to line overvoltages tended to be low and brief, especially for tests with AI enabled. The maximum line to line overvoltage in any test was 124%.
Inverter Power Factor
1.0Max
imum
Ove
rvol
tage
(Lin
e-Li
ne, %
nom
inal
)
100
100.5
101
101.5
Test Data
Averages
This report is available at no cost from the National Renewable Energy Laboratory (NREL) at www.nrel.gov/publications.
72
Figure 74: Cumulative line to line overvoltage times for tests with transformers. Tests with delta-wye
transformers are shown both with AI disabled and AI enabled, to emphasize that worst-case overvoltages are mitigated by having AI on.
Figure 75: Peak line to line overvoltages for tests with transformers
The delta-wye transformer tests with AI disabled and with the load connected phase-neutral, while not indicative of the real situation in the field, do provide the opportunity to view the inverter’s ground fault response more fully. A typical example of such a response is shown in Figure 76, with voltages and current on each side of the transformer shown separately. Note that while both sides of the transformer show persistent above-nominal currents, only the side with the fault shows above-nominal line to line voltage, and only on one phase. Also, the peak overvoltage occurs during a slight overshoot of the current magnitude around time 2.4 s, and
This report is available at no cost from the National Renewable Energy Laboratory (NREL) at www.nrel.gov/publications.
73
settles to a level just below the 110% threshold for the remainder of the test before the inverter shuts down. Hence we can conclude that while the phenomenon of line to line overvoltage due to power rejection to the unfaulted phases in three-phase current controlled inverters does exist, the magnitudes of the overvoltage are not particularly high in the scenarios tested here.
Figure 76: Current and line to line voltage waveforms for a test with delta-wye transformer and AI disabled
(SD1D0004). Note the increase in current magnitudes at the inverter output due to power rejection to the unfaulted phases.
Time (sec)
2.3 2.4 2.5 2.6 2.7 2.8 2.9 3
Vol
tage
(V)
-1000
-500
0
500
1000Primary (grid) side of transformer
VAB
VBC
VCA
Aux
110%
120%
Time (sec)
2.3 2.4 2.5 2.6 2.7 2.8 2.9 3
Cur
rent
(A)
-50
0
50Primary (grid) side of transformer
IA
IB
IC
Time (sec)
2.3 2.4 2.5 2.6 2.7 2.8 2.9 3
Vol
tage
(V)
-1000
-500
0
500
1000Secondary (inverter) side of transformer
VinvAB
VinvBC
VinvCA
Aux
Vdc
110%
120%
Time (sec)
2.3 2.4 2.5 2.6 2.7 2.8 2.9 3
Cur
rent
(A)
-40
-20
0
20
40 Secondary (inverter) side of transformerIinvA
IinvB
IinvC
IDC
This report is available at no cost from the National Renewable Energy Laboratory (NREL) at www.nrel.gov/publications.
74
4 Conclusions and Future Work The ground fault overvoltage tests implemented at NREL in partnership with SolarCity succeeded in experimentally quantifying single-phase-to-ground fault responses of three commercially available grid-interactive inverters. These tests confirmed theoretical expectations that inverters will not cause the high, sustained overvoltages at their output terminals associated with neutral shift following a ground fault. These tests focused on scenarios where the generation to load ratio was balanced in order to observe the ground fault behavior in isolation, and in order to allow the inverter to remain connected for as long as possible following the ground fault. Note that in cases where the generation to load ratio is less than one, a combination of ground fault response and load rejection response (as characterized in [4], [5]) would be expected.
The tests also quantified the effects of transformers on ground fault overvoltage. When anti-islanding controls on the inverters were turned off, tests with delta-wye transformers tended to increase the magnitude and duration of overvoltages significantly, showing evidence of true neutral shift, as expected. However, these tests examined a scenario that will not occur in the field, where anti-islanding controls are always enabled. Thus, additional tests were performed with anti-islanding controls enabled (as they would be in the field). The results with anti-islanding controls enabled showed greatly reduced overvoltage durations compared to the tests with anti-islanding controls disabled. These results corroborate the theory that in ground fault situations, current-controlled inverters do not cause neutral shift GFO in the same way that synchronous machines can.
While the largest inverter power rating tested here was 20 kW, these results are expected to be broadly applicable to all current-controlled inverters, from microinverters to utility-scale inverters, as the physical effects in play are not functions of inverter size. Simulations to be presented in [8] will support this conclusion.
These tests also demonstrate an additional overvoltage mechanism occurring with three-phase inverters in following ground faults in which the power from the faulted phase is diverted to the unfaulted phases, causing a low-magnitude transient overvoltage. The theory behind this mechanism – and behind inverter ground fault response in general – will be further developed in an upcoming publication [8].
The test plan was based on one developed by FIGII through a consensus of various stakeholders. It was specifically designed to scientifically investigate inverter-driven GFO, and was not designed as a certification test. It was also not designed to exactly reproduce the range of load conditions and circuit configurations on real distribution feeders, which vary widely. Most importantly, the test was performed with the inverter’s island detection controls disabled whenever possible in order to isolate the ground fault response.
Because the test plan used here was not designed as a certification test, the results presented here should not be subjected to pass/fail criteria. Rather, the results presented here should be taken to indicate that current-controlled inverters (which are the vast majority of grid-interactive inverters) do not cause neutral-shift GFO at their terminals in the same way as synchronous machines, but that they can cause brief neutral-shift GFO when connected on the wye side of a delta-wye transformer. In this case, the GFO occurs only on the delta side, and the
This report is available at no cost from the National Renewable Energy Laboratory (NREL) at www.nrel.gov/publications.
75
duration of the GFO will likely depend on the specific inverter controls and on the details of the circuit. It was also shown that inverters do tend to cause GFO with delta-connected loads; intermediate combinations of wye and delta load were not investigated. Loads unbalanced between phases were also not investigated.
Future work on this topic should include development of inverter models that can be used to accurately simulate GFO scenarios of interest to utilities, inverter manufacturers, PV project developers, electricity end-users, and other stakeholders. The data presented in this report can be used to develop and validate those models. It is also worth investigating how other inverter types respond to ground faults through future analysis, simulation, and experimentation. In addition, the GFO test used here by design included only one type of load: an RLC load balanced to the generation source. Future work should investigate ground faults with inverters feeding other load types including unbalanced loads, varying generation:load ratios, and other classes of loads (ZIP-motor loads).
In addition, it would be reasonable to develop recommended practices for distribution-connected inverters with respect to GFO, as this report corroborates the expectation based on past theoretical work and simulations that existing practices developed for synchronous machines are not appropriate for inverters. Specifically, requiring effective grounding for inverters introduces extra costs but is not expected to mitigate inverter-driven GFO in many cases. It may be necessary to develop a test to certify that a given model of inverter is indeed a current-controlled inverter (or behaves as such), because it is possible to create grid-interactive voltage-controlled inverters, though they are quite uncommon at present.
This report is available at no cost from the National Renewable Energy Laboratory (NREL) at www.nrel.gov/publications.
76
References [1] P. Barker, “Overvoltage considerations in applying distributed resources on power
systems,” in 2002 IEEE Power Engineering Society Summer Meeting, 2002, vol. 1, pp. 109–114 vol.1.
[2] M. Ropp, “Inverter grounding and overvoltages,” IEEE PES General Meeting, Jul-2014.
[3] M. E. Ropp, M. Johnson, D. Schutz, and S. Cozine, “Effective grounding of distributed generation inverters may not mitigate transient and temporary overvoltage,” Western Protective Relay Conference, 2012.
[4] A. Nelson, A. Hoke, S. Chakraborty, J. Chebahtah, T. Wang, and B. Zimmerly, “Inverter Load Rejection Over-Voltage Testing,” NREL, TP-5D00-63510, Feb. 2015.
[5] A. Nelson, A. Hoke, S. Chakraborty, J. Chebahtah, T. Wang, B. Zimmerly, and M. Ropp, “Experimental Evaluation of Load Rejection Over-Voltage from Grid-Tied Solar Inverters,” IEEE Photovoltaics Specialists Conference (PVSC), 2015.
[6] “IEEE Standard C62.92 - IEEE Guide for the Application of Neutral Grounding in Electrical Utility Systems.” IEEE, 2000.
[7] “IEEE 142-2007 - IEEE Recommended Practice for Grounding of Industrial and Commercial Power Systems,” IEEE, 2007.
[8] M. Ropp, A. Hoke, S. Chakraborty, D. Schutz, C. Mouw, A. Nelson, T. Wang, J. Chebahtah, and M. McCarty, “Ground Fault Overvoltage with Inverter-Interfaced Distributed Resources,” Submitt. IEEE Trans. Power Deliv.
[9] “IEEE Standard 1547: Standard for Interconnecting Distributed Resources with Electric Power Systems,” IEEE, 2003.
[10] “IEEE Standard 1547.1: Standard for Interconnecting Distributed Resources with Electric Power Systems,” IEEE, 2003.
This report is available at no cost from the National Renewable Energy Laboratory (NREL) at www.nrel.gov/publications.


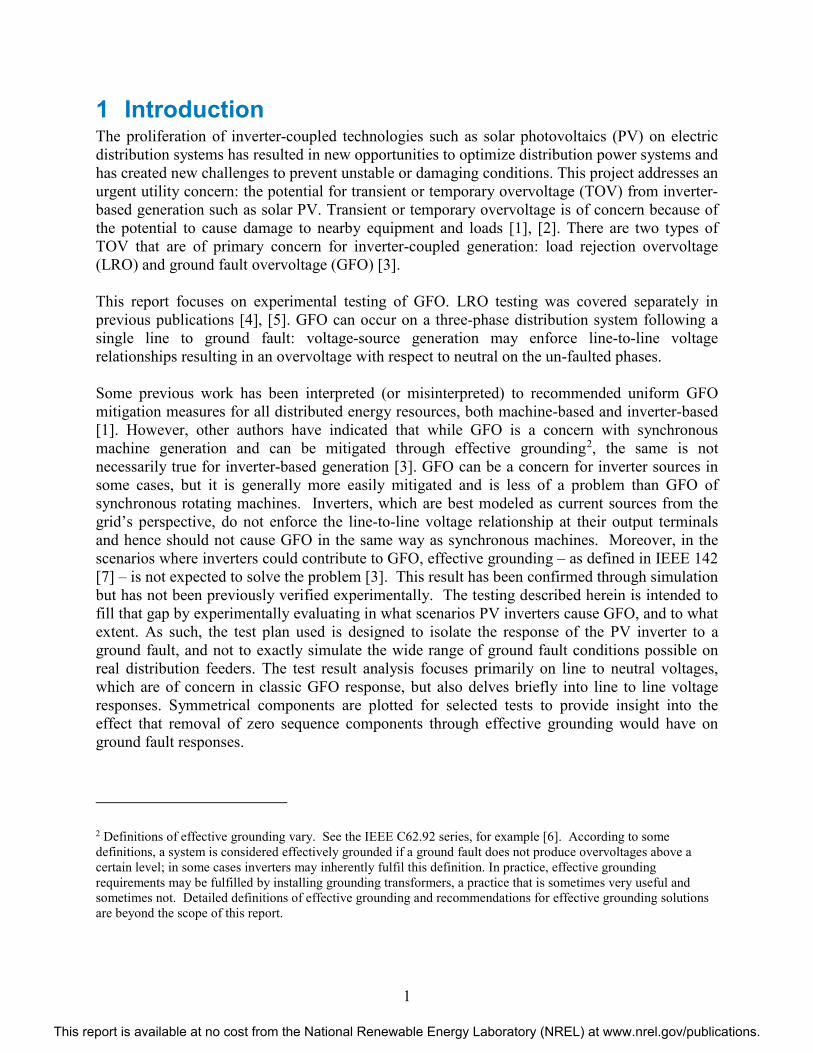

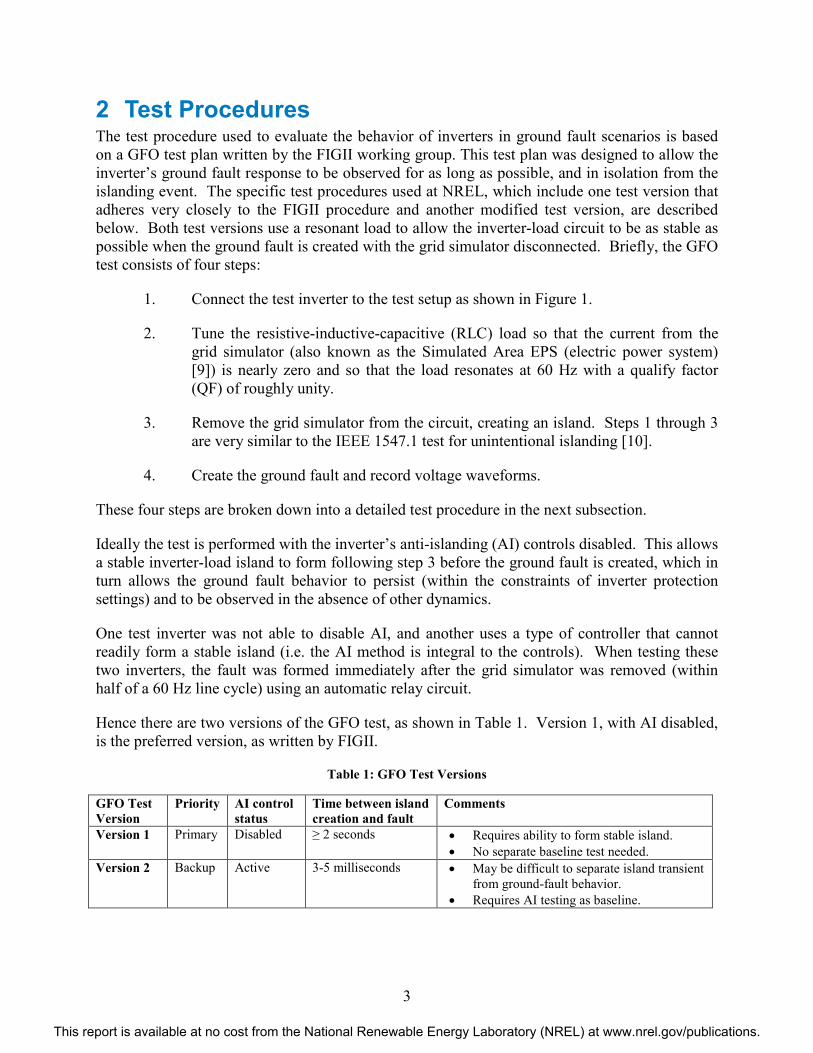
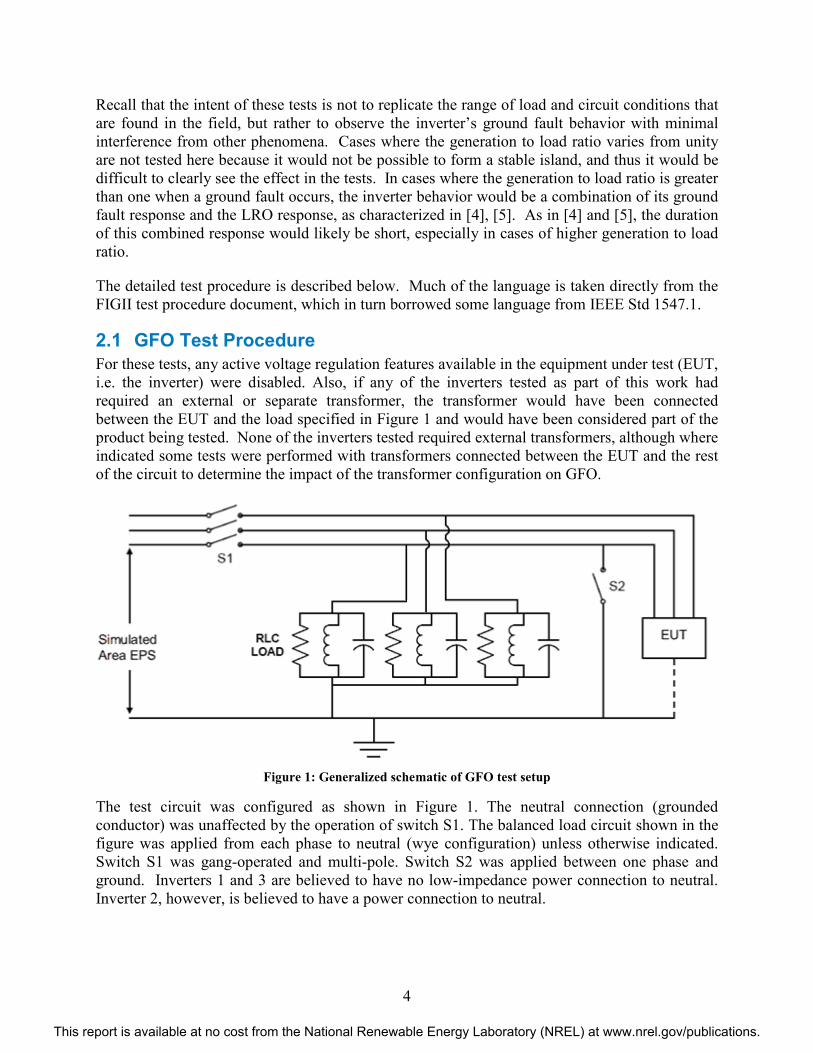

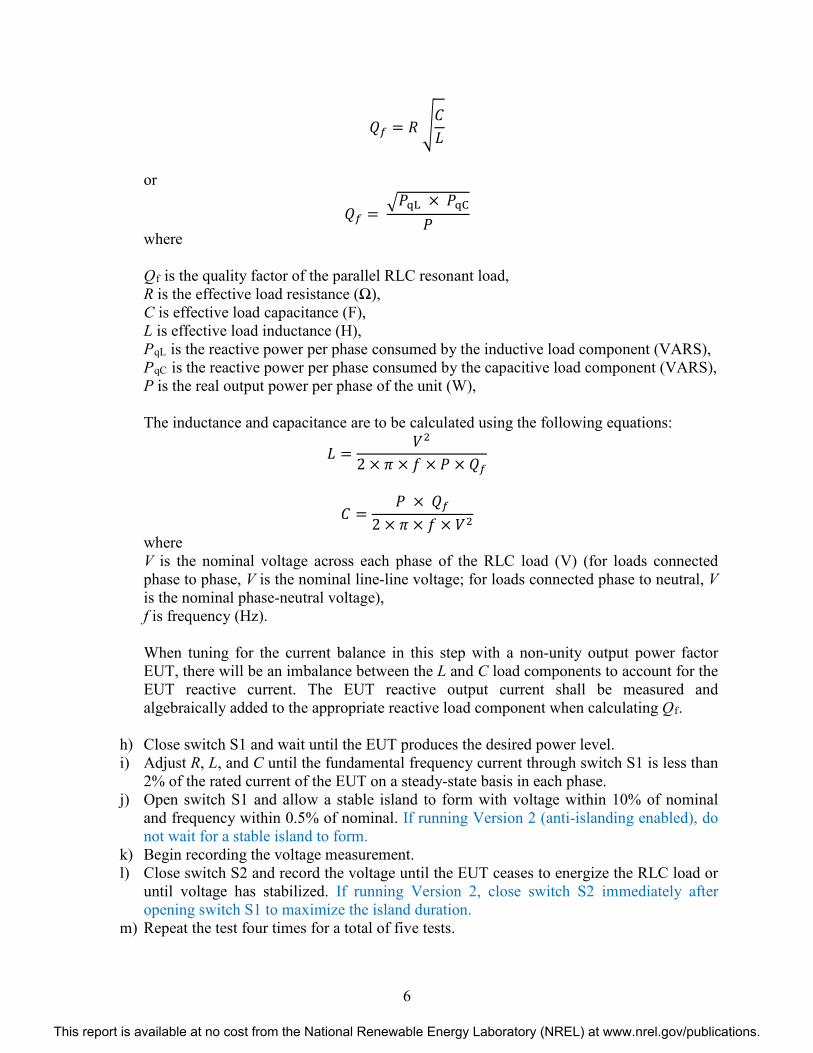
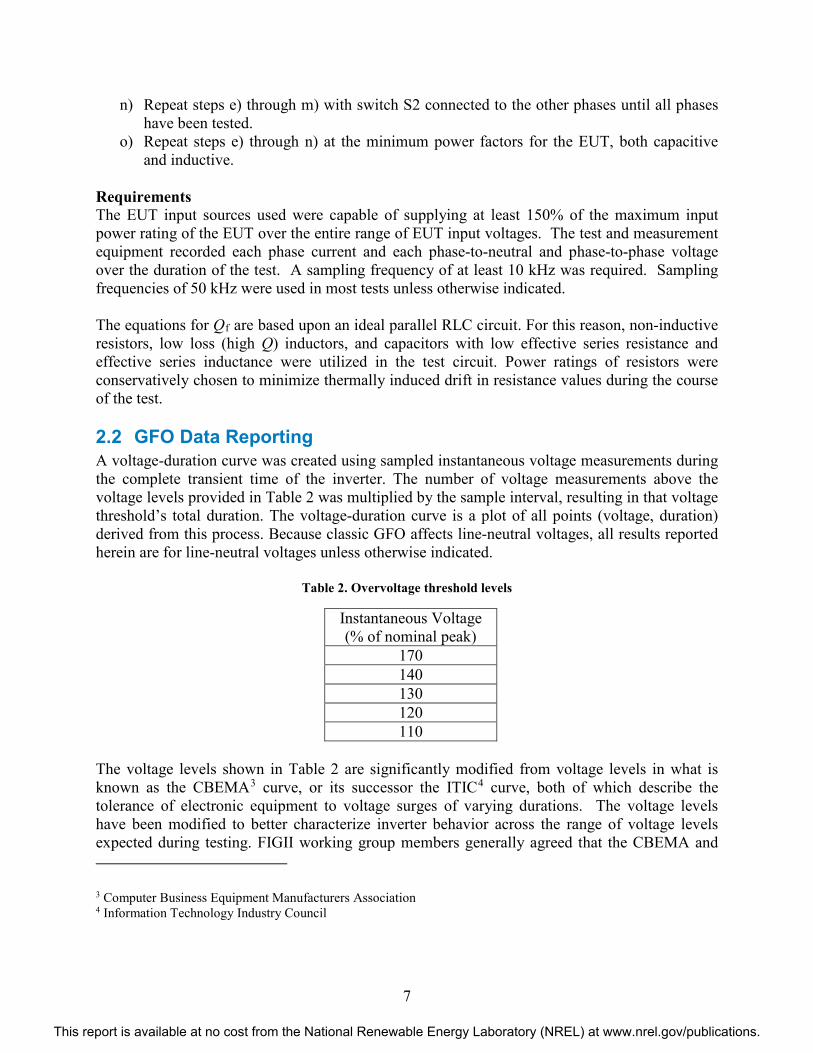

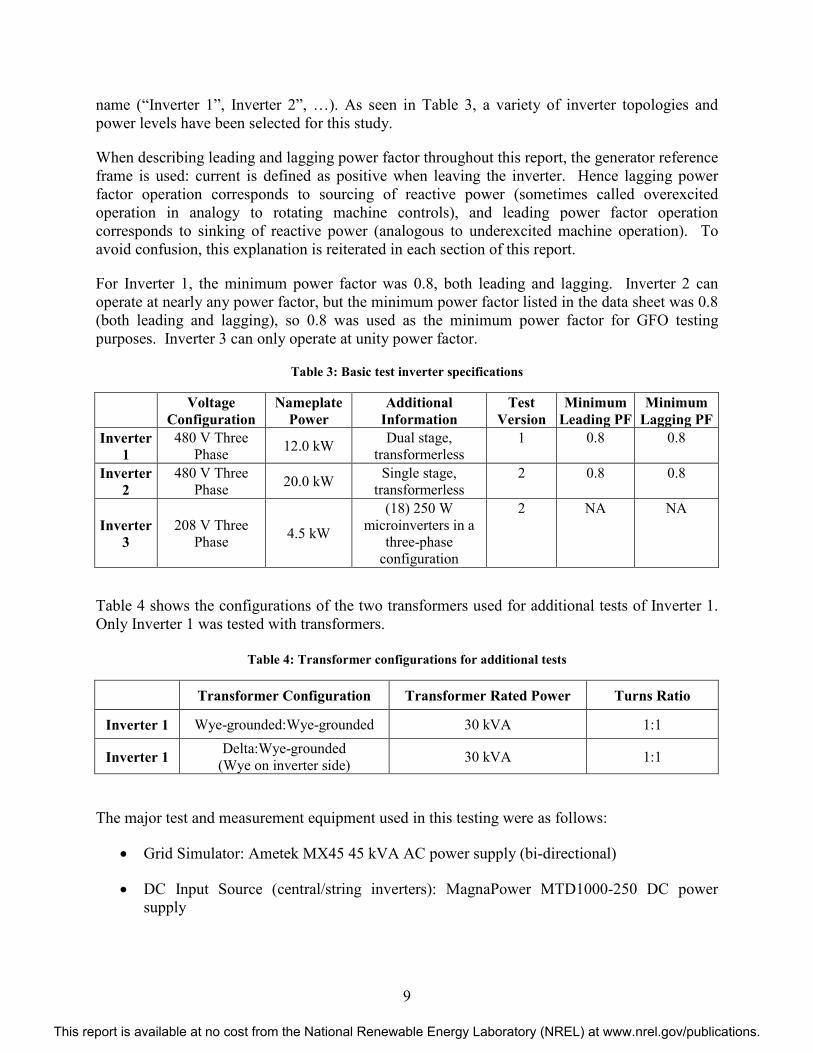

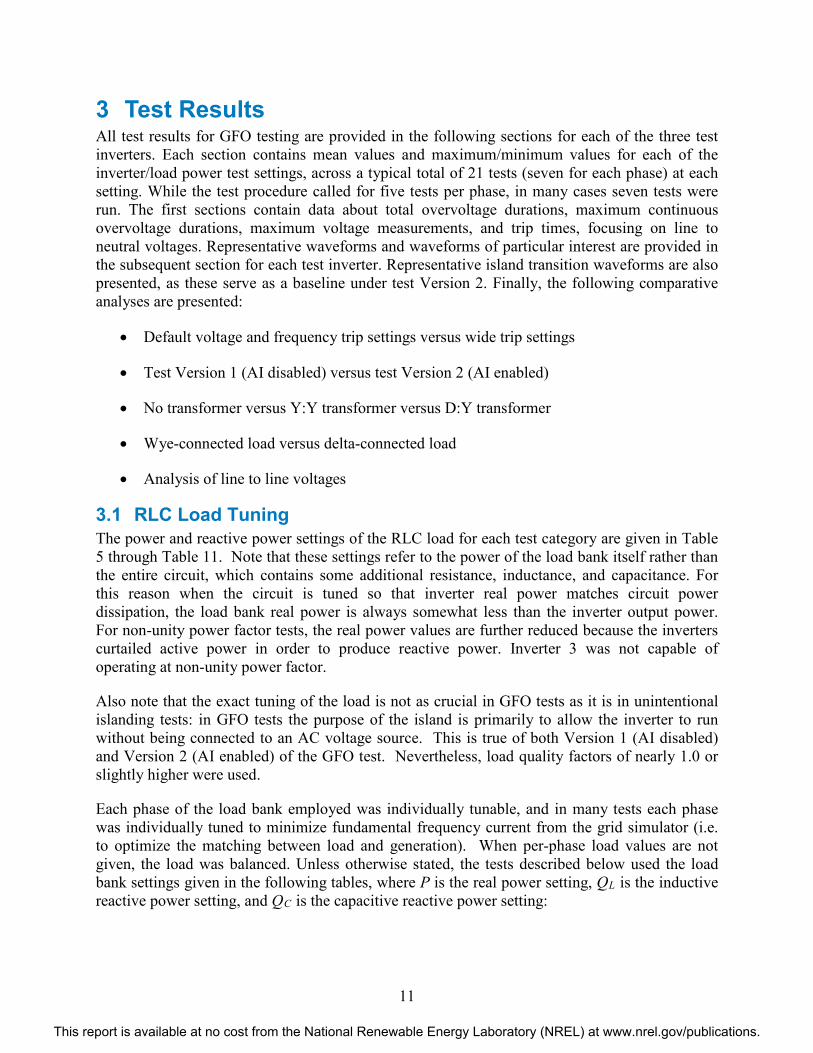
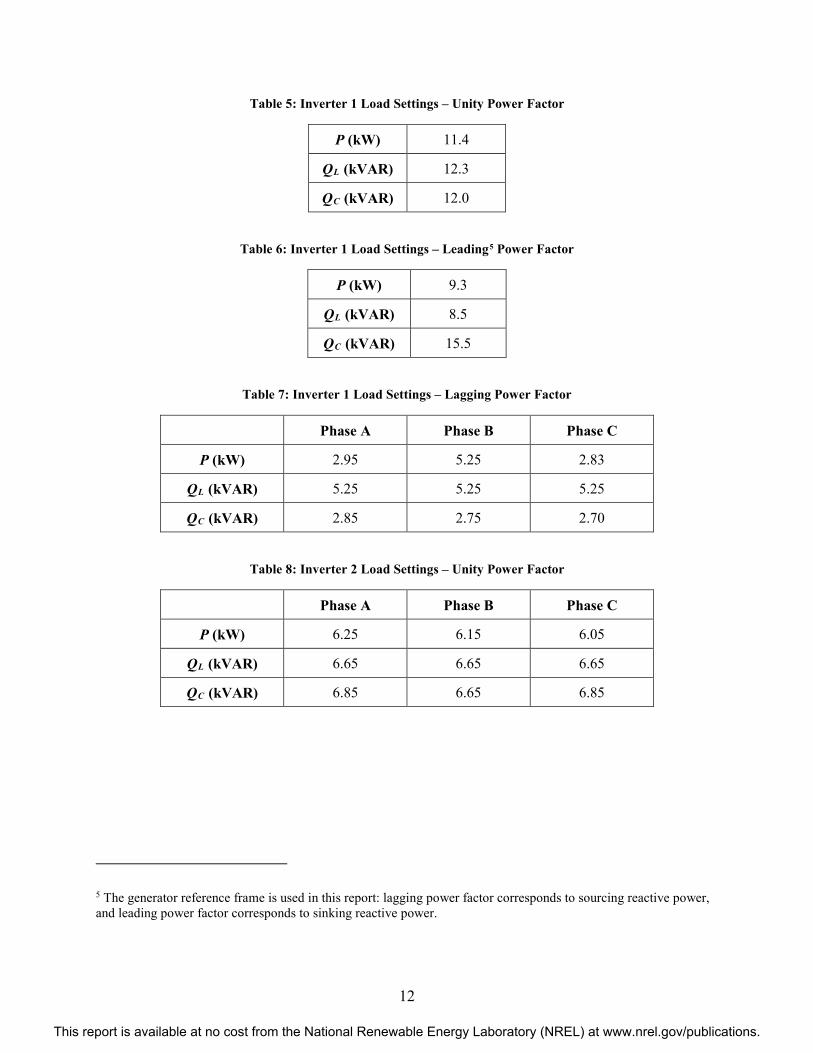
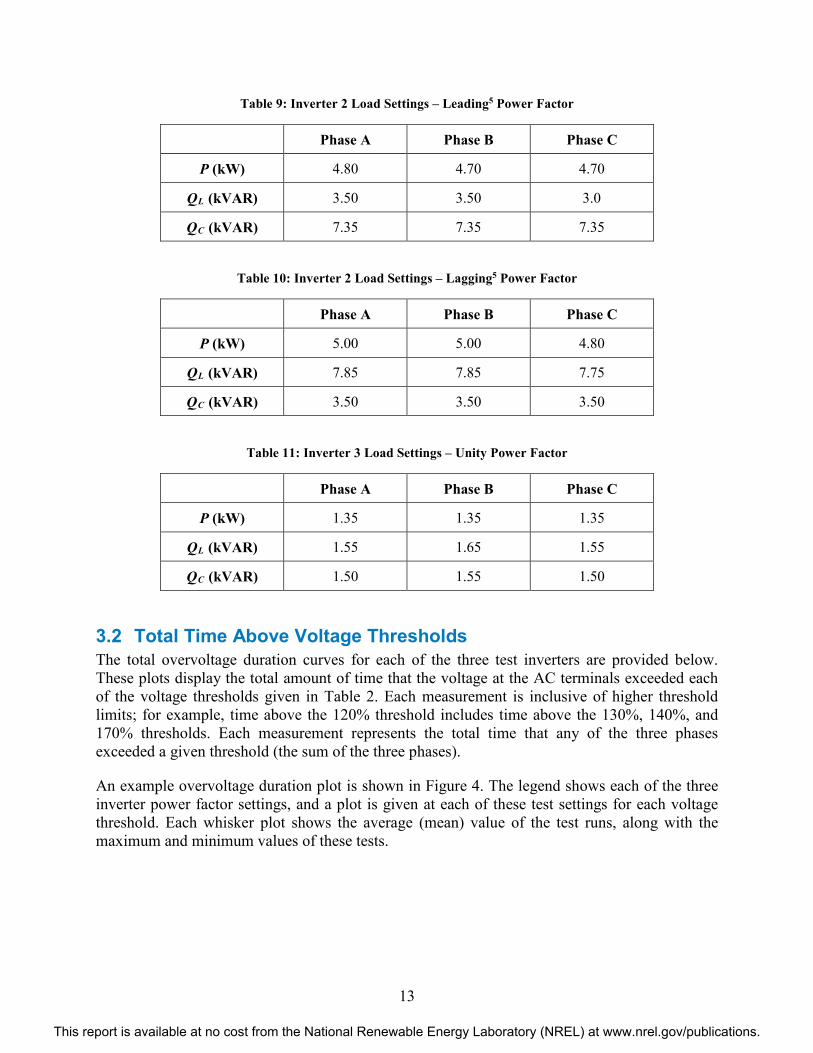
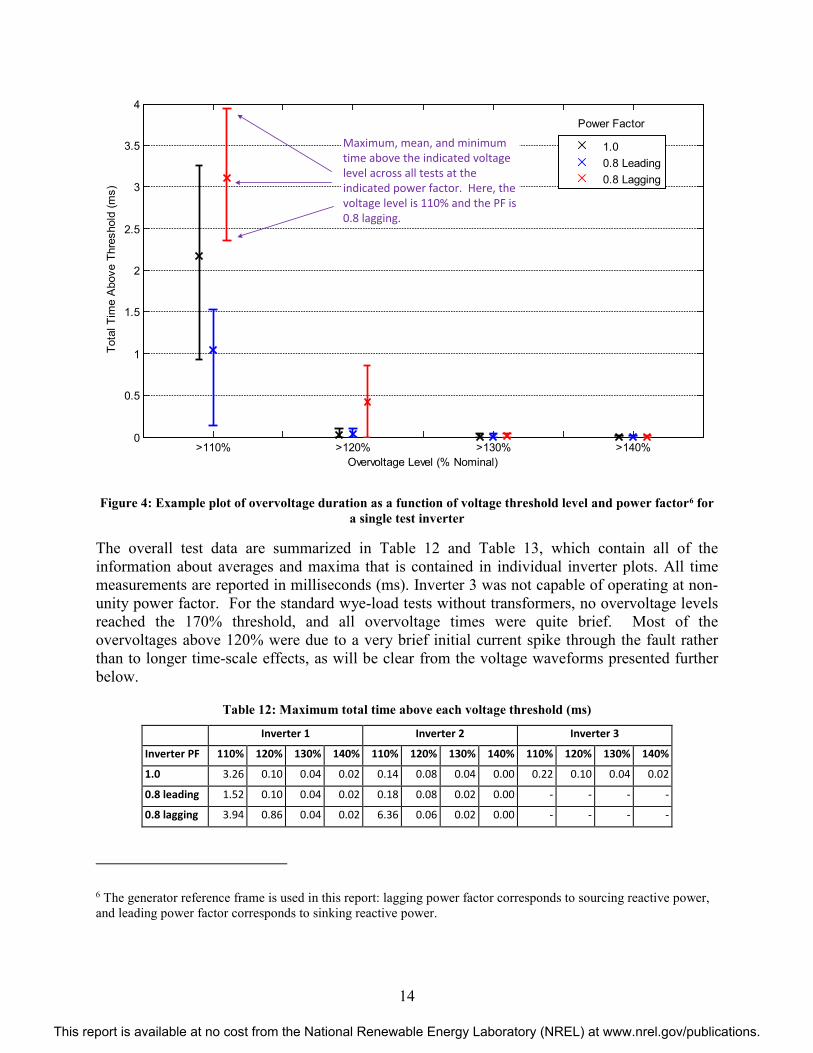
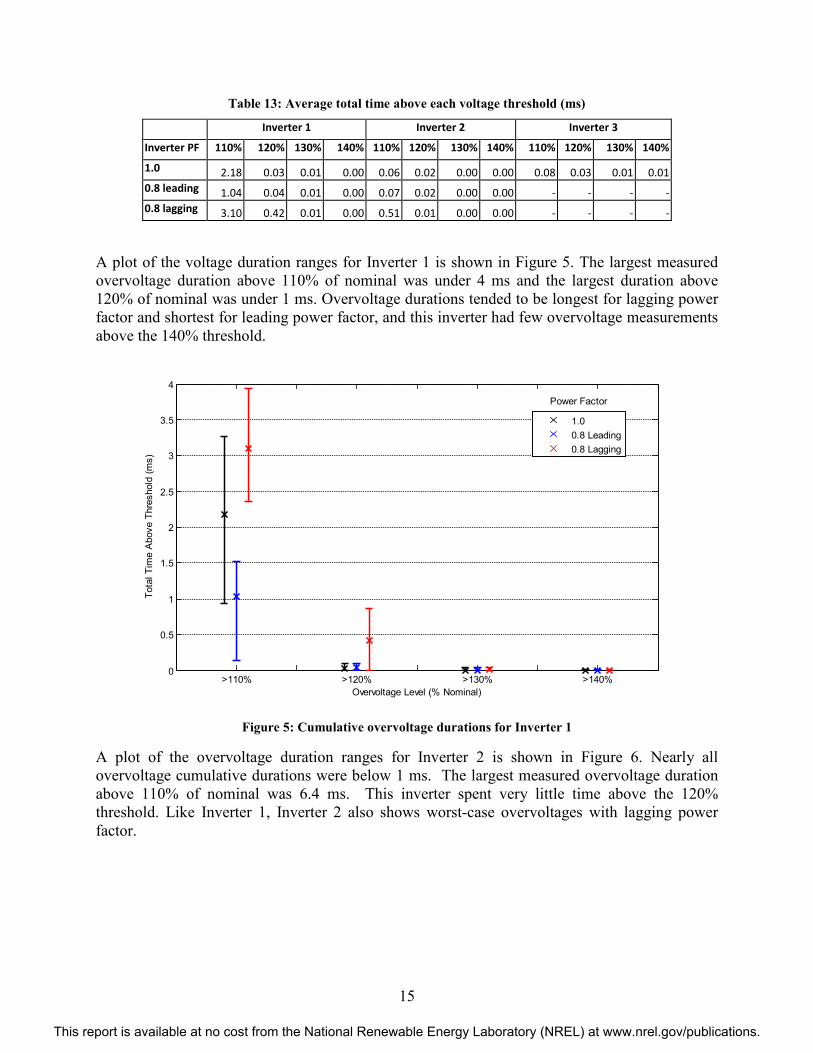
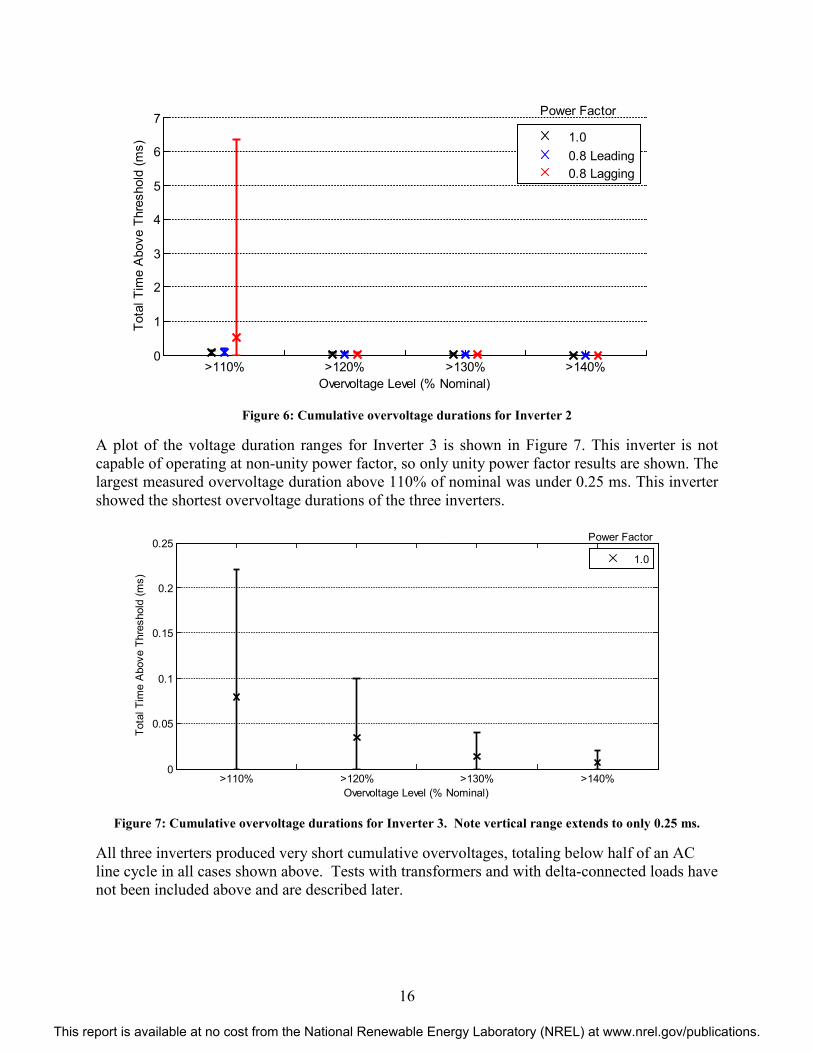
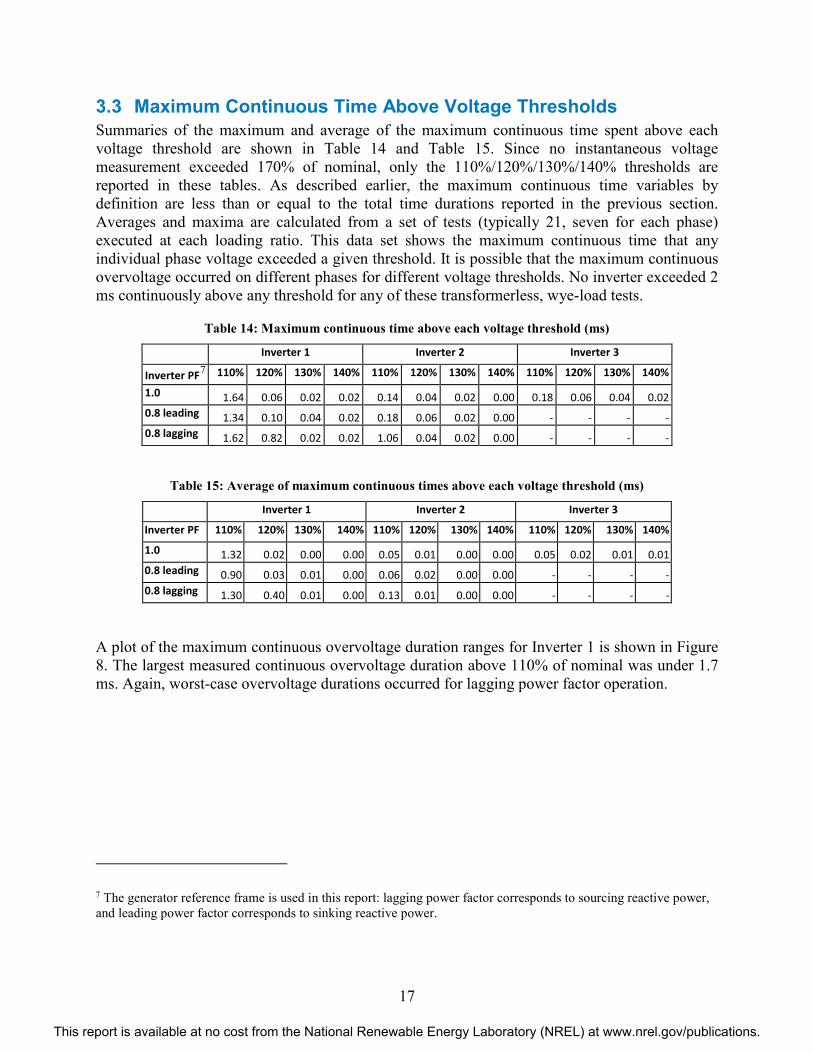
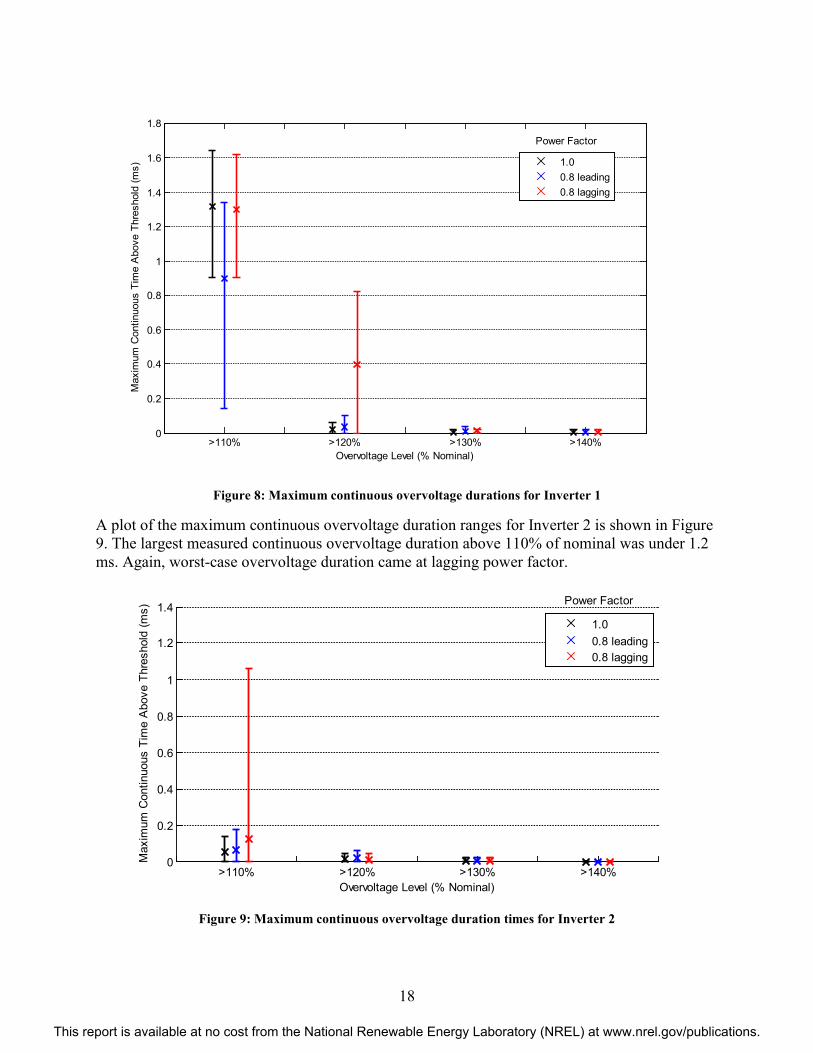
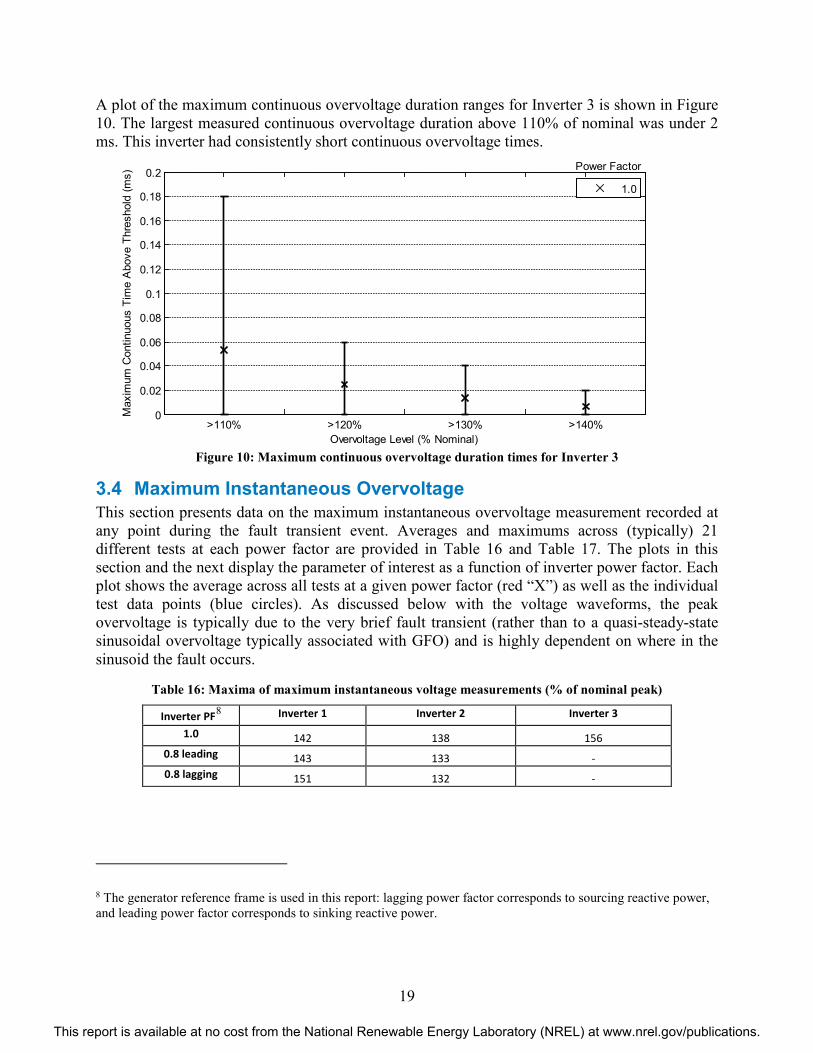
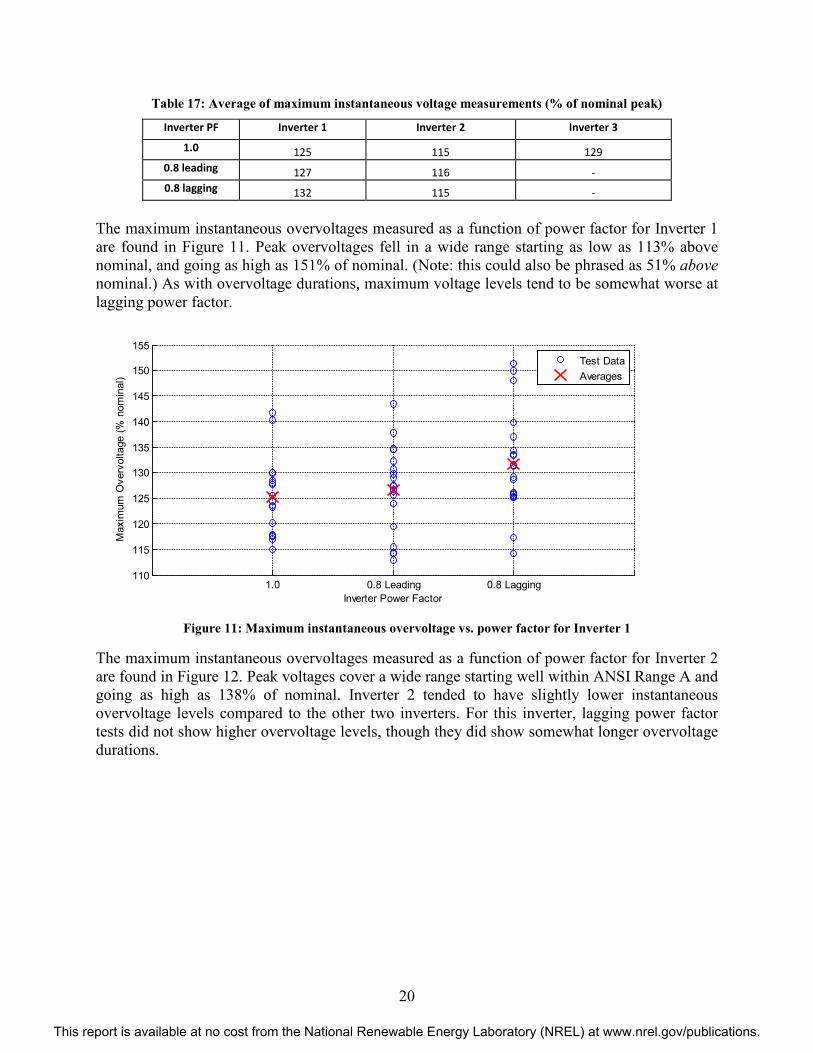
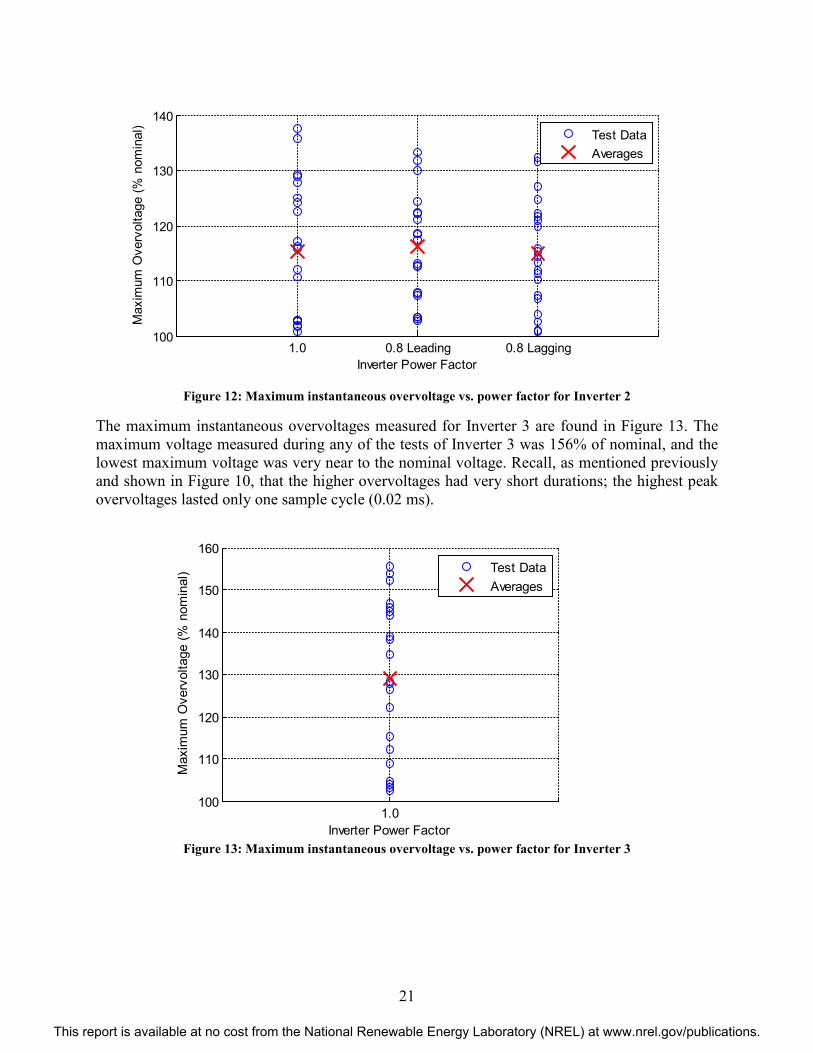
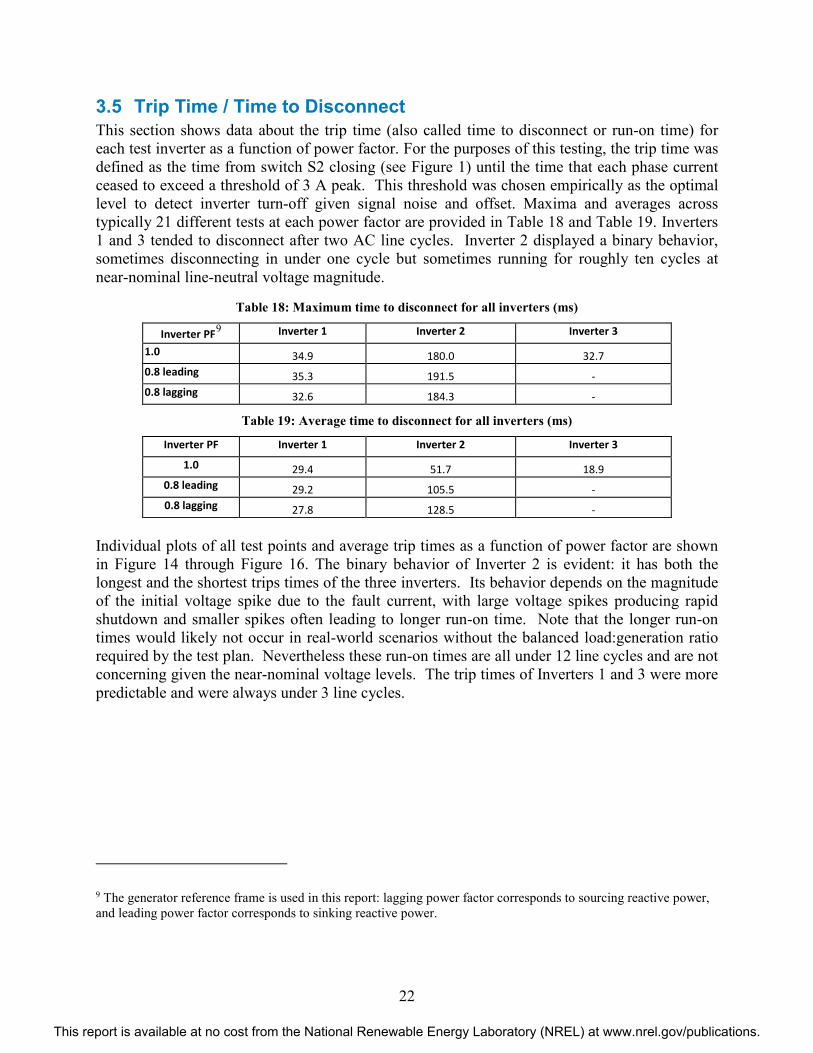
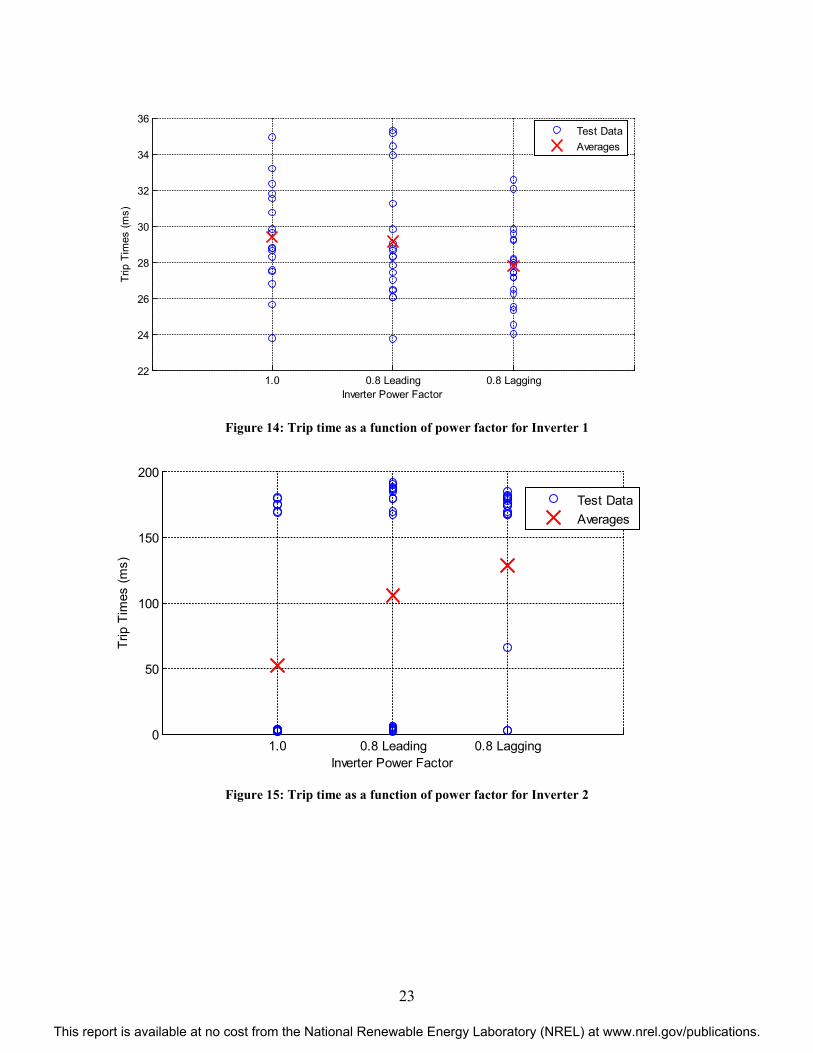
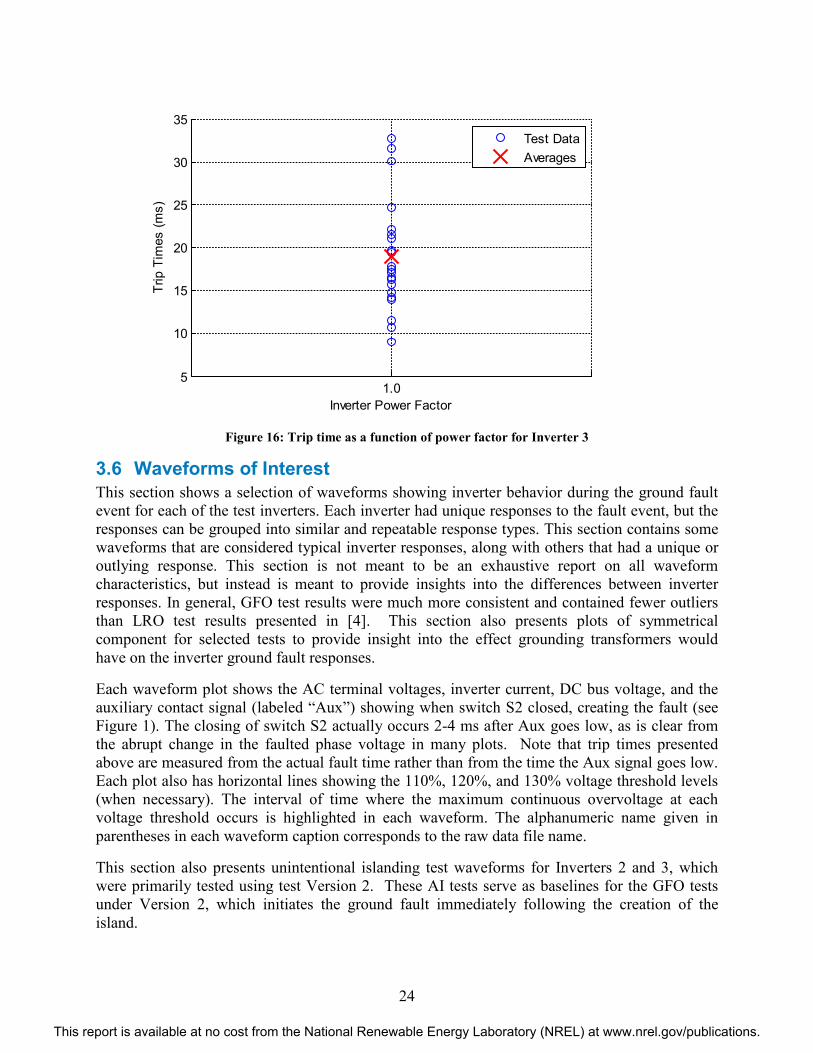

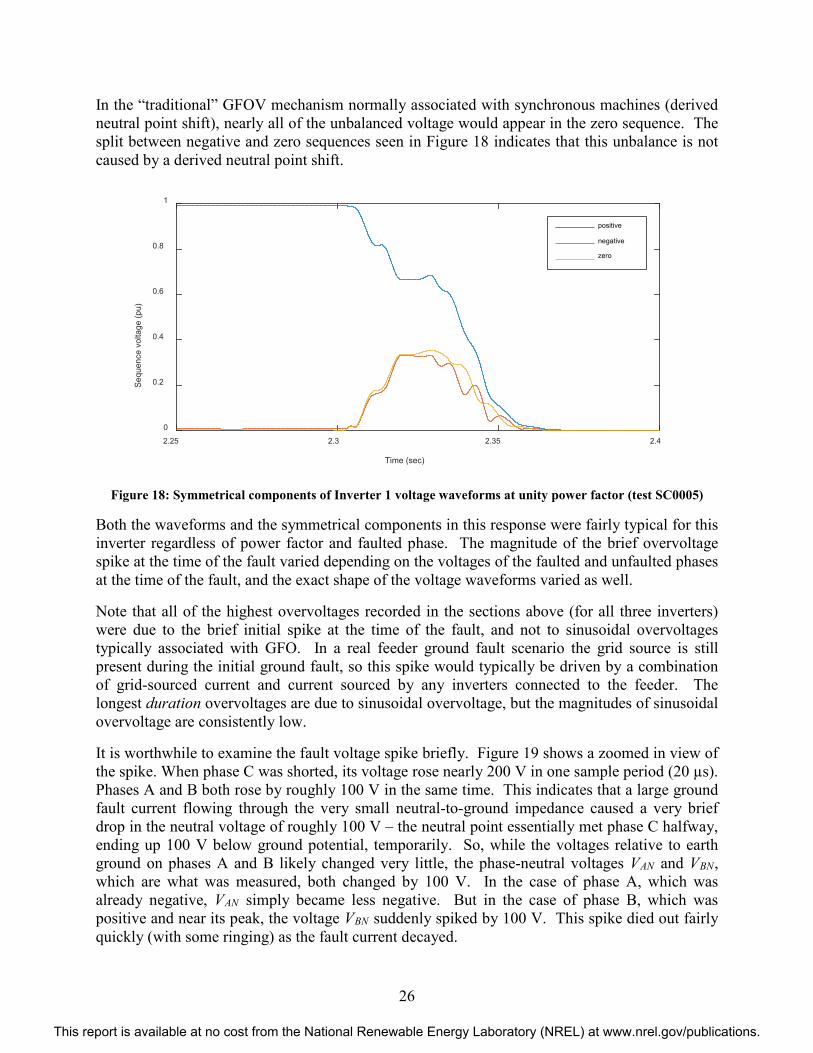
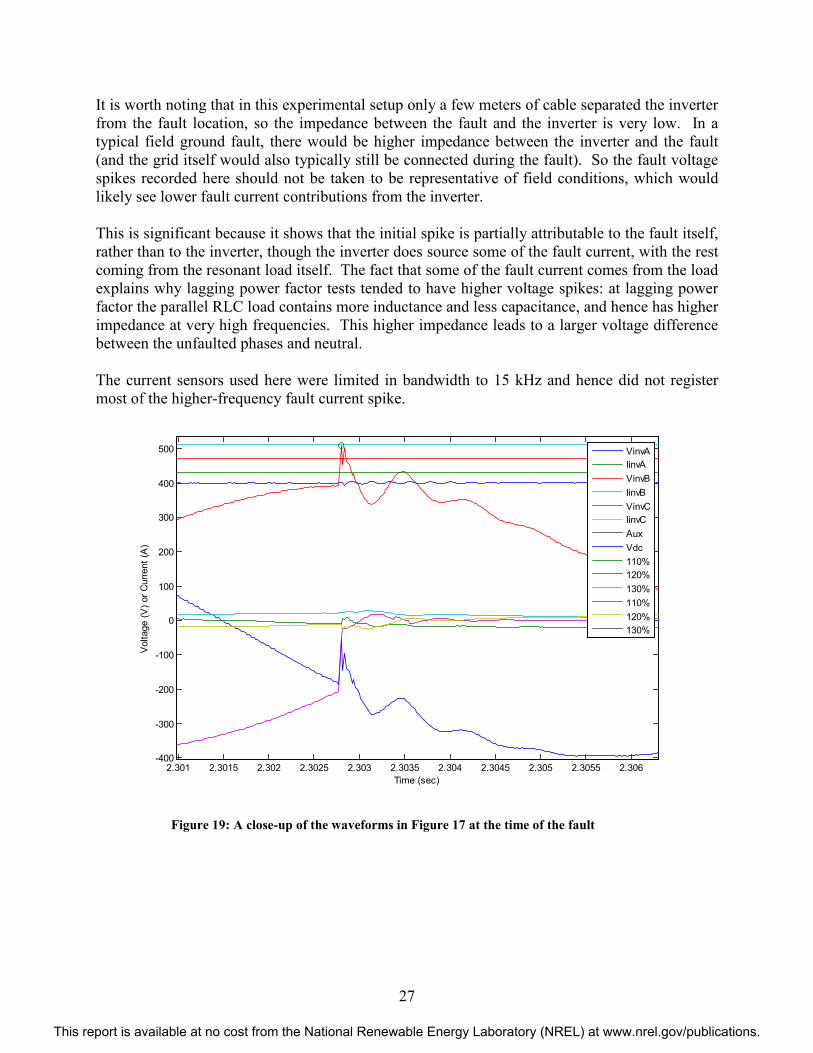

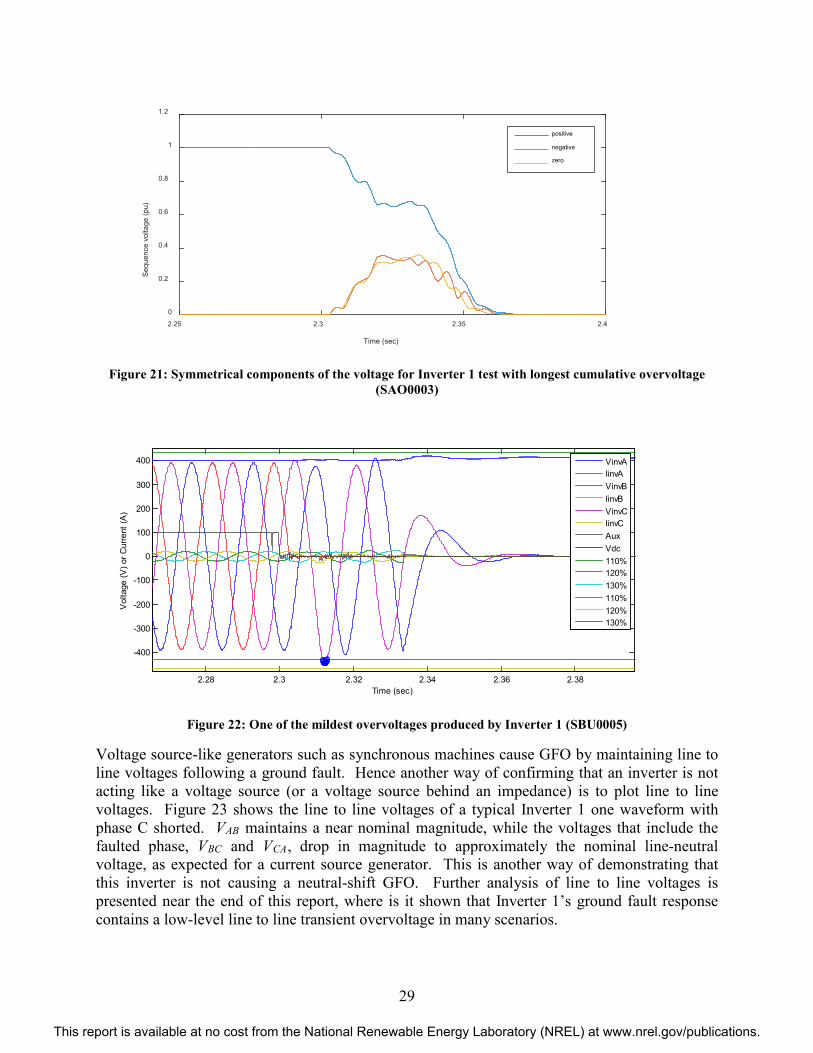

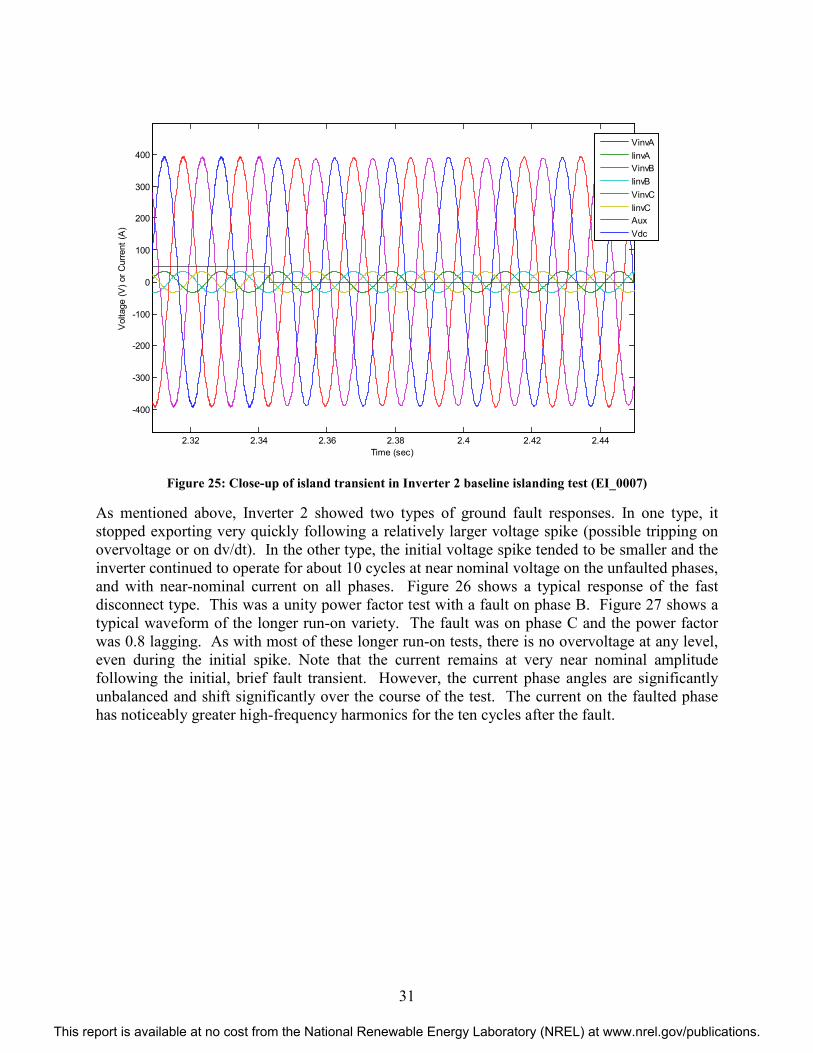
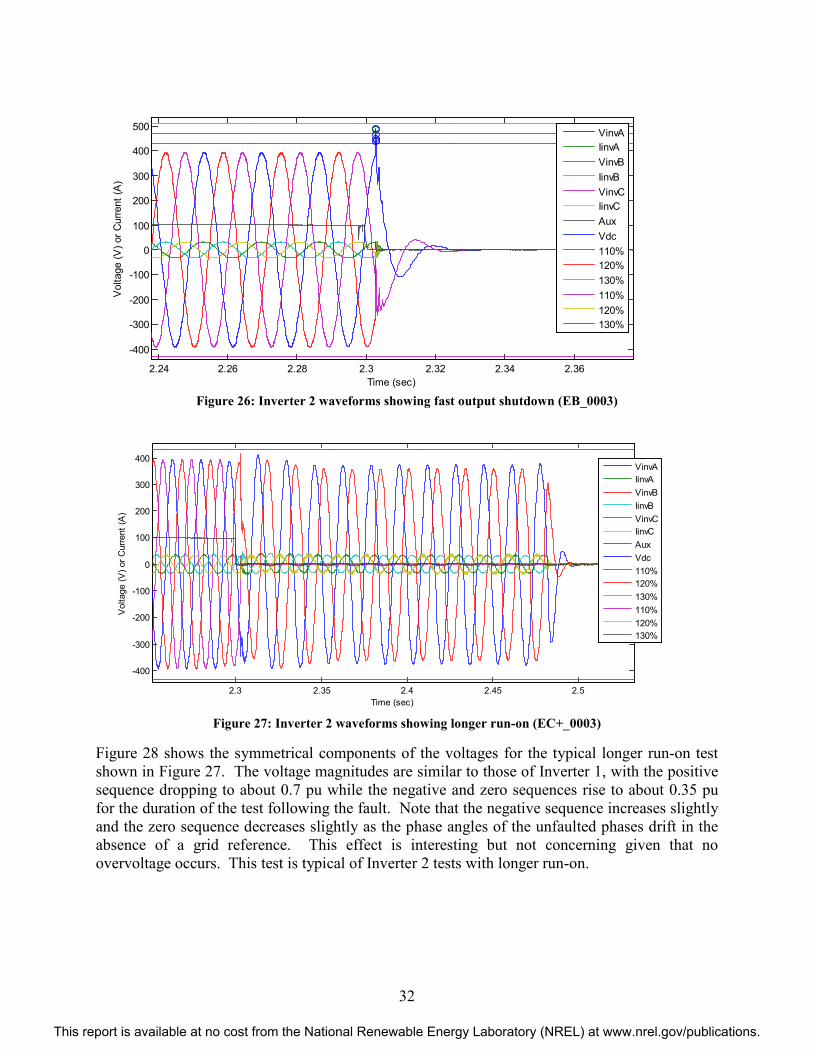
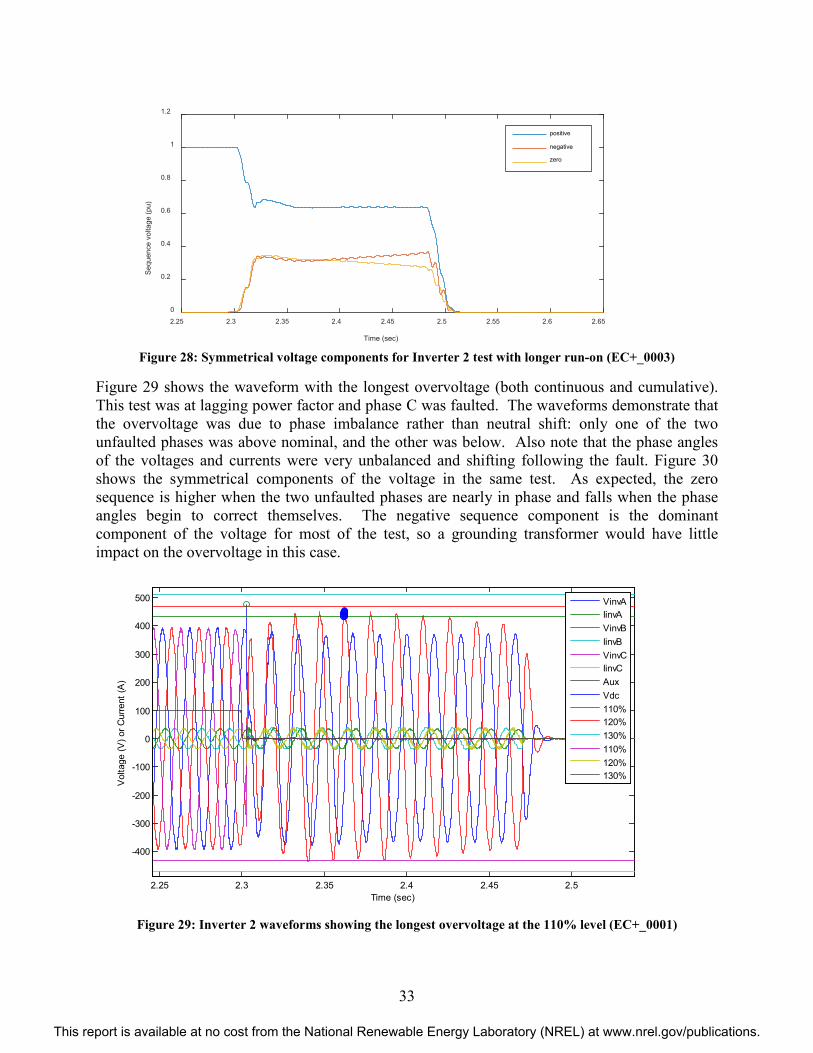

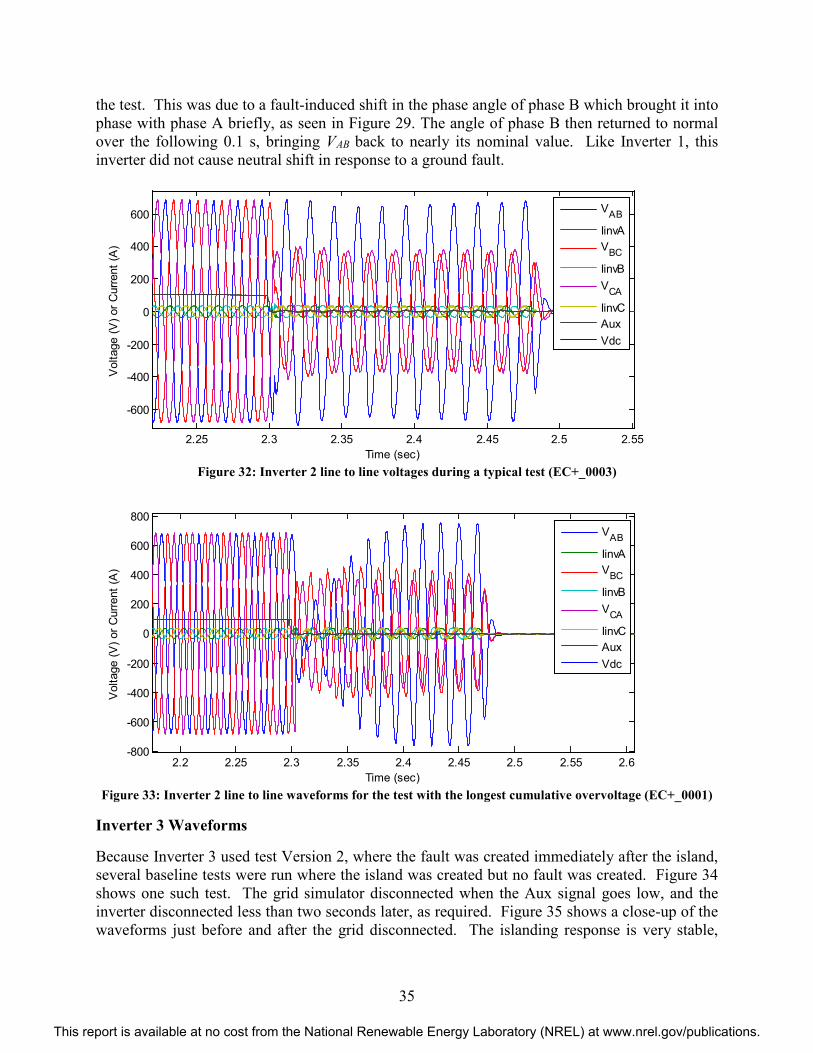
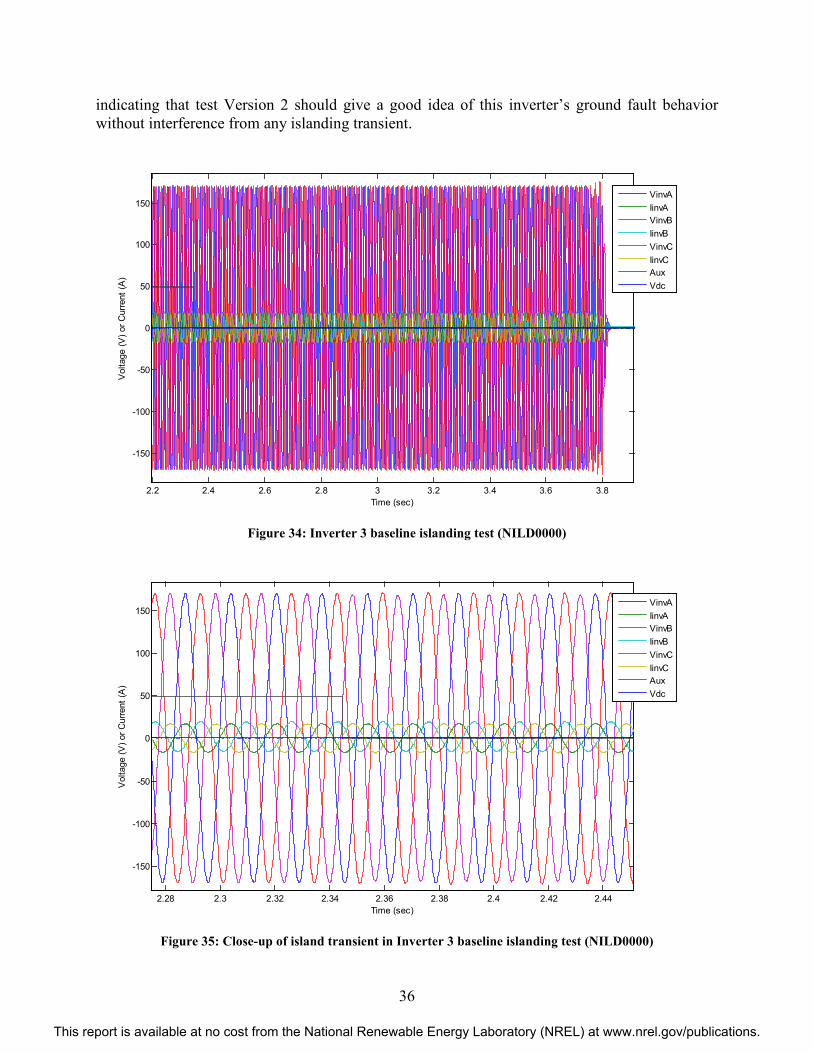
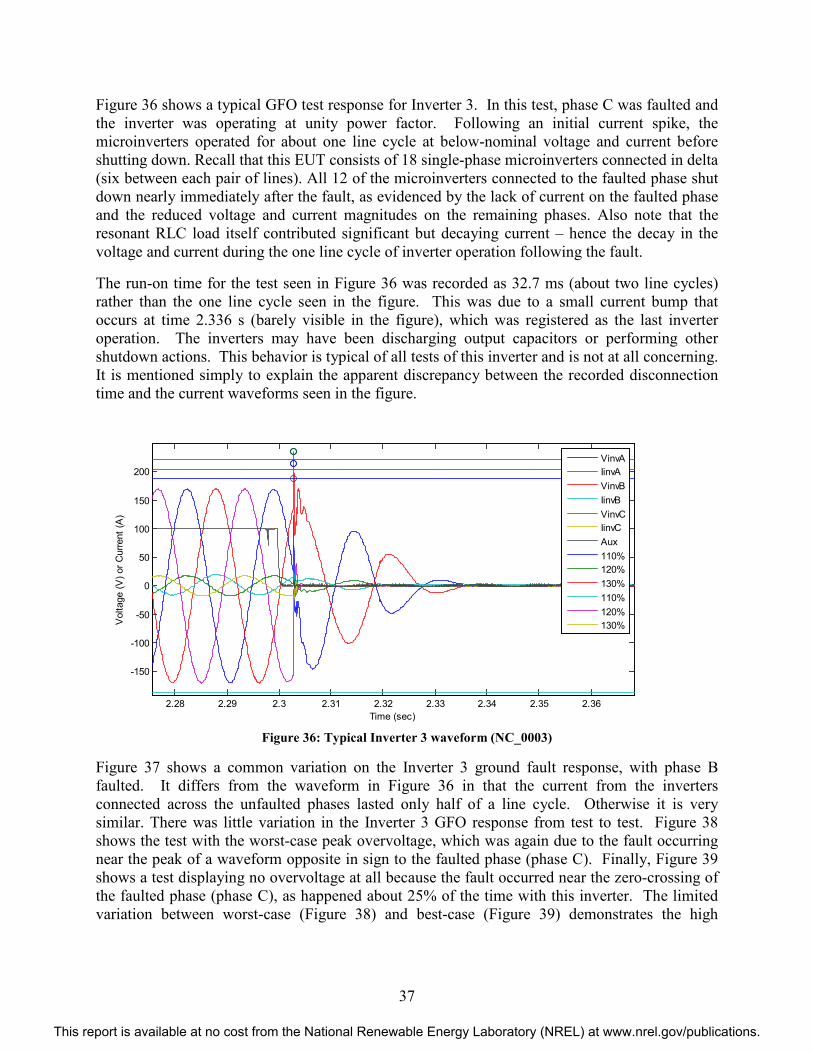
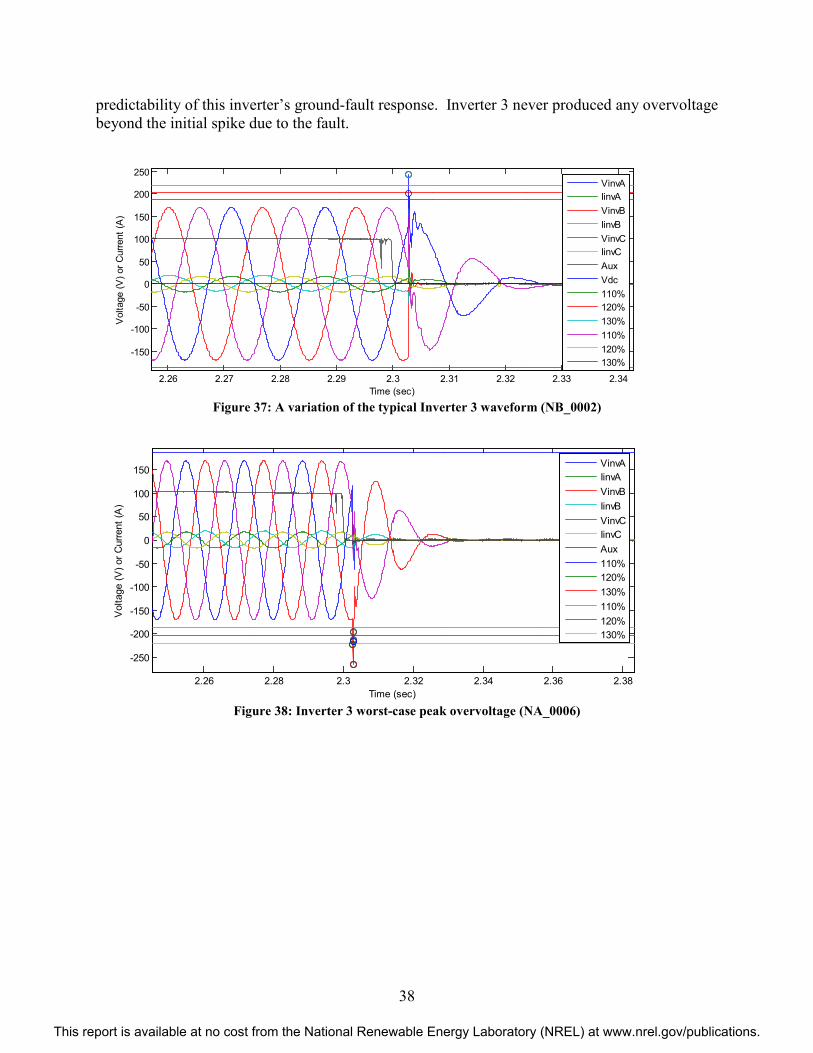
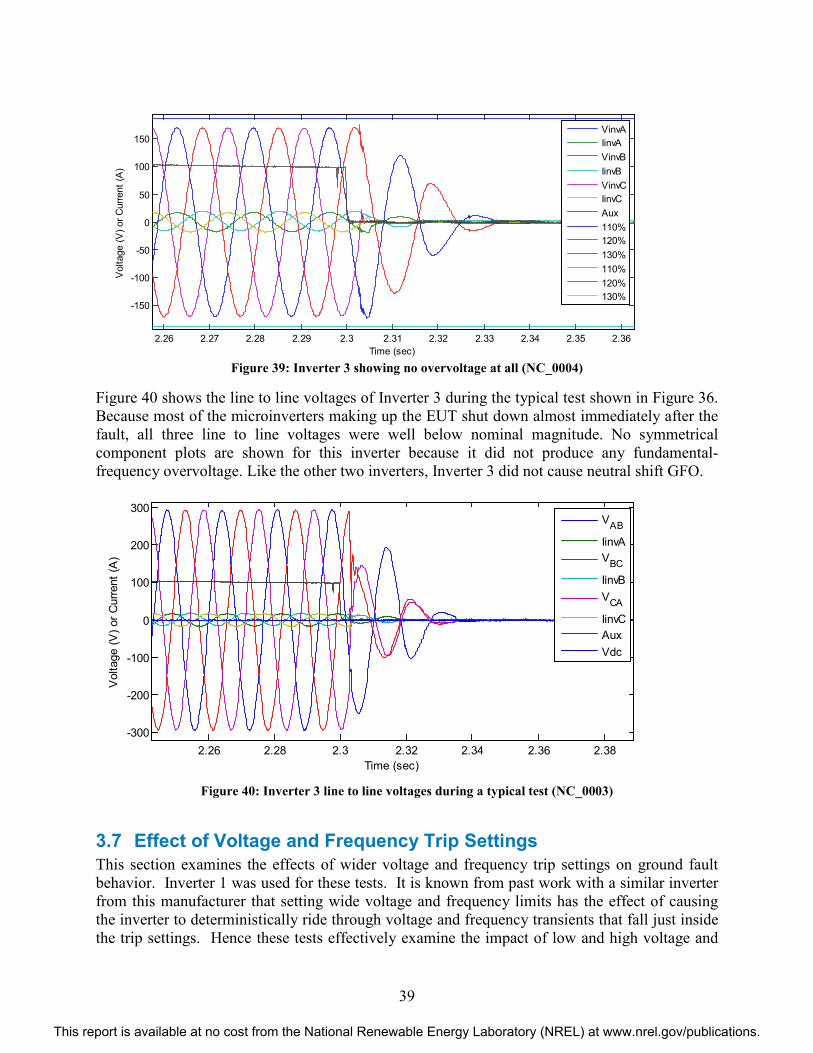
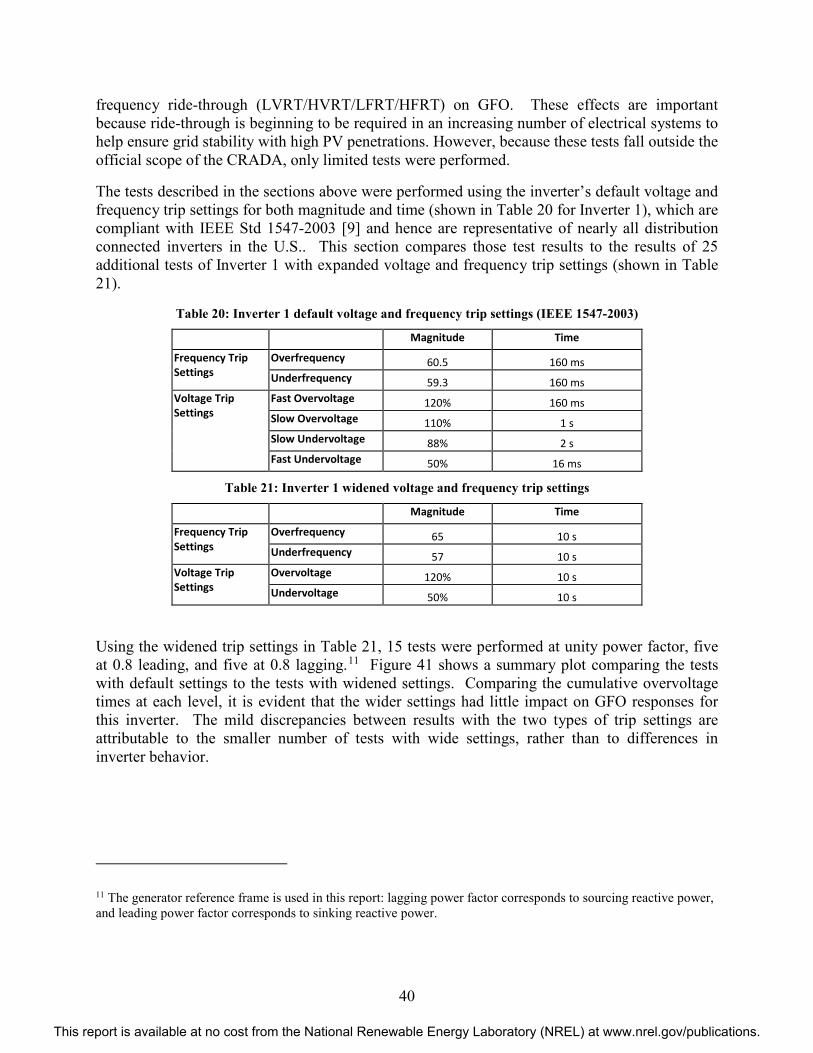
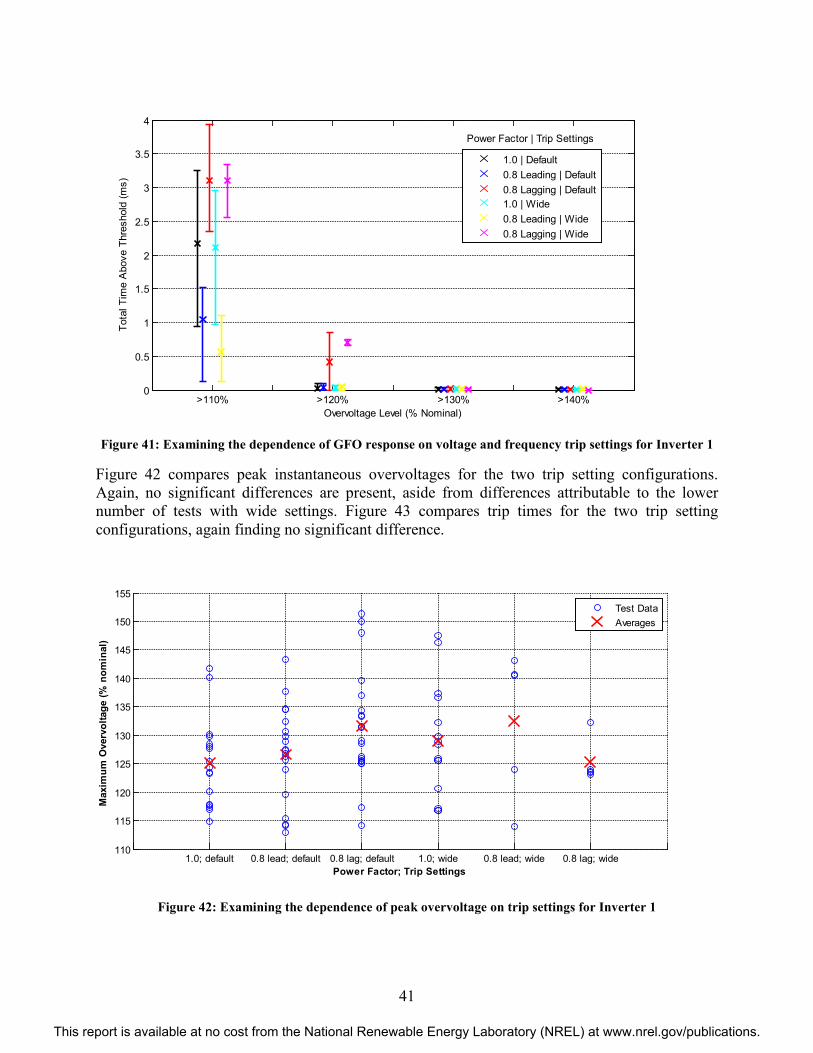

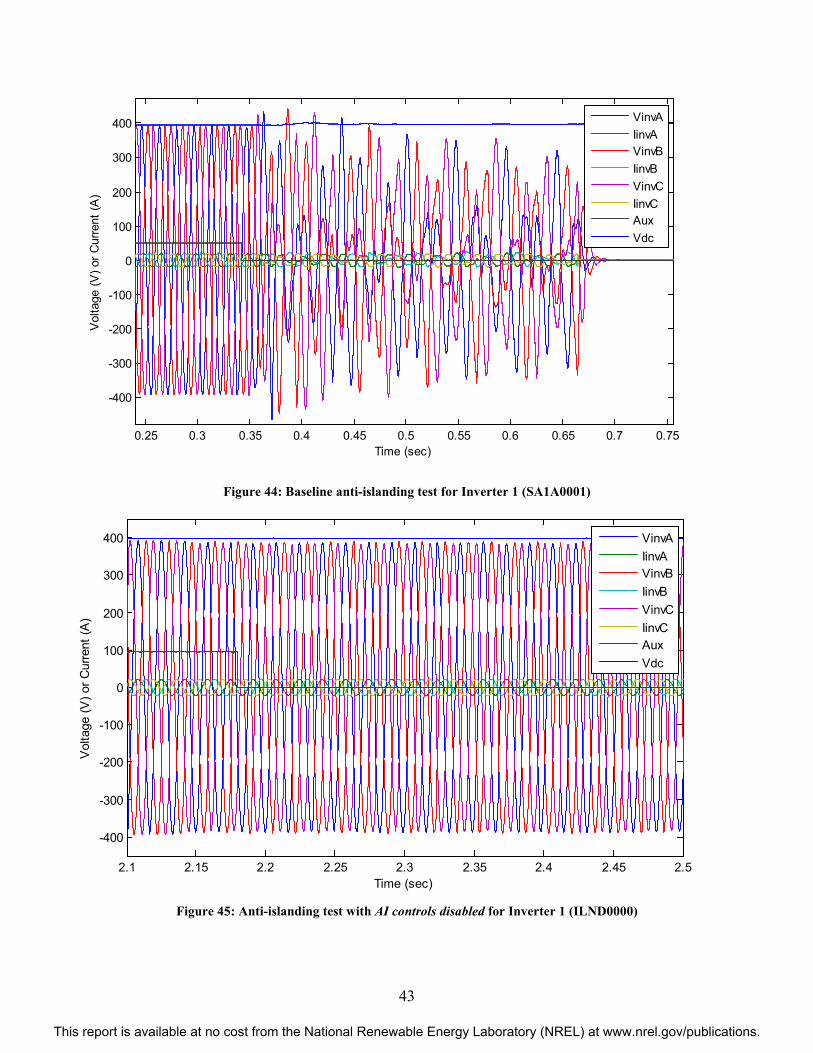
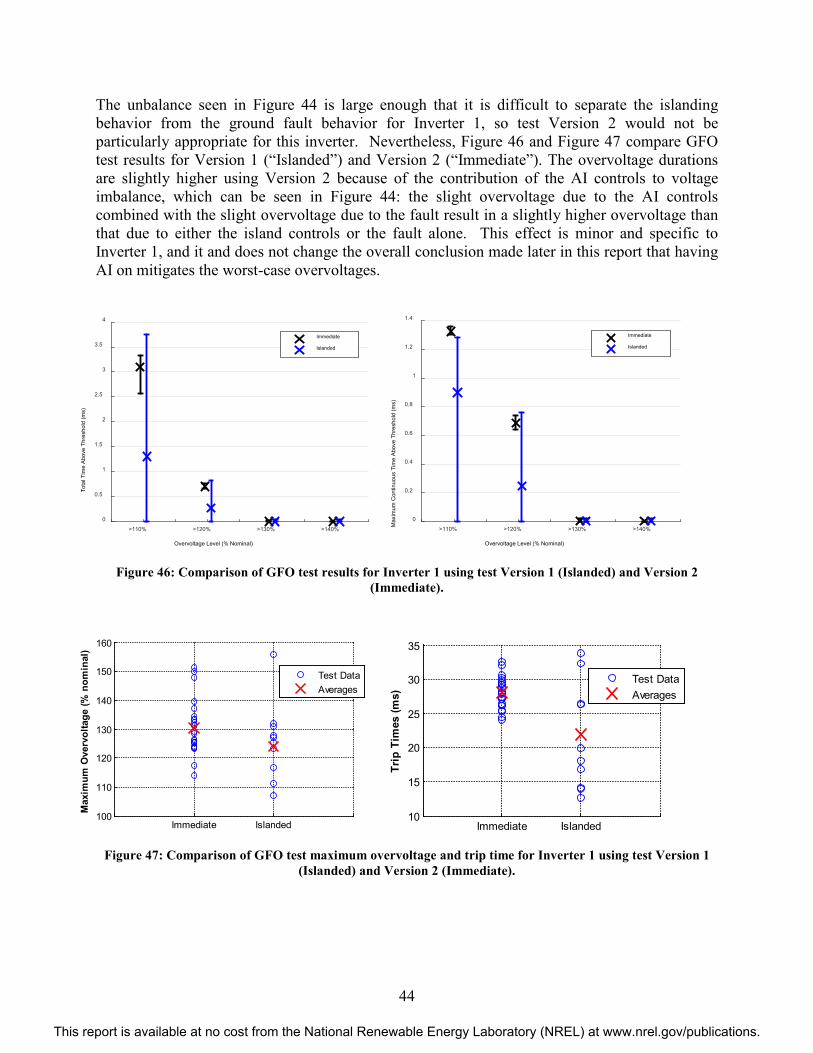
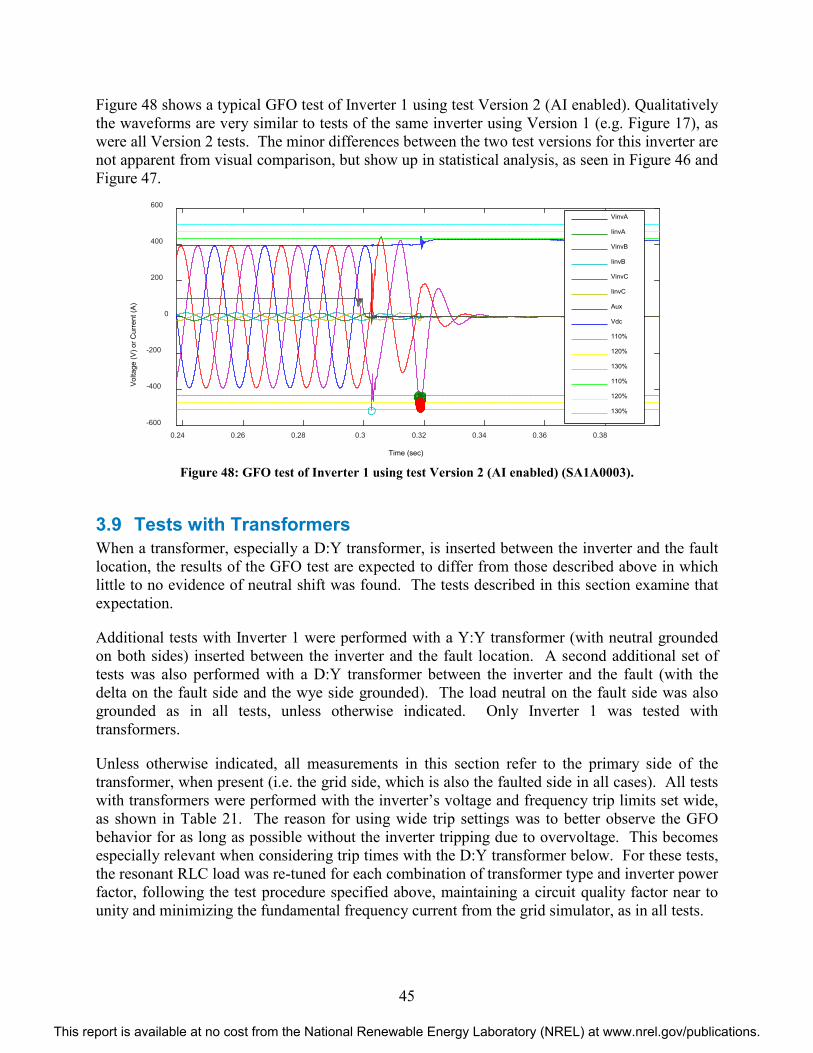
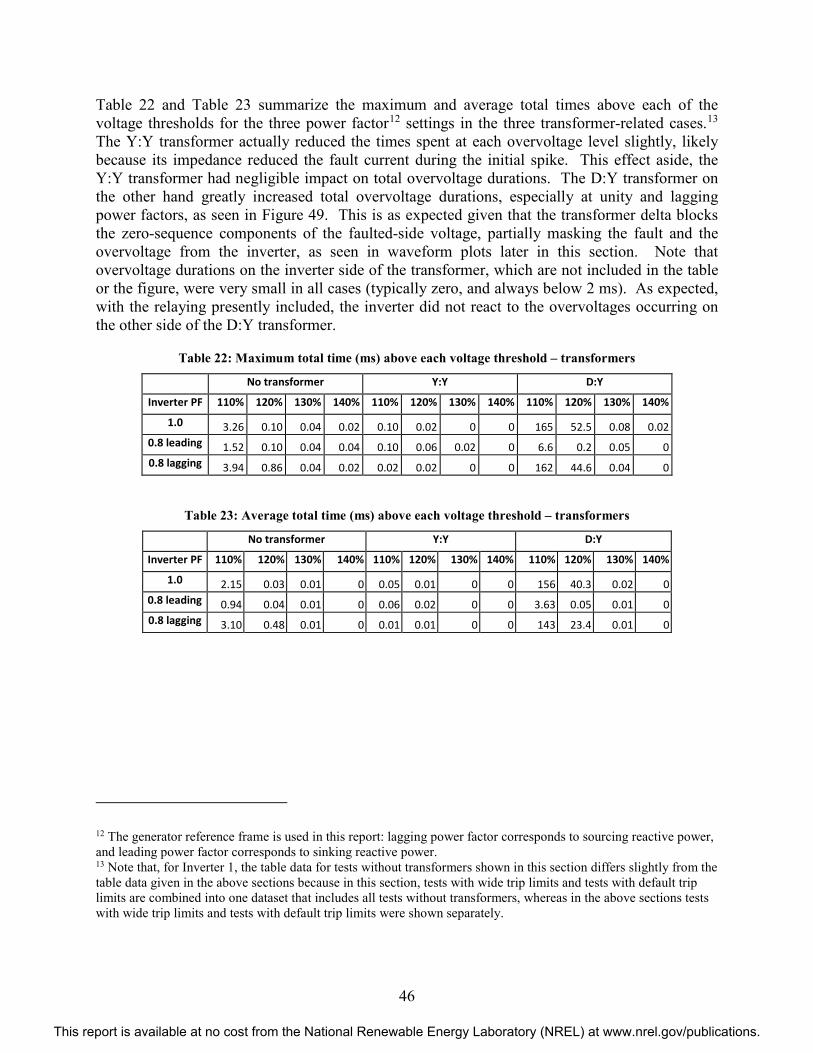
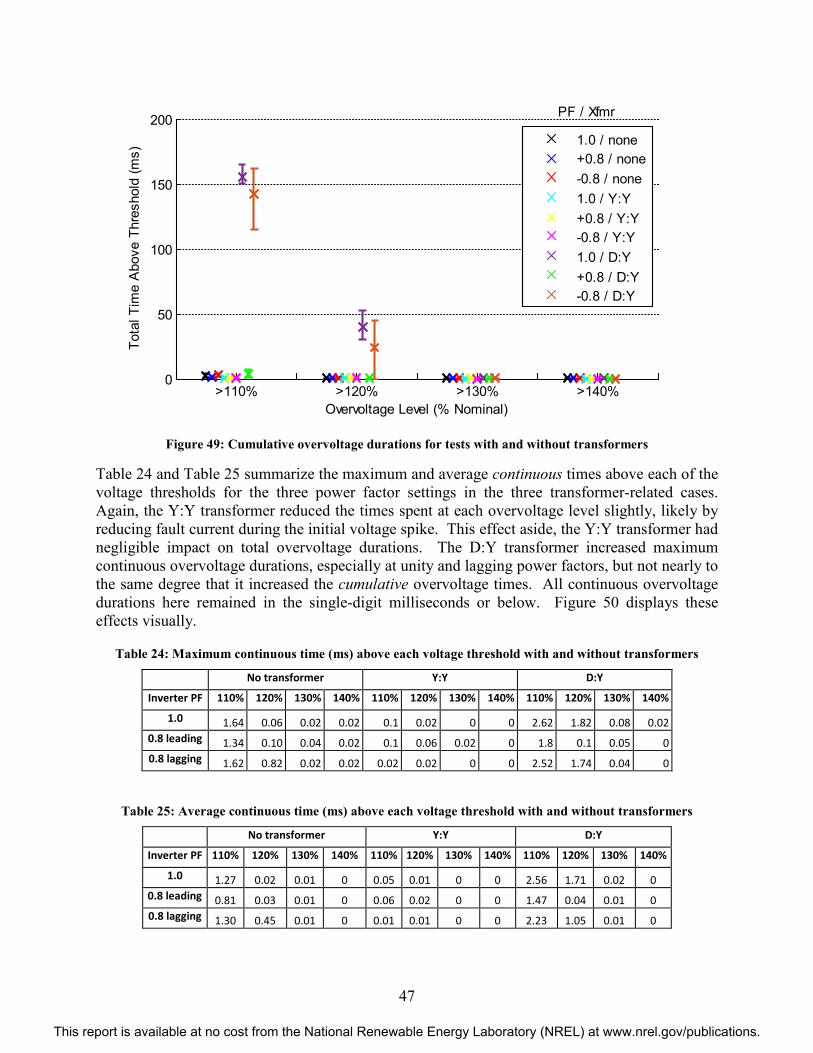
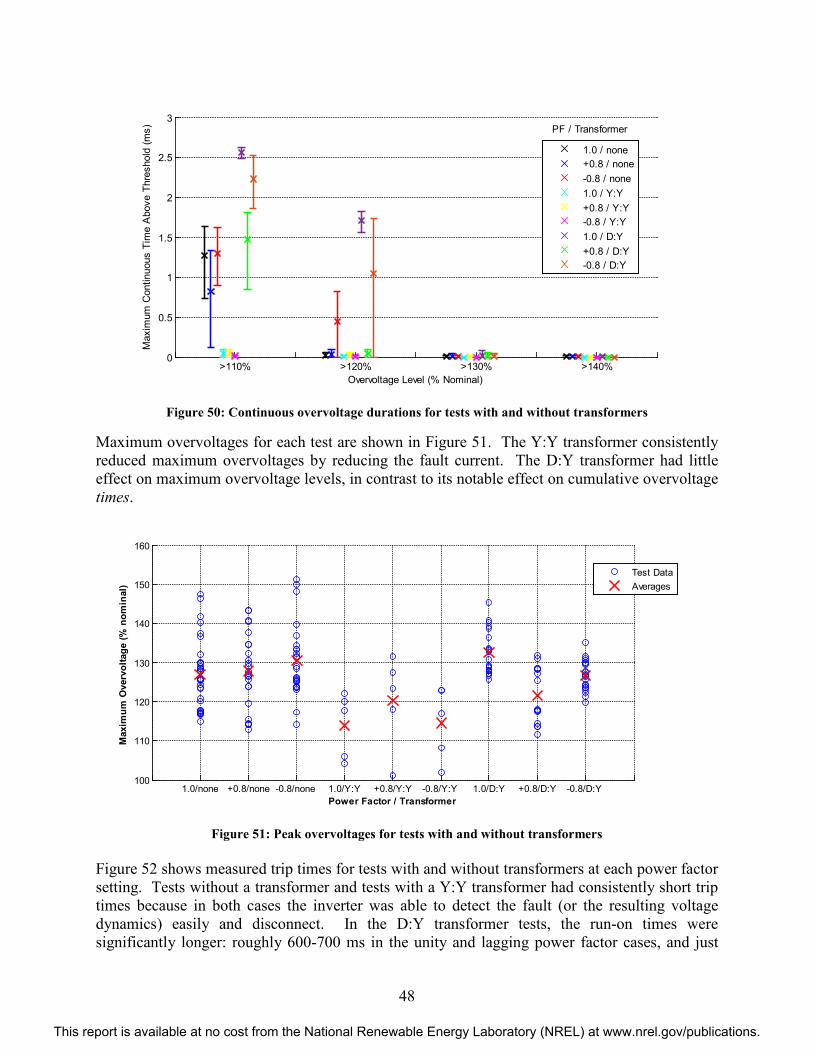
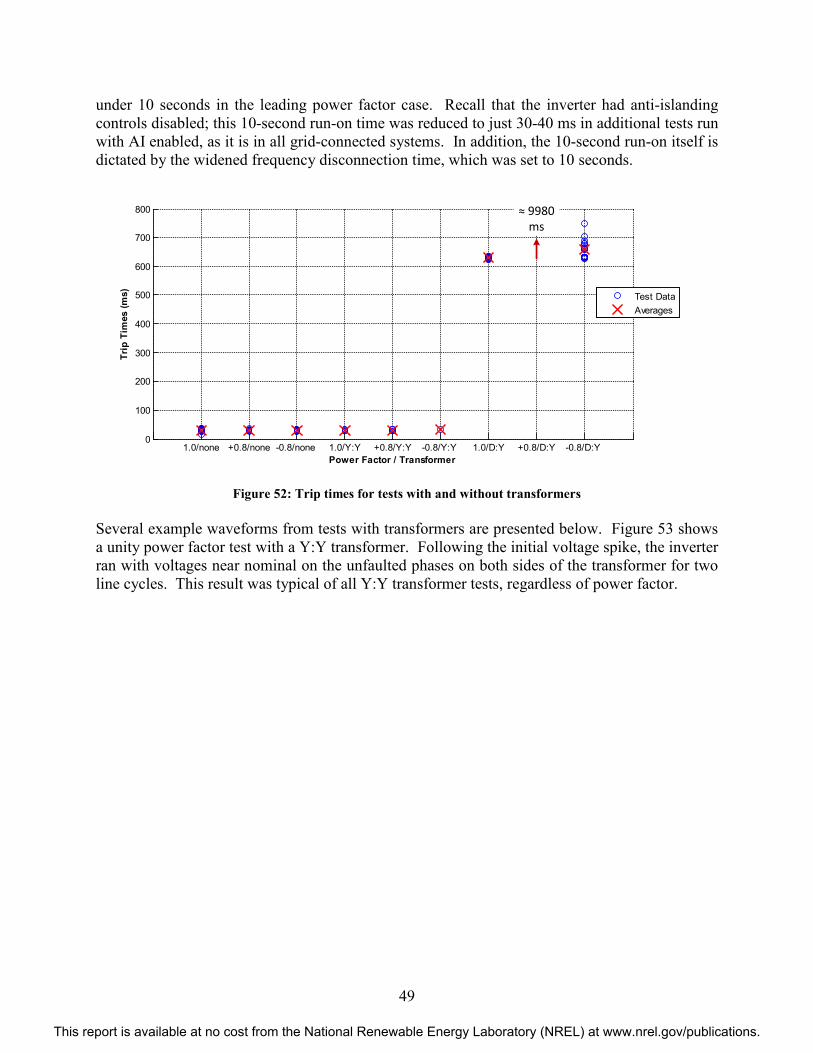
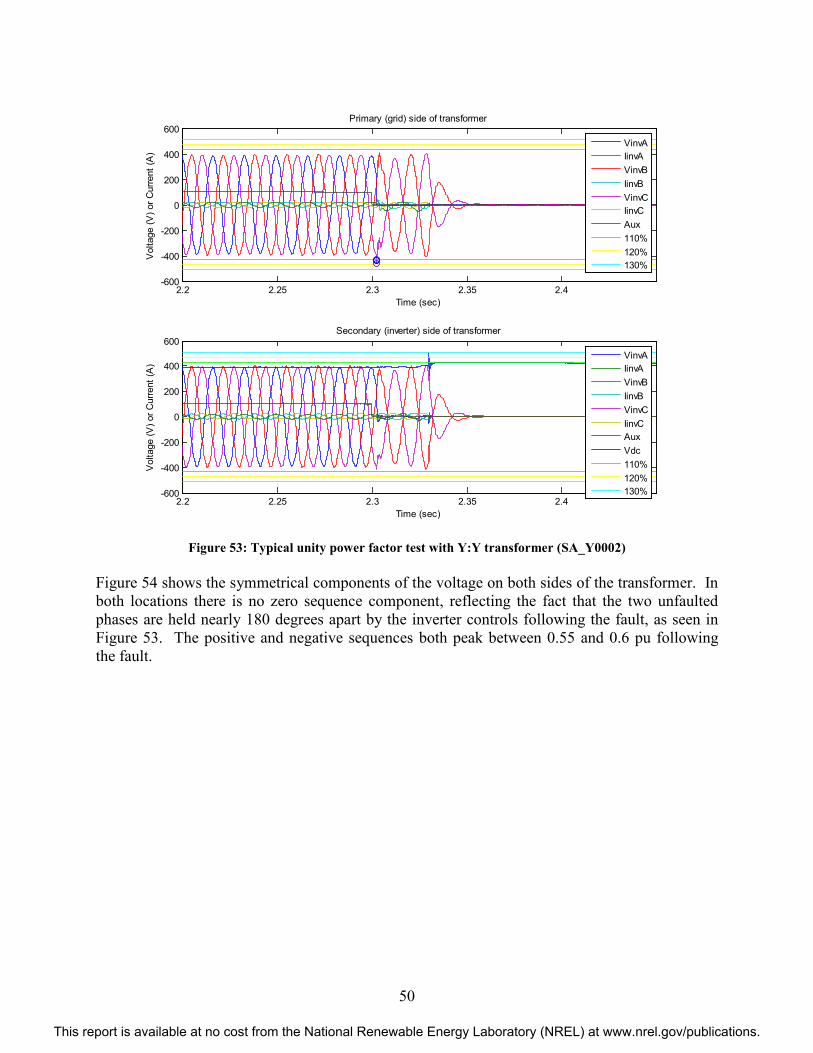
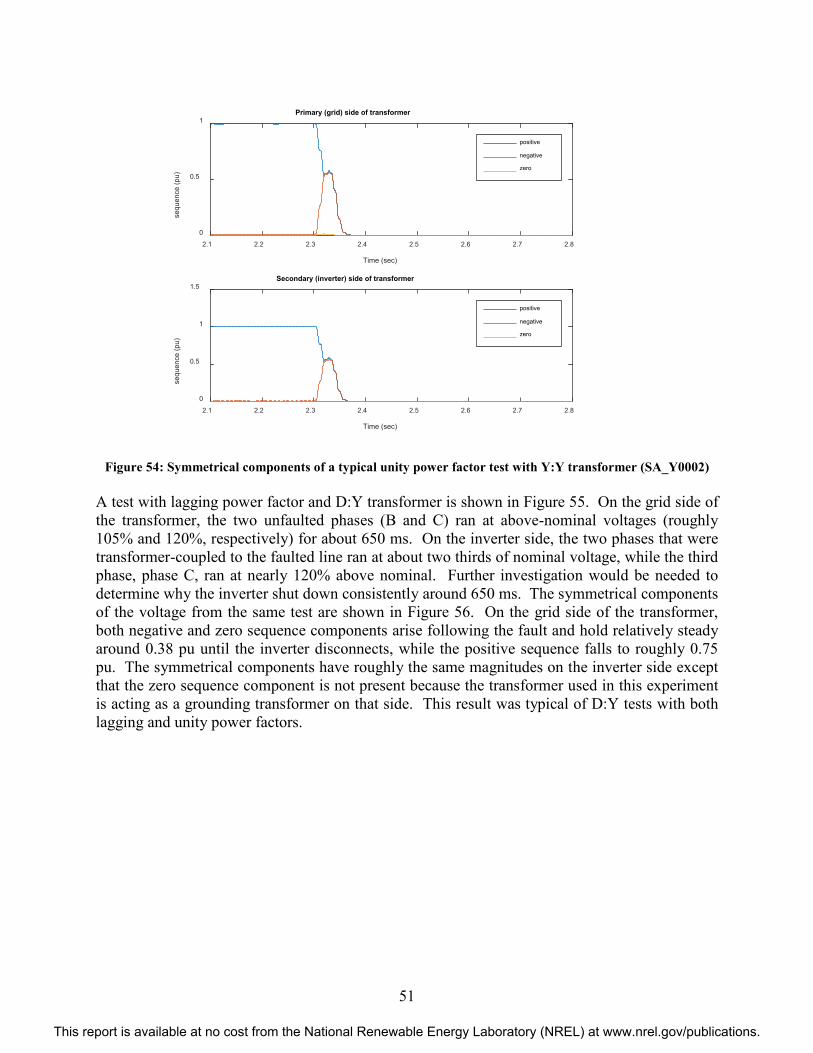
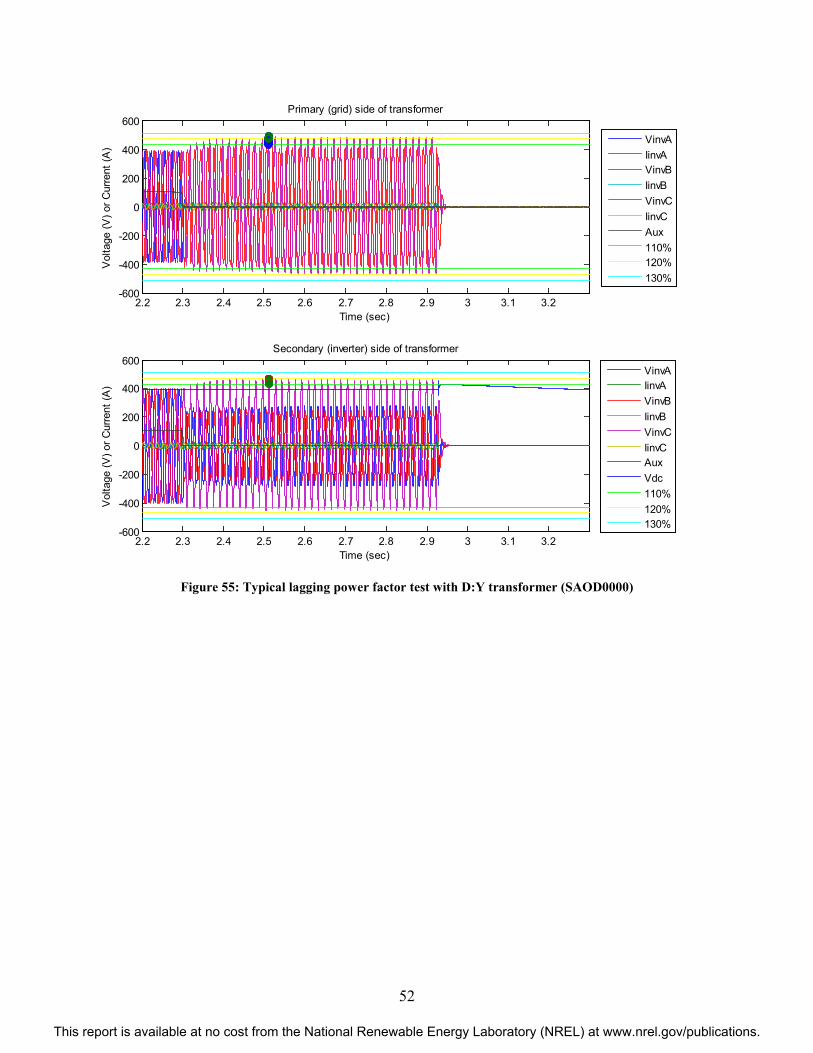
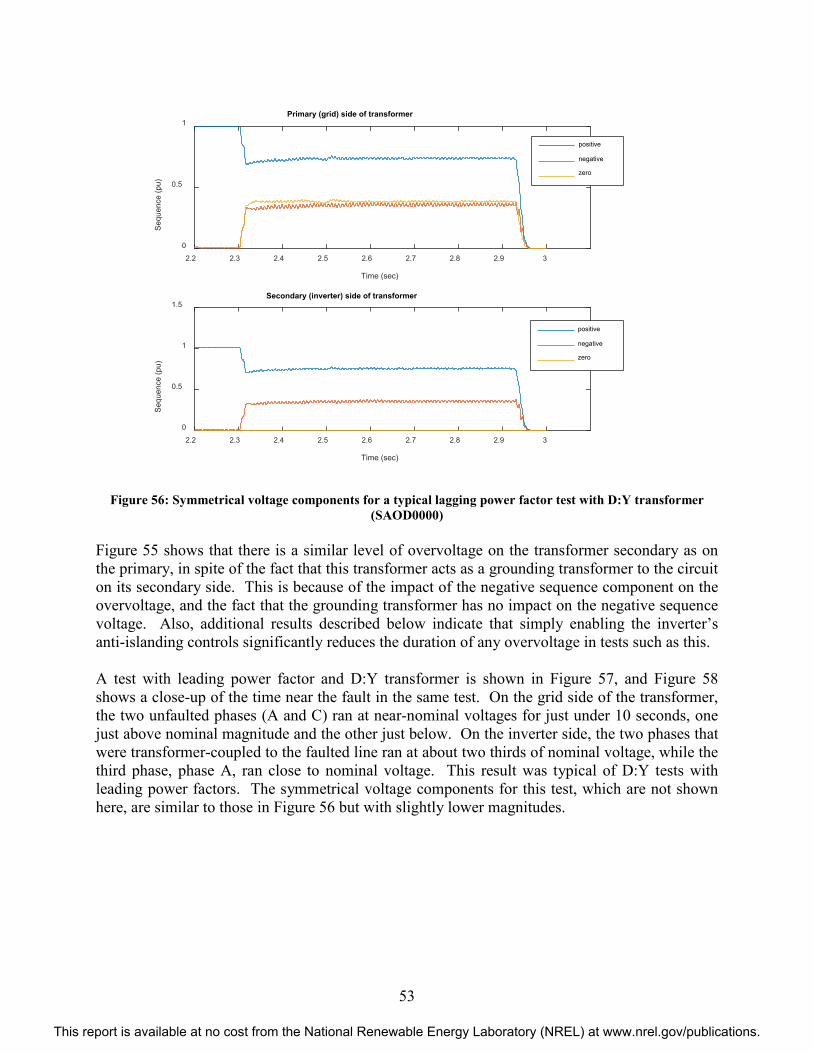
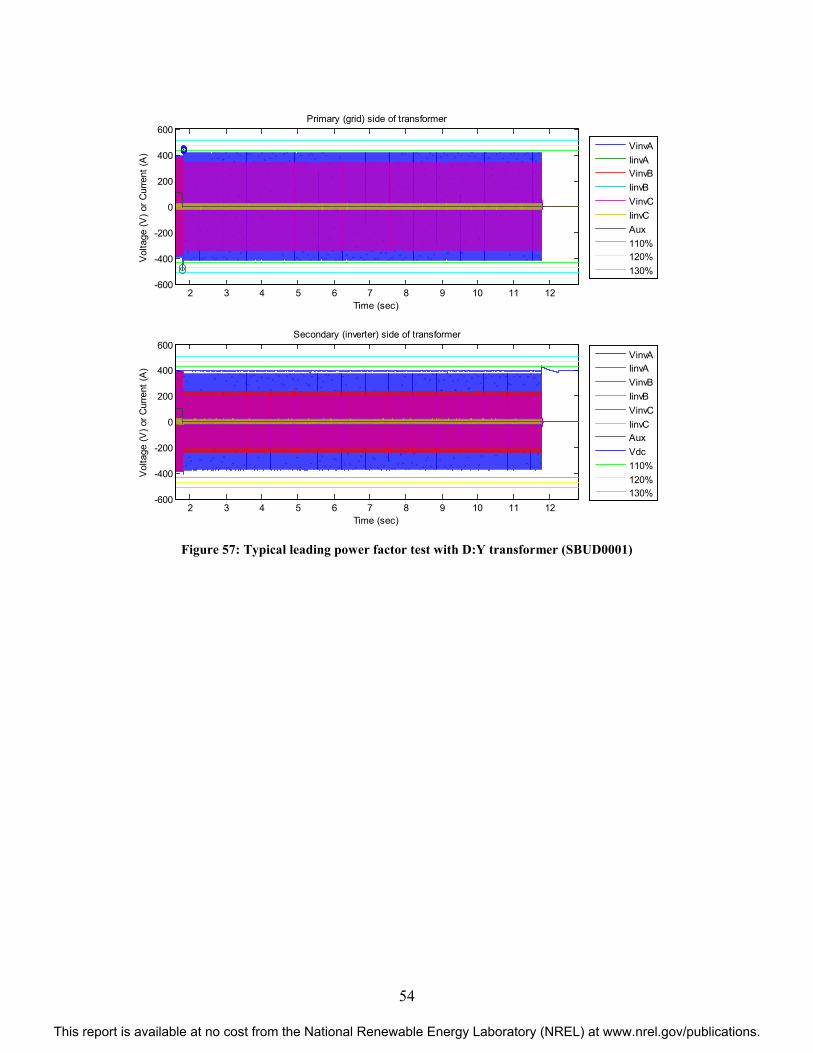
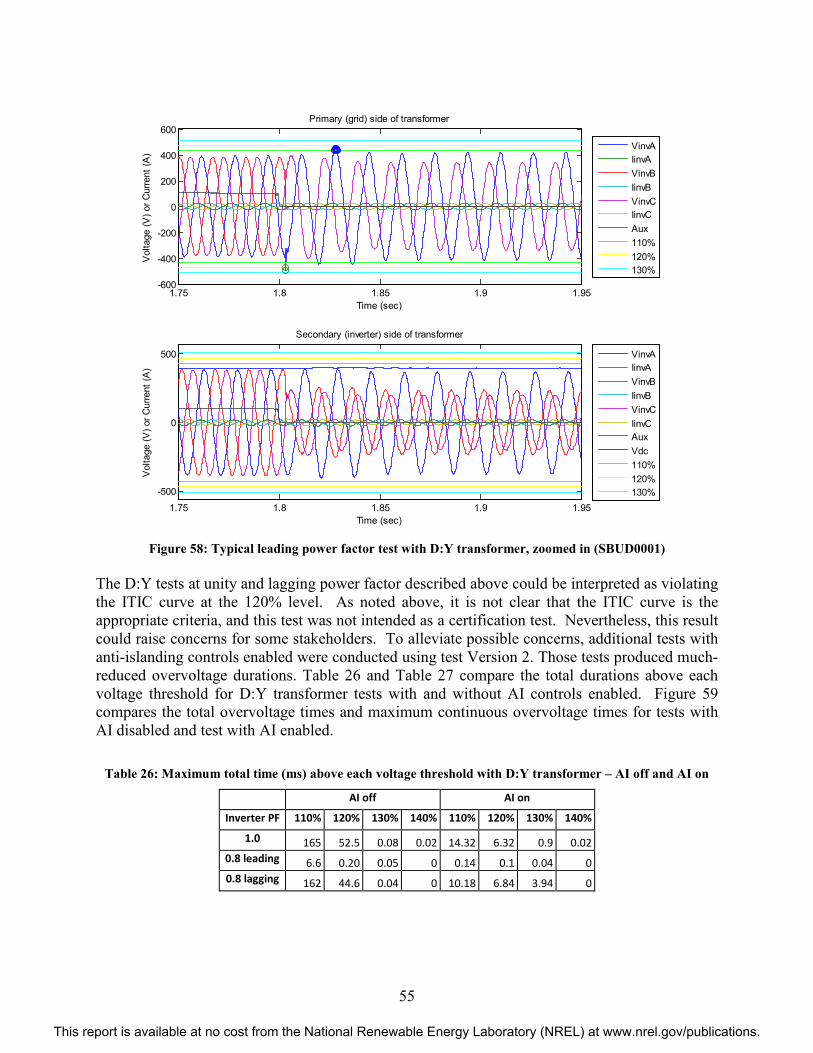
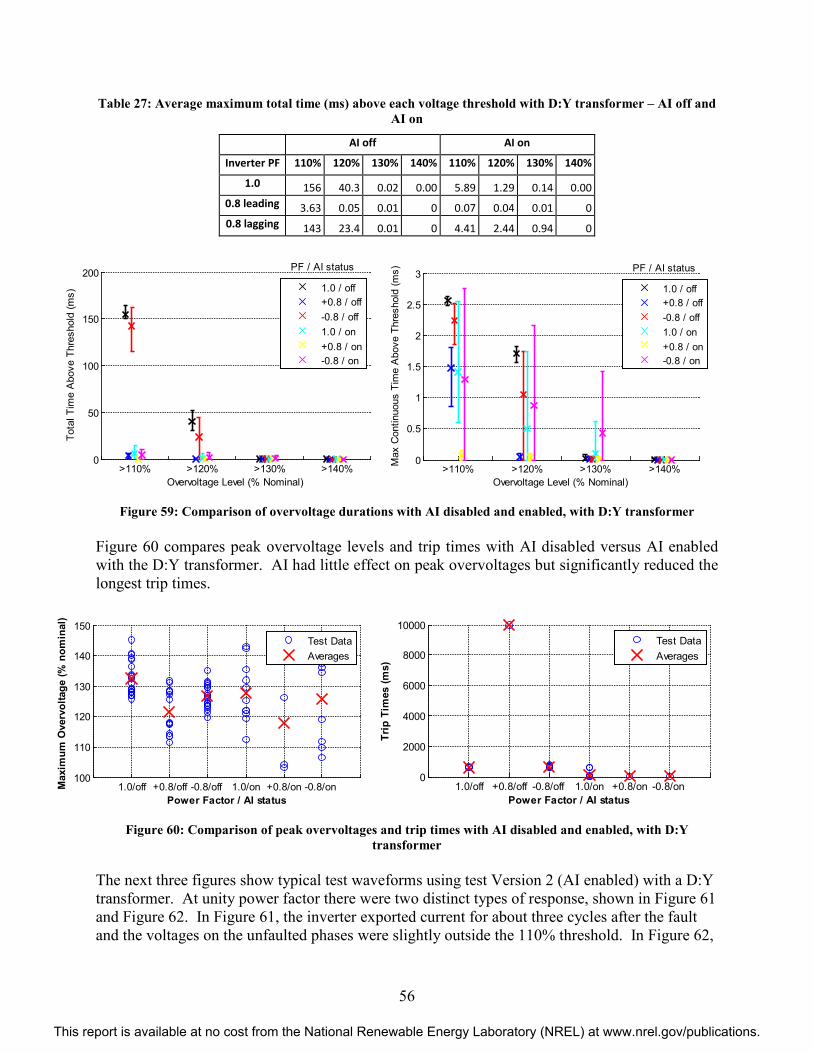

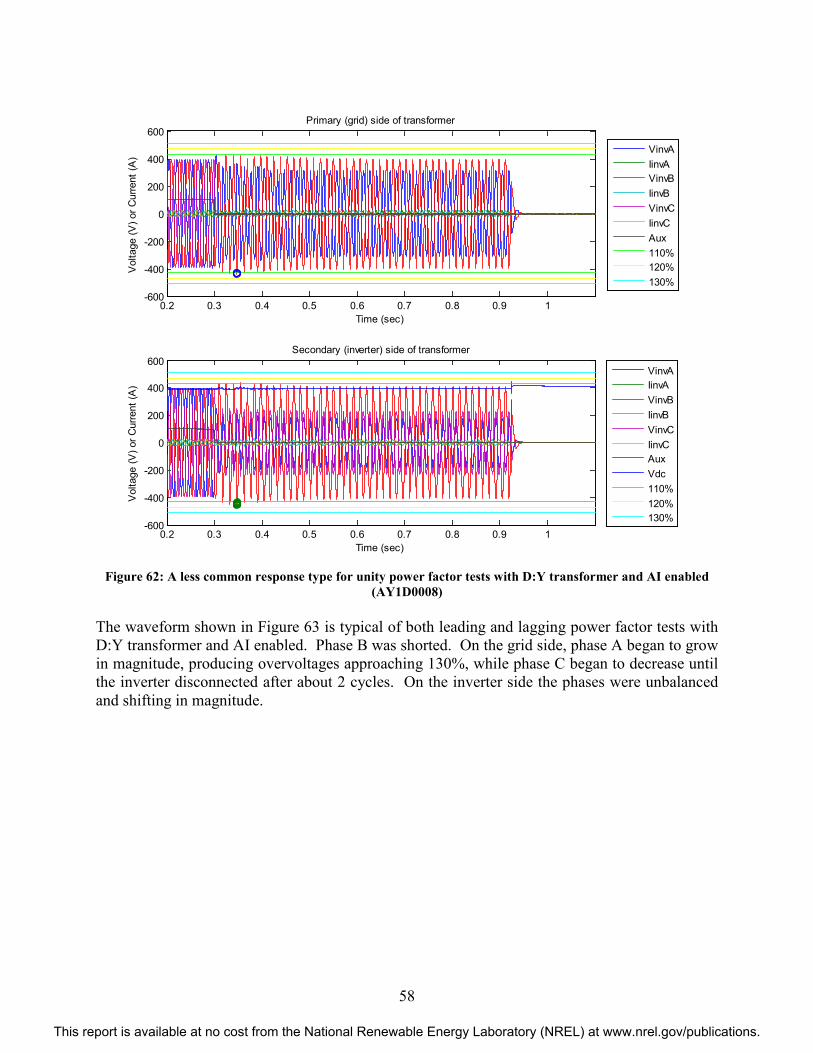


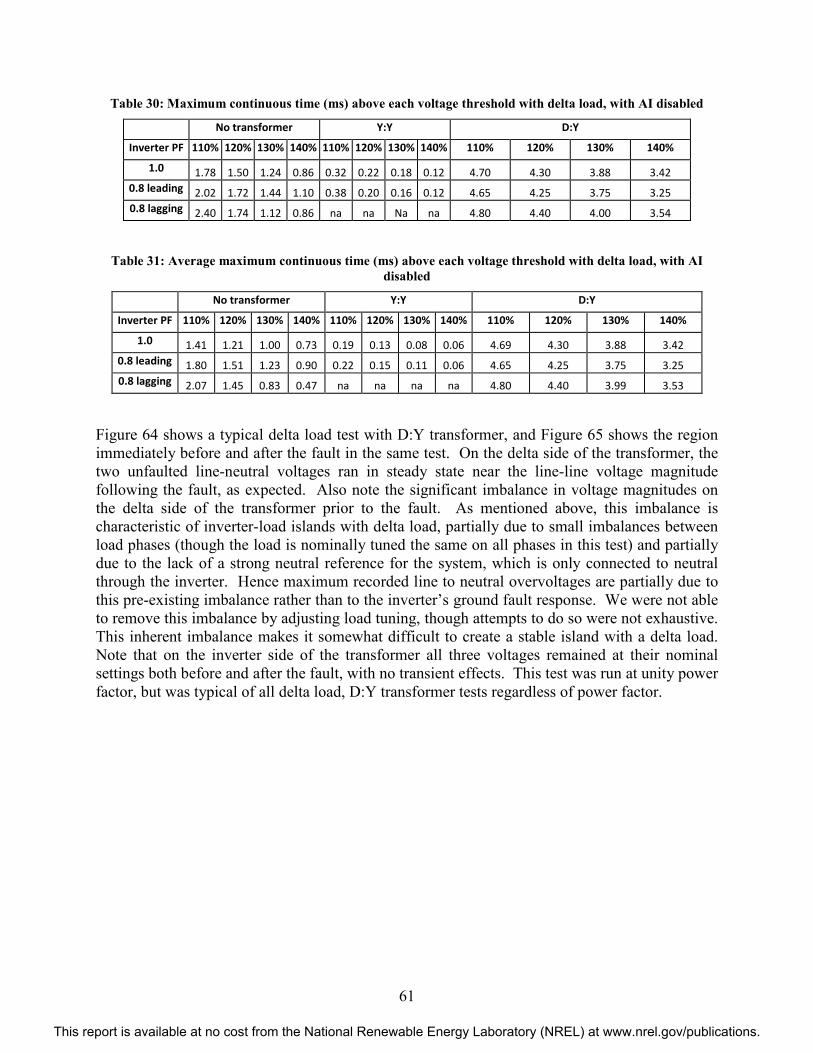
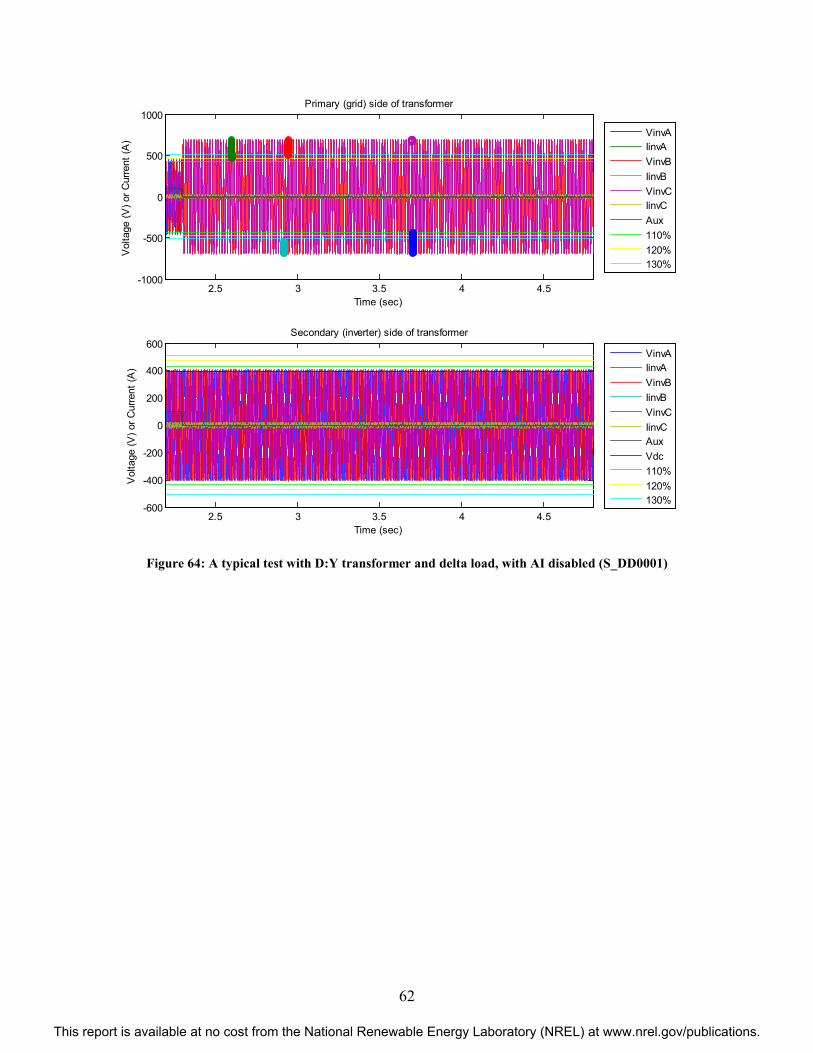
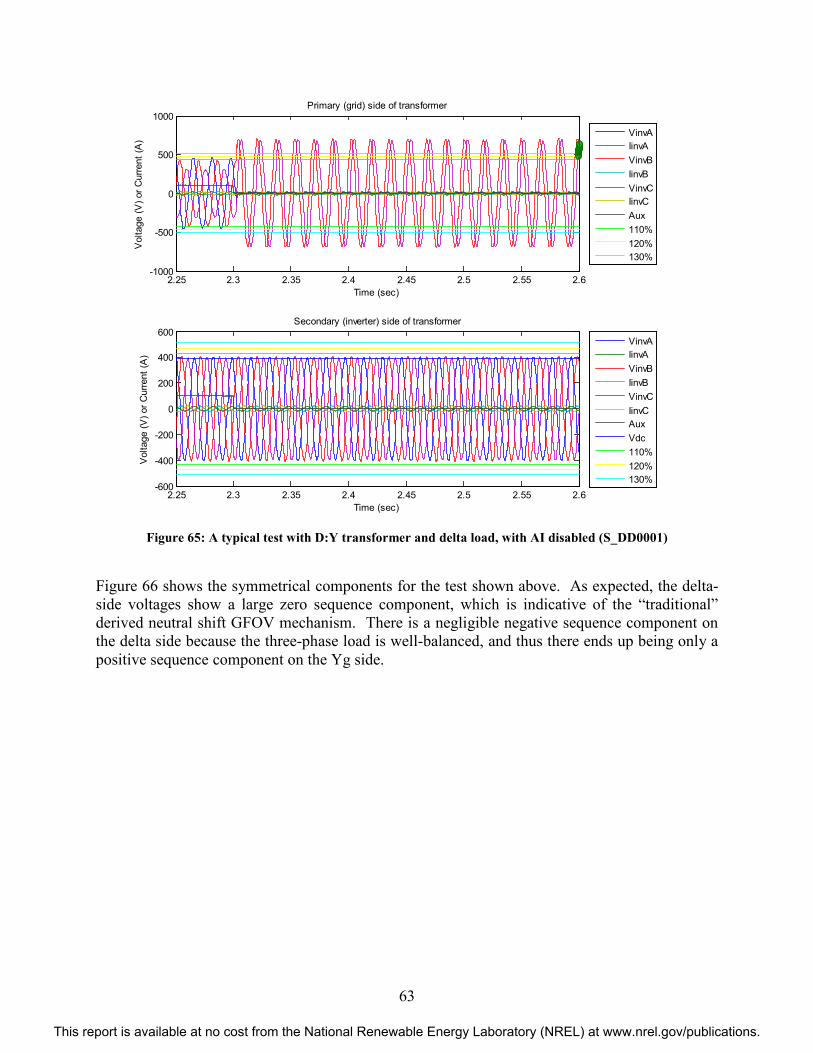

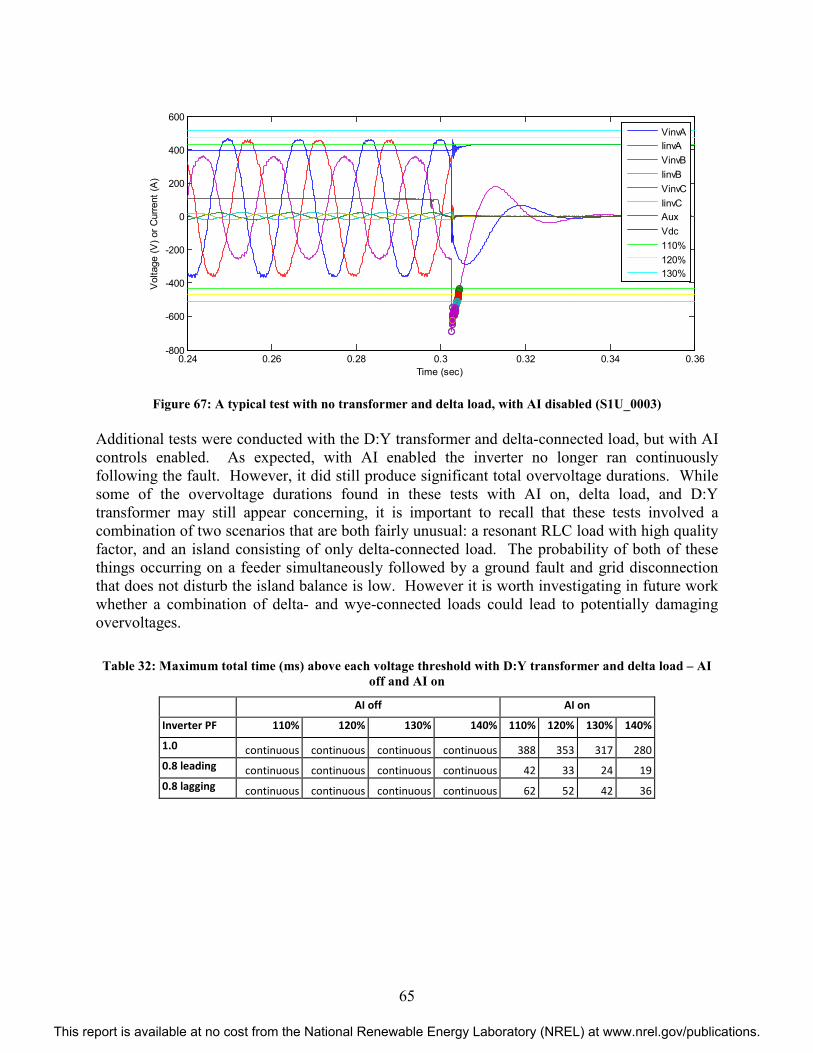
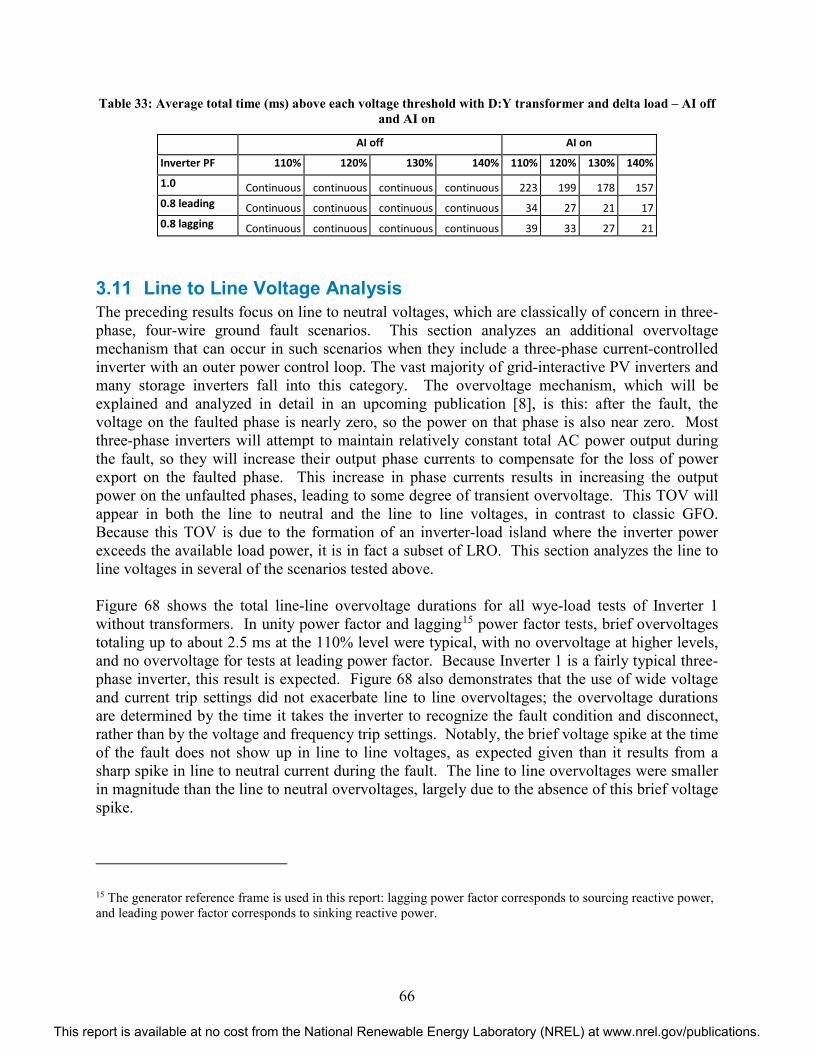
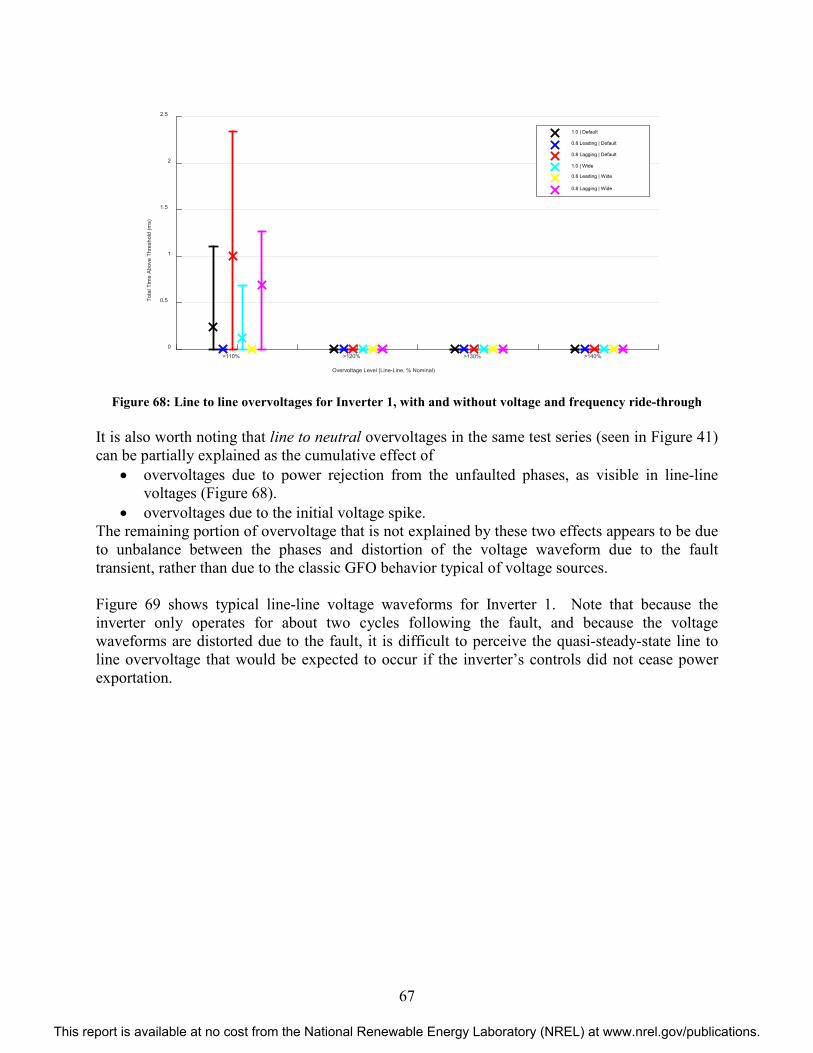
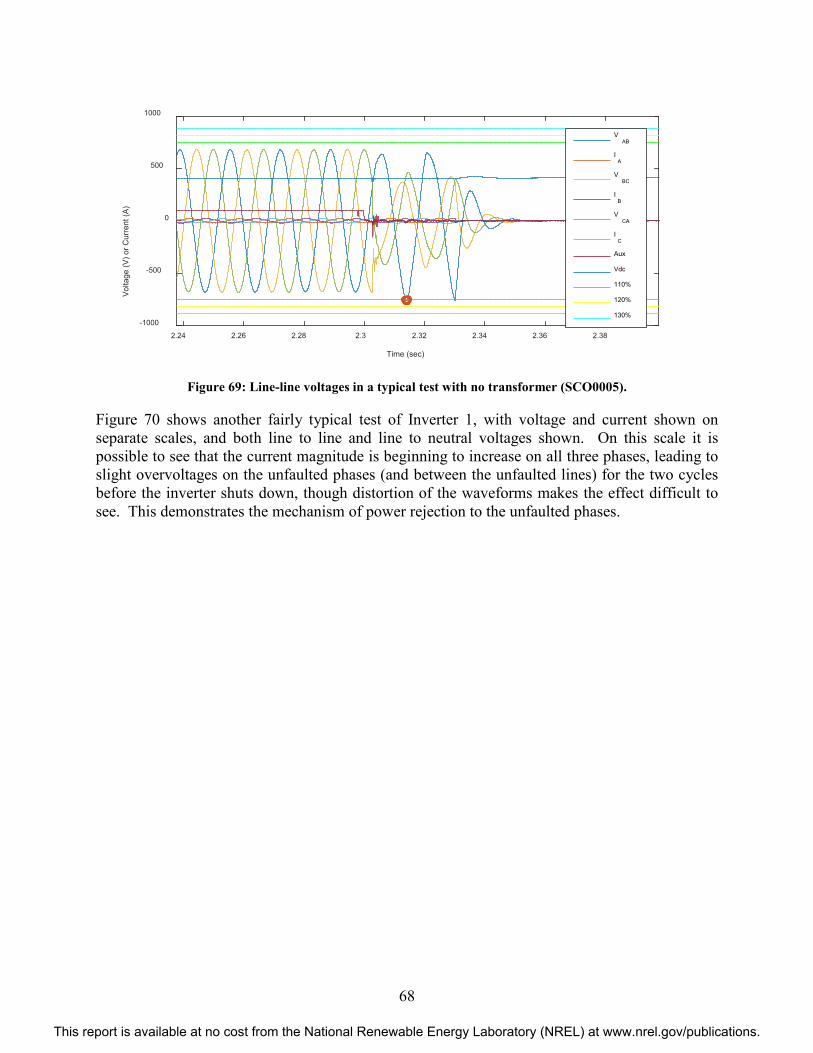
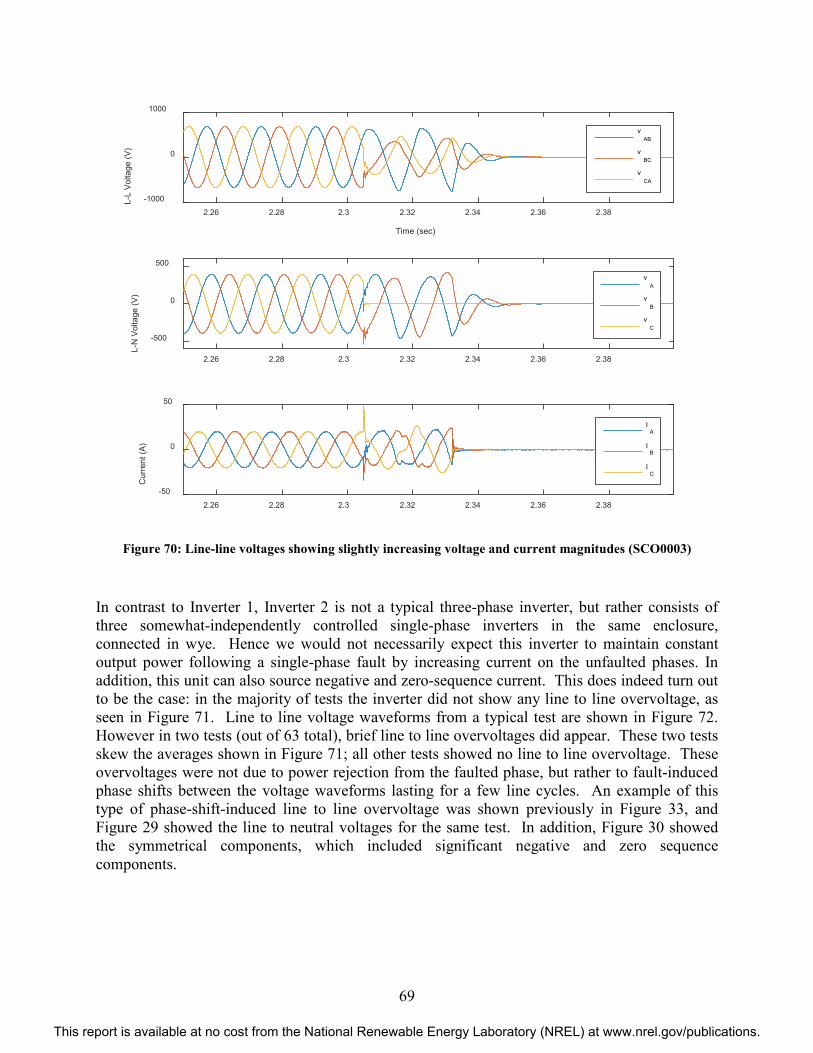
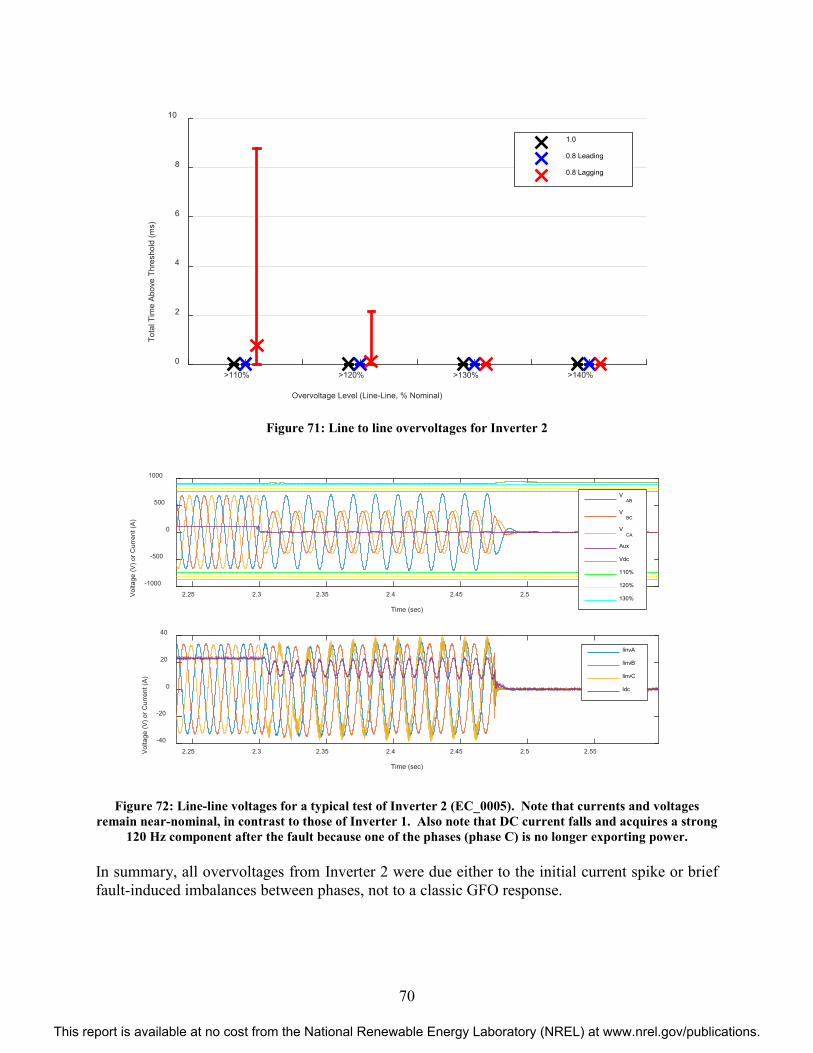


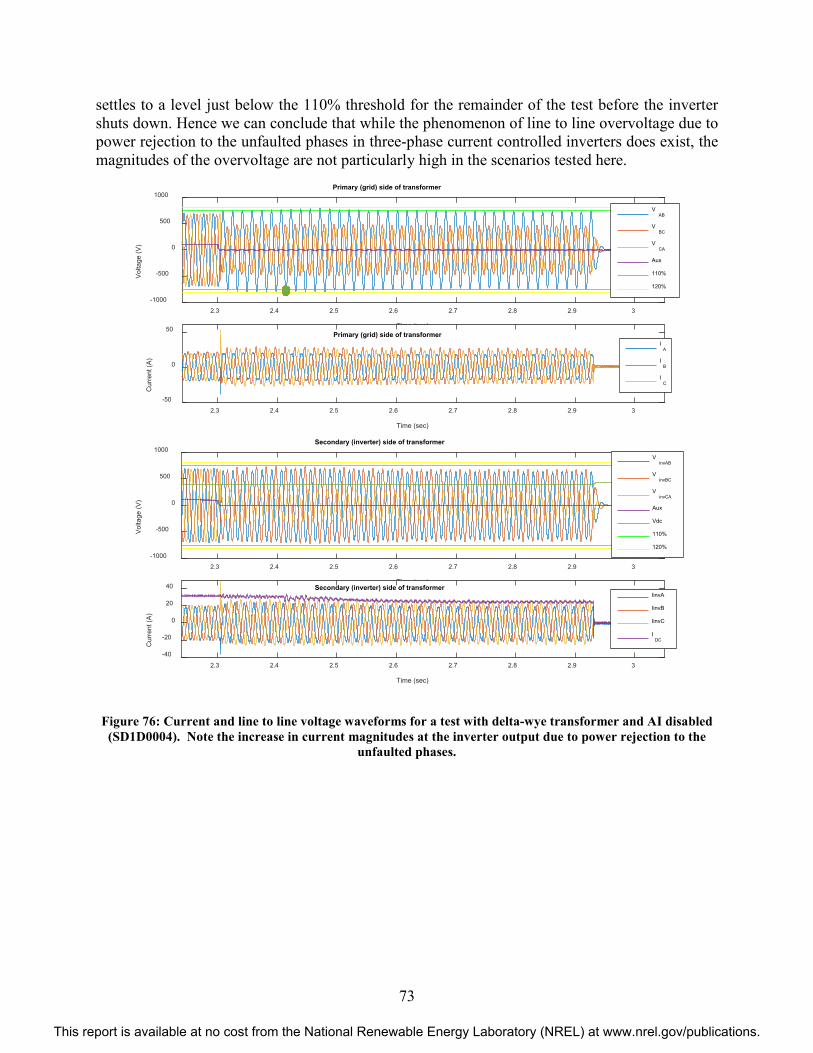


![Protection for Submodule Overvoltage caused byorca.cf.ac.uk/129648/1/Li G - Protection for Submodule...HVDC circuit breakers (DCCBs) [10] and MMC topologies with dc fault blocking](https://static.documents.pub/doc/80x56/5faf9bfb1fcc5938ec4c6cf1/protection-for-submodule-overvoltage-caused-g-protection-for-submodule-hvdc.jpg)


