A Invesco Global Sovereign Asset Management Study 2013–17 At the feet of giants: 5 years of observing the world’s sovereign investors This study is not intended for members of the public or retail investors. Full audience information is available inside the front cover.
Transcript
A
Invesco Global Sovereign Asset Management Study2013–17
At the feet of giants: 5 years of observing the world’s sovereign investors
This study is not intended for members of the public or retail investors. Full audience information is available inside the front cover.
Important information
This document is intended only for investors in Hong Kong, for Institutional Investors and/or Accredited Investors in Singapore, for certain specific sovereign wealth funds and/or Qualified Domestic Institutional Investors approved by localregulators only in the People’s Republic of China, for certain specific Qualified Institutions and/or Sophisticated Investors only in Taiwan, for Qualified Professional Investors in Korea, for certain specific institutional investors in Brunei, for Qualified Institutional Investors and/or certain specific institutional investors in Thailand, for certain specific institutional investors in Malaysia, for certain specific institutional investors in Indonesia and for qualified buyers in Philippines for informational purposes only.
01
IntroductionIn June we published our fifth annual study of the sovereign asset management industry. Over the past five years and in conducting over 320 interviews we’ve sought to provide insights into this evolving and sophisticated investor segment as they’ve navigated economic and political challenges. Accordingly, it seems timely to bring together key data, themes and learnings from the past five years while taking the opportunity to consider what the future may hold. While some of the sovereign investors we have spoken with are well established, much of this segment is relatively youthful and developing rapidly as investors and institutions. This, together the breadth of geographical coverage and sovereign segments interviewed (as set out in figure 1) has led to five years of diverse themes emerging. On reflection though some strong themes resonate across the sovereign segment and in splitting this anniversary report down into three core sections we’ve sought to summarise those. We start by considering the sovereign segment broadly, reviewing our segmentation model and using that to map five year performance numbers and funding levels. Next we assess the evolution of sovereign investment portfolios across asset classes and geographical allocations while providing some thoughts on how these portfolios may evolve over the next five years. We conclude by considering how sovereigns have evolved as institutions, assessing broad capabilities and performance ratings and themes such as internalisation. We expect the next five years to represent a further stage of evolution for sovereign investors and look forward to bringing further evidence-based insights on this fascinating and important group of investors.
Key numbersCurrent and projected state of the sovereign investor segment, based on five years of proprietary data.
Evolution as investorsDespite the large variations between sub-segments there are characteristics of sovereign investors which distinguish them from other institutional segments.
Evolution as institutionsSovereigns are adding experience to youthfulness, and will assume a powerful and positive role in markets and economies, but will have to deal with a broad range of scale issues.
Terry PanChief Executive Officer, Greater China,Singapore and [email protected]+85231286128
02
Section 1Key numbers While relatively small in number compared to pension funds, sovereign investors are a large category in asset terms, and by 2022 we forecast that they will account for over an estimated US$14 trillion of investments. Distinct segments make sovereigns a diverse set of asset owners with their own evolutionary path and different needs to other institutions.
Tsing Ma Bridge,Hong Kong
02
0303
04
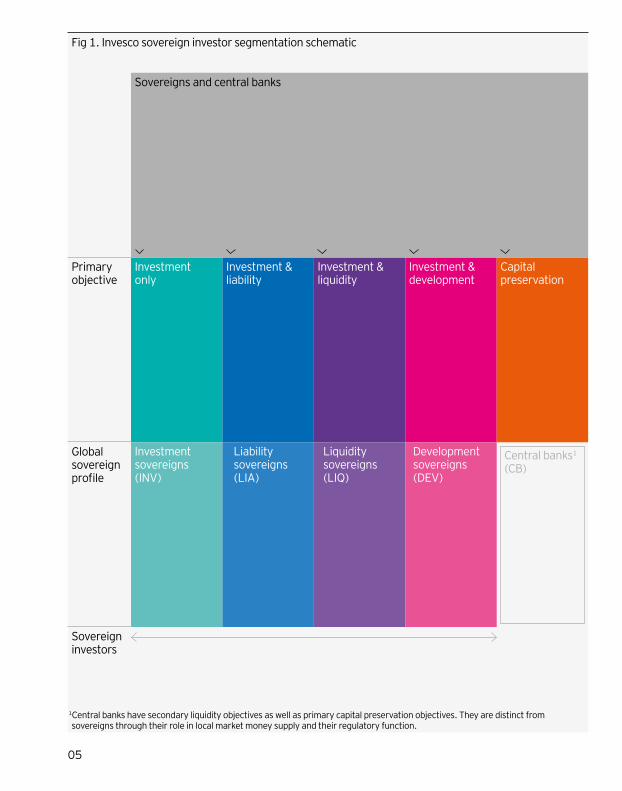
Defining sovereign investorsIn launching the Invesco Global Sovereign Asset Management Study in 2013, our first task was to decide what constituted a sovereign investor.We defined them primarily by their government ownership, though the structure and degree of government control exerted varies substantially, ranging from largely hands-off, once the objective and mandate have been set, to active involvement.
The category includes a highly diverse range of global investors, differing by:— Size— Funding and liability structures— Internal capability— Risk appetite— Investment objective
However, there are commonalities within the category, which resulted in proposing and adopting a segmentation, permitting a more granular view:— Investment sovereigns— Liability sovereigns— Development sovereigns— Liquidity sovereigns
Central banks were added as a fifth segment in 2015. Investment sovereigns do not have any liabilities, allowing for long time horizons and high exposure to illiquid asset classes. Long-term return targets tend to be high. Liability sovereigns by contrast are designed to fund one or more sets of liabilities. These may be current liabilities (in which case the sovereign already has outflows) or future liabilities (implying future outflows, even if distant, and therefore known as partial liability sovereigns). Partial liability sovereigns have similar strategies to investment sovereigns but matching outflows is key for funds with current liabilities. Liquidity sovereigns are intended to stabilise and stimulate commodity-based economies during a market shock. Given the near impossibility of predicting the timing of such events and the potential for outflows to be large and urgent, liquidity sovereigns have short time horizons and prioritise liquidity over investment returns.
Development sovereigns are distinctive in being designed to encourage domestic economic growth alongside return generation. Development sovereigns take large or controlling stakes in companies seen to be of economic significance, to accelerate grow their presence in the local market and contribute to GDP and employment. In the context of sovereign investors, central banks are lenders of last resort, managing a foreign reserves portfolio available to bail out systematically important financial institutions.Due to the nature of this mission, certainty and availability of capital is the primary objective, making for risk aversion in the form of short time horizons and highly liquid investments. Central bank reserves are mainly held in foreign government securities, with a related requirement for currency management. With the emergence of negative yields, some central banks have added asset classes such as equities to both ameliorate the negative yield environment and help diversify capital risk.
05
Fig 1. Invesco sovereign investor segmentation schematic
1Central banks have secondary liquidity objectives as well as primary capital preservation objectives. They are distinct from sovereigns through their role in local market money supply and their regulatory function.
Sovereigns and central banks
Investment only
Primary objective
Investment sovereigns (INV)
Global sovereign profile
Investment & liability
Liability sovereigns (LIA)
Sovereign investors
Investment & liquidity
Liquidity sovereigns (LIQ)
Investment & development
Development sovereigns (DEV)
Capital preservation
Central banks1
(CB)
06
PerformanceThe 2012–16 period has been largely favourable for sovereign investors and the segment has produced a consolidated return of slightly more than 7% p.a. Liability sovereigns performed best with a return of 8.3% p.a. The return profiles of the different sovereign segments can be expected to vary substantially over short and long terms. Investment and liability sovereigns are most comparable. The capital preservation objective of the liquidity sovereigns segment means they will have a much lower risk/return profile, while the direct strategic investment focus of the development sovereigns segment makes it equity linked but relatively uncorrelated.
07
Sovereigns(49) (51)
Investment(8) (10)
Liability(22) (26)
Liquidity(5) (6)
Development(10) (9)
4.1 4.1
2.5 2.6
5.8
4.9
2.4
3.7
4.6
0.2
Sovereigns(51)
Liability(26)
8.3
6
7.2
Liquidity(6)
Development(9)
Investment(10)
3.6
7.8
Fig 2. Average annualised 5-year returns (2012–2016) (% AUM)
Source: Invesco Global Sovereign Asset Management Study 2017. Returns taken from 1 January 2012 to 1 January 2017. Sample excludes central banks. Sample sizes shown in brackets.
Fig 3. Average annual returns (2015, 2016) (% AUM)
Source: Invesco Global Sovereign Asset Management Study 2016–2017. 2015 returns taken from 1 January 2015 to 1 January 2016, 2016 returns taken from 1 January 2016 to 1 January 2017. Sample excludes central banks. Sample sizes shown in brackets.
• 2016 • 2017
08
Shorter term returns have been more subdued, with category returns for 2016 closer to 4% . However expectations of future returns are improving from a trough, particularly with an outlook for higher interest rates. Segment return expectations have risen to 5.5% , driven by improved outlooks for liquidity and development sovereigns.
09
Sovereigns(42)
Investment(8)
Liability(21)
Liquidity(5)
Development(8)
4.1
5.5
2.6
5.14.9
5.9
2.2
4.6
6.7
2.4
Fig 4. 2016 actual and 2017 expected average annual returns (% AUM)
Source: Invesco Global Sovereign Asset Management Study 2017. Achieved returns taken from 1 January 2017, target returns for taken for 1 January 2018. Sample excludes central banks. Sample sizes shown in brackets.
• Achieved• 2017E
10
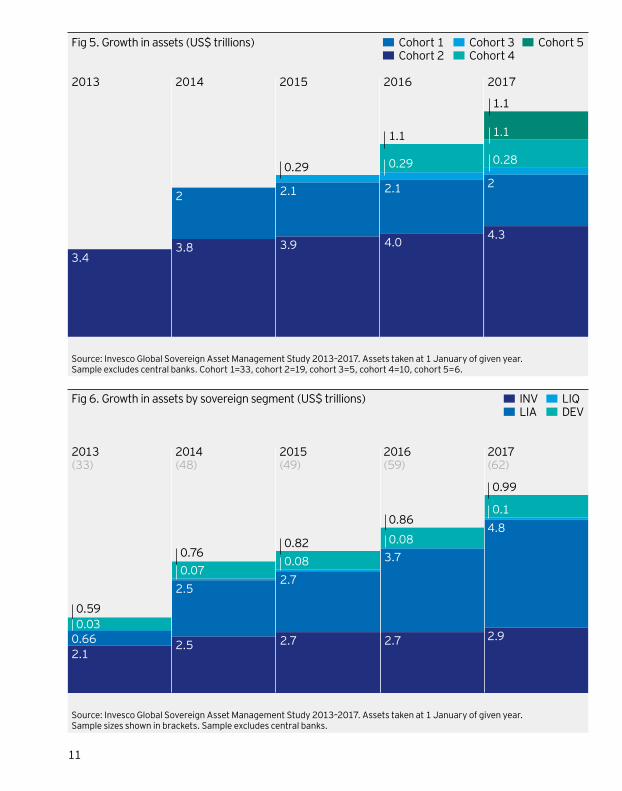
Size From the first sovereign wealth funds conceived in the 1950s, sovereigns have evolved to become investors of substantial scale and influence, with sovereigns globally estimated to have assets of US$9.3 trillion at the end of 2016 (according to NMG’s analysis of sovereign wealth funds globally). The original 2013 cohort of 43 sovereigns (weighted heavily towards mid-sized emerging market sovereigns) has experienced asset growth of ~7% pa to reach assets of US$4.3 trillion in 2017. Subsequent expansion of the sample to 62 has increased the AUM being tracked to US$8.8 trillion, an estimated 94% coverage by AUM of the sovereign universe. Development sovereigns have seen the fastest rate of growth within the sample since 2013, with investment and liability sovereigns growing at single digit rates. In 2017, the largest sovereign in each segment was:— Investment: US$906bn— Liability: US$1,178bn— Liquidity: US$44bn— Development: US$513bn
11
2013(33)
2014(48)
2015(49)
2016(59)
2017(62)
2.10.660.030.59
2.5 2.7 2.7 2.9
4.8
0.1
0.99
3.70.08
2.7
0.820.760.07
2.5
0.86
0.08
2013 2014 2015 2016 2017
3.43.8 3.9 4.0
4.3
2
0.28
2.1
0.29
1.1
1.1
1.1
2.1
0.29
2
Fig 5. Growth in assets (US$ trillions)
Source: Invesco Global Sovereign Asset Management Study 2013–2017. Assets taken at 1 January of given year. Sample sizes shown in brackets. Sample excludes central banks.
Fig 6. Growth in assets by sovereign segment (US$ trillions)
• Cohort 1• Cohort 2
• Cohort 3• Cohort 4
• Cohort 5
• LIQ• DEV
• INV• LIA
Source: Invesco Global Sovereign Asset Management Study 2013–2017. Assets taken at 1 January of given year. Sample excludes central banks. Cohort 1=33, cohort 2=19, cohort 3=5, cohort 4=10, cohort 5=6.
12
Analysis of the 2017 sample shows the biggest segment by number of investors is liability sovereigns at 28. By comparison, there are 13 development sovereigns, 12 investment sovereigns (the largest by average AUM), and 9 liquidity sovereigns in the 2017 sovereign study sample. The 35 central banks which form the study’s fifth segment are sub-segmented regionally into developed and emerging markets, with emerging market central banks being the largest segment2.
2 Note that the central bank sample is deliberately overweight to emerging market banks due to their propensity for investment in return-seeking assets.
13
28
13
12
23
9
12
Fig 7. Composition of the 2017 Invesco sovereign sample by segment
Source: Invesco Global Sovereign Asset Management Study 2017. Sample sizes shown within the chart.
• Liability• Central banks — Emerging mkts• Development• Investment• Central banks — Dev mkts• Liquidity
14
Sovereign investors are present across most geographic regions. Regions tend to reflect different concentrations:— Western: investment sovereigns (often
sourced from hydrocarbon revenues) and liability sovereigns (typically North American state pension funds).
— Asia: liability sovereigns (state pension funds), development sovereigns (notably in southeast Asia, and investment sovereigns (dominated by China and Singapore).
— Middle East: investment and development sovereigns (hydrocarbon revenue based in both cases).
— Emerging markets: liquidity sovereigns.
15
2013(33)
2014(48)
2015(49)
2016(59)
2017(62)
1.2
0.19
0.98
1.01.2
1.5
3.0
0.3
1.4
1.5
0.273.2
2.4
3.1
3.8
0.29
1.5
2.9
0.3
1.4
Source: Invesco Global Sovereign Asset Management Study 2013–2017. Asset taken at 1 January of given year. Sample size shown in brackets. Sample excludes central banks.
Fig 8. Growth of the Invesco sovereign sample by region (US$ trillions) • WEST • ASIA
• EM • ME
16
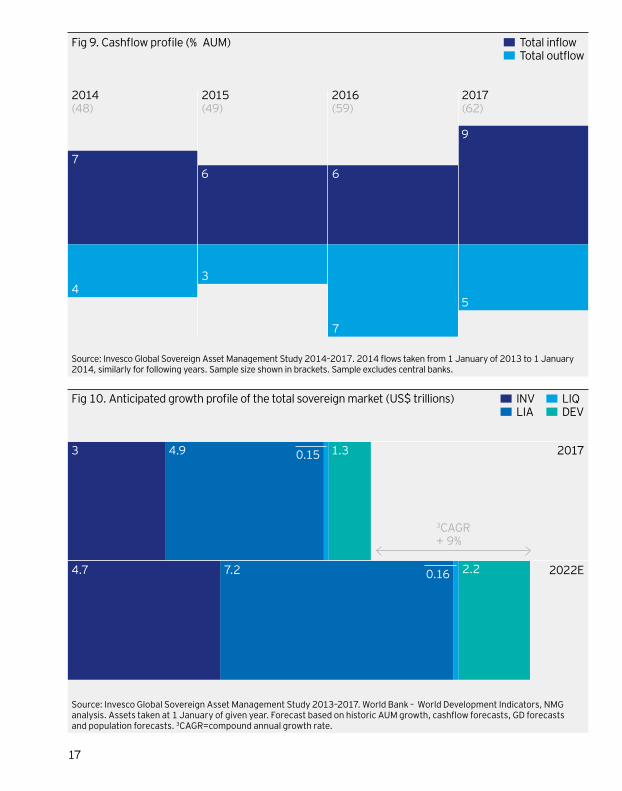
FundingIn the years leading up to the commencement of the study (in 2013), sovereigns had experienced relatively consistent inflows, but this has become less predictable. The fall in the price of oil and other commodities greatly reduced surpluses, which were the funding sources for hydrocarbon-based funds, while fiscal challenges have impacted those with funding sources in general government. There has also been corresponding pressures on outflows. Outflows will rise over time as populations age and pension demands increase.However the subdued economic environment in the wake of the financial crisis has seen demands for increased public spending in many countries, satisfied in some cases by tapping sovereign funds. The outlook for asset growth is positive, but modestly so. Although public fiscal positions remain under pressure, other macroeconomic strains that have slowed sovereign asset growth have eased:— Commodity prices have improved— Working populations are still growing
in key countries
Our expectation is for organic growth of ~2% p.a. Investment returns achieved and reinvested are in addition to this figure, implying a total forecast growth rate of ~9% p.a. given future expected returns of ~6% p.a. Beyond this, there are prospective inorganic changes to the sovereign landscape with the potential to shift growth rates: — Profile changes, e.g. Ireland move from
Future Fund to Development Fund— Significant new asset sourcing,
e.g. Saudi Aramco listing to fund PIF— Potential for all sovereigns to enter more
consistent drawdown phase
17
2014(48)
2015(49)
2016(59)
2017(62)
43
7
5
9
667
Fig 9. Cashflow profile (% AUM)
Source: Invesco Global Sovereign Asset Management Study 2014–2017. 2014 flows taken from 1 January of 2013 to 1 January 2014, similarly for following years. Sample size shown in brackets. Sample excludes central banks.
2017
2022E
3
4.7 7.2 0.16 2.2
4.9 0.15 1.3
3CAGR+ 9%
Fig 10. Anticipated growth profile of the total sovereign market (US$ trillions)
Source: Invesco Global Sovereign Asset Management Study 2013–2017. World Bank — World Development Indicators, NMG analysis. Assets taken at 1 January of given year. Forecast based on historic AUM growth, cashflow forecasts, GD forecasts and population forecasts. 3CAGR=compound annual growth rate.
• Total inflow• Total outflow
• INV• LIA
• LIQ• DEV
18
Section 2 Evolution as investorsAs a category sovereigns control a highly diverse portfolio, although certain segments, particularly liquidity and development sovereigns, have more restricted profiles. Across the past five years of the sovereign study, the key investment theme has been the swapping of fixed income exposure for higher allocations to a range of alternative investments.
Tulip fields,The Netherlands
18
1919
20
Initially sovereigns invested the majority of their portfolio in low risk, highly liquid assets classes, often with limited appetite for risk asset exposure due to high levels of public accountability (albeit with high profile exceptions). With the accumulation of experience in investment teams and the decline of bond yields making it increasingly difficult to meet return objectives, sovereigns have more recently sought greater exposure to return-seeking assets in order to diversify their portfolio and improve returns. Long time horizons have seen many sovereigns target risk asset exposure via alternative asset classes. This trend is clearly visible in figure 11. In most cases, asset class exposures have been relatively stable. The core change from 2014 onwards has been the reduction of allocations to bonds and cash towards alternatives. While direct strategic investments (investments with domestic economic growth prioritised above return generation) have also declined as a proportion of the overall sample asset allocation, this largely represents dilution of this exposure due to increased development sovereign allocations to return seeking assets (such as equities and, more recently, alternatives), rather than disinvestment decisions.
21
2013(33)
2014(48)
2015(44)
2016(57)
2017(62)
29
29
19
1675
17
16
29
332929
33
12
17
9
26
35
10
227
11
18
9
33
Source: Invesco Global Sovereign Asset Management Study 2013–2017. Asset allocation taken at 1 January of given year. Sample size shown in brackets. Sample excludes central banks.
2014(48)
2013(33)
2015(44)
2016(57)
2017(62)
3.2 3.6
4.31.51.6
0.90.5
1.52.1
4.1
3.04.5
6.5
2.8
2
0.6
6.5
8.1
2.11.6
0.3
3.11.5
1.8
0.8
Source: Invesco Global Sovereign Asset Management Study 2013–2017. Asset allocation taken at 1 January of given year. Sample size shown in brackets. Sample excludes central banks.
Fig 11. Evolving asset allocation profile (% AUM)
Fig 12. Evolving alternative investments allocations (% AUM)
• Equity • Bond• Alternatives
• Private equity • Real estate• Infrastructure
• DSI • Cash
• Hedge funds • Commodities
22
Looking in more detail at alternative allocations, there has been broad support for the illiquid asset classes. The biggest beneficiary has been real estate, where allocations have expanded from 3.1% to 8.1% . Private equity has also seen a substantial increase from 3.2% to 6.5% , with a smaller increase to infrastructure from 1.5% to 2.1% . In the context of an US$8 trillion segment, these are significant changes in a short space of time. This trend towards alternatives is mirrored by geographic allocations. Since their inception, sovereigns have increased the geographic breadth of their investments in order to diversify their portfolio. However, alternatives require higher levels of governance and investment monitoring, making home markets the preferred location, at least initially while experience is accumulated. As allocations to real estate and infrastructure have accelerated, this is also reflected in home market allocations increasing from 40% in 2015 to 47% in 2017. The focus on local alternative investments is also aligned to the development of internal investment capability, as we explore in Section 3.
23
2013(33)
2014(48)
2015(39)
2016(55)
2017(57)
9
50
41
10
45
45
11
49
40
12
43
45
11
42
47
2017 2022E
28.8
18.5
29.7 29.2
26.1
24.4
14.65.76.5
16.5
Fig 13. Evolving geographic allocations (% AUM)
Fig 14. Forecast asset allocation profile of the total sovereign market (% AUM)
Source: Invesco Global Sovereign Asset Management Study 2013–2017. Geographic allocation taken at January 1 of given year. Sample size shown in brackets. Sample excludes central banks.
Source: Invesco Global Sovereign Asset Management Study 2013–2017, NMG analysis. Asset allocation taken at 1 January of given year. Forecasts based on historical asset allocation, stated asset growth, cashflow forecasts and reinvestment rates.
• Home market • Developed market• Emerging market
• Equity • Bond• Alternatives
• DSI • Cash
24
We expect to see allocations to equity asset classes sustained at around current levels, a troughing of allocations to fixed income, with a slight contraction in direct strategic investments, largely as a result of growth in other parts of the segment. Alternatives will continue to be the main beneficiary of increased allocations, but the expected timing of sovereigns’ liabilities will influence the preferred type of investments.Sovereigns are utilising cashflows from real estate investments to match near term liabilities, and as interest rates become more positive, we expect to see this augmented with greater demand for high yielding debt, alternative debt and direct lending. The strong match between many of the alternative asset classes and sovereign investors means there are sound reasons to expect the trend towards alternatives to continue to play out over the next five years. To an extent, the potential dealflow in coming years reflects that despite the expansion of alternatives allocations in the past five years, many sovereigns are still underweight. This is especially the case for infrastructure and private equity.
Allocation drivers Constraints Potential 5-year capitaltotal to beplaced4
Private equity – Deal availability– Ability to manage internally– Influence via governance– Transferrable internal expertise
through Direct StrategicInvestments
– Quality manager capacity,dealflow
– Foreign government controlissues
US$340bn
Infrastructure – Very long time horizons– Attractiveness (to developer)
of sovereigns as large, singleinvestor
– Potential for US renewal
– Long lead times to get invested -scarce dealflow and high levelsof competition
– Foreign government controlissues
US$270bn
Real estate – Deal availability– Participation flexibility– Greenfield investment
opportunity– Potential for liability matching
– High valuations– Accessing opportunities
in overseas markets
US$570bn
4 Source: Invesco Global Sovereign Asset Management Study, NMG analysis
25
Infrastructure Private equity High yield Fl Real estate Hedge funds
71
54
37
27
12
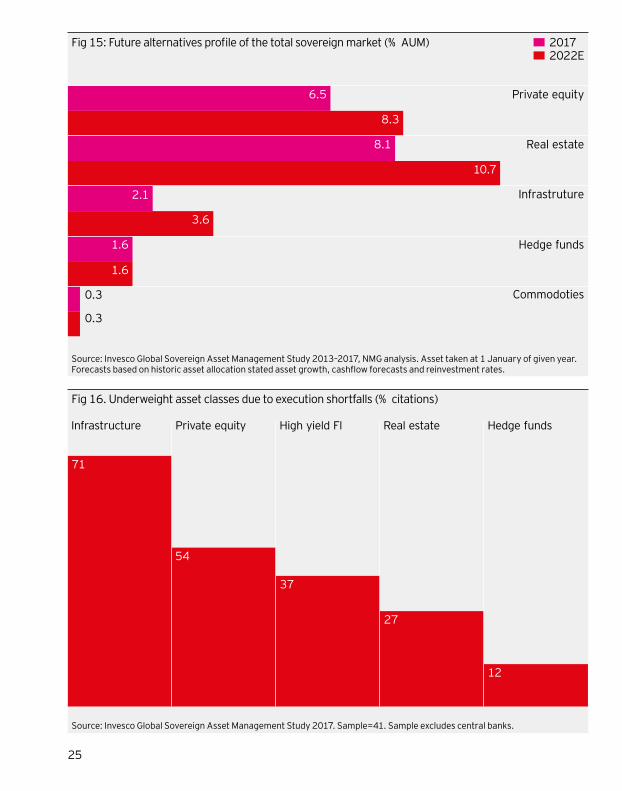
Fig 16. Underweight asset classes due to execution shortfalls (% citations)
Source: Invesco Global Sovereign Asset Management Study 2017. Sample=41. Sample excludes central banks.
Private equity
Real estate
Infrastruture
Hedge funds
Commodoties
6.5
8.3
8.1
10.7
2.1
3.6
1.6
1.6
0.3
0.3
Fig 15: Future alternatives profile of the total sovereign market (% AUM)
Source: Invesco Global Sovereign Asset Management Study 2013–2017, NMG analysis. Asset taken at 1 January of given year. Forecasts based on historic asset allocation stated asset growth, cashflow forecasts and reinvestment rates.
• 2017• 2022E
26
While there is still significant upside to alternative allocations, there are limitations to sovereign investment in illiquids:— Governance processes and formal limits
on exposure — Deal supply is finite and, despite strong
growth forecasts within each sub-asset class, increasing interest in alternatives from other investors is increasing competition
Accordingly, a gap may still persist between 2022 desired and achievable allocations. This will result in a continued search for new assets and strategies which will assist in meeting objectives.
27
2022E2017
29
195
753
601
1200
1500
520
225
41
148
Fig 17. Forecast growth in alternative allocations of the total sovereign market (US$ billions)
Source: Invesco Global Sovereign Asset Management Study 2013–2017, NMG analysis. Asset taken at 1 January of given year. Forecasts based on historic asset allocation, stated asset growth, cashflow forecasts and reinvestment rates.
• Hedge funds • Commodities
• Private equity • Real estate• Infrastructure
28
Section 3Evolution as institutionsSovereign investors are organisations, not just portfolios, and are on a journey of capability development across both investment and business disciplines. Those capabilities will be critical to dealing with the challenges of growing scale and successfully maintaining a valued role into the future.
High mountain reservoirs,Kaprun, Austria
28
2929
30
Sovereign investors have evolved not just as investors over 2013–17, but also as institutions.Sovereigns face the same challenges as other asset owners in attracting and retaining people, building capabilities, and developing processes and governance. Often they are doing so in a more difficult environment relative to asset managers and pension funds including:— Sovereigns are often restricted in the
remuneration they can offer candidates, forcing them to be more imaginative in competing against other employers for talent.
— Many sovereigns are relatively young organisations and building capabilities from the ground up.
— Governance and oversight tends to be stricter, requiring additional investment in monitoring and reporting.
— Sovereigns are limited in their ability to set up international offices.
CapabilitiesWhile people & talent remains the top and unchanged priority, there have some notable uplifts over the period in capabilities which sovereigns rate as important, both investment and business. Investment capabilities which have become significantly more important include asset allocation, benchmarking, internal asset management, and fund manager selection.Business capabilities of increasing importance include governance, transparency, operational risk management, and reporting.
31
People & talent
Asset allocation
Governance
Range of benchmarks
Investment risk management
Internal asset management
Operational risk management
Investment reporting
Transparency
Currency management
Fund manager selection
Internal private equity expertise
Use of consultants
8.3
8.4
7.4
8.3
7.3
7.9
7.0
7.9
7.7
7.8
6.7
7.8
7.0
7.7
7.0
7.7
6.3
7.3
7.0
N/A
5.7
5.1
6.6
5.3
6.0
7.0
Fig 18. Sovereign capability importance 2013–17 • 2013 • 2017
Source: Invesco Global Sovereign Asset Management Study 2013–2017. Sample: 2013=30, 2017=38. Sample excludes central banks. Rating on a scale from 1–10 where 10 is of the highest importance.
32
In virtually all cases, sovereigns see themselves as making progress, reducing gaps despite the bar rising over the period. The closure of gaps has been achieved by both design and circumstances:— Investment capability development has been
primarily a design decision — sovereigns have chosen to invest and develop capability.
— However, governance and monitoring capabilities are in many cases the result of the global financial crisis of 2008 triggering the development of internal governance and monitoring frameworks.
— Similarly, sovereigns have been forced to develop currency management capability in response to elevated currency volatility and geopolitical risks.
What were in the past quite serious gaps in people, asset allocation, internal asset management, and risk management, are now less so. This is reflected in the Invesco sovereign confidence index, with sovereigns more comfortable across all key metrics than at any point over the past five years. Despite widespread capability development some material gaps remain, particularly around people and internal asset management, which are partly connected.
33
People & talent
Capability asset/shortfall5
Asset allocation
Governance
Range of benchmarks
Investment risk management
Internal asset managemnet
Operational risk management
Investment reporting
Transparency
Currency management
Fund manager selection
Internal private equity expertise
Use of consultants
6.4 -1.9
-1.0
-1.4
-0.6
-0.1
-0.3
-0.7
-0.4
-1.4
-0.3
-1.2
-0.9
-0.4
-0.4
+0.2
0
+0.3
+0.2
N/A
-0.7
+0.1
+0.1
-0.9
-0.6
+0.3
+0.9
7.4
6.0
7.7
7.2
7.6
6.3
7.5
6.3
7.5
5.5
6.9
6.6
7.3
7.2
7.6
6.6
7.5
6.3
7.0
5.8
4.2
6.0
5.6
6.9
7.1
Fig 19. Sovereign capability performance and shortfalls 2013–177
Source: Invesco Global Sovereign Asset Management Study 2013 and 2017. 5Capability asset/shortfall defined as capability performance (as shown in green in figure 19) subtract capability importance (as shown in green in figure 18). Rating on a scale from 1-10 where 10 is the highest capability rating. Sample: 2013=27, 2017=58.
• 2013 • 2017
34
InternalisationInternalisation of asset management brings the potential for capacity, lower costs, more specialised investment capabilities, and more forms of participation. Those are particularly attractive in the alternative asset classes where many sovereigns have been expanding allocations, driving consistent increases in internal management over the past four years. However it also brings new issues. There is the perennial challenge of hiring quality professionals who are highly sought after, and the risk of internalising mediocrity. But that is only the tip of the iceberg. Internalisation of asset management also internalises risk and complexity, requiring larger support teams as well as investment teams. New large expenditures on systems and risk management offset some of the fee savings.Bringing in significant numbers of investment professionals from other parts of the industry will also have a significant impact on organisational culture. These issues are magnified where sovereigns open overseas offices. This can open up new opportunities by bringing investors closer to the source of deals. However it adds further to risk and complexity, introduces regional cultural differences, and potential ’us’ vs ’them’ team issues, which many multi-national participants have already experienced.
Future roleSomething that can be predicted with certainty is that the role of sovereigns will be greatly influenced by their growing scale. The smallest sovereign investor in our study has US$1bn in assets, the largest nearly US$1 trillion; the median around US$100bn. It is becoming increasingly difficult or impossible for sovereigns to maintain a low profile, and especially when they scale up beyond US$100bn in assets. Whether or not sovereigns have significant internalisation programmes, increasing scale tends to result in larger, more complex organisations. For investment portfolios, the issues are more subtle. Scale provides combinations of benefits and diseconomies at different points:— Smaller sovereigns (up to ~US$25bn in
assets) typically have less ability to invest in private market assets (other than by pooled exposures), but do have more potential to add value by active management in public markets.
— For mid-sized sovereigns (US$25–250bn) the trade-off is reversed. They have reduced ability to seek alpha in public markets — especially smaller home capital markets — but may still aim to do so in global equity and fixed income markets. The flipside is much greater capability to invest in private market assets in real estate, infrastructure and private equity, especially directly or via consortiums.
— The largest sovereigns face a new set of investment challenges. They are so big that the traditionally soured dealflow required to hit and maintain private market exposure targets may be unrealistic, and even very large private market assets will fail to move the needle in terms of portfolio returns. They are also constrained in public markets. Not only is traditional active management largely out of the question, large sovereigns start to own material percentages of individual companies or securities. This creates an unappealing scenario of increased complexity without corresponding benefits.
35
Investment expertise
Use of third parties
Governance & operations
People & talent
7.6
7.6
7.5
6.1
7.4
7.7
7.3
7.2
7.3
7.5
7.8
7.7
7.8
7.7
7.5
7.6
7.6
7.1
7.2
7.0
Fig 20. Invesco sovereign confidence index
Source: Invesco Global Sovereign Asset Management Study 2013–2017. Sample: 2013=27, 2014=37, 2015=35, 2-16=50, 2017=58. Rating on a scale of 1-10 where 10 is the most confident.
• 2017• 2016• 2015
• 2014• 2013
36
The investment impact of growing scale is a field where much work remains to be done and there is ample scope for collaboration between sovereigns and their investment partners. The flipside of challenges of scale facing larger sovereign investors is the need for innovative solutions, and given that many sovereigns do not have current net outflows, the scope to apply innovative solutions to both public markets and illiquid private markets. We have seen growing evidence of this. As Invesco’s Global Factor Investing Study has illustrated, sovereign investors have been active adopters of factor investing, particularly in equities. Factor strategies typically offer more capacity than traditional active strategies while allowing sovereign investors to quantify factor exposures and isolate factor returns from true active manager insights and alpha. In private markets, sovereign investors have increasingly graduated from limited partnership style funds to active programs of direct investment in real estate and alternative investments, particularly private equity. These investments have covered a broad spectrum of risk and return. At the large end this has included whole ownership or substantial interests in the largest commercial and retail real estate assets, underwriting private equity, real estate, and infrastructure programs from global asset managers, and direct equity or debt funding of large unlisted companies. At the smaller end, sovereigns have been active in larger numbers of higher risk investments, particularly in emerging technologies and business models, given their ability to tolerate potential losses within a large diversified portfolio. The innovations which have seen sovereigns take up new strategies and asset classes have created important and valuable new pools of capital. Occasionally this has also created potential for conflict with other pools of capital — in particular, sovereigns are not the only investors seeking to acquire large private market assets.The issues of scale for investment footprints also exist for sovereigns’ socio-political footprint. While this is especially the case for those located in the west, a growing number of sovereigns located in all regions face increasing oversight, scrutiny, and inquiry.
In one sense this is only to be expected. Sovereign asset pools typically reflect wealth which ultimately belongs to taxpayers or citizens, and which has been diverted from consumption to savings. As those amounts grow larger via flows and / or reinvested returns, increased interest in the governance of those assets is likely. What is legitimate and indeed healthy public interest may however on occasion be accompanied by less healthy behaviours in the form of interest groups seeking to secure funding for favoured projects.Such pressures may be accentuated for sovereigns located in countries experiencing sustained subdued growth rates. Such sovereigns and their related public-sector agencies may see lobbying for higher levels of withdrawals to fund additional public spending, investment in strategic industries, or funding of new industries seen to be desirable. Increasing scale brings with it a need for sovereigns to periodically confirm or redefine their role (and equally what it is not), and to effectively communicate it. A clear narrative for governments, other sovereigns and institutional investors, and the public will be a key way in which sovereign investor scale comes to be seen as a desirable benefit in their role as the custodian of public assets. Managing these challenges is important, because the existence of what will soon be a $14 trillion sovereign segment is a capital pool has a powerful, positive and stabilising impact on the economy as a whole. While sovereign investors are already large and important investors they remain relatively low profile, especially in terms of public consciousness. In the next financial crisis however, it may be sovereign investors rather than governments leading the recapitalisation of banks and major corporations in difficulties.
37
2013(33)
2014(42)
2015(32)
2016(47)
2017(48)
38
62
5659
6265
44 41 38 35
Fig 21. Internal management of total assets (%)
Source: Invesco Global Sovereign Asset Management Study 2013–2017. Investment allocation taken at 1 January of given year. Sample sizes shown in brackets. Sample excludes central banks.
• Internal• External
38
Important information
This document is for information purposes only and is not an offering. It is not intended for and should not be distributed to, or relied upon by members of the public. Circulation, disclosure, or dissemination of all or any part of this material to any unauthorised persons is prohibited. All data provided by Invesco as at 30 June 2017, unless otherwise stated. The opinions expressed are current as of the date of this publication, are subject to change without notice and may differ from other Invesco investment professionals.
The document contains general information only and does not take into account individual objectives, taxation position or financial needs. Nor does this constitute a recommendation of the suitability of any investment strategy for a particular investor. This is not an invitation to subscribe for shares in a fund nor is it to be construed as an offer to buy or sell any financial instruments. While great care has been taken to ensure that the information contained herein is accurate, no responsibility can be accepted for any errors, mistakes or omissions or for any action taken in reliance thereon. You may only reproduce, circulate and use this document (or any part of it) with the consent of Invesco.
Important Information
This document is intended only for investors in Hong Kong, for Institutional Investors and/or Accredited Investors in Singapore, for certain specific sovereign wealth funds and/or Qualified Domestic Institutional Investors approved by local regulators only in the People’s Republic of China, for certain specific Qualified Institutions and/or Sophisticated Investors only in Taiwan, for Qualified Professional Investors in Korea, for certain specific institutional investors in Brunei, for Qualified Institutional Investors and/or certain specific institutional investors in Thailand, for certain specific institutional investors in Malaysia, for certain specific institutional investors in Indonesia and for qualified buyers in Philippines for informational purposes only. This document is not an offering of a financial product and should not be distributed to retail clients who are resident in jurisdiction where its distribution is not authorized or is unlawful. Circulation, disclosure, or dissemination of all or any part of this document to any unauthorized person is prohibited.
This document may contain statements that are not purely historical in nature but are "forward-looking statements", which are based on certain assumptions of future events. Forward-looking statements are based on information available on the date hereof, and Invesco does not assume any duty to update any forward-looking statement. Actual events may differ from those assumed. There can be no assurance that forward-looking statements, including any projected returns, will materialize or that actual market conditions and/or performance results will not be materially different or worse than those presented. All material presented is compiled from sources believed to be reliable and current, but accuracy cannot be guaranteed. Investment involves risk. Please review all financial material carefully before investing. The opinions expressed are based on current market conditions and are subject to change without notice. These opinions may differ from those of other Invesco investment professionals.
The distribution and offering of this document in certain jurisdictions may be restricted by law. Persons into whose possession this marketing material may come are required to inform themselves about and to comply with any relevant restrictions. This does not constitute an offer or solicitation by anyone in any jurisdiction in which such an offer is not authorised or to any person to whom it is unlawful to make such an offer or solicitation.
This document is issued in the following countries:
• in Hong Kong by Invesco Hong Kong Limited景順投資管理有限公司, 41/F, Champion Tower, Three Garden Road,Central, Hong Kong. This document has not been reviewed by the Securities and Futures Commission.
• in Singapore by Invesco Asset Management Singapore Ltd, 9 Raffles Place, #18-01 Republic Plaza, Singapore 048619.• in Taiwan by Invesco Taiwan Limited, 22F, No.1, Songzhi Road, Taipei 11047, Taiwan (0800-045-066). Invesco Taiwan