Mutual Fund Investments are subject to market risks, read all scheme related documents carefully. (An open-ended equity scheme following the Business Cycles theme) LAUNCHING INVEST IN A FUND THAT AIMS TO DELIVER IN EVERY SEASON. INVEST IN A FUND THAT AIMS TO DELIVER IN EVERY SEASON. *The Bank of Baroda logo belongs to Bank of Baroda and is used under license. Low to Moderate Moderate Moderately High High Very High Low LOW HIGH Investors understand that their principal will be at Very High Risk The scheme is suitable for investors who are seeking* Long term wealth creation Investment predominantly in equity & equity related securities, including equity derivatives in Indian markets with focus on riding business cycles through dynamic allocation between various sectors & stocks at different stages of business cycles in the economy. RISKOMETER * Investors should consult their financial advisors if in doubt about whether the product is suitable for them. The product labeling assigned during the NFO is based on internal assessment of the Scheme characteristics or model portfolio and the same may vary post NFO when the actual investments are made. NFO OPENS ON: 24 TH AUGUST 2021 | NFO OPENS ON: 6 TH SEPTEMBER 2021 Preferred Partner
Transcript
Mutual Fund Investments are subject to market risks, read all scheme related documents carefully.
(An open-ended equity scheme following the Business Cycles theme)
LAUNCH ING
INVEST IN A FUNDTHAT AIMS TO DELIVER
IN EVERY SEASON.
INVEST IN A FUNDTHAT AIMS TO DELIVER
IN EVERY SEASON.
*The Bank of Baroda logo belongs to Bank of Baroda and is used under license.
Low to
Moderate
Moderate ModeratelyHighHigh
Very HighLow
LOW HIGH
Investors understand that their principal will be at Very High Risk
The scheme is suitable for investors who are seeking*
Long term wealth creationInvestment predominantly in equity & equity related securities, including equity derivatives in Indian markets with focus on riding business cycles through dynamic allocation between various sectors & stocks at di�erent stages of business cycles in the economy.
RISKOMETER
* Investors should consult their financial advisors if in doubt about whether the product is suitable for them.
The product labeling assigned during the NFO is based on internal assessment of the Schemecharacteristics or model portfolio and the same may vary post NFO when the actual investments are made.
NFO OPENS ON: 24TH AUGUST 2021 | NFO OPENS ON: 6TH SEPTEMBER 2021
Preferred Partner
BUSINESS CYCLEINVESTING
BUSINESS CYCLEINVESTING
Secular Trend: Refers to market activities that unfold over long-time horizons, or that aren't influenced by short-term factors.
Business Cycle: Refers to the fluctuation of the economy between periods of expansion and contraction measured by various
indicators like GDP growth, IIP, Interest rates, Inflation and other macroeconomic variables.
Tactical Trend: Refers to market pricing anomalies which are short term in nature
What is Business Cycle
Secular (10-30 Years)
Business Cycle (1-10 Years)
Tac�cal (1-12 Months)
Mul�-�me Horizon basedAsset Alloca�on framework
The business cycle, which encompasses the cyclical fluctuations in an economy over few years, is therefore a critical determinant of equity market returns &
the performance of equity sectors.
The events in the life of a cycle shouldn’t be viewed merely as each being followed by the next, but much more importantly as
each causing the next. – Howard Marks.
Characteristics of Business Cycle Phases
Business Cycle has 4 distinct phases & there are certain indicators which can help indicate the change in the phase of a business cycle
& present opportunities to invest.
EARLY CYCLE
Credit begins to grow
Profits grow rapidly
Growth in Corporate
Earnings
Easy Monetary Policy
•••
•
RECOVERY
MID CYCLE
Neutral Policy
Rise in inflation
Strong Credit growth
Peaked Growth in
profits
••
••
GROWTH
LATE CYCLE
Tightening Credit
Earnings under
Contraction in policy
Inventories grow &
sales growth drops
pressure
Moderate Growth ••••
EXPANSION
••
RECESSION
Activity levels fall
Credit dries up
Profits decline
Policy eases
Inventories & sales
fall
CONTRACTION
•••••
The above list is illustrative & not exhaustive & does not constitute any recommendations . The AMC may change its views depending upon market
scenario within the limits of the Scheme Information Document (SID).
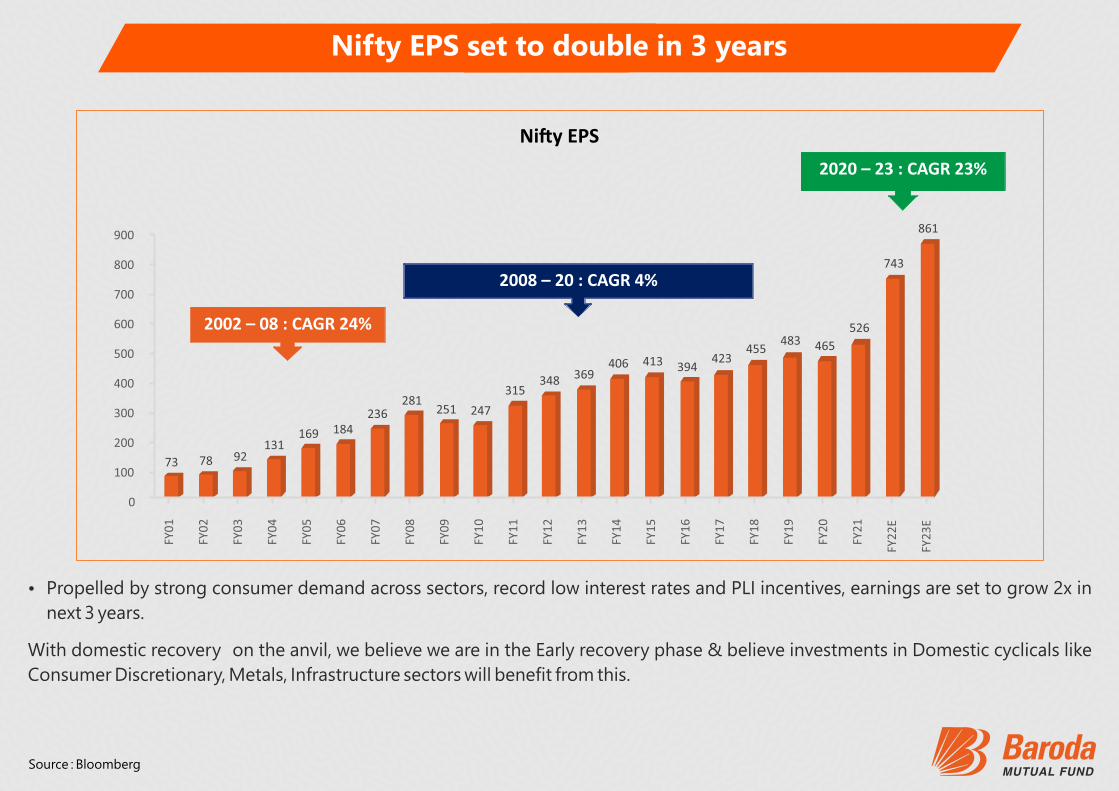
Ÿ Propelled by strong consumer demand across sectors, record low interest rates and PLI incentives, earnings are set to grow 2x in
next 3 years.
With domestic recovery on the anvil, we believe we are in the Early recovery phase & believe investments in Domestic cyclicals like
Consumer Discretionary, Metals, Infrastructure sectors will benefit from this.
Source : Bloomberg
0
100
200
300
400
500
600
700
800
900
FY0
1
FY0
2
FY0
3
FY0
4
FY0
5
FY0
6
FY0
7
FY0
8
FY0
9
FY1
0
FY1
1
FY1
2
FY1
3
FY1
4
FY1
5
FY1
6
FY1
7
FY1
8
FY1
9
FY2
0
FY2
1
FY2
2E
FY2
3E
2020 – 23 : CAGR 23%
73 78 92131
169 184236
281251 247
315348 369
406 413 394423
455483 465
526
743
861
2002 – 08 : CAGR 24%
2008 – 20 : CAGR 4%
Ni�y EPS
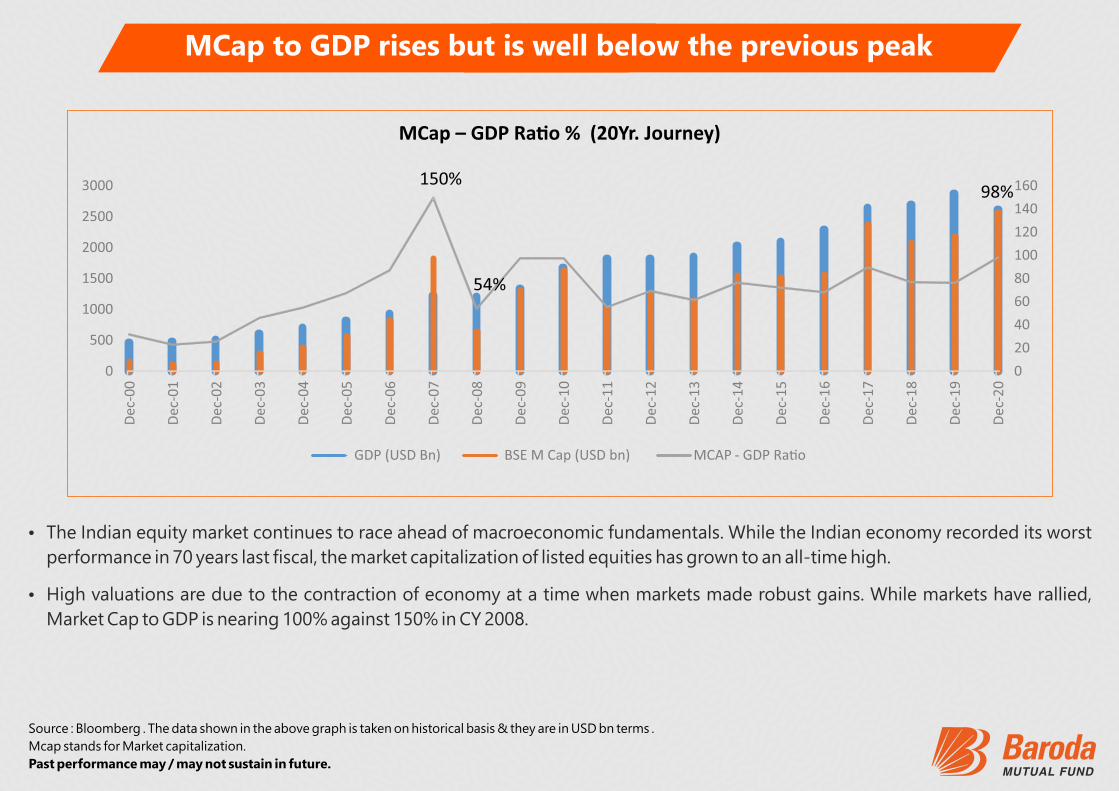
MCap to GDP rises but is well below the previous peak
Ÿ The Indian equity market continues to race ahead of macroeconomic fundamentals. While the Indian economy recorded its worst
performance in 70 years last fiscal, the market capitalization of listed equities has grown to an all-time high.
Ÿ High valuations are due to the contraction of economy at a time when markets made robust gains. While markets have rallied,
Market Cap to GDP is nearing 100% against 150% in CY 2008.
Source : Bloomberg . The data shown in the above graph is taken on historical basis & they are in USD bn terms .
Mcap stands for Market capitalization.
Past performance may / may not sustain in future.
GDP (USD Bn) BSE M Cap (USD bn) MCAP - GDP Ra�o
0
20
40
60
80
100
120
140
160
0
500
1000
1500
2000
2500
3000
Dec
-00
Dec
-01
Dec
-02
Dec
-03
Dec
-04
Dec
-05
Dec
-06
Dec
-07
Dec
-08
Dec
-09
Dec
-10
Dec
-11
Dec
-12
Dec
-13
Dec
-14
Dec
-15
Dec
-16
Dec
-17
Dec
-18
Dec
-19
Dec
-20
150%98%
54%
MCap – GDP Ra�o % (20Yr. Journey)
Business Cycle Investing - Key Differentiators
1) Top-Down Approach
Aims to focus on Macro indicators for sector allocation.
2) Wind Shield Approach
Aims to focus on forward indicators rather than historical data.
3) Flexible Approach
Aims to have exposure to a set of sectors / themes which are beneficiaries from the economic recovery & is not restrictive
in its investment approach.
4) First Mover Advantage
Based on the lead indicators, opportunities are identified well ahead in time & investment decisions are made.
5) Agility
Investments across sectors / themes are not static in nature & are rotated based on business cycle phase.
Mutual Fund Investments are subject to market risks, read all scheme related documents carefully.
(An open-ended equity scheme following the Business Cycles theme)
LAUNCH ING
INVEST IN A FUNDTHAT AIMS TO DELIVER
IN EVERY SEASON.
INVEST IN A FUNDTHAT AIMS TO DELIVER
IN EVERY SEASON.
*The Bank of Baroda logo belongs to Bank of Baroda and is used under license.
Low to
Moderate
Moderate ModeratelyHighHigh
Very HighLow
LOW HIGH
Investors understand that their principal will be at Very High Risk
The scheme is suitable for investors who are seeking*
Long term wealth creationInvestment predominantly in equity & equity related securities, including equity derivatives in Indian markets with focus on riding business cycles through dynamic allocation between various sectors & stocks at di�erent stages of business cycles in the economy.
RISKOMETER
* Investors should consult their financial advisors if in doubt about whether the product is suitable for them.
The product labeling assigned during the NFO is based on internal assessment of the Schemecharacteristics or model portfolio and the same may vary post NFO when the actual investments are made.
NFO OPENS ON: 24TH AUGUST 2021 | NFO OPENS ON: 6TH SEPTEMBER 2021
Preferred Partner
Top-Down Approach in Investing
Baroda Business Cycle Fund - Investment Process
The fund managers reserves the right to modify or change the investment approach according to the market conditions within the investment
objective, asset allocation, investment strategy of the Scheme. Kindly refer SID for complete details.
Monitor Macro
Indicators &
identify Business
Cycle Opportunity
Identify Themes /
Sectors based on
Business Cycle
Opportunity
Identify Stocks
based on finalized
Themes / Sectors
A periodic assessment of the
macro-economic
environment and the
subsequent investment
approach is conducted,
based on which the portfolio
may be reallocated
01 02 03 04
A fund which benefits from the changes
in the Economic Cycle
Investing is based on the Macro-Economic Indicators
rather than Themes or Sectors
Agility to move across Sectors, with no
Sectoral caps on Allocation
Top-Down Approach with Bottom-up
stock selection
Baroda Business Cycle Fund - Key Features
The investments of the fund will be within the limits of the SID. Kindly refer SID for complete details
Baroda Business Cycle Fund - Fund Suitability
Investors aiming to benefit from strategic fund
positioning based on business cycle phase
Investors aiming to benefit from economic
recovery over next few years
Investors aiming to add style diversification
to their portfolio
Investors aiming for wealth creation through a
fund which endeavors to provide higher alpha
& better risk adjusted returns over long term
Higher sectoral weights &
well diversification within
Sector selection based
on the economic phase
Industry Analysis +
Security research
Baroda Business Cycle Fund - Key Focus
ConsumerDiscretionary
InformationTechnology
Infrastructure Metals Pharma
The sectors mentioned in the slide does not constitute any recommendation & Baroda Mutual fund may /may not have
a future position in these sectors.
Past performance may / may not sustain in future.
Baroda Business Cycle Fund - Sectoral Outlook
The sectors mentioned in the slide does not constitute any recommendation & Baroda Mutual fund may /may not have a future
position in these sectors.
Past performance may / may not sustain in future.
*API - Active Pharmaceutical Ingredient.
Ø The steel prices globally have risen to record highs in CY21, and the base metals have also rallied sharply from the lows seen in April
2020.
Ø We believe that with significant balance sheet deleveraging and strong improvement in return ratios, these companies are in a
much better position.
Ø With better global growth outlook & increased IT & Healthcare spending we believe that these sectors could also do well.
Ø This strong upcycle could help the Indian metal companies to deleverage their balance sheets significantly and be in a much better
position to spend on new capacity additions.
Ø Identification of favourable sectors based on business cycle
Ø Security selection is conducted on the principle of GARP (growth at a reasonable price) in those sectors.
Ø Stocks having good operating leverage, decent balance sheet and good management track record may be chosen as they tend to
do better relatively in the initial part of the recovery cycle.
SECTORAL OUTLOOK
SECURITY SELECTION
Sector
Cement
Consumer Discretionary
Information Technology
Infrastructure
Metals
Pharmaceuticals & Healthcare
Outlook
Ÿ Increased pricing power to the companies may lead to better profitability.
Ÿ Government’s thrust on infrastructure and improved demand from the housing segment could lead to
incremental demand which may be higher than the incremental capacity additions.
Ÿ Capacity utilization is set to increase.
Ÿ Shift from unorganised to organised would result in better growth for the durables companies.
Ÿ Recovery trade, post pandemic, in sectors like retail, alcoholic beverages, entertainment, travel etc, are
likely to see sustained demand.
Ÿ Corporates are shifting workload to clouds which is driving strong demand for IT services companies.
Ÿ Global corporates are undertaking business transformation initiatives leading to multi year high
Technology spends.
Ÿ Faster execution of the order books would result in lower stress on balance sheets which had been a
cause of concern historically
Ÿ Governments focus on infrastructure creation, faster approval and clearances of projects would lead to
order book growth for the companies.
Ÿ Global steel capacity utilisation is highest in last 20 years driven by higher Chinese steel demand
Ÿ Stronger for longer steel cycle would help the steel companies deleverage faster and creating significant
value for equity holders.
Ÿ Indian Pharma and Healthcare companies are showing signs of improvement due to increased focus on
healthcare post pandemic and are catalysing the demand.
Ÿ China Plus One strategy also offers scope for many Chemicals and API* manufactures in India.
Ÿ Many companies have resolved regulatory compliance issues and improvement in exports is expected.
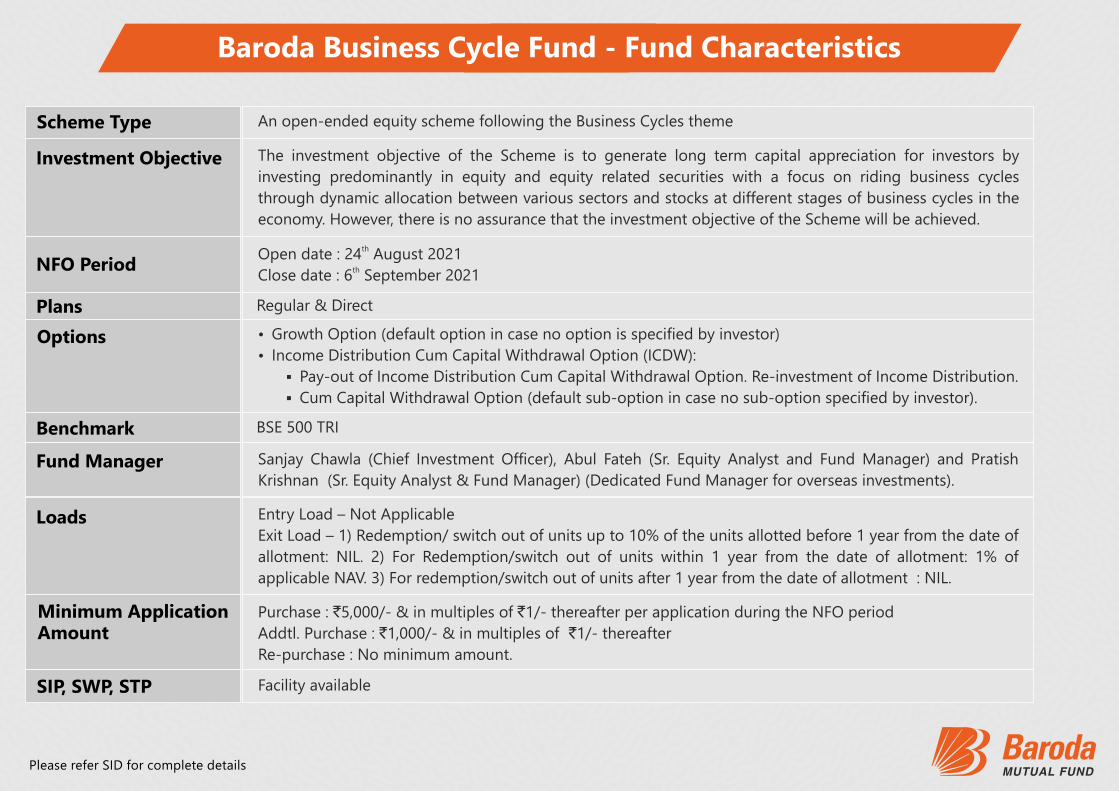
Baroda Business Cycle Fund - Fund Characteristics
An open-ended equity scheme following the Business Cycles theme
The investment objective of the Scheme is to generate long term capital appreciation for investors by
investing predominantly in equity and equity related securities with a focus on riding business cycles
through dynamic allocation between various sectors and stocks at different stages of business cycles in the
economy. However, there is no assurance that the investment objective of the Scheme will be achieved.
Regular & Direct
Ÿ Growth Option (default option in case no option is specified by investor)
§ Pay-out of Income Distribution Cum Capital Withdrawal Option. Re-investment of Income Distribution.
Ÿ Income Distribution Cum Capital Withdrawal Option (ICDW):
§ Cum Capital Withdrawal Option (default sub-option in case no sub-option specified by investor).
BSE 500 TRI
Purchase : `5,000/- & in multiples of `1/- thereafter per application during the NFO period
Addtl. Purchase : `1,000/- & in multiples of `1/- thereafter
Re-purchase : No minimum amount.
Facility available
Sanjay Chawla (Chief Investment Officer), Abul Fateh (Sr. Equity Analyst and Fund Manager) and Pratish
Krishnan (Sr. Equity Analyst & Fund Manager) (Dedicated Fund Manager for overseas investments).
Entry Load – Not Applicable
Exit Load – 1) Redemption/ switch out of units up to 10% of the units allotted before 1 year from the date of
allotment: NIL. 2) For Redemption/switch out of units within 1 year from the date of allotment: 1% of
applicable NAV. 3) For redemption/switch out of units after 1 year from the date of allotment : NIL.
thOpen date : 24 August 2021thClose date : 6 September 2021
Scheme Type
Investment Objective
NFO Period
Plans
Options
Benchmark
Fund Manager
Loads
Minimum ApplicationAmount
SIP, SWP, STP
Please refer SID for complete details
Investment Capabilities
§ Fixed Income: 3- member team.
Ÿ Investment expertise across comprehensive range of asset
classes & investment styles with a broad, deep and stable
research platform.
§ Equity: 4- member team.
Ÿ Defined & Robust Risk Management Processes.
Ÿ Experienced investments team constituting of 7 members with a
combined experience of over 120 years of investing experience:
Sanjay Chawla - Chief Investment Officer
Ÿ Previous experience - Birla Sun Life AMC as Sr. Fund Manager-Equity, SBI Capital Markets as Head of
Research, Motilal Oswal Securities, IDBI Capital Markets, SMIFS Securities, IIT Invest Trust & Lloyds Securities in
the equity research.
Ÿ Masters in Management Studies - BITS, Pilani.
Ÿ Over 30 years of experience in fund management, equity research & Management Consultancy.
Abul Fateh - Fund Manager & Sr. Equity Analyst
Ÿ Masters Degree (Mathematics), Post Graduate Diploma in Securities Markets.
In the preparation of the material contained in this document, Baroda Asset Management India Ltd. (“AMC”) has used information that is publicly available, including information developed in-house. The AMC, however, does not warrant the accuracy, reasonableness and/or completeness of any information. This document may contain statements/opinions/ recommendations, which contain words, or phrases such as “expect”, “believe” and similar expressions or variations of such expressions that are “forward looking statements”. Actual results may differ materially from those suggested by the forward looking statements due to risk or uncertainties associated with our expectations with respect to, but not limited to, exposure to market risks, general economic and political conditions in India and other countries globally, which have an impact on our investments, the monetary and interest policies of India, inflation, deflation, unanticipated turbulence in interest rates, foreign exchange rates, equity prices or other rates or prices, etc. The AMC (including its affliates), Baroda Mutual Fund (“Mutual Fund”), its sponsor / trustee and any of its officers, directors, personnel and employees, shall not be liable for any loss, damage of any nature, including but not limited to direct, indirect, punitive, special, exemplary, consequential, as also any loss of profit in any way arising from the use of this document in any manner. The recipient alone shall be fully responsible / liable for any decision taken based on this document. All figures and other data given in this document are dated and may or may not be relevant at a future date. Prospective investors are therefore advised to consult their own legal, tax and financial advisors, mutual fund distributors to determine possible tax, legal and other financial implication or consequence of subscribing to the units of the schemes of Baroda Mutual Fund. Past performance may or may not be sustained in the future. Please refer to the Scheme Information Document of the schemes before investing for details of the scheme including investment objective, asset allocation pattern, investment strategy, risk factors and taxation.
Mutual Fund investments are subject to market risks, read all scheme related documents carefully.
Disclaimer
*The Bank of Baroda logo belongs toBank of Baroda and is used under license.