22


Kotak Securities – Private Client Research Please see the Disclosure/Disclaimer on the last page For Private Circulation 2
Invest Mantra September 2017
TABLE OF CONTENTS
Market Strategy – Equity Market Outlook
Theme 1 : Beaten Down Large Cap Stocks
Gail India Ltd
ITC Ltd
Mahindra & Mahindra
Tata Motors
Theme 2 : Old Private Sector Banks
Karnataka Bank
South Indian Bank
Theme 3 : PSU Strategic Stake Sale
Balmer Lawrie & Company
Shipping Corporation of India Ltd
Theme 4 : Deep Value Stock
Bombay Burmah Trading Corporation
1M Portfolio : September 2017

Kotak Securities – Private Client Research Please see the Disclosure/Disclaimer on the last page For Private Circulation 3
Invest Mantra September 2017
EQUITY MARKET OUTLOOK
Long-term Optimism remains intact, but invest cautiously in the Short-term
Long-term outlook of the Indian equity markets remain robust
India has got solid political stability after two-and-half decades. We have already seen bold
economic reforms / initiatives like GST, demonetization, FDI in insurance, shutting down of loss-making government-owned companies, etc. Such measures provide us the optimism that many
more economic initiatives could be in the offing. Normal monsoon is expected for the second year
in a row – the same is likely to provide a fillip to aggregate demand from the rural economy. Total food grains production for 2017 is projected to hit a record level of 276 million tonnes.
In the current year, the government has given major boost to Public Expenditure -during the period
April-July 2017, the total government expenditure has increased by a robust 28.3% yoy to Rs.8.1 trillion, with revenue expenditure rising by 21.8% yoy and capital expenditure by 33.4% yoy. On
monetary front, the benchmark interest rates had been slashed cumulatively by 200 bps in the last
3 years.
On external economic front also, a comfortable situation is emerging – the country's foreign
exchange reserves touched a new life-time high of over $393 billion. Foreign Direct Investment
inflows remain robust – it increased by 23% year-on-year (yoy) during April-May 2017. External debt management and Current Account Deficit of the Balance of Payments are also well under
control. Global oil price is expected to remain subdued around $50 a barrel at least for another 2
years. Over 90% jump in the deployment of oil rigs by the US drillers, forecast of reduced oil demand from the OPEC by the emerging economies and failure of OPEC and Non-OPEC members
to fully adhere to the compliance on oil output cut (actual cut is in the range of 67% o 75%) are
likely to enable India to enjoy cheap oil for two more years at least.
Global economic conditions turn favourable
Global deflationary trends have moderated substantially as compared to early 2016. Prices of oil,
metals, resources and agri crops have gone up substantially over the year. Global growth is improving.
The US economic expansion is expected to last at least another two years, according to a poll of
economists which suggests 2.1% to 2.5% growth each quarter to the end of next year. The US economy continues to remain near-full employment. Euro zone’s annual GDP upgraded to 2.2%
growth in the second quarter of 2017.Although China’s debt levels remain at alarming level, its
economy is unlikely to see hard landing in the near future. The IMF has raised its forecast for China's average annual growth to 6.4% from 6.0% for the period 2018-2020.
Both the US FED and the European Central Bank are talking about the reversal of monetary stimulus
- consequence of such withdrawal is an outcome of growth recovery in these economies. Hence, it is actually not a major concern for the emerging markets in the long-term.
However, there are some concerns on the Indian equities in the short-term
As economic Survey has also pointed out, a number of indicators like GDP, IIP, credit offtake, investment, capacity utilization, etc., point to a deceleration in real activity since first quarter of
FY2017. Farm loan waivers expected to cut economic demand up to 0.7% of GDP.
Industrial economy is yet to pick up – the Gross Value Added (GVA) growth in manufacturing came in at mere 1.2% in Q1FY2018 as compared to 10.7% in Q1FY2017. Chief Statistician has
reported in the media that 74% of manufacturing GVA was accounted for by the corporate
sector, which has posted very poor performance in Q1FY2018;
Though yoy growth has picked up to 9%, monthly export bill still remains almost stagnant at
around $23 billion – even much before oil price spike in 2014, India’s monthly export bill stood
at around $25 billion a month;

Kotak Securities – Private Client Research Please see the Disclosure/Disclaimer on the last page For Private Circulation 4
Invest Mantra September 2017
Banking industry credit growth hovers around 6%, at decades low level and, bad assets remain
at record levels (9.6% for the banking system) and they are expected to taper off by March 2018;
A sample of over 1,000 companies’ results (excluding banks & finance companies) indicate 9.7%
yoy growth in net sales, but 1.7% yoy decline in net profits in Q1FY2018. Only hopes on forward corporate earning remain alive: Since 2013 the Sensex earnings moved up mere 3%
cumulatively (from Rs.1,322 in 2013 to Rs.1,360 now);
Apart from fundamental aspect, tactically also there is some short-term risk to the markets – the foreign investors have been largely investing in the debt instruments rather than in the equities. FIIs
prefer debt than equities at this juncture – year to date in CY2017, FIIs have invested Rs.1.2 trillion
in the debt instruments as against Rs.496 billion in Indian equities. They may tilt towards domestic equities only in the event of some further correction in the equity prices or after seeing some visibility
in actual improvements of corporate earnings.
Tactically, the domestic equity market faces short-term risk also from the growing gap between the value of overall equity markets and available investible surplus at this juncture. The market cap of
entire BSE-listed stocks stands at around Rs.132 trillion. Small & mid cap stocks (less than $2 billion
market cap) rallied and total valuation stand at over Rs.25 trillion now– a historical peak. Due to global or domestic macro factors, any selling lead to the extent of even just 1% of entire market
cap that would mean a supply pressure of around $20 billion. However, despite robust inflows into
the mutual funds’ equity assets, the existing appetite is very low for any such possible shocks. Household financial savings flowing into equities is less than Rs.2 trillion per annum – most of them
already invested (a natural phenomenon in a bull market).
Moreover, a large number of IPOs have been lined up, apart from QIPs from the listed companies. Twelve government banks have also lined up for tapping the markets for re-building their capital
base. Further the government has lined up listing of several wholly-owned companies, further
divestments and also stake sale in already listed companies – more than Rs.500 billion worth of government’s equities are targeted to be supplied in the markets in the next 7 months itself. The
overall new issuance of equities (including IPOs, QIPs, banks' proposals and PSUs divestments &
stake sales) is estimated to be around Rs.2.5 trillion in the new future - such huge figure can make a dent on either primary or secondary markets or on both in scaling down the valuations.
Apart from the macroeconomic and liquidity issues, the international political issues are also not
conducive at this juncture. Although holding of nuclear weapons by all countries involved in the current disputes act as a war deterrent, any further war of words or intensified troubles on the
border could lead to some corrections in the markets in the short term.
Strategy Way Forward for Indian equities?
Although short-term fear exists, the medium to long-term outlook (beyond March 2018) remains
optimistic. In this background, it would be wise to play on large cap stocks to the extent of at least
50% of equity portfolios and also on select fundamentally sound equity themes, which offer a lot of comfort on valuation front.

Kotak Securities – Private Client Research Please see the Disclosure/Disclaimer on the last page For Private Circulation 5
Invest Mantra September 2017
THEME 1 - BEATEN DOWN LARGE CAP STOCKS
In the past, we had seen Maruti falling as low as Rs.1500 in early 2014 and then the stock multiplying; in August 2015, the share price of Hindustan Zinc fell as low as Rs.117, the same stock
in the next 18 months (February 2017) rose nearly three times to Rs.333. Large cap stocks go
through stress sometimes, but they rarely fail permanently, provided the quality of the management, balance sheet and the business model are unquestionable.
Of course, no longer large cap stocks assure protection of capital – even large cap stocks from the
so-called “defensive sectors” have destroyed wealth. For instance, Lupin and Sun Pharmaceutical Industries have eroded their market caps by 54% and 61% respectively since March / April 2015.
During the same period, the Sensex has moved up by about 8%. Even large IT stocks could fall as
high as 14% in a single day. However, unique advantage of banking on large cap segment is that they provide easy opportunity to exit which is not the case with the most small and mid cap stocks.
We believe that in the current political, economic and market conditions, it would be an apt
approach for the conservative investors to invest around 50% of the equity portfolio in the large cap stocks. To mitigate further possible risks even in the large cap segment, we have picked up
some of the stocks which were already beaten down in the markets. These are GAIL India, ITC,
Mahindra & Mahindra and Tata Motors.

Kotak Securities – Private Client Research Please see the Disclosure/Disclaimer on the last page For Private Circulation 6
Invest Mantra September 2017
Current Market Price (Rs) 52 Week H/L (Rs) Mkt Cap (Rs mn)
384 434 / 268 649545
Source: Bloomberg
Source: KIE
Financials (Rs mn) FY17 FY18E FY19E
Sales 481,489 562,169 642,050
Growth (%) 16.8% 14.2%
EBITDA 65,584 72,573 78,623
EBITDA margin (%) 13.6 12.9 12.2
PBT 56,886 65,134 72,519
Net profit 37,806 43,729 48,556
EPS (Rs) 22.4 25.9 28.7
Growth (%) NA 15.6% 10.8%
Dividend Yield (%) 2.4% 2.4% 2.6%
Dividend per share (Rs) 9.1 9.1 9.9
ROE (%) 9.0 10.1 10.2
ROCE (%) 9.0 9.4 9.8 Source: KIE
Net cash (debt) (37,481) (25,585) (25,013)
Valuation Parameters FY17 FY18E FY19E
P/E (x) 17.1 14.8 13.4
EV/Sales (x) 1.4 1.2 1.1
EV/EBITDA (x) 10.5 9.3 8.6
Price Performance (%) 1M 3M 6M
2.7 (6.4) 1.1
Source: Bloomberg, Company, Kotak Securities - Private Client Research Source: KIE
LPG sales volumes ('000 tons)
Potential Upside (%)
14.6%
1 Year Performance
Gas transmission volumes (mcm/d)
Petrochemical sales volumes ('000 tons)
Last report at Rs.424 on 23 February 2017
GAIL India Analyst: [email protected]
Target Price (Rs)
440
FY15 FY16 FY17 FY18E FY19E
0.0
30.0
60.0
90.0
120.0
0
100
200
300
400
500
600
700
800
900
FY15 FY16 FY17 FY18E FY19E
950
1,000
1,050
1,100
1,150
1,200
1,250
1,300
FY15 FY16 FY17 FY18E FY19E
60
90
120
150
180 GAIL India Ltd Nifty
Investment Argument
GAIL management indicated that the economics of petchem expansion has improved with ramp-up in utilization to ~70% currently, led by (1) rising efficiency in conversion of gas to C2- C3 and subsequently to ethylene and (2) a reduction in operating costs and unit overheads.
The company has also initiated exports to a few countries preparing itself for the imminent increase in domestic supplies from other new plants (BCPL, OPAL and RIL’s ROGC).GST implementation will result in increased vehicle sales and freight movement, we opine, resulting in higher sales.
The company was optimistic on gas transmission segment, indicating (1) pickup in gas volumes to 106-108 mcm/d during March and (2) possibility of overhaul in tariff mechanism for pipelines. The government is considering implementation of postal tariffs, which will result in uniform tariff for all consumers in each integrated pipeline network (instead of current zonal tariffs), subject to regulatory cap of 12% on project IRR. The new mechanism will be adopted for the Urja Ganga pipeline project (East India gas grid) and may get implemented for existing pipelines as well, which may result in better realizations for some networks such as HVJ. GAIL also provided an update on East India gas grid, detailed later in the note.
We remain constructive on the stock, given (1) our expectations of robust volume-led earnings growth in the medium term driven by dominant presence across the gas value chain and (2) inexpensive valuation core gas business profitability, which gets overlooked due to significant value locked in investments.
Risks & Concerns
Lower industrial activity can impact volume growth
Company Background
GAIL (India) Ltd is India’s largest gas transmission and marketing company
Kotak Securities – Private Client Research Please see the Disclosure/Disclaimer on the last page For Private Circulation 7
Invest Mantra September 2017
Current Market Price (Rs) 52 Week H/L (Rs) Mkt Cap (Rs mn)
284 368 / 222 3291745
Source: Bloomberg
Source: Capitaline
Financials (Rs mn) FY17 FY18E FY19E
Sales 554,485 586,315 641,457
Growth (%) 7.5 5.7 9.4
EBITDA 145,780 161,193 179,123
EBITDA margin (%) 26.3 27.5 27.9
PBT 155,030 173,602 196,605
Net profit 102,009 113,709 128,776
EPS (Rs) 8.4 9.4 10.6
Growth (%) 10.3 11.5 13.3
CEPS (Rs) 9.3 10.3 11.5
Book value (Rs/share) 26.2 30.5 35.8
Dividend per share (Rs) 4.8 4.8 5.0 Source: Kotak Securities - Private Client Research
ROE (%) 31.5 33.0 36.2
ROCE (%) 25.7 28.0 28.6
Net cash (debt) 95,158 134,808 186,318
Net Working Capital (Days) 193 204 210
Valuation Parameters FY17 FY18E FY19E
P/E (x) 33.8 30.3 26.8
P/BV (x) 10.8 9.3 7.9
EV/Sales (x) 5.8 5.4 4.8
EV/EBITDA (x) 21.9 19.6 17.3
Price Performance (%) 1M 3M 6M
(1.5) (9.7) 5.6
Source: Bloomberg, Company, Kotak Securities - Private Client Research Source: Company
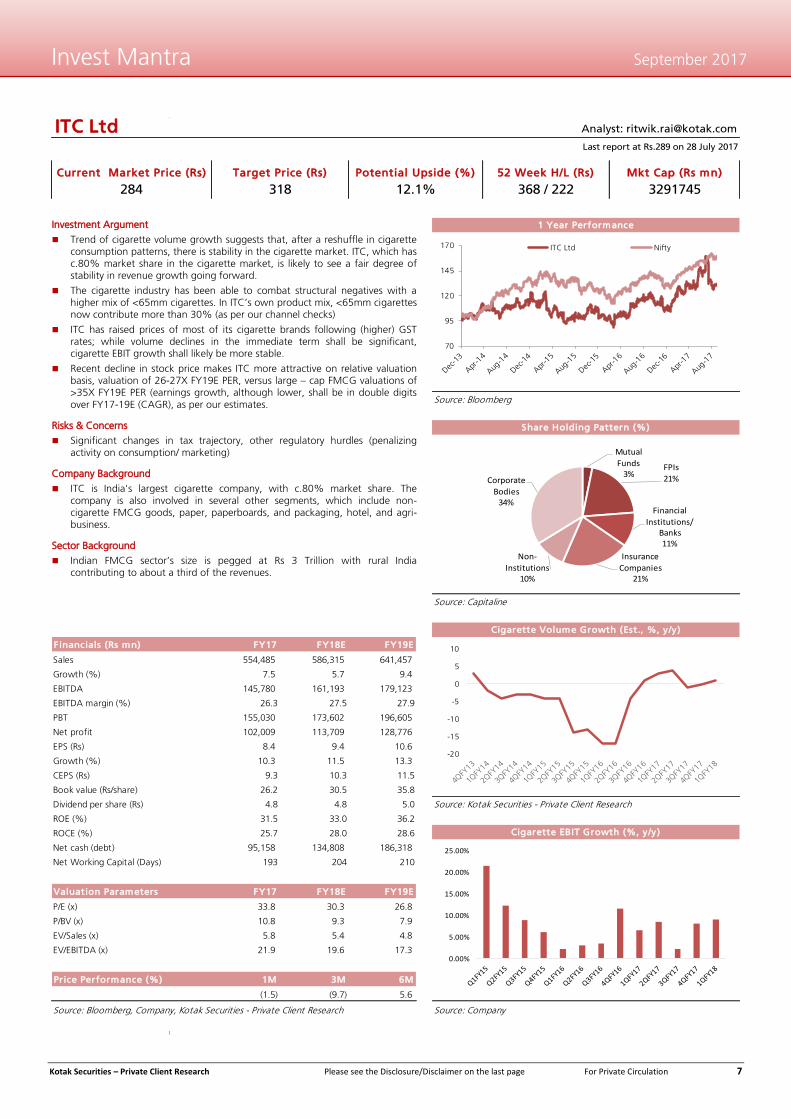
Cigarette EBIT Growth (%, y/y)
Potential Upside (%)
12.1%
1 Year Performance
Share Holding Pattern (%)
Cigarette Volume Growth (Est., %, y/y)
Last report at Rs.289 on 28 July 2017
ITC Ltd Analyst: [email protected]
Target Price (Rs)
318
70
95
120
145
170 ITC Ltd Nifty
Investment Argument
Trend of cigarette volume growth suggests that, after a reshuffle in cigarette consumption patterns, there is stability in the cigarette market. ITC, which has c.80% market share in the cigarette market, is likely to see a fair degree of stability in revenue growth going forward.
The cigarette industry has been able to combat structural negatives with a higher mix of <65mm cigarettes. In ITC’s own product mix, <65mm cigarettes now contribute more than 30% (as per our channel checks)
ITC has raised prices of most of its cigarette brands following (higher) GST rates; while volume declines in the immediate term shall be significant, cigarette EBIT growth shall likely be more stable.
Recent decline in stock price makes ITC more attractive on relative valuation basis, valuation of 26-27X FY19E PER, versus large – cap FMCG valuations of >35X FY19E PER (earnings growth, although lower, shall be in double digits over FY17-19E (CAGR), as per our estimates.
Risks & Concerns
Significant changes in tax trajectory, other regulatory hurdles (penalizing activity on consumption/ marketing)
Company Background
ITC is India's largest cigarette company, with c.80% market share. The company is also involved in several other segments, which include non-cigarette FMCG goods, paper, paperboards, and packaging, hotel, and agri-business.
Sector Background
Indian FMCG sector’s size is pegged at Rs 3 Trillion with rural India contributing to about a third of the revenues.
-20
-15
-10
-5
0
5
10
0.00%
5.00%
10.00%
15.00%
20.00%
25.00%
Mutual
Funds3%
FPIs
21%
Financial
Institutions/ Banks11%
Insurance
Companies21%
Non-
Institutions10%
Corporate
Bodies34%
Kotak Securities – Private Client Research Please see the Disclosure/Disclaimer on the last page For Private Circulation 8
Invest Mantra September 2017
Mahindra & Mahindra Ltd
Current Market Price (Rs) 52 Week H/L (Rs) Mkt Cap (Rs mn)
1348 1501 / 1141 836984
Source: Bloomberg
Source: Capitaline
Financials (Rs mn) FY17 FY18E FY19E
Sales 437,854 487,998 545,104
Growth (%) 7.1 11.5 11.7
EBITDA 47,693 56,187 61,563
EBITDA margin (%) 10.9 11.5 11.3
PBT 51,875 55,055 60,597
Net profit 39,557 39,915 43,933
EPS (Rs) 64.4 65.0 71.6
Growth (%) 24.9 0.9 10.1
CEPS (Rs) 86.0 88.5 98.3
Book value (Rs/share) 418.1 468.5 525.5
Dividend per share (Rs) 13.0 13.0 13.0 Source: Company
ROE (%) 15.2 14.7 14.4
ROCE (%) 19.9 18.9 18.9
Net cash (debt) 25,563 28,725 42,131
Net Working Capital (Days) (9.4) (10.2) (10.7)
Valuation Parameters FY17 FY18E FY19E
P/E (x) 20.9 20.7 18.8
P/BV (x) 3.2 2.9 2.6
EV/Sales (x) 1.9 1.7 1.5
EV/EBITDA (x) 17.0 14.4 12.9
Price Performance (%) 1M 3M 6M
(5.7) (5.4) (0.1)
Source: Bloomberg, Company, Kotak Securities - Private Client Research Source: Company
Last report at Rs.1418 on 7 August 2017
Analyst: [email protected]
Target Price (Rs)
1604
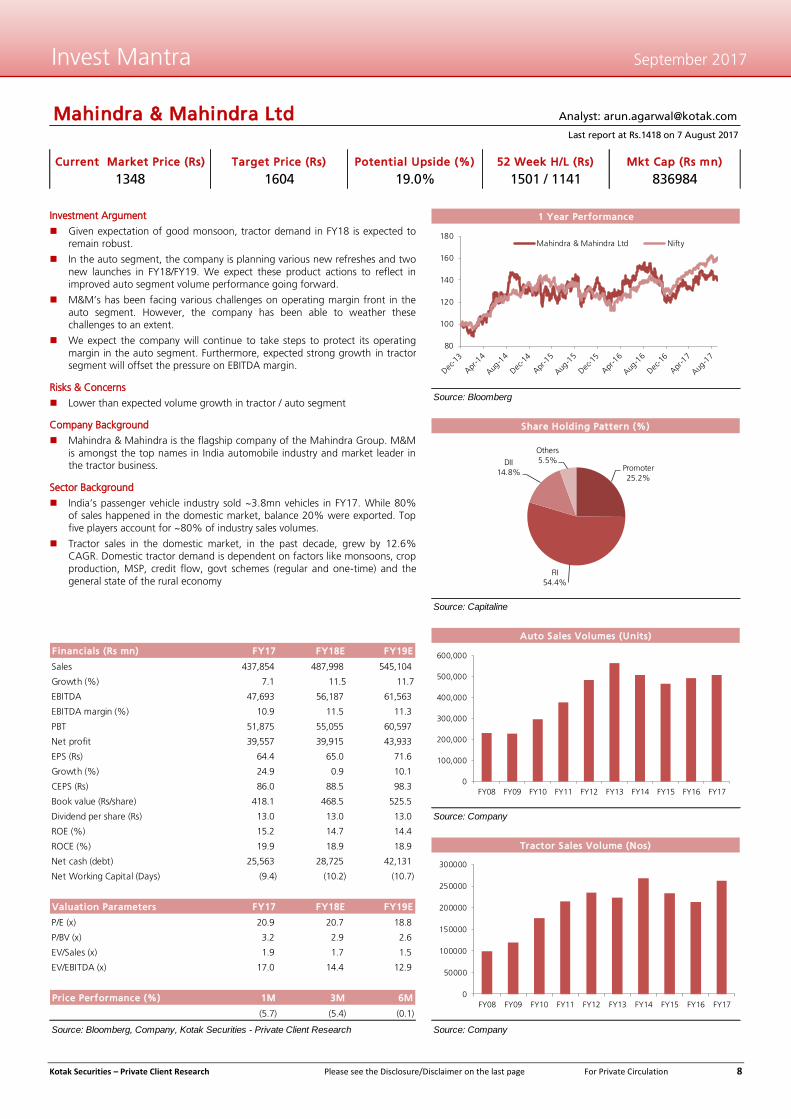
Tractor Sales Volume (Nos)
Potential Upside (%)
19.0%
1 Year Performance
Share Holding Pattern (%)
Auto Sales Volumes (Units)
Promoter
25.2%
FII
54.4%
DII
14.8%
Others
5.5%
0
100,000
200,000
300,000
400,000
500,000
600,000
FY08 FY09 FY10 FY11 FY12 FY13 FY14 FY15 FY16 FY17
0
50000
100000
150000
200000
250000
300000
FY08 FY09 FY10 FY11 FY12 FY13 FY14 FY15 FY16 FY17
80
100
120
140
160
180Mahindra & Mahindra Ltd Nifty
Investment Argument
Given expectation of good monsoon, tractor demand in FY18 is expected to remain robust.
In the auto segment, the company is planning various new refreshes and two
new launches in FY18/FY19. We expect these product actions to reflect in improved auto segment volume performance going forward.
M&M’s has been facing various challenges on operating margin front in the
auto segment. However, the company has been able to weather these challenges to an extent.
We expect the company will continue to take steps to protect its operating
margin in the auto segment. Furthermore, expected strong growth in tractor segment will offset the pressure on EBITDA margin.
Risks & Concerns
Lower than expected volume growth in tractor / auto segment
Company Background
Mahindra & Mahindra is the flagship company of the Mahindra Group. M&M
is amongst the top names in India automobile industry and market leader in the tractor business.
Sector Background
India’s passenger vehicle industry sold ~3.8mn vehicles in FY17. While 80% of sales happened in the domestic market, balance 20% were exported. Top
five players account for ~80% of industry sales volumes.
Tractor sales in the domestic market, in the past decade, grew by 12.6% CAGR. Domestic tractor demand is dependent on factors like monsoons, crop
production, MSP, credit flow, govt schemes (regular and one-time) and the
general state of the rural economy

Kotak Securities – Private Client Research Please see the Disclosure/Disclaimer on the last page For Private Circulation 9
Invest Mantra September 2017
Current Market Price (Rs) 52 Week H/L (Rs) Mkt Cap (Rs mn)
391 599 / 358 1240558
Source: Bloomberg
Source: Capitaline
Financials (Rs mn) FY17 FY18E FY19E
Sales 2,696,925 2,991,612 3,459,935
Growth (%) (2.1) 10.9 15.7
EBITDA 334,988 329,895 465,501
EBITDA margin (%) 12.4 11.0 13.5
PBT 93,148 145,527 206,501
Net profit 74,544 127,723 172,414
EPS (Rs) 22.0 37.6 50.8
Growth (%) (32.4) 71.3 35.0
CEPS (Rs) 74.7 93.1 116.0
BV (Rs/share) 171.0 208.6 259.4
DPS(Rs) - - - Source: Company
ROE (%) 10.7 19.8 21.7
ROCE (%) 11.4 18.2 21.2
Net cash (debt) (233,701) (256,768) (240,736)
NWC (Days) (26.1) (29.4) (30.2)
Valuation Parameters FY17 FY18E FY19E
P/E (x) 17.8 10.4 7.7
P/BV (x) 2.3 1.9 1.5
EV/Sales (x) 0.5 0.5 0.4
EV/EBITDA (x) 4.4 4.5 3.2
Price Performance (%) 1M 3M 6M
(12.5) (18.0) (13.0)
Source: Bloomberg, Company, Kotak Securities - Private Client Research Source: Company
JLR Sales Volumes (Units)
Potential Upside (%)
31.5%
1 Year Performance
Share Holding Pattern (%)
Domestic sales Volumes (Units)
Last report at Rs.416 on 10 August 2017
Tata Motors Ltd Analyst: [email protected]
Target Price (Rs)
514
Promoter
34.7%
FII
23.5%
DII
16.1%
Others
25.7%
0
200,000
400,000
600,000
800,000
1,000,000
FY09 FY10 FY11 FY12 FY13 FY14 FY15 FY16 FY17
0
100000
200000
300000
400000
500000
600000
700000
FY09 FY10 FY11 FY12 FY13 FY14 FY15 FY16 FY17
60
85
110
135
160
185 Tata Motors Ltd Nifty
Investment Argument
Over the next two years, we expect continued healthy volume traction in the passenger car business - driven by new products. In the commercial vehicle
segment, we expect demand in MHCV segment to remain subdued in
1HFY18. Over the medium to long term, we anticipate gradual improvement in demand.
JLR's volume growth outlook remains positive. In FY18, JLR will be ramping-
up the Discovery and Rover Velar and will launch XF Sportbrake. I-Pace and another new product is expected to be launched in CY18/FY19.
Forex loss on hedges is expected to remain at elevated levels over the next
two quarters. GBP depreciation is positive for JLR over long term. JLR's EBITDA margin in FY19 will receive support from positive operating leverage,
improvement in product mix and British Pound depreciation.
Risks & Concerns
Lower than expected volume growth at JLR
Unfavorable currency movement
Company Background
Tata Motors Limited (TAMO), part of Tata Group, is India's largest automobile
company. Established in 1945, TAMO has presence in the commercial vehicle
and passenger vehicle segments. In the domestic market, the company is the market leader in both the LCV and M&HCV segment.
Sector Background
Commercial vehicle industry fortunes depend on the overall economic development in the economy. In the passenger car segment, the growth
opportunities are high, given lower car penetration levels in India.

Kotak Securities – Private Client Research Please see the Disclosure/Disclaimer on the last page For Private Circulation 10
Invest Mantra September 2017
THEME 2 – OLD PRIVATE SECTOR BANKS
There are around 7 listed Old Private Sector Banks (OPSBs) in the country. This OPSB space has seen
a significant momentum of M&A activities since mid 1990s starting with the acquisition of Bank of
Madura by ICICI Bank. Other OPSBs, which were acquired by large New Private Sector Banks (NPSBs)
over the last ten years were: Lord Krishna Bank, Bank of Rajasthan and Vysya Bank. Two more mid-
sized new private banks viz., Centurion Bank and Bank of Punjab were also acquired by the NPSBs
in this period.
Now we believe that the time could be possibly once again ripe for further consolidation in the
OPSB segment considering the structural changes happening in the banking industry and, nature
and valuation of Old Private Sector Banks.
Structural changes in the Banking Industry
Most of the NPSBs have grown their advances substantially higher than the average industry
credit growth by huge margins over the last 2 decades. However, the industry credit growth itself has crashed to near two-decade low of around 6%. Going forward, this crash in credit
growth might make it quite difficult for some of the NPSBs to maintain the kind of credit growth
they maintained in the past in the absolute terms;
Both the lending and saving rates in the system have also fallen significantly after the 200 bps
cut in the benchmark interest rates over the last three years. As the base of lending rate itself
has fallen substantially in recent times, in our view, it is going to be a tough task for some of the NPSBs in the future to maintain very high interest margins, which they enjoy now;
Despite these structural changes in the industry, some of the large private banks enjoy record
high level of valuation over 4 times Price to Adjusted Book Values on the secondary markets. To continue to enjoy such huge valuation premium on the markets despite adverse structural
changes, a few of NPSBs may possibly consider inorganic route to grow.
Nature and Valuation of OPSBs
Most of the OPSBs, which used to have a business size of less than Rs.500 billion about 5 years
ago have grown their business to a meaningful size of over or near Rs.1 trillion now. In our view,
this becomes an attractive proposition for the NPSBs as combining such business size makes significant positive dent on the overall business;
Most of these OPSBs have survived 8 to 10 decades in the business quite successfully – this gives
some confidence on the stability of future business of these OPSBs;
Some of these OPSBs do not have identifiable promoters – promoters’ stake is zero in some of
these banks. Nor these banks have reputed institutions as the majority stake holders. Therefore,
in our view, the regulator may be comfortable in allowing consolidation of these banks;
Valuation – in terms of price to adjusted book value, these stocks remain quite cheap. They
command price to adjusted book values in the range of 1.2 to 2.5 times as compared to around
4 or higher multiples for NPSBs. Consolidation of such banks would be valuation accretive for large NPSBs;
While the levels of bad assets (Net NPAs) are at slightly elevated levels as compared to large
NPSBs, they are far superior as compared to the government-owned banks. In fact, some of these OPSB’s Net NPAs are comparable to a couple of large private banks;
Considering these facts, the consolidation of Old Private Sector Banks could emerge as theme in
the stock markets. Hence, it could be a worth option for the retail investors to evaluate Old Private
Sector Banks (OPSBs) as a thematic investment. In this theme, we have identified Karnataka Bank
and South Indian Bank as good candidates.

Kotak Securities – Private Client Research Please see the Disclosure/Disclaimer on the last page For Private Circulation 11
Invest Mantra September 2017
Current Market Price (Rs) 52 Week H/L (Rs) Mkt Cap (Rs mn)
153 181 / 100 43281
Source: Bloomberg
Source: Bloomberg
FINANCIALS (RS MN) FY17 FY18E FY19E
Interest income 51,854 57,376 65,498
Interest expense 36,948 39,936 45,238
Net interest income 14,906 17,440 20,260
Growth (%) 14.4% 17.0% 16.2%
Other income 8,093 7,015 7,764
Net profit 4,523 5,000 5,800
Growth (%) 8.9% 10.5% 16.0%
Gross NPA (%) 4.2 4.0 3.7
Net NPA (%) 2.6 2.4 2.0
Net interest margin (%) 2.6 2.7 2.8
CAR (%) 13.3 12.8 12.3
RoE (%) 10.2 10.6 10.8 Source: Company, Equinomics Research & Advisory Private Ltd
RoAA (%) 1.2 1.3 1.4
Dividend per share (Rs) 4.0 4.0 4.0
EPS (Rs) 16.0 17.7 20.5
Adjusted BVPS (Rs) 147.5 158.9 177.1
VALUATION PARAMETERS FY17 FY18E FY19E
P/E (x) 9.6 8.7 7.5
P/BV (x) 1.0 1.0 0.9
PRICE PERFORMANCE (%) 1M 3M 6M
0.2 (14.4) 11.3
Source: Bloomberg, Company, Equinomics Research & Advisory Private Ltd Source: Company
Last report at Rs.166 on 17 July 2017
Analyst: [email protected]
Target Price (Rs)
220
Karnataka Bank Ltd
Trend in Asset Quality
Potential Upside (%)
43.7%
1 Year Performance
Share Holding Pattern (%)
Trend in earnings (Rs bn)
FII
21.9%
DII
10.0%
Others
68.1%
50
100
150
200
250 Karnataka Bank Ltd Nifty
0.0
0.5
1.0
1.5
2.0
2.5
3.0
3.5
4.0
4.5
Q1FY17 Q2FY17 Q3FY17 Q4FY17 Q1FY18
NII PAT
2.0
2.5
3.0
3.5
4.0
4.5
5.0
10
12
14
16
18
Q1FY17 Q2FY17 Q3FY17 Q4FY17 Q1FY18
Gross NPA (Rs bn - LHS)
Gross NPA (% - RHS)
Investment Argument
Karnataka Bank Ltd (KBL)is the cheapest Old Private Sector Bank (OPSB), trading at 1.2x trailing Adjusted Book Value;
KBL maintains the highest low-cost (CASA) deposits at around 29%
within the OPSB segment;
While the banking industry is growing credit at poor rate of around 6%,
KBL is one of few mid-sized private banks to grow its advances in double-
digit (10.2%) on year-on-year basis in the last two quarters;
KBL has built a business size of close to Rs.1 trillion, making it an
attractive play for any possible consolidation;
Promoter’s equity stake in the bank continues to remain “ZERO”, which could encourage any possible consolidation, in our view;
Risks & Concerns
Any possible deepening of deflationary pressures in the industrial economy could impact the banking sector including Karnataka Bank quite
adversely.
Company Background
Karnataka Bank survived successfully for 9 decades, built a network of
769 branches spread across India and has the strong presence in southern
India;
Sector Background
The average industry credit growth has crashed to near 2-decade low,
base lending rate has fallen substantially and bad assets remain at record high levels;
In the future, it is going to be a tough task for some of the large new
private banks (NPSBs) to continue to maintain margins and credit growth at very high levels. Hence, these NPSBs may be possibly opt for inorganic
route to grow.

Kotak Securities – Private Client Research Please see the Disclosure/Disclaimer on the last page For Private Circulation 12
Invest Mantra September 2017
South Indian Bank Ltd
Current Market Price (Rs) 52 Week H/L (Rs) Mkt Cap (Rs mn)
29 32 / 17 52618
Source: Bloomberg
Source: Bloomberg
Financia ls (Rs mn) FY17 FY18E FY19E
Interest income 58,471 68,058 79,478
Interest expense 41,716 48,351 56,243
Net interest income 16,755 19,707 23,235
Growth (%) 11.0% 17.6% 17.9%
Other income 7,156 6,440 7,084
Gross profit 12,146 13,185 16,029
Net profit 3,925.0 4,500.0 5,500.0
Growth (%) 17.7% 14.6% 22.2%
Gross NPA (%) 2.1 2.4 2.2
Net NPA (%) 1.9 1.6 1.1
Net interest margin (%) 2.4 2.5 2.5
CAR (%) 12.4 11.2 10.2 Source: Company, Equinomics
RoE (%) 9.0 10.5 13.3
RoAA (%) 0.6 0.6 0.7
Dividend per share (Rs) 0.4 0.5 0.5
EPS (Rs) 2.5 2.5 3.1
Adjusted BVPS (Rs) 22.2 24.4 25.5
Valuat ion parameters FY17 FY18E FY19E
P/E (x) 11.7 11.7 9.4
P/BV (x) 1.3 1.2 1.1
Price Performance (%) 1M 3M 6M
(2.3) 2.6 40.0
Source: Bloomberg, Company, Equinomics Research & Advisory Private Ltd Source: Company
Last report at Rs.30 on 2 August 2017
Analyst: [email protected]
Target Price (Rs)
36
Trend in Asset Quality
Potential Upside (%)
23.3%
1 Year Performance
Share Holding Pattern (%)
Trend in earnings (Rs bn)
FII
38.0%
DII
13.1%
Others
48.9%
70
90
110
130
150
170
190South Indian Bank Ltd Nifty
0.0
0.5
1.0
1.5
2.0
2.5
3.0
3.5
4.0
4.5
5.0
Q1FY17 Q2FY17 Q3FY17 Q4FY17 Q1FY18
NII PAT
2.0
2.5
3.0
3.5
4.0
4.5
5.0
10
12
14
16
18
20
Q1FY17 Q2FY17 Q3FY17 Q4FY17 Q1FY18
Gross NPA (Rs bn - LHS) Gross NPA (% - RHS)
Investment Argument
South Indian Bank (SIB) is the second cheapest bank in the Old Private Sector Bank (OPSB) segment in terms of price to adjusted book value. However, in terms of market cap to business (at 4%), SIB is the cheapest along with Karnataka Bank. For other
banks in OPSB, this ratio is as high as 13%;
SIB highly attractive as compared to much smaller banks in the OPSB segment – it is 40% cheaper than Dhanlaxmi Bank and Lakshmi Vilas Bank in terms of price to Adjusted Book Value;
SIB has successfully maintained its double digit credit growth in June 2017 Quarter also as compared to the industry growth rate of ~6%;
In June 2017 Quarter, SIB recognized entire corporate watch list of Rs.6 billion as NPA (Non-performing Assets). This signals the completion of the clean-up exercise to a large extent;
Business size exceeds Rs.1 trillion and the Promoter’s stake continues to remain “ZERO”;
Risks & Concerns
Any possible deepening of slowdown in the Industrial economy and any massive fall in oil price could impact this bank. SIB draws a significant portion of business from the NRIs working in the oil regions;
Company Background
South Indian Bank (SIB), incorporated in 1928 at Thrissur in Kerala, survived successfully over 8 decades. The bank has a strong presence in south India (80%+ branches).
Sector Background
The average industry credit growth has crashed to near 2-decade low, base lending rate has fallen substantially and bad assets remain at record high levels;
In the future, it is going to be a tough task for some of the large new private banks
(NPSBs) to continue to maintain margins and credit growth at very high levels. Hence, these NPSBs may be possibly opt for inorganic route to grow.

Kotak Securities – Private Client Research Please see the Disclosure/Disclaimer on the last page For Private Circulation 13
Invest Mantra September 2017
THEME 3 - PSU STRATEGIC STAKE SALE
The government has kept the fiscal deficit target at 3.2% for FY2018. Already both Fiscal and Revenue Deficits have shot up. Spectrum revenues (part of non-tax revenues) from the telecom
industry are also under severe pressures. Poor industrial growth and gradual fall in the capital
formation (the gross fixed capital formation has consistently come down from 32.3% of GDP on FY2013 to 29.5% in FY2017) require continued boost to the expenditures. These economic
conditions could warrant aggressive approach to stake sale (with change of management into the
hands of private sector). Already, the government has proposed to go for strategic sale of stakes in several mid-sized PSUs like BEML, Dredging Corporation and Shipping Corporation of India;
In the listed space, such stake sale was proved to be highly successful in creating wealth for the
shareholders. Ever since the government sold its majority stake and changed the management control to the private sector, the market cap of Hindustan Zinc multiplied to over Rs.1.2 trillion from
a couple of billion rupees at the time of its stake sale. Other reasons to bank on these themes are:
Cash-rich PSUs may once again announce high dividend payouts due to soaring deficits and the government’s commitment to stick to the fiscal target;
Media sources had reported that the government may adopt auction route to divest the stake
in PSUs bringing out the true potential in the value of PSUs by promoting healthy competition among the private entrepreneurs;
Some of the PSUs have strong balance sheet, solid cash and also rich assets. Hence, stake sale in
such PSUs could help in finding true market value of these companies. We believe that their operating performance could also substantially improve over the years once they come under the
management of private entrepreneurs. In this investment theme, we have identified Balmer Lawrie
& Co and Shipping Corporation of India as potential candidates.

Kotak Securities – Private Client Research Please see the Disclosure/Disclaimer on the last page For Private Circulation 14
Invest Mantra September 2017
Current Market Price (Rs) 52 Week H/L (Rs) Mkt Cap (Rs mn)
246 287 / 163 28033
Source: Bloomberg
Source: Bloomberg
Financia ls (Rs mn) FY17 FY18E FY19E
Sales 17,790 19,000 21,500
Growth (%) 7.4 6.8 13.2
EBIT 2,580 2,950 3,330
EBIT margin (%) 14.5% 15.5% 15.5%
PBT 2,540 2,900 3,270
Net profit 1,700 1,940 2,170
EPS (Rs) 14.9 17.0 19.0
Growth (%) 3.6 14.0 11.8
CEPS 17.6 19.8 21.9
Book Value (Rs / Share) 119.0 124.0 129.0
Dividend per Share (Rs) 7.0 7.0 7.0
ROE (%) 12.5 14.3 15.9 Source: Company
ROCE (%) 17.8 19.3 21.2
Net cash (debt) 5,298 5,248 5,198
Net working capital (Days) 133.6 130.5 128.5
Valuat ion Parameters FY17 FY18E FY19E
P/E (x) 16.5 14.5 12.9
P/BV (x) 2.1 2.0 1.9
EV/Sales (x) 1.3 1.2 1.1
EV/EBITDA (x) 8.8 7.7 6.9
Price Performance (%) 1M 3M 6M
(1.4) 5.3 16.2
Source: Bloomberg, Company, Equinomics Research & Advisory Private Ltd
Potential Upside (%)
17.5%
1 Year Performance
Share Holding Pattern (%)
Segment revenu breakup (%)
Last report at Rs.243 on 10 August 2017
Analyst: [email protected]
Target Price (Rs)
289
Balmer Lawrie Company Ltd
FII
3.3% DII
8.5%
Others
88.2%
80
140
200
260
320
380
440 Balmer Lawrie Co Ltd Nifty
0%
7%
14%
21%
28%
35%
42%
FY13 FY14 FY15 FY16 FY17
Travel and tours Industrial Packaging
Logistics & Infrastructure. Greases and Lubricants
Others
Investment Argument
Balmer Lawrie Company (BLC) is known for consistent growth in revenues and
profits in a span of over 18 years (except for a couple of years in recent times) and has an impressive dividend track record. It holds free cash of around Rs.5 billion;
Over a period of 21 years, BLC has increased its Gross Block by more than 7 fold to about Rs.6.5 billion (by 2017 year-end) from Rs.0.87 billion in FY1995;
Strong balance sheet – net cash is over Rs.5 billion which is 1/5th of its market cap
– augurs well for possible special dividends and aggressive capex plans;
Looking at the government’s move to divest stake in BEML, a company with such strategic importance, the government may eventually divest its indirect stake
(36.88%) in BLC as it is focused mainly on commercial ventures;
BLC’s holding company, Balmer Lawrie Investments (BLIL, a government-owned company) still maintains (on its web site, www.blinv.com) its proposal to divest the
stake (61.8%) in BLC. BLC’s logistic segment holds rich real estate assets and hence, it could attract acquisition by the private sector at significant premium, if the
government decides to divest the stake held in BLC by BLIL;
Risks & Concerns
Profits are majorly derived from logistic infra and travel business. Hence, any
possible severe slowdown in the industrial and service economies could impact the performance adversely;
Company Background
BLC, over 150-year old company, has rich real estate assets spread over 30 facilities, mostly in cities. While 50% of total profits accrue from the logistic business, the
balance is contributed by industrial packaging, travel and grease & lubricants;
Sector Background
The growth of Logistic, industrial packaging and Greases & Lubricants segments
depends on the prospects of industrial economy, which is expected to improve going forward as the government has been pushing public expenditures;
Its travel segment, which has improved profitability substantially in the recent period due to major restructuring, depends on the growth of Indian service economy, which is still growing over 8%;

Kotak Securities – Private Client Research Please see the Disclosure/Disclaimer on the last page For Private Circulation 15
Invest Mantra September 2017
Shipping Corporation of India Ltd
Current Market Price (Rs) 52 Week H/L (Rs) Mkt Cap (Rs mn)
97 103 / 56 45229
Source: Bloomberg
Source: Capitaline
FINANCIALS (RS MN) FY17 FY18E FY19E
Sales 34,618 36,673 39,110
Growth (%) (16.0) 5.9 6.6
EBITDA 7,570 8,138 9,198
EBITDA margin (%) 21.9 22.2 23.5
PBT 1,776 2,643 3,729
Net profit 1,598 2,379 3,356
EPS (Rs) 3.4 5.1 7.2
Growth (%) (68.5) 48.8 41.1
CEPS (Rs) 15.6 17.0 18.9
Book value (Rs/share) 151.8 156.9 164.1
Dividend per share (Rs) - - 1.0 Source: Company, Kotak Securities - Private Client Research
ROE (%) 2.3 3.3 4.4
ROCE (%) 3.1 3.6 4.5
Net cash (debt) (26,762) (24,585) (22,498)
Net Working Capital (Days) 99.0 98.0 99.0
VALUATION PARAMETERS FY17 FY18E FY19E
P/E (x) 28.3 19.0 13.5
P/BV (x) 0.6 0.6 0.6
EV/Sales (x) 2.1 1.9 1.7
EV/EBITDA (x) 9.5 8.6 7.4
PRICE PERFORMANCE (%) 1M 3M 6M
18 25 54
Source: Bloomberg, Company, Kotak Securities - Private Client Research Source: Company
Last report at Rs.93 on 24 August 2017
Analyst: [email protected]
Target Price (Rs)
125
Book Value for SCI (Rs/Share)
Potential Upside (%)
28.7%
1 Year Performance
Share Holding Pattern (%)
Gross debt of the company (Rs mn)
Promoter
63.7%FII
3.6%
DII
18.8%
Others
13.8%
50
110
170
230
290
350 Shipping Corporation of India Ltd Nifty
Investment Argument
Shipping markets have become stable and is expected to improve going
forward
We also expect operating cost to remain low with lower bunker cost that should translate into improvement in EBIDTA and return ratios of the
company.
Company is well diversified into every segment of shipping
The balance sheet health of the company has improved over the last two
years with debt prepayment and is expected to improve further going forward
Strategic sale by government is expected to remove government bound constraints and improve management of SCI which should add value to the
company
Risks & Concerns
Healthy new ship build orders to keep shipping rates subdued
Weak trade can negatively impact freight rates.
Company Background
SCI is a PSU with GOI holding around 64% in the company
SCI primarily operate in the tanker segments.
Sector Background
There are three main segments of shipping including tankers, dry bulk, and
liners.
Shipping companies usually operate through three types of contracts including spot, contract and contract of Affreightment
0
20,000
40,000
60,000
80,000
FY14 FY15 FY16 FY17 FY18E FY19E
0
30
60
90
120
150
180
FY14 FY15 FY16 FY17 FY18 FY19
Kotak Securities – Private Client Research Please see the Disclosure/Disclaimer on the last page For Private Circulation 16
Invest Mantra September 2017
THEME 4 - DEEP VALUE STOCKS
Deep value stocks are the ones which have rich assets or huge free cash or substantial growth potential but the market hasn’t fully discounted such valuations. Such stocks normally show resilient
when the equity markets go through huge volatility with downward bias. Even if such deep value
stocks give in to the market pressures, the investors could confidently make use of such opportunities to continuously accumulate the stock. (However, from the perspective of risk-
management, the investors shouldn’t exceed 5% to 10% allocation per stock depending upon their
risk profile). In this investment theme, we have identified Bombay Burmah Trading Corporation as a potential candidate.

Kotak Securities – Private Client Research Please see the Disclosure/Disclaimer on the last page For Private Circulation 17
Invest Mantra September 2017
Bombay Burmah Trading Corporation
Current Market Price (Rs) 52 Week H/L (Rs) Mkt Cap (Rs mn)
1021 1085 / 441 71230
Source: Bloomberg
Source: Bloomberg
Financia ls (Rs mn) FY17 FY18E FY19E
Sales 96,093 105,700 118,390
Growth (%) 7.7 10.0 12.0
EBIT 14,529 15,525 16,859
EBIT margin (%) 15.1% 14.7% 14.2%
PBT 12,786 13,735 14,909
Net profit 8,582 9,434 10,109
EPS (Rs) 123.0 135.3 144.5
Growth (%) 7.6 9.9 7.2
CEPS 141.8 154.6 165.7
Book Value (Rs / Share) 346.7 368.2 396.8
Dividend per Share (Rs) 1.0 1.0 1.0
ROE (%) 39.6 37.7 37.8 Source: Company
ROCE (%) 44.6 47.7 51.8
Net cash (debt) (7,536) 1,464 15,216
Net working capital (Days) 10.8 10.8 10.8
Valuat ion Parameters FY17 FY18E FY19E
P/E (x) 8.3 7.5 7.1
P/BV (x) 2.9 2.8 2.6
EV/Sales (x) 0.7 0.6 0.6
EV/EBITDA (x) 4.5 4.3 3.9
Price Performance (%) 1M 3M 6M
16.1 14.0 47.9
Source: Bloomberg, Company, Equinomics Research & Advisory Private Ltd
Last report at Rs.878 on 10 August 2017
Analyst: [email protected]
Target Price (Rs)
1130
Potential Upside (%)
10.7%
1 Year Performance
Share Holding Pattern (%)
BBTC EVs % Discount to its Investmets (Trend)
Promoter
60.1%
FII
11.0%
DII
4.4%
Others
24.5%
80
280
480
680
880
Bombay Burmah Trading Corporation Ltd Nifty
Investment Argument
Bombay Burmah Trading Corporation (BBTC) holds 50.75% stake in in Britannia Industries (a step-down subsidiary). While the Enterprise Value (EV) of BBTC stands
at Rs.72,688 million, the market value of its investments in Britannia alone is worth
4-times at Rs.2,58,870 million, which is at 72% discount to value of total investments. However, the average of holding companies (HCs) discount stands at
around 55% only;
BBTC deserves much lower discount:
95% of BBTC’s total investment value comes from Britannia. For most HCs, they come from several companies – theoretically speaking, unlocking possibility
from a single investment is relatively higher;
Most HCs hold shares of firms engaged in diversified and cyclical businesses. However, Britannia is engaged in consistently growing FMCG business, which
enjoys much higher premium in markets;
While many HCs do not have any assets on their own, BBTC has rich assets like huge plantations, and also reportedly significant land parcels;
Risks & Concerns
Only possible risk to our view is any possible governance issue in terms of divestment of holdings in Britannia in favour of any promoters. However,
considering India’s regulatory set up, we believe that such risk is too low.
Company Background
BBTC, part of the Wadia Group, is engaged majorly in tea & coffee plantations,
and auto electric component manufacturing;
Sector Background
Plantations, auto-electric components and Investment are key segments for BBTC. Plantation business remains highly cyclical and expected to remain so;
Auto-electric business is quite stable one in terms of revenues and profits streams.
This segment is expected to remain stable going forward as well;
Investment incomes are mainly from Britannia, which is expected to continue to
maintain consistent growth in both profits and dividend payments over the years;
60%
65%
70%
75%
80%
85%
-
50
100
150
200
250
300
Mar-13 Mar-14 Mar-15 Mar-16 Mar-17 Current
Enterprise Value (EV ) (Rs.bn - LHS)
Value of Investment in Britannia (Rs.bn - LHS)
% Discount (RHS)

SEPTEMBER 1, 2017
PRIVATE CLIENT RESEARCH 1-MONTH PORTFOLIO
STRICTLY FOR INTERNAL CIRCULATION ONLY
NIFTY: 9918 Stock Weight M Cap Current
(%) (Rs mn) Price PE (x) Comment (Rs) FY18 FY19E
ITC 10 3,390,486 282 30.0 26.6 Reassuring signals from the government, as excise duty hikewell below past five years' average
Discount to average FMCG multiples provides protectionfrom downsides
Genus Power 9 12,760 50 16.6 13.8 Demand for meters is gaining traction
Smart meters offers a good long term opportunity
Shipping Corp of India 9 46,580 100 19.6 13.9 Shipping markets have become stable which is positive forthe stock
Strategic sale by government is expected to improvemanagement of SCI
Stock is trading at attractive valuations
M&M 9 825,830 1,345 20.7 18.8 Good monsoons is likely to keep tractor demand robustin FY18
Increased share of tractor revenues will be positive foroverall EBITDA margins
UPL 9 422,231 831 18.5 14.7 UPL is coming into the Nifty in end of Sep’17. This shouldlead to re-rating of the stock
In the Agrochemical space the company is way ahead of itspeers in terms of size. It has best in class RoE of 25% onsuch a high base and earnings CAGR forecast of 22%(for FY17-19E).
Engineers India 9 105,124 156 25.6 17.3 EIL expected to benefit from recovery in spending by major
hydrocarbon players like HPCL, BPCL and IOC. Company
likely to expand margins in FY17/FY18.
Kansai Nerolac 9 274,890 510 48.6 44.0 Strong automotive demand is a big positive for the companywhich is the market leader in automotive paints
Company is also aggressively expanding the decorativesegment
Raw material situation to remain benign
Guj. Alkalies & Chem 9 32239 439 6.8 6.7 Caustic soda prices have risen to US$470/tonne in the lastsix months. We expect the prices to remain firm for the next one or two years, which would drive the earnings for GACLin FY18E & FY19E
Asian Granito 9 13,846 461 25.9 17.6 With its continuous innovations for introducing value addedproducts, access to low cost gas, shift towards increasingB2C sales, we expect company’s revenues and PAT to growat a CAGR of 17%/42% between FY17-19. Stock is tradingat attractive valuations
TV18 Broadcast 9 65,056 38 28.8 17.5 See pick-up in near-term ratings of Hindi GEC channels,valuations reasonable at 18.5x PER FY19E
Finolex Industries 9 75,576.9 609 20.5 17.1 GST led disruption is over and demand has recovered fromend of July. Good monsoon poositive for rural economy and agri pipes demand.
Targets for double digit volume growth in pipes and fittingbusiness in FY18
Source : Kotak Securities - Private Client research

Kotak Securities – Private Client Research Please see the Disclosure/Disclaimer on the last page For Private Circulation 18
Invest Mantra September 2017
RATING SCALE Definitions of ratings BUY – We expect the stock to deliver more than 12% returns over the next 9 months
ACCUMULATE – We expect the stock to deliver 5% - 12% returns over the next 9 months
REDUCE – We expect the stock to deliver 0% - 5% returns over the next 9 months
SELL – We expect the stock to deliver negative returns over the next 9 months
NR – Not Rated. Kotak Securities is not assigning any rating or price target to the stock. The report has been prepared for
information purposes only.
RS – Rating Suspended. Kotak Securities has suspended the investment rating and price target for this stock, either because there
is not a Sufficient fundamental basis for determining, or there are legal, regulatory or policy constraints around publishing,
an investment rating or target. The previous investment rating and price target, if any, are no longer in effect for this stock
and should not be relied upon.
NA – Not Available or Not Applicable. The information is not available for display or is not applicable
NM – Not Meaningful. The information is not meaningful and is therefore excluded.
NOTE – Our target prices are with a 9-month perspective. Returns stated in the rating scale are our internal benchmark.
FUNDAMENTAL RESEARCH TEAM
Sanjeev Zarbade Ruchir Khare Amit Agarwal Nipun Gupta Capital Goods, Engineering Capital Goods, Engineering Logistics, Paints, Transportation Information Technology
[email protected] [email protected] [email protected] [email protected]
+91 22 6218 6424 +91 22 6218 6431 +91 22 6218 6439 +91 22 6218 6433
Teena Virmani Ritwik Rai Jatin Damania Ashini Shah Construction, Cement FMCG, Media Metals & Mining Midcap
[email protected] [email protected] [email protected] [email protected]
+91 22 6218 6432 +91 22 6218 6426 +91 22 6218 6440 +91 22 6218 5438
Arun Agarwal Sumit Pokharna Pankaj Kumar K. Kathirvelu Auto & Auto Ancillary Oil and Gas Midcap Production
[email protected] [email protected] [email protected] [email protected]
+91 22 6218 6443 +91 22 6218 6438 +91 22 6218 6434 +91 22 6218 6427
TECHNICAL RESEARCH TEAM
Shrikant Chouhan Amol Athawale
[email protected] [email protected]
91 22 6218 5408 +91 20 6620 3350
DERIVATIVES RESEARCH TEAM
Sahaj Agrawal Malay Gandhi Prashanth Lalu Prasenjit Biswas
[email protected] [email protected] [email protected] [email protected]
+91 79 6607 2231 +91 22 6218 6420 +91 22 6218 5497 +91 33 6625 9810

Kotak Securities – Private Client Research Please see the Disclosure/Disclaimer on the last page For Private Circulation 19
Invest Mantra September 2017
Disclosure/Disclaimer – The disclaimer/disclosure for Balmer Lawrie, BBTC, Karnataka Bank, South Indian Bank is as follows.
The information contained herein is being circulated by KSL based on the Research Report obtained from Equinomics Research & Advisory Private Ltd (Equinomics), a SEBI Registered Investment Advisor (Registration No. INA000001712). As declared by Equinomics, the said investment advisory firm, its Research Analyst and its Managing Director
Mr. I. G. Chokkalingam and his relatives have no material conflict of interest in providing the said details to us except the below.
Disclosure/Disclaimer of Equinomics Research & Advisory Private Ltd as declared by it:
Whether Research Analyst's or relatives/ Equinomics/ Associate Company have any financial interest in the Subject Company and nature of such financial interest – South Indian
Bank - Yes
Whether Research Analyst or relatives/ Equinomics/ Associate Company have actual/beneficial ownership of 1% or more in the securities of Subject Company at the end of the
month immediately preceding the date of publication of the document- No
Whether the Research Analyst/ Equinomics/ Associate Company has received any compensation or any other benefits from the Subject Company or third party in connection
with the research report or any other activity. Whether Managing Director of Equinomics / Research Analyst has served as an officer, director or employee of the subject company. Whether the Research Analyst/ Equinomics/ Associate Company has been engaged in market making activity of the subject company. Whether the Research Analyst/
Equinomics/ Associates or Relatives, have any other material conflict of interest at the time of publication of the research report or at the time of public appearance. Whether
Equinomics or its associate company have managed or co-managed public offering of securities for the subject company in the past twelve months. Whether Equinomics or its
associate company have received any compensation for investment banking or merchant banking or brokerage services from the subject company. Whether Equinomics or its associate company have received any compensation for products or services other than investment banking or merchant banking or brokerage services from the subject
company - No
Whether Research Analyst / Equinomics has recommended the scrip to its clients in the past and the recommendation is active as on the date of this report- Yes
Equinomics' Ratings and Other Definitions
BUY- We expect this stock to deliver more than 15% returns over the next 12 months.
ACCUMULATE- We expect this stock to deliver 5-10% returns over the next 12 months.
HOLD- We expect this stock to deliver 5% returns over the next 12 months.
SELL- Above Target Price. *Wait for stock update when target price reached.
Equinomics Research & Advisory Private Ltd, Chokkalingam - Founder & Managing Director, Address: J-1, J-2, New Gitanjali Society, Gate No: 3, Raheja Township, (Opp. To Malad Panchvati Co Op Housing Society), Malad East, Mumbai - 400 097. Ph: +91 22 28769268 | Email: [email protected] | Website: www.equinomics.in.
CIN:U67190MH2014PTC252252. For general disclosures of Equinomics Research & Advisory Private Ltd, pls refer the link http:// equinomics.in/wp-
content/uploads/2017/05/Equinomics-Morning-Insight-Disclaimer.pdf
Disclosure/Disclaimer of KSL
Kotak Securities Limited established in 1994, is a subsidiary of Kotak Mahindra Bank Limited. Kotak Securities is one of India's largest brokerage and distribution house. Kotak
Securities Limited is a corporate trading and clearing member of Bombay Stock Exchange Limited (BSE), National Stock Exchange of India Limited (NSE), Metropolitan Stock
Exchange of India Limited (MSE). Our businesses include stock broking, services rendered in connection with distribution of primary market issues and financial products like
mutual funds and fixed deposits, depository services and Portfolio Management. Kotak Securities Limited is also a depository participant with National Securities Depository Limited (NSDL) and Central Depository Services (India) Limited (CDSL). Kotak Securities Limited is also registered with Insurance Regulatory and Development Authority as
Corporate Agent for Kotak Mahindra Old Mutual Life Insurance Limited and is also a Mutual Fund Advisor registered with Association of Mutual Funds in India (AMFI). We are
registered as a Research Analyst under SEBI (Research Analyst) Regulations, 2014.
We hereby declare that our activities were neither suspended nor we have defaulted with any stock exchange authority with whom we are registered in last five years. However SEBI, Exchanges and Depositories have conducted the routine inspection and based on their observations have issued advise/warning/ deficiency letters/ or levied minor penalty
on KSL for certain operational deviations. We have not been debarred from doing business by any Stock Exchange/ SEBI or any other authorities; nor has our certificate of
registration been cancelled by SEBI at any point of time. We offer our research services to clients as well as our prospects.
This document is not for public distribution and has been furnished to you solely for your information and must not be reproduced or redistributed to any other person. Persons
into whose possession this document may come are required to observe these restrictions. This material is for the personal information of the authorized recipient, and we are not soliciting any action based upon it. This report is not to be construed as an offer to sell or the solicitation of an offer to buy any security in any jurisdiction where such an
offer or solicitation would be illegal. It is for the general information of clients of Kotak Securities Ltd. It does not constitute a personal recommendation or take into account
the particular investment objectives, financial situations, or needs of individual clients. Neither Kotak Securities Limited, nor any person connected with it, accepts any liability
arising from the use of this document. The recipients of this material should rely on their own investigations and take their own professional advice. Price and value of the investments referred to in this material may go up or down. Past performance is not a guide for future performance. Certain transactions -including those involving futures,
options and other derivatives as well as non-investment grade securities - involve substantial risk and are not suitable for all investors. Reports based on technical analysis centers
on studying charts of a stock's price movement and trading volume, as opposed to focusing on a company's fundamentals and as such, may not match with a report on a
company's fundamentals.
Opinions expressed are the current opinions as of the date appearing on this material only. While we endeavor to update on a reasonable basis the information discussed in
this material, there may be regulatory, compliance or other reasons that prevent us from doing so. Prospective investors and others are cautioned that any forward-looking
statements are not predictions and may be subject to change without notice. Our proprietary trading and investment businesses may make investment decisions that are
inconsistent with the recommendations expressed herein. Kotak Securities Limited has two independent equity research groups: Institutional Equities and Private Client Group.
The views and opinions expressed in this document may or may not match or may be contrary with the views, estimates, rating, and target price of the Institutional Equities Research Group of Kotak Securities Limited.
We and our affiliates/associates, officers, directors, and employees, Research Analyst(including relatives) worldwide may: (a) from time to time, have long or short positions in,
and buy or sell the securities thereof, of company (ies) mentioned herein or (b) be engaged in any other transaction involving such securities and earn brokerage or other
compensation or act as a market maker in the financial instruments of the subject company/company (ies) discussed herein or act as advisor or lender / borrower to such company (ies) or have other potential/material conflict of interest with respect to any recommendation and related information and opinions at the time of publication of
Research Report or at the time of public appearance.
Kotak Securities Limited (KSL) may have proprietary long/short position in the above mentioned scrip(s) and therefore may be considered as interested. The views provided
herein are general in nature and does not consider risk appetite or investment objective of particular investor; readers are requested to take independent professional advice before investing. This should not be construed as invitation or solicitation to do business with KSL. Kotak Securities Limited is also a Portfolio Manager. Portfolio Management
Team (PMS) takes its investment decisions independent of the PCG/Institutional Equities research and accordingly PMS may have positions contrary to the PCG/Institutional
Equities research recommendation. Kotak Securities Limited does not provide any promise or assurance of favorable view for a particular industry or sector or business group
in any manner. The investor is requested to take into consideration all the risk factors including their financial condition, suitability to risk return profile and take professional
advice before investing.
No part of this material may be duplicated in any form and/or redistributed without Kotak Securities' prior written consent. Details of Associates are available on our website ie
www.kotak.com
We or our associates may have received compensation from the subject company(ies) in the past 12 months.
We or our associates have managed or co-managed public offering of securities for the subject company(ies) in the past 12 months: No
We or our associates may have received compensation for investment banking or merchant banking or brokerage services from the subject company(ies) in the past 12
months. We or our associates may have received any compensation for products or services other than investment banking or merchant banking or brokerage services from
the subject company(ies) in the past 12 months. We or our associates may have received compensation or other benefits from the subject company(ies) or third party in
connection with the research report. Our associates may have financial interest in the subject company(ies).

Kotak Securities – Private Client Research Please see the Disclosure/Disclaimer on the last page For Private Circulation 20
Invest Mantra September 2017
Research Analyst or his/her relative's financial interest in the subject company(ies): No
Kotak Securities Limited has financial interest in the subject company(ies) at the end of the month immediately preceding the date of publication of Research Report: Balmer
Lawrie & Co - Yes
Our associates may have actual/beneficial ownership of 1% or more securities of the subject company(ies) at the end of the month immediately preceding the date of
publication of Research Report.
Kotak Securities Limited has actual/beneficial ownership of 1% or more securities of the subject company(ies) at the end of the month immediately preceding the date of
publication of Research Report: No
Subject company(ies) may have been client during twelve months preceding the date of distribution of the research report.
"A graph of daily closing prices of securities is available at www.nseindia.com and http://economictimes.indiatimes.com/markets/stocks/stock-quotes. (Choose a company from
the list on the browser and select the "three years" icon in the price chart)."
Kotak Securities Limited. Registered Office: 27 BKC, C 27, G Block, Bandra Kurla Complex, Bandra (E), Mumbai 400051. CIN: U99999MH1994PLC134051, Telephone No.: +22 43360000, Fax No.: +22 67132430. Website: www.kotak.com/www.kotaksecurities.com. Correspondence Address: Infinity IT Park, Bldg. No 21, Opp. Film City Road, A K
Vaidya Marg, Malad (East), Mumbai 400097. Telephone No: 42856825. SEBI Registration No: NSE INB/INF/INE 230808130, BSE INB 010808153/INF 011133230, MSE INE
260808130/INB 260808135/INF 260808135, AMFI ARN 0164, PMS INP000000258 and Research Analyst INH000000586. NSDL/CDSL: IN-DP-NSDL-23-97.
Our research should not be considered as an advertisement or advice, professional or otherwise. The investor is requested to take into consideration all the risk factors including
their financial condition, suitability to risk return profile and the like and take professional advice before investing. Investments in securities market are subject to market risks, read all the related documents carefully before investing. Derivatives are a sophisticated investment device. The investor is requested to take into consideration all the risk factors
before actually trading in derivative contracts. Compliance Officer Details: Mr. Manoj Agarwal. Call: 022 - 4285 8484, or Email: [email protected].
In case you require any clarification or have any concern, kindly write to us at below email ids:
Level 1: For Trading related queries, contact our customer service at '[email protected]' and for demat account related queries contact us at [email protected] or call us on: Online Customers - 30305757 (by using your city STD code as a prefix) or Toll free numbers 18002099191 / 1800222299, Offline Customers - 18002099292
Level 2: If you do not receive a satisfactory response at Level 1 within 3 working days, you may write to us at [email protected] or call us on 022- 42858445 and if
you feel you are still unheard, write to our customer service HOD at [email protected] or call us on 022-42858208.
Level 3: If you still have not received a satisfactory response at Level 2 within 3 working days, you may contact our Compliance Officer (Mr. Manoj Agarwal) at [email protected] or call on 91- (022) 4285 8484.
Level 4: If you have not received a satisfactory response at Level 3 within 7 working days, you may also approach CEO (Mr. Kamlesh Rao) at [email protected] or call on
91- (022) 4285 8301.

Kotak Securities – Private Client Research Please see the Disclosure/Disclaimer on the last page For Private Circulation 21
Invest Mantra September 2017
Disclosure/Disclaimer Kotak Securities Limited established in 1994, is a subsidiary of Kotak Mahindra Bank Limited. Kotak Securities is one of India's largest brokerage and distribution house.
Kotak Securities Limited is a corporate trading and clearing member of Bombay Stock Exchange Limited (BSE), National Stock Exchange of India Limited (NSE), Metropolitan Stock
Exchange of India Limited (MSE). Our businesses include stock broking, services rendered in connection with distribution of primary market issues and financial products like mutual funds and fixed deposits, depository services and Portfolio Management.
Kotak Securities Limited is also a depository participant with National Securities Depository Limited (NSDL) and Central Depository Services (India) Limited (CDSL). Kotak Securities
Limited is also registered with Insurance Regulatory and Development Authority as Corporate Agent for Kotak Mahindra Old Mutual Life Insurance Limited and is also a Mutual Fund Advisor registered with Association of Mutual Funds in India (AMFI). We are registered as a Research Analyst under SEBI (Research Analyst) Regulations, 2014.
We hereby declare that our activities were neither suspended nor we have defaulted with any stock exchange authority with whom we are registered in last five years. However
SEBI, Exchanges and Depositories have conducted the routine inspection and based on their observations have issued advise/warning/deficiency letters/ or levied minor penalty on KSL for certain operational deviations. We have not been debarred from doing business by any Stock Exchange / SEBI or any other authorities; nor has our certificate of registration
been cancelled by SEBI at any point of time.
We offer our research services to clients as well as our prospects.
This document is not for public distribution and has been furnished to you solely for your information and must not be reproduced or redistributed to any other person. Persons
into whose possession this document may come are required to observe these restrictions.
This material is for the personal information of the authorized recipient, and we are not soliciting any action based upon it. This report is not to be construed as an offer to sell or
the solicitation of an offer to buy any security in any jurisdiction where such an offer or solicitation would be illegal. It is for the general information of clients of Kotak Securities
Ltd. It does not constitute a personal recommendation or take into account the particular investment objectives, financial situations, or needs of individual clients.
We have reviewed the report, and in so far as it includes current or historical information, it is believed to be reliable though its accuracy or completeness cannot be guaranteed.
Neither Kotak Securities Limited, nor any person connected with it, accepts any liability arising from the use of this document. The recipients of this material should rely on their
own investigations and take their own professional advice. Price and value of the investments referred to in this material may go up or down. Past performance is not a guide for future performance. Certain transactions -including those involving futures, options and other derivatives as well as non-investment grade securities - involve substantial risk and
are not suitable for all investors. Reports based on technical analysis centers on studying charts of a stock's price movement and trading volume, as opposed to focusing on a
company's fundamentals and as such, may not match with a report on a company's fundamentals.
Opinions expressed are our current opinions as of the date appearing on this material only. While we endeavor to update on a reasonable basis the information discussed in this
material, there may be regulatory, compliance or other reasons that prevent us from doing so. Prospective investors and others are cautioned that any forward-looking statements
are not predictions and may be subject to change without notice. Our proprietary trading and investment businesses may make investment decisions that are inconsistent with
the recommendations expressed herein.
Kotak Securities Limited has two independent equity research groups: Institutional Equities and Private Client Group. This report has been prepared by the Private Client Group.
The views and opinions expressed in this document may or may not match or may be contrary with the views, estimates, rating, target price of the Institutional Equities Research
Group of Kotak Securities Limited.
We and our affiliates/associates, officers, directors, and employees, Research Analyst(including relatives) worldwide may: (a) from time to time, have long or short positions in,
and buy or sell the securities thereof, of company (ies) mentioned herein or (b) be engaged in any other transaction involving such securities and earn brokerage or other
compensation or act as a market maker in the financial instruments of the subject company/company (ies) discussed herein or act as advisor or lender / borrower to such company (ies) or have other potential/material conflict of interest with respect to any recommendation and related information and opinions at the time of publication of Research Report
or at the time of public appearance. Kotak Securities Limited (KSL) may have proprietary long/short position in the above mentioned scrip(s) and therefore may be considered as
interested. The views provided herein are general in nature and does not consider risk appetite or investment objective of particular investor; readers are requested to take
independent professional advice before investing. This should not be construed as invitation or solicitation to do business with KSL. Kotak Securities Limited is also a Portfolio Manager. Portfolio Management Team (PMS) takes its investment decisions independent of the PCG research and accordingly PMS may have positions contrary to the PCG
research recommendation. Kotak Securities Limited does not provide any promise or assurance of favourable view for a particular industry or sector or business group in any
manner. The investor is requested to take into consideration all the risk factors including their financial condition, suitability to risk return profile and take professional advice
before investing.
The analyst for this report certifies that all of the views expressed in this report accurately reflect his or her personal views about the subject company or companies and its or
their securities, and no part of his or her compensation was, is or will be, directly or indirectly related to specific recommendations or views expressed in this report.
No part of this material may be duplicated in any form and/or redistributed without Kotak Securities' prior written consent.
Details of Associates are available on our website ie www.kotak.com
Research Analyst has served as an officer, director or employee of subject company(ies): No
We or our associates may have received compensation from the subject company(ies) in the past 12 months.
We or our associates have managed or co-managed public offering of securities for the subject company(ies) in the past 12 months: No
We or our associates may have received compensation for investment banking or merchant banking or brokerage services from the subject company(ies) in the past 12 months. We or our associates may have received any compensation for products or services other than investment banking or merchant banking or brokerage services from the subject
company(ies) in the past 12 months. We or our associates may have received compensation or other benefits from the subject company(ies) or third party in connection with the
research report. Our associates may have financial interest in the subject company(ies).
Research Analyst or his/her relative's financial interest in the subject company(ies): No
Kotak Securities Limited has financial interest in the subject company(ies) at the end of the month immediately preceding the date of publication of Research Report: Gail India,
ITC, Tata Motors- Yes
Our associates may have actual/beneficial ownership of 1% or more securities of the subject company(ies) at the end of the month immediately preceding the date of publication
of Research Report.
Research Analyst or his/her relatives has actual/beneficial ownership of 1% or more securities of the subject company(ies) at the end of the month immediately preceding the date
of publication of Research Report: No.
Kotak Securities Limited has actual/beneficial ownership of 1% or more securities of the subject company(ies) at the end of the month immediately preceding the date of
publication of Research Report: No
Subject company(ies) may have been client during twelve months preceding the date of distribution of the research report.
"A graph of daily closing prices of securities is available at www.nseindia.com and http://economictimes.indiatimes.com/markets/stocks/stock-quotes. (Choose a company from
the list on the browser and select the "three years" icon in the price chart)."
Kotak Securities Limited. Registered Office: 27 BKC, C 27, G Block, Bandra Kurla Complex, Bandra (E), Mumbai 400051. CIN: U99999MH1994PLC134051, Telephone No.: +22
43360000, Fax No.: +22 67132430. Website: www.kotak.com/www.kotaksecurities.com. Correspondence Address: Infinity IT Park, Bldg. No 21, Opp. Film City Road, A K Vaidya
Marg, Malad (East), Mumbai 400097. Telephone No: 42856825. SEBI Registration No: NSE INB/INF/INE 230808130, BSE INB 010808153/INF 011133230, MSE INE 260808130/INB 260808135/INF 260808135, AMFI ARN 0164, PMS INP000000258 and Research Analyst INH000000586. NSDL/CDSL: IN-DP-NSDL-23-97. Our research should not be considered
as an advertisement or advice, professional or otherwise. The investor is requested to take into consideration all the risk factors including their financial condition, suitability to
risk return profile and the like and take professional advice before investing. Investments in securities market are subject to market risks, read all the related documents carefully
before investing. Derivatives are a sophisticated investment device. The investor is requested to take into consideration all the risk factors before actually trading in derivative
contracts. Compliance Officer Details: Mr. Manoj Agarwal. Call: 022 - 4285 8484, or Email: [email protected].
Level 1: For Trading related queries, contact our customer service at '[email protected]' and for demat account related queries contact us at [email protected] or call us on: Online Customers - 30305757 (by using your city STD code as a prefix) or Toll free numbers 18002099191 / 1800222299, Offline Customers - 18002099292
Level 2: If you do not receive a satisfactory response at Level 1 within 3 working days, you may write to us at [email protected] or call us on 022-42858445 and if you feel you are still unheard, write to our customer service HOD at [email protected] or call us on 022-42858208.
Level 3: If you still have not received a satisfactory response at Level 2 within 3 working days, you may contact our Compliance Officer (Mr. Manoj Agarwal ) at [email protected] or call on 91- (022) 4285 8484.
Level 4: If you have not received a satisfactory response at Level 3 within 7 working days, you may also approach CEO (Mr. Kamlesh Rao) at [email protected] or call on 91- (022) 4285 8301.


