72
20 16 Investec Bank Limited Salient financial information for the six months ended 30 September 2016

2016
2016
Specialist Banking
Investec Bank Limited
Salient �nancial informationfor the six months ended30 September 2016


1Investec Bank Limited salient financial information 2016
Corporate information
Secretary and regIStered offIce
niki van Wyk100 grayston driveSandown Sandton 2196Po Box 785700 Sandton 2146telephone (27 11) 286 7000facsimile (27 11) 286 7966
Internet addreSS
www.investec.com
regIStratIon numBer
reg. no. 1969/004763/06
audItorS
KPmg Inc.ernst & young Inc.
tranSfer SecretarIeS
computershare Investor Services (Pty) Ltd70 marshall StreetJohannesburg 2001Po Box 61051marshalltown 2107telephone (27 11) 370 5000
dIrectorate
Executive directorsrichard J Wainwright (chief executive officer)Stephen Koseff Bernard Kantor glynn r Burger david m Lawrence (deputy chairman)Bradley tapnack nishlan a Samujh
Non-executive directorsfani titi (chairman) Samuel e abrahams Zarina Bm Bassa david friedland Khumo L Shuenyane Peter rS thomas
For queries regarding information in this document
InveStor reLatIonS
telephone (27 11) 286 7070e-mail: [email protected] address:www.investec.com/en_za/#home/investor_relations.html

cross reference tools
2
3
4
5
1
1. Audited informationDenotes information in the risk and remuneration reports that forms part of the group’s audited financial statements
2. Page referencesRefers readers to information elsewhere in this report
3. WebsiteIndicates that additional information is available on our website: www.investec.com
4. SustainabilityRefers readers to further information in our sustainability report available on our website: www.investec.com
5. Reporting standardDenotes our consideration of a reporting standard
2 Investec Bank Limited salient financial information 2016

Contents1 Overview of the period (unaudited)
overview of the Investec group’s and Investec Bank Limited’s organisational structure 5overview of the activities of Investec Bank Limited 6our operational footprint 7Highlights 8
2 Financial statements (reviewed)condensed consolidated interim financial statements 10
3 Risk management and capital information (unaudited)risk management 26directorate 60
4 Annexures (unaudited)annexure 1 dividend announcement 62annexure 2 additional note disclosures 63
3Investec Bank Limited salient financial information 2016

Overview of the period(unaudited)
One

Ov
er
vie
w O
f the
pe
riO
d (u
na
ud
ited
)
ONE
5Investec Bank Limited salient financial information 2016
Overview of the Investec group’s and Investec Bank Limited’s organisational structure
Salient features of the DLC structure• Investec plc and Investec Limited are separate legal entities and listings, but are bound
together by contractual agreements and mechanisms
• Investec operates as if it is a single unified economic enterprise
• Shareholders have common economic and voting interests as if Investec plc and Investec Limited were a single company
• creditors, however, are ring-fenced to either Investec plc or Investec Limited as there are no cross-guarantees between the companies.
our dLc Structure and maIn oPeratIng SuBSIdIarIeS aS at 30 SePtemBer 2016
Southern African operations
Investec plc LSE primary listing
JSE secondary listingSharing agreement
Investec Limited JSE primary listing
NSX secondary listingBSE secondary listing
Investec BankLimited
Investec Asset Management
Holdings (Pty) Ltd
85%*
Investec Securities (Pty) Ltd
Investec Property Group
Holdings (Pty) Ltd
Investec Bank plc
Investec AssetManagement
Limited85%*
Investec Wealth & Investment
Limited
Investec Holdings (Australia)
Limited
Investec Bank
(Mauritius) Limited
Reichmans Holdings (Pty) Ltd
Investec Equity Partners (Pty) Ltd 45%**
Investec Import
Solutions (Pty) Ltd^
All shareholdings in the ordinary share capital of the subsidiaries are 100%, unless otherwise stated.
* 15% held by senior management in the company.** 55% held by third party investors in the company together with senior
management of the business.^ Previously Blue Strata Trading (Pty) Ltd.
Operating structureduring July 2002 Investec group Limited (since renamed Investec Limited) implemented a dual listed companies (dLc) structure and listed its offshore business on the London Stock exchange.
A circular on the establishment of our DLC structure was issued on 20 June 2002 and is available on our website.
In terms of the dLc structure, Investec Limited is the controlling company of our businesses in Southern africa and mauritius and Investec plc is the controlling company of our non-Southern african businesses. Investec Limited is listed on the JSe Limited South africa and Investec plc is listed on the London Stock exchange. Investec Bank Limited (referred to in this report as the bank) is a subsidiary of Investec Limited.
Investec Limited, which houses our Southern African and Mauritius operations, has been listed in South Africa since 1986
Non-Southern African operations
Ov
er
vie
w O
f the
pe
riO
d (u
na
ud
ited
)
ONE
6 Investec Bank Limited salient financial information 2016
Overview of the activities of Investec Bank Limited
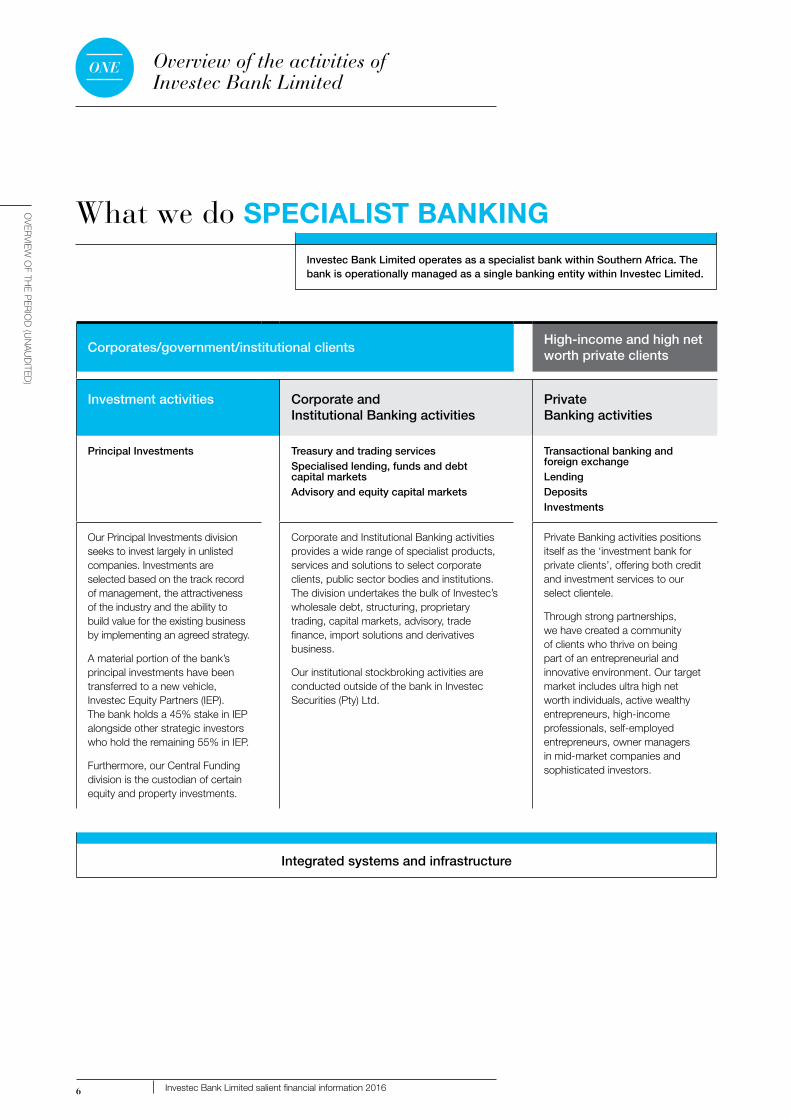
What we do SPECIALIST BANKINGInvestec Bank Limited operates as a specialist bank within Southern Africa. The bank is operationally managed as a single banking entity within Investec Limited.
Corporates/government/institutional clientsHigh-income and high net worth private clients
Investment activities Corporate and Institutional Banking activities
Private Banking activities
Principal Investments Treasury and trading servicesSpecialised lending, funds and debt capital marketsAdvisory and equity capital markets
Transactional banking and foreign exchangeLendingDepositsInvestments
our Principal Investments division seeks to invest largely in unlisted companies. Investments are selected based on the track record of management, the attractiveness of the industry and the ability to build value for the existing business by implementing an agreed strategy.
a material portion of the bank’s principal investments have been transferred to a new vehicle, Investec equity Partners (IeP). the bank holds a 45% stake in IeP alongside other strategic investors who hold the remaining 55% in IeP.
furthermore, our central funding division is the custodian of certain equity and property investments.
corporate and Institutional Banking activities provides a wide range of specialist products, services and solutions to select corporate clients, public sector bodies and institutions. the division undertakes the bulk of Investec’s wholesale debt, structuring, proprietary trading, capital markets, advisory, trade finance, import solutions and derivatives business.
our institutional stockbroking activities are conducted outside of the bank in Investec Securities (Pty) Ltd.
Private Banking activities positions itself as the ‘investment bank for private clients’, offering both credit and investment services to our select clientele.
through strong partnerships, we have created a community of clients who thrive on being part of an entrepreneurial and innovative environment. our target market includes ultra high net worth individuals, active wealthy entrepreneurs, high-income professionals, self-employed entrepreneurs, owner managers in mid-market companies and sophisticated investors.
Integrated systems and infrastructure

Ov
er
vie
w O
f the
pe
riO
d (u
na
ud
ited
)
ONE
7Investec Bank Limited salient financial information 2016
Specialist expertise delivered with dedication and energyBusiness leaderrichard Wainwright
Our operational footprint
Further information on the Specialist Banking management structure is available on our website.
WHERE we operate
Established 1997
One of the leading international banks in Mauritius
Strong brand and positioning
Fifth largest bank
Leading in corporate institutional and private client banking activities
MauritiusSouth Africa
• High-quality specialist banking solution to corporate and private clients with leading positions in selected areas
• Provide high touch personalised service – ability to execute quickly
• Ability to leverage international, cross-border platforms
• Well positioned to capture opportunities between the developed and the emerging world – internationally mobile
• Balanced business model with good business depth and breadth.
the specialist teams are well positioned to provide services for both personal and business needs right across Private Banking, corporate and Institutional Banking and Investment activities.
OUR value proposition

Financial statements(reviewed)
Two
Ov
er
vie
w O
f the
pe
riO
d (u
na
ud
ited
)
ONE
8 Investec Bank Limited salient financial information 2016
Highlights
Investec Bank Limited, a subsidiary of Investec Limited, posted headline earnings attributable to ordinary shareholders of r1 486 million (2015: r1 807 million). operating fundamentals were supported by sound levels of corporate and private client activity. operating income excluding investment income increased by 19.8%. the balance sheet remains sound with a capital adequacy ratio of 14.9% (31 march 2016: 14.6%).
30 Sept2016
30 Sept2015 % change
31 March2016
total operating income before impairment losses on loans and advances (r’million) 5 204 5 199 0.1% 10 388
operating costs (r’million) 2 894 2 811 3.0% 5 537
Profit before taxation (r’million) 1 962 2 088 (6.0%) 4 295
Headline earnings attributable to ordinary shareholders (r’million) 1 486 1 807 (17.8%) 3 449
cost to income ratio 55.6% 54.1% 53.3%
total capital resources (including subordinated liabilities) (r’million) 45 553 41 023 11.0% 42 597
total shareholders equity (r’million) 33 146 30 615 8.3% 31 865
total assets (r’million) 411 408 365 637 12.5% 405 629
net core loans and advances (r’million) 222 775 195 842 13.8% 215 239
customer accounts (deposits) (r’million) 290 903 250 099 16.3% 279 736
cash and near cash balances (r’million) 123 878 100 042 23.8% 124 907
capital adequacy ratio 14.9% 14.5% 14.6%
tier 1 ratio 10.8% 10.8% 11.0%
common equity tier 1 ratio 10.5% 10.4% 10.6%
Leverage ratio 7.6% 7.9% 7.3%
defaults (net of impairments) as a % of net core loans and advances 1.25% 1.13% 1.06%
annualised credit loss ratio (i.e. income statement impairment charge as a % of average core loans and advances) 0.30% 0.28% 0.26%
total gearing ratio (i.e. total assets excluding intergroup loans to equity) 12.2x 11.9x 12.6x
Loans and advances to customers: customer accounts (deposits) 73.7% 75.4% 74.1%
unless the context indicates otherwise, all comparatives referred to in the financial review relate to the six months ended 30 September 2015.
Salient operational features for the period under review include:
total operating income before impairment losses on loans and advances remained in line with the prior year amounting to r5 204 million (2015: r5 199 million). the components of operating income are analysed further below:
• net interest income increased 22.8% to r3 759 million (2015: r3 061 million) driven by strong book growth in the 2016 financial year as well as sound levels of lending activity in the current period.
• net fee and commission income increased 1.7% to r894 million (2015: r879 million) as a result of a sound performance from the corporate lending and treasury teams as well as the acquisition of Blue Strata (rebranded Investec Import Solutions) in the prior period.
• Investment income decreased 83.0% to r170 million (2015: r1,002 million) impacted by a change in accounting treatment from fair value to equity accounting (refer to additional information).
• Share of post taxation operating profit of associates of r172 million in the current period largely reflects earnings in relation to the group’s investment in Investec equity Partners.
• total trading income decreased 21.8% to r208 million (2015: r266 million) largely due to foreign currency translation impacts, while corporate customer flow trading income remained in line with the prior period.
Impairments on loans and advances increased from r287 million to r322 million, with the credit loss ratio on average core loans and advances amounting to 0.30% (31 march 2016: 0.26%), remaining at the lower end of its long term average trend. the percentage of default loans (net of impairments but before taking collateral into account) to core loans and advances amounted to 1.25% (31 march 2016: 1.06%). the ratio of collateral to default loans (net of impairments) remains satisfactory at 1.66 times (31 march 2016: 1.61 times).
the ratio of total operating costs to total operating income amounted to 55.6% (2015: 54.1%). total operating expenses at r2 894 million were 3.0% higher than the prior year (2015: r2 811 million) reflecting higher headcount and It infrastructure costs across the business to support increased activity and growth initiatives.
as a result of the foregoing factors profit before taxation and acquired intangibles decreased by 5.4% to r1 988 million (2015: r2 101 million).
Additional Information – Investec Equity Partners
a new investment vehicle, Investec equity Partners (IeP), was created on 11 January 2016 in which Investec holds a 45% stake alongside other strategic investors who hold the remaining 55%. Investec Principal Investments transferred certain portfolio investments to the value of r5.1 billion to IeP. In exchange Investec received r0.7 billion in cash and 45% of the shares in IeP (r5.1 billion), reflected as an associate on the balance sheet. Since the date of the transaction Investec has applied the equity accounting method to account for its investment in the new vehicle as opposed to the fair value accounting method previously applied to the underlying investments held.

Financial statements(reviewed)
Two

FINA
NC
IAL s
tAtem
eN
ts (R
ev
Iew
ed
)
TWO
10 Investec Bank Limited salient financial information 2016
Directors’ responsibility statement
Approval of the condensed consolidated interim financial statements
the company’s directors are responsible for the preparation and fair presentation of the condensed consolidated interim financial statements, comprising the consolidated balance sheet at 30 September 2016, and the consolidated income statement, consolidated statement of comprehensive income and the condensed consolidated statements of changes in equity and cash flows for the six months then ended, and selected explanatory notes, in accordance with the International financial reporting Standard (IaS ) 34 Interim financial reporting, the SaIca financial reporting guide as issued by the accounting Practices committee and financial Pronouncements as issued by financial reporting Standards council and the requirements of the companies act of South africa.
the directors’ responsibility includes: designing, implementing and maintaining internal control relevant to the preparation and fair presentation of these financial statements that are free from material misstatement, whether due to fraud or error; selecting and applying appropriate accounting policies; and making accounting estimates that are reasonable in the circumstances.
the directors’ responsibility also includes maintaining adequate accounting records and an effective system of risk management.
the directors have made an assessment of the group and company’s ability to continue as a going concern and there is no reason to believe the businesses will not be going concerns in the year ahead.
the condensed consolidated interim financial statements were approved by the board of directors on 16 november 2016 and are signed on its behalf by
Fani Titi Stephen Koseffchairman chief executive officer

FINA
NC
IAL s
tAtem
eN
ts (R
ev
Iew
ed
)
TWO
11Investec Bank Limited salient financial information 2016
Independent auditors’ review report on the condensed consolidated interim financial statements
to tHe SHareHoLderS of InveStec BanK LImIted
We have reviewed the condensed consolidated interim financial statements of Investec Bank Limited, contained in the accompanying interim report, which comprise the consolidated balance sheet at 30 September 2016, the consolidated income statement, consolidated statement of comprehensive income and the condensed consolidated statements of changes in equity and cash flows for the six months then ended, and selected explanatory notes, as set out on pages 12 to 24 .
dIrectorS’ reSPonSIBILIty for tHe condenSed conSoLIdated InterIm fInancIaL StatementS
the directors are responsible for the preparation and presentation of these interim financial statements in accordance with International financial reporting Standard, (IaS) 34 Interim financial reporting, the SaIca financial reporting guides as issued by the accounting Practices committee and financial Pronouncements as issued by financial reporting Standards council and the requirements of the companies act of South africa, and for such internal control as the directors determine is necessary to enable the preparation of interim financial statements that are free from material misstatement, whether due to fraud or error.
audItorS’ reSPonSIBILIty
our responsibility is to express a conclusion on these interim financial statements. We conducted our review in accordance with International Standard on review engagements (ISre) 2410, review of Interim financial Information Performed by the Independent auditor of the entity. ISre 2410 requires us to conclude whether anything has come to our attention that causes us to believe that the interim financial statements are not prepared in all material respects in accordance with the applicable financial reporting framework. this standard also requires us to comply with relevant ethical requirements.
a review of interim financial statements in accordance with ISre 2410 is a limited assurance engagement. We perform procedures, primarily consisting of making inquiries of management and others within the entity, as appropriate, and applying analytical procedures, and evaluate the evidence obtained.
the procedures performed in a review are substantially less than and differ in nature from those performed in an audit conducted in accordance with International Standards on auditing. accordingly, we do not express an audit opinion on these financial statements.
concLuSIon
Based on our review, nothing has come to our attention that causes us to believe that the accompanying condensed consolidated interim financial statements of Investec Bank Limited for the six months ended 30 September 2016 are not prepared, in all material respects, in accordance with International financial reporting Standard, (IaS) 34 Interim financial reporting, the SaIca financial reporting guides as issued by the accounting Practices committee and financial Pronouncements as issued by financial reporting Standards council and the requirements of the companies act of South africa.
Ernst & Young Inc. KPMG Inc.registered auditor registered auditor
Per farouk mohideen Per Peter macdonaldchartered accountant (Sa) chartered accountant (Sa)registered auditor registered auditordirector director
16 november 2016 16 november 2016
Ernst & Young Inc. KPMG Inc.102 rivonia road 85 empire roadSandown Parktown2196 2193

FINA
NC
IAL s
tAtem
eN
ts (R
ev
Iew
ed
)
TWO
12 Investec Bank Limited salient financial information 2016
Consolidated income statement
R’million
Six months to 30 Sept
2016
Six months to 30 Sept
2015
Year to31 March
2016
Interest income 14 973 10 908 23 515
Interest expense (11 214) (7 847) (16 803)
Net interest income 3 759 3 061 6 712
fee and commission income 1 023 950 1 945
fee and commission expense (129) (71) (207)
Investment income 170 1 002 1 356
Share of post taxation operating profit/(loss) of associates 172 (11)* (11)*
trading income arising from
– customer flow 167 166 293
– balance sheet management and other trading liabilities 41 100 298
other operating income 1 2* 2*
Total operating income before impairment losses on loans and advances 5 204 5 199 10 388
Impairment losses on loans and advances (322) (287) (517)
Operating income 4 882 4 912 9 871
operating costs (2 894) (2 811) (5 537)
Operating profit before acquired intangibles 1 988 2 101 4 334
amortisation of acquired intangibles (26) (13) (39)
Profit before taxation 1 962 2 088 4 295
taxation on operating profit before acquired intangibles (358) (307) (831)
taxation on acquired intangibles 7 4 11
Profit after taxation 1 611 1 785 3 475
* Share of post taxation operating profit/(loss) of associates has been shown separately from other operating income in the current period.

FINA
NC
IAL s
tAtem
eN
ts (R
ev
Iew
ed
)
TWO
13Investec Bank Limited salient financial information 2016
Consolidated statement of comprehensive income
R’million
Six months to 30 Sept
2016
Six months to 30 Sept
2015
Year to31 March
2016
Profit after taxation 1 611 1 785 3 475
Other comprehensive income:
Items that may be reclassified to the income statement
fair value movements on cash flow hedges taken directly to other comprehensive income* 373 (343) (699)
fair value movements on available-for-sale assets taken directly to other comprehensive income* 661 (348) (717)
gain on realisation of available-for-sale assets recycled through the income statement* (60) (13) (13)
foreign currency adjustments on translating foreign operations (339) 694 1 040
Total comprehensive income 2 246 1 775 3 086
total comprehensive income attributable to ordinary shareholders 2 181 1 716 2 966
total comprehensive income attributable to perpetual preference shareholders 65 59 120
Total comprehensive income 2 246 1 775 3 086
* Net of taxation of (R167.3 million) [Six months to 30 September 2015: R312.2 million; year to 31 March 2016: R515.3 million].

FINA
NC
IAL s
tAtem
eN
ts (R
ev
Iew
ed
)
TWO
14 Investec Bank Limited salient financial information 2016
Consolidated balance sheet
AtR’million
30 Sept2016
31 March2016
30 Sept2015
Assets
cash and balances at central banks 8 101 7 801 6 698
Loans and advances to banks 32 571 26 779 24 913
non-sovereign and non-bank cash placements 10 218 9 858 11 435
reverse repurchase agreements and cash collateral on securities borrowed 31 068 38 912 23 267
Sovereign debt securities 47 800 41 325 34 850
Bank debt securities 8 294 13 968 15 829
other debt securities 11 396 12 761 14 024
derivative financial instruments 11 821 15 843 14 491
Securities arising from trading activities 824 992 3 354
Investment portfolio 7 073 6 360 10 625
Loans and advances to customers 214 452 207 272 188 532
own originated loans and advances to customers securitised 8 323 7 967 7 310
other loans and advances 336 367 403
other securitised assets 106 115 503
Interests in associated undertakings 5 382 5 145 53
deferred taxation assets 118 116 98
other assets 4 351 3 656 4 879
Property and equipment 236 236 236
Investment properties 1 1 1
goodwill 171 171 172
Intangible assets 521 524 557
Loans to group companies 7 748 5 460 2 806
non-current assets classified as held for sale 497 – 601
411 408 405 629 365 637
Liabilities
deposits by banks 32 934 37 242 32 539
derivative financial instruments 11 897 13 424 13 088
other trading liabilities 1 529 1 405 1 949
repurchase agreements and cash collateral on securities lent 16 721 16 916 14 368
customer accounts (deposits) 290 903 279 736 250 099
debt securities in issue 5 418 7 665 6 452
Liabilities arising on securitisation of own originated loans and advances 728 809 957
current taxation liabilities 692 671 746
deferred taxation liabilities 159 122 221
other liabilities 4 874 5 042 4 195
365 855 363 032 324 614
Subordinated liabilities 12 407 10 732 10 408
378 262 373 764 335 022
Equity
ordinary share capital 32 32 32
Share premium 14 885 14 885 14 885
other reserves 1 128 566 848
retained income 17 101 16 382 14 850
Total equity 33 146 31 865 30 615
Total liabilities and equity 411 408 405 629 365 637

FINA
NC
IAL s
tAtem
eN
ts (R
ev
Iew
ed
)
TWO
15Investec Bank Limited salient financial information 2016
Condensed consolidated statement of changes in equity
R’million
Six months to30 Sept
2016
Six months to30 Sept
2015
Year to 31 March
2016
Balance at the beginning of the period 31 865 28 899 28 899
total comprehensive income 2 246 1 775 3 086
dividends paid to ordinary shareholders (900) – –
dividends paid to perpetual preference shareholders (65) (59) (120)
Balance at the end of the period 33 146 30 615 31 865
Condensed consolidated cash flow statement
R’million
Six months to30 Sept
2016
Six months to30 Sept
2015
Year to 31 March
2016
net cash inflow from operating activities 1 896 32 2 469
net cash outflow from investing activities (102) (418) (499)
net cash inflow/(outflow) from financing activities 717 (100) (43)
effects of exchange rate changes on cash and cash equivalents (501) 482 773
net increase/(decrease) in cash and cash equivalents 2 010 (4) 2 700
cash and cash equivalents at the beginning of the year 26 483 23 783 23 783
Cash and cash equivalents at the end of the year 28 493 23 779 26 483
Cash and cash equivalents is defined as including: cash and balances at central banks, on demand loans and advances to banks and non-sovereign and non-bank cash placements (all of which have a maturity profile of less than three months).

FINA
NC
IAL s
tAtem
eN
ts (R
ev
Iew
ed
)
TWO
16 Investec Bank Limited salient financial information 2016
Notes to the interim financial statements
Accounting policies and disclosuresthe condensed consolidated interim financial statements are prepared in accordance with International financial reporting Standard, (IaS) 34 Interim financial reporting, the SaIca financial reporting guides as issued by the accounting Practices committee and financial Pronouncements as issued by financial reporting Standards council and the requirements of the companies act of South africa.
the accounting policies applied in the preparation of the results for the six months ended 30 September 2016 are consistent with those adopted in the financial statements for the year ended 31 march 2016.
the financial results have been prepared under the supervision of nishlan Samujh, the group financial officer.
caLcuLatIon of HeadLIne earnIngS
R’million
Six months to 30 Sept
2016
Six months to 30 Sept
2015
Year to31 March
2016
Profit after taxation 1 611 1 785 3 475
Preference dividends paid (65) (59) (120)
Earnings attributable to ordinary shareholders 1 546 1 726 3 355
Headline adjustments, net of taxation* (60) 81 94
gain on realisation of available-for-sale assets recycled through the income statement (60) (13) (13)
Write down of non-current assets classified as held-for-sale – 94 107
Headline earnings attributable to ordinary shareholders 1 486 1 807 3 449
* Net of taxation of R23.4 million [Six months to 30 September 2015: (R31.5 million); year to 31 March 2016: (R19.3 million)].

FINA
NC
IAL s
tAtem
eN
ts (R
ev
Iew
ed
)
TWO
(continued)
17Investec Bank Limited salient financial information 2016
Notes to the interim financial statements
addItIonaL Income Statement note dIScLoSureS
Net interest income2016 2015
For the six months to 30 SeptemberR’million notes
Balancesheetvalue
Interestincome
Balancesheetvalue
Interest income
cash, near cash and bank debt and sovereign debt securities 1 138 052 3 828 116 992 2 714
core loans and advances 2 222 775 10 534 195 842 7 861
Private client 148 112 7 045 128 648 5 063
corporate, institutional and other clients 74 663 3 489 67 194 2 798
other debt securities and other loans and advances 11 732 333 14 427 207
other interest-earning assets 3 7 854 278 3 309 126
Total interest-earning assets 380 413 14 973 330 570 10 908
2016 2015
For the six months to 30 SeptemberR’million notes
Balancesheetvalue
Interestexpense
Balancesheetvalue
Interest expense
deposits by banks and other debt-related securities 4 55 073 (777) 53 359 (657)
customer accounts (deposits) 290 903 (9 973) 250 099 (6 789)
other interest-bearing liabilities 5 728 – 957 –
Subordinated liabilities 12 407 (464) 10 408 (401)
Total interest-bearing liabilities 359 111 (11 214) 314 823 (7 847)
Net interest income 3 759 3 061
Notes:1. Comprises (as per the balance sheet) cash and balances at central banks; loans and advances to banks; non-sovereign and non-bank cash placements;
reverse repurchase agreements and collateral on securities borrowed; sovereign debt securities; bank debt securities.2. Comprises (as per the balance sheet) loans and advances to customers; own originated loans and advances to customers securitised.3. Comprises (as per the balance sheet) other securitised assets; loans to group companies.4. Comprises (as per the balance sheet) deposits by banks; debt securities in issue; repurchase agreements and cash collateral on securities lent.
5. Comprises (as per the balance sheet) liabilities arising on securitisation of own originated loans and advances.

FINA
NC
IAL s
tAtem
eN
ts (R
ev
Iew
ed
)
TWO
(continued)
18 Investec Bank Limited salient financial information 2016
Notes to the interim financial statements
Net fee and commission incomeFor the six months to 30 SeptemberR’million 2016 2015
corporate and institutional transactional and advisory services 701 619
Private client transactional fees 322 331
fee and commission income 1 023 950
fee and commission expense (129) (71)
Net fee and commission income 894 879
annuity fees (net of fees payable) 504 518
deal fees 390 361
Investment income
For the six months to 30 SeptemberR’million
Investmentportfolio
(listed andunlistedequities)*
Debtsecurities
(sovereign,bank and
other)Investmentproperties
Otherasset
categories Total
2016
realised 135 92 – 22 249
unrealised (216) – – (38) (254)
dividend income 199 – – – 199
funding cost and other net related costs (21) – – (3) (24)
97 92 – (19) 170
2015
realised 422 63 60 14 559
unrealised 414 – (60) 1 355
dividend income 245 – – – 245
funding cost and other net related costs (157) – – – (157)
924 63 – 15 1 002
* Including embedded derivatives (warrants and profit shares).

FINA
NC
IAL s
tAtem
eN
ts (R
ev
Iew
ed
)
TWO
19Investec Bank Limited salient financial information 2016
Additional IAS 34 disclosures
Analysis of assets and liabilities by measurement basis
At 30 September 2016R’million
Total instruments at fair value
Total instruments
at amortised cost
Non-financial instruments Total
Assets
cash and balances at central banks – 8 101 – 8 101
Loans and advances to banks – 32 571 – 32 571
non-sovereign and non-bank cash placements 38 10 180 – 10 218
reverse repurchase agreements and cash collateral on securities borrowed 15 931 15 137 – 31 068
Sovereign debt securities 43 953 3 847 – 47 800
Bank debt securities 4 998 3 296 – 8 294
other debt securities 9 436 1 960 – 11 396
derivative financial instruments 11 821 – – 11 821
Securities arising from trading activities 824 – – 824
Investment portfolio 7 073 – – 7 073
Loans and advances to customers 14 345 200 107 – 214 452
own originated loans and advances to customers securitised – 8 323 – 8 323
other loans and advances – 336 – 336
other securitised assets – 106 – 106
Interests in associated undertakings – – 5 382 5 382
deferred taxation assets – – 118 118
other assets 462 2 521 1 368 4 351
Property and equipment – – 236 236
Investment properties – – 1 1
goodwill – – 171 171
Intangible assets – – 521 521
Loans to group companies 30 7 718 – 7 748
non-current assets classified as held for sale – – 497 497
108 911 294 203 8 294 411 408
Liabilities
deposits by banks – 32 934 – 32 934
derivative financial instruments 11 897 – – 11 897
other trading liabilities 1 529 – – 1 529
repurchase agreements and cash collateral on securities lent 78 16 643 – 16 721
customer accounts (deposits) 9 160 281 743 – 290 903
debt securities in issue 3 941 1 477 – 5 418
Liabilities arising on securitisation of own originated loans and advances – 728 – 728
current taxation liabilities – – 692 692
deferred taxation liabilities – – 159 159
other liabilities 731 1 325 2 818 4 874
Subordinated liabilities – 12 407 – 12 407
27 336 347 257 3 669 378 262

FINA
NC
IAL s
tAtem
eN
ts (R
ev
Iew
ed
)
TWO
(continued)
20 Investec Bank Limited salient financial information 2016
Additional IAS 34 disclosures
Financial instruments carried at fair valuethe table below analyses recurring fair value measurements for financial assets and financial liabilities. these fair value measurements are categorised into different levels in the fair value hierarchy based on the inputs to the valuation technique used. the different levels are identified as follows:
Level 1 – quoted (unadjusted) prices in active markets for identical assets or liabilities
Level 2 – inputs other than quoted prices included within level 1 that are observable for the asset or liability, either directly (i.e. as prices) or indirectly (i.e. derived from prices)
Level 3 – inputs for the asset or liability that are not based on observable market data (unobservable inputs)
Fair value category
At 30 September 2016R’million
Total instruments at
fair value Level 1 Level 2 Level 3
Assets
non-sovereign and non-bank cash placements 38 – 38 –
reverse repurchase agreements and cash collateral on securities borrowed 15 931 – 15 931 –
Sovereign debt securities 43 953 43 953 – –
Bank debt securities 4 998 2 833 2 165 –
other debt securities 9 436 9 436 – –
derivative financial instruments 11 821 – 11 811 10
Securities arising from trading activities 824 824 – –
Investment portfolio 7 073 3 646 187 3 240
Loans and advances to customers 14 345 – 14 345 –
Loans to group companies 30 – 30 –
other assets 462 462 – –
108 911 61 154 44 507 3 250
Liabilities
derivative financial instruments 11 897 – 11 897 –
other trading liabilities 1 529 430 1 099 –
repurchase agreements and cash collateral on securities lent 78 – 78 –
customer accounts (deposits) 9 160 – 9 160 –
debt securities in issue 3 941 – 3 941 –
other liabilities 731 – 731 –
27 336 430 26 906 –
Net financial assets at fair value 81 575 60 724 17 601 3 250
tranSferS BetWeen LeveL 1 and LeveL 2
there were no transfers between level 1 and level 2 in the current year.

FINA
NC
IAL s
tAtem
eN
ts (R
ev
Iew
ed
)
TWO
(continued)
21Investec Bank Limited salient financial information 2016
Additional IAS 34 disclosures
LEvEL 3 InSTruMEnTS
the following table shows a reconciliation of the opening balances to the closing balances for level 3 financial instruments. all instruments are at fair value through profit or loss.
R’million30 Sept
2016
Balance at 1 april 2016 2 580
total losses included in the income statement (27)
Purchases 874
Sales (127)
transfers into level 3 4
foreign exchange adjustments (54)
Balance at 30 September 2016 3 250
for the period ended 30 September 2016, r4.4 million has been transferred into level 3 from level 2 as a result of the inputs to the valuation methods becoming unobservable in the market.
the following table quantifies the gains or (losses) included in the income statement recognised on level 3 financial instruments:
For the six months to 30 September 2016
R’million Total Realised Unrealised
Total gains or (losses) included in the income statement for the year
net interest expense (6) (6) –
Investment income 10 39 (29)
trading income arising from customer flow (31) (27) (4)
(27) 6 (33)

FINA
NC
IAL s
tAtem
eN
ts (R
ev
Iew
ed
)
TWO
(continued)
22 Investec Bank Limited salient financial information 2016
Additional IAS 34 disclosures
SenSItIvIty of faIr vaLueS to reaSonaBLy PoSSIBLe aLternatIve aSSumPtIonS By LeveL 3 InStrument tyPe
the fair value of financial instruments in level 3 are measured using valuation techniques that incorporate assumptions that are not evidenced by prices from observable market data. the following table shows the sensitivity of these fair values to reasonably possible alternative assumptions, determined at a transactional level:
reflected in the income statement
At 30 September 2016
Level 3balance
sheet value valuation
method
Significantunobservable
inputchanged
range whichunobservable
inputhas beenchanged
Favourablechangesr’million
unfavourablechangesr’million
Assets
Derivative financial instruments 10 1 (1)
Price multiple net asset value (10%) – 10% 1 (1)
Investment portfolio 3 240 705 (457)
Price earnings
change in Pe multiple * 373 (80)
other^ various ** 332 (377)
Total 3 250 706 (458)
* The price-earnings multiple has been stressed on an investment-by-investment basis in order to obtain favourable and unfavourable valuations.** These valuation sensitivities have been determined individually using varying scenario-based techniques to obtain the favourable and unfavourable valuations.^ Other – The valuation sensitivity for the private equity and embedded derivatives (profit share portfolios) has been assessed by adjusting various inputs such
as expected cash flows, discount rates and earnings multiples. It is deemed appropriate to reflect the outcome on a portfolio basis for the purposes of this analysis as the sensitivity of the investments cannot be determined through the adjustment of a single input.
In determining the value of level 3 financial instruments, the following is a principal input that can require judgement:
PrIce-earnIngS muLtIPLe
the price-to-earnings ratio is an equity valuation multiple. It is a key driver in the valuation of unlisted investments.

FINA
NC
IAL s
tAtem
eN
ts (R
ev
Iew
ed
)
TWO
(continued)
23Investec Bank Limited salient financial information 2016
Additional IAS 34 disclosures
meaSurement of fInancIaL aSSetS and LIaBILItIeS at LeveL 2
the table below sets out information about the valuation techniques used at the end of the reporting period in measuring financial instruments categorised as level 2 in the fair value hierarchy:
valuation basis/techniques Main assumptions
Assets
non-sovereign and non-bank cash placements discounted cash flow model yield curve
reverse repurchase agreements and cash collateral on securities borrowed
discounted cash flow model Black-Scholes
yield curve volatilities
Bank debt securities discounted cash flow model yield curve
derivative financial instruments discounted cash flow model Black-Scholes
yield curve volatilities
Investment portfolio adjusted quoted price Liquidity adjustment
Loans and advances to customers discounted cash flow model yield curve
Loans to group companies discounted cash flow model yield curve
Liabilities
derivative financial instruments discounted cash flow model Black-Scholes
yield curve volatilities
other trading liabilities discounted cash flow model yield curve
repurchase agreements and cash collateral on securities lent discounted cash flow model yield curve
customer accounts (deposits) discounted cash flow model yield curve
debt securities in issue discounted cash flow model yield curve
other liabilities discounted cash flow model yield curve

FINA
NC
IAL s
tAtem
eN
ts (R
ev
Iew
ed
)
TWO
(continued)
24 Investec Bank Limited salient financial information 2016
Additional IAS34 disclosures
Fair value of financial assets and liabilities at amortised costAt 30 September 2016 R’million
Carryingamount Fair value
Assets
cash and balances at central banks 8 101 8 101
Loans and advances to banks 32 571 32 571
non-sovereign and non-bank cash placements 10 180 10 180
reverse repurchase agreements and cash collateral on securities borrowed 15 137 15 137
Sovereign debt securities 3 847 3 897
Bank debt securities 3 296 4 413
other debt securities 1 960 1 974
Loans and advances to customers 200 107 200 267
own originated loans and advances to customers securitised 8 323 8 323
other loans and advances 336 336
other securitised assets 106 106
other assets 2 521 2 521
Loans to group companies 7 718 7 718
294 203 295 544
Liabilities
deposits by banks 32 934 33 314
repurchase agreements and cash collateral on securities lent 16 643 16 638
customer accounts (deposits) 281 743 281 760
debt securities in issue 1 477 1 545
Liabilities arising on securitisation of own originated loans and advances 728 728
other liabilities 1 325 1 325
Subordinated liabilities 12 407 13 498
347 257 348 808

ThreeRisk management
and capital information (unaudited)

RIS
K M
AN
AG
EM
EN
T AN
D C
Ap
ITAl IN
foR
MATIo
N (u
NA
uD
ITED
)
THREE
26 Investec Bank Limited salient financial information 2016
Risk management
the following risk management and capital section will provide detail on the quantitative risk disclosures required on a semi-annual basis. for any additional qualitative disclosures, definitions and descriptions, please refer to our annual financial statements for the year ended 31 march 2016.
Investec Bank Limited also publishes additional Pillar III and other risk information. This information is contained in a separate Pillar III report which can be found on our website.
PHILoSoPHy and aPProacH to rISK management
our comprehensive risk management process involves identifying, quantifying, managing and mitigating the risks associated with each of our businesses.
risk awareness, control and compliance are embedded in all our day-to-day activities. a strong risk and capital management culture is embedded into our values.
We monitor and control risk exposure through independent credit, market, liquidity, operational, legal risk, internal audit and compliance teams. this approach is core to assuming a tolerable risk and reward profile, helping us to pursue controlled growth across our business.
group risk management operates within an integrated geographical and divisional structure, in line with our management approach, ensuring that the appropriate processes are used to address all risks across the group.
risk management units are locally responsive yet globally aware. this helps to ensure that all initiatives and businesses operate within our defined risk parameters and objectives, continually seeking new ways to enhance techniques.
We believe that the risk management systems and processes we have in place are adequate to support our strategy and allow the group to operate within its risk appetite tolerance.
credIt and counterParty rISK management
credit and counterparty risk is defined as the risk arising from an obligor’s (typically a client or counterparty) failure to meet the terms of any agreement. credit and counterparty risk arises when funds
are extended, committed, invested, or otherwise exposed through contractual agreements, whether reflected on- or off-balance sheet.
credit and counterparty risk arises primarily from three types of transactions:
• Lending transactions through loans and advances to clients and counterparties creates the risk that an obligor will be unable or unwilling to repay capital and/or interest on loans and advances granted to them. this category includes bank placements, where we have placed funds with other financial institutions
• Issuer risk on financial instruments where payments due from the issuer of a financial instrument will not be received
• trading transactions, giving rise to settlement and replacement risk (collectively counterparty risk):
– Settlement risk is the risk that the settlement of a transaction does not take place as expected. our definition of a settlement debtor is a short-term receivable (i.e. less than five days) which is excluded from credit and counterparty risk due to market guaranteed settlement mechanisms
– replacement risk is the financial cost of having to enter into a replacement contract with an alternative market counterparty, following default by the original counterparty.
country risk refers to the risk of lending to a counterparty operating in a particular country or the risk inherent in sovereign exposure; i.e. the risk of exposure to loss caused by events in other countries. country risk covers all forms of lending or investment activity whether to/with individuals, corporates, banks or governments. this can include geopolitical risks, transfer and convertibility risks, and the impact on the borrower’s credit profile due to local economic and political conditions.
to mitigate country risk, there is a preference for primary exposure in the bank’s main operating geographies. the bank will accept exposures where we have a branch or local banking subsidiary, and tolerate exposures to other countries where we are facilitating a transaction for a client who requires facilities in a foreign geography and where we have developed a local understanding and capability.
Investec's credit risk appetite with regard to country risk is characterised by the following principles:
• Preference is to have exposure only to politically stable jurisdictions that we understand and have preferably operated in before
• there is no specific appetite for exposures outside of the group’s pre-existing core geographies or product markets
• the legal environment should be tested, have legal precedent in line with oecd standards and have good corporate governance
• In certain cases, country risk can be mitigated by taking out political risk insurance with suitable counterparties, where deemed necessary and where considered economic
While we do not have a separate country risk committee, the local and global credit committees as well as investment committees and errf will consider, analyse and assess the appropriate limits to be recorded when required, to assume exposure to foreign jurisdictions. the local group credit committee has the authority to approve country limits within mandate. the global credit committee, global investment committee or errf is responsible for approving country limits that are not within the mandate of local group credit committees.
the relevant credit committees within Investec will also consider wrong-way risk at the time of granting credit limits to each counterparty. In the banking book environment, wrong-way risk occurs where the value of collateral to secure a transaction, or guarantor, is positively correlated with the probability of default of the borrower or counterparty. for counterparty credit risk resulting from transactions in traded products (such as otc derivatives), wrong-way risk is defined as exposure to a counterparty that is adversely correlated with the credit quality of that counterparty. It arises when default risk and credit exposure increase together.
credit and counterparty risk may also arise in other ways and it is the role of the global risk management functions and the various independent credit committees to identify risks falling outside these definitions.
the tables that follow provide an analysis of the bank’s credit and counterparty exposures.

RIS
K M
AN
AG
EM
EN
T AN
D C
Ap
ITAl IN
foR
MATIo
N (u
NA
uD
ITED
)
THREE
(continued)
27Investec Bank Limited salient financial information 2016
Risk management
an anaLySIS of groSS credIt and counterParty exPoSureS
credit and counterparty exposures increased by 1.6% to r452.5 billion largely due to growth in loans and advances to customers. cash and near cash balances amount to r123.9 billion and are largely reflected in the following line items in the table below: cash and balances at central banks, loans and advances to banks, non-sovereign and non-bank cash placements and sovereign debt securities.
R’million30 Sept
201631 March
2016 % change Average*
cash and balances at central banks 8 101 7 801 3.8% 7 950
Loans and advances to banks 32 571 26 779 21.6% 29 674
non-sovereign and non-bank cash placements 10 218 9 858 3.7% 10 038
reverse repurchase agreements and cash collateral on securities borrowed 31 068 38 912 (20.2%) 34 990
Sovereign debt securities 47 800 41 325 15.7% 44 563
Bank debt securities 8 294 13 968 (40.6%) 11 131
other debt securities 11 396 12 761 (10.7%) 12 079
derivative financial instruments 7 070 10 756 (34.3%) 8 913
Securities arising from trading activities 677 539 25.6% 608
Loans and advances to customers (gross) 215 610 208 182 3.6% 211 896
own originated loans and advances to customers securitised (gross) 8 329 7 973 4.5% 8 151
other loans and advances (gross) 365 398 (8.3%) 382
other assets 2 592 2 169 19.5% 2 381
Total on-balance sheet exposures 384 091 381 421 0.7% 382 756
guarantees^ 16 943 17 767 (4.6%) 17 355
contingent liabilities, committed facilities and other 51 465 46 159 11.5% 48 812
Total off-balance sheet exposures 68 408 63 926 6.7% 66 167
Total gross credit and counterparty exposures pre-collateralor other credit enhancements 452 499 445 347 1.6% 448 923
* Where the average is based on a straight-line average for the period 1 April 2016 to 30 September 2016.^ Excludes guarantees provided to clients which are backed/secured by cash on deposit with the bank.

RIS
K M
AN
AG
EM
EN
T AN
D C
Ap
ITAl IN
foR
MATIo
N (u
NA
uD
ITED
)
THREE
(continued)
28 Investec Bank Limited salient financial information 2016
Risk management
A further analysis of our on-balance sheet credit and counterparty exposures
the table below indicates in which class of asset (on the face of the consolidated balance sheet) our on-balance sheet credit and counterparty exposures are reflected. not all assets included in the balance sheet bear credit and counterparty risk.
R’million
Total credit and
counterparty exposure
Assets that we deem
to have no legal credit exposure
Note refer-ence
Total balance
sheet
At 30 September 2016
cash and balances at central banks 8 101 – 8 101
Loans and advances to banks 32 571 – 32 571
non-sovereign and non-bank cash placements 10 218 – 10 218
reverse repurchase agreements and cash collateral on securities borrowed 31 068 – 31 068
Sovereign debt securities 47 800 – 47 800
Bank debt securities 8 294 – 8 294
other debt securities 11 396 – 11 396
derivative financial instruments 7 070 4 751 11 821
Securities arising from trading activities 677 147 824
Investment portfolio – 7 073 1 7 073
Loans and advances to customers 215 610 (1 158) 2 214 452
own originated loans and advances to customers securitised 8 329 (6) 2 8 323
other loans and advances 365 (29) 2 336
other securitised assets – 106 3 106
Interest in associated undertakings – 5 382 1 5 382
deferred taxation assets – 118 118
other assets 2 592 1 759 4 4 351
Property and equipment – 236 236
Investment properties – 1 1
goodwill – 171 171
Intangible assets – 521 521
Loans to group companies – 7 748 7 748
non-current assets classified as held for sale – 497 497
Total on-balance sheet exposures 384 091 27 317 411 408
1. Largely relates to exposures that are classified as investment risk in the banking book. 2. Largely relates to impairments.3. Largely cash in the securitised vehicles.4. Other assets include settlement debtors where we deem to have no credit risk exposure as they are settled on a delivery against payment basis.

RIS
K M
AN
AG
EM
EN
T AN
D C
Ap
ITAl IN
foR
MATIo
N (u
NA
uD
ITED
)
THREE
(continued)
29Investec Bank Limited salient financial information 2016
Risk management
A further analysis of our on-balance sheet credit and counterparty exposures (continued)
R’million
Total credit and
counterparty exposure
Assets that we deem
to have no legal credit exposure
Note refer-ence
Total balance
sheet
At 31 March 2016
cash and balances at central banks 7 801 – 7 801
Loans and advances to banks 26 779 – 26 779
non-sovereign and non-bank cash placements 9 858 – 9 858
reverse repurchase agreements and cash collateral on securities borrowed 38 912 – 38 912
Sovereign debt securities 41 325 – 41 325
Bank debt securities 13 968 – 13 968
other debt securities 12 761 – 12 761
derivative financial instruments 10 756 5 087 15 843
Securities arising from trading activities 539 453 992
Investment portfolio – 6 360 1 6 360
Loans and advances to customers 208 182 (910) 2 207 272
own originated loans and advances to customers securitised 7 973 (6) 2 7 967
other loans and advances 398 (31) 2 367
other securitised assets – 115 3 115
Interest in associated undertakings – 5 145 1 5 145
deferred taxation assets – 116 116
other assets 2 169 1 487 4 3 656
Property and equipment – 236 236
Investment properties – 1 1
goodwill – 171 171
Intangible assets – 524 524
Loans to group companies – 5 460 5 460
Total on-balance sheet exposures 381 421 24 208 405 629
1. Largely relates to exposures that are classified as investment risk in the banking book. 2. Largely relates to impairments.3. Largely cash in the securitised vehicles.4. Other assets include settlement debtors where we deem to have no credit risk exposure as they are settled on a delivery against payment basis.

RIS
K M
AN
AG
EM
EN
T AN
D C
Ap
ITAl IN
foR
MATIo
N (u
NA
uD
ITED
)
THREE
(continued)
30 Investec Bank Limited salient financial information 2016
Risk management
Detailed analysis of gross credit and counterparty exposures by industry
R’million
High networth and
professional individuals
Lendingcollateralisedby property – largely to
privateclients Agriculture
Electricity, gas and
water (utility
services)
Public and non-business services
Business services
Finance and
insurance
Retailers and
whole-salers
Manufac-turing and commerce
Construc-tion
Corporatecommer-
cial realestate
Otherresidentialmortgages
Mining and
resources
Leisure, entertain-ment and
tourism TransportCommuni-
cation Total
At 30 September 2016
cash and balances at central banks – – – – 8 101 – – – – – – – – – – – 8 101
Loans and advances to banks – – – – – – 32 571 – – – – – – – – – 32 571
non-sovereign and non-bank cash placements – – 58 – 101 265 1 837 2 546 2 879 262 197 – 1 254 – 589 230 10 218
reverse repurchase agreements and cash collateral on securities borrowed 610 – – – – 329 29 368 – 722 – – – – – 39 – 31 068
Sovereign debt securities – – – – 47 800 – – – – – – – – – – – 47 800
Bank debt securities – – – – – – 8 294 – – – – – – – – – 8 294
other debt securities – – – – 2 316 – 2 647 – 1 253 – – – 2 484 – – 2 696 11 396
derivative financial instruments – – 17 449 – 117 5 206 246 167 7 342 – 375 57 30 57 7 070
Securities arising from trading activities – – – 1 501 – 31 – – – – – – – 144 – 677
Loans and advances to customers (gross) 101 241 39 211 1 830 4 014 5 898 11 340 13 551 2 316 8 746 4 101 6 352 – 3 650 1 309 4 383 7 668 215 610
own originated loans and advances to customers securitised (gross) 8 329 – – – – – – – – – – – – – – – 8 329
other loans and advances (gross) – – – – – – – – – – – 365 – – – – 365
other assets – – – – – – 710 1 736 76 13 – – – 42 – 15 2 592
Total on-balance sheet exposures 110 180 39 211 1 905 4 464 64 717 12 051 94 215 6 844 13 843 4 383 6 891 365 7 763 1 408 5 185 10 666 384 091
guarantees^ 4 199 610 179 1 014 1 791 678 4 531 1 028 401 – 126 – 1 758 175 323 130 16 943
contingent liabilities, committed facilities and other 30 066 5 964 476 2 575 315 1 225 2 558 1 866 1 046 438 127 17 2 943 82 1 064 703 51 465
Total off-balance sheet exposures 34 265 6 574 655 3 589 2 106 1 903 7 089 2 894 1 447 438 253 17 4 701 257 1 387 833 68 408
Total gross credit and counterparty exposurespre-collateral or other credit enhancements 144 445 45 785 2 560 8 053 66 823 13 954 101 304 9 738 15 290 4 821 7 144 382 12 464 1 665 6 572 11 499 452 499
At 31 March 2016
cash and balances at central banks – – – – 7 801 – – – – – – – – – – – 7 801
Loans and advances to banks – – – – – – 26 779 – – – – – – – – – 26 779
non-sovereign and non-bank cash placements – – – – 102 562 3 337 1 781 1 469 211 – – 1 581 – 312 503 9 858
reverse repurchase agreements and cash collateral on securities borrowed 623 – – – – 151 37 389 – 675 – – – – – 74 – 38 912
Sovereign debt securities – – – – 41 325 – – – – – – – – – – – 41 325
Bank debt securities – – – – – – 13 968 – – – – – – – – – 13 968
other debt securities – – – 98 2 686 – 3 137 – 658 – – – 2 509 – – 3 673 12 761
derivative financial instruments – – 36 205 – 156 8 876 252 203 – 676 – 159 21 83 89 10 756
Securities arising from trading activities – – – 7 330 – 83 – 16 – – – – – 103 – 539
Loans and advances to customers (gross) 93 596 41 077 2 256 4 809 6 377 8 908 11 977 2 378 10 128 3 424 6 251 – 4 682 1 819 4 071 6 429 208 182
own originated loans and advances to customers securitised (gross) 7 973 – – – – – – – – – – – – – – – 7 973
other loans and advances (gross) – – – – – – – – – – – 398 – – – – 398
other assets – – 1 – – 2 484 1 556 92 3 – – – 20 – 11 2 169
Total on-balance sheet exposures 102 192 41 077 2 293 5 119 58 621 9 779 106 030 5 967 13 241 3 638 6 927 398 8 931 1 860 4 643 10 705 381 421
guarantees^ 3 536 842 – 990 1 917 30 8 168 62 136 – 11 – 1 822 – 65 188 17 767
contingent liabilities, committed facilities and other 24 845 2 265 432 814 309 782 5 924 1 664 1 142 222 100 – 4 514 3 2 208 935 46 159
Total off-balance sheet exposures 28 381 3 107 432 1 804 2 226 812 14 092 1 726 1 278 222 111 – 6 336 3 2 273 1 123 63 926
Total gross credit and counterparty exposurespre-collateral or other credit enhancements 130 573 44 184 2 725 6 923 60 847 10 591 120 122 7 693 14 519 3 860 7 038 398 15 267 1 863 6 916 11 828 445 347
^ Excludes guarantees provided to clients which are backed/secured by cash on deposit with the bank.

RIS
K M
AN
AG
EM
EN
T AN
D C
Ap
ITAl IN
foR
MATIo
N (u
NA
uD
ITED
)
THREE
(continued)
31Investec Bank Limited salient financial information 2016
Risk management
Detailed analysis of gross credit and counterparty exposures by industry
R’million
High networth and
professional individuals
Lendingcollateralisedby property – largely to
privateclients Agriculture
Electricity, gas and
water (utility
services)
Public and non-business services
Business services
Finance and
insurance
Retailers and
whole-salers
Manufac-turing and commerce
Construc-tion
Corporatecommer-
cial realestate
Otherresidentialmortgages
Mining and
resources
Leisure, entertain-ment and
tourism TransportCommuni-
cation Total
At 30 September 2016
cash and balances at central banks – – – – 8 101 – – – – – – – – – – – 8 101
Loans and advances to banks – – – – – – 32 571 – – – – – – – – – 32 571
non-sovereign and non-bank cash placements – – 58 – 101 265 1 837 2 546 2 879 262 197 – 1 254 – 589 230 10 218
reverse repurchase agreements and cash collateral on securities borrowed 610 – – – – 329 29 368 – 722 – – – – – 39 – 31 068
Sovereign debt securities – – – – 47 800 – – – – – – – – – – – 47 800
Bank debt securities – – – – – – 8 294 – – – – – – – – – 8 294
other debt securities – – – – 2 316 – 2 647 – 1 253 – – – 2 484 – – 2 696 11 396
derivative financial instruments – – 17 449 – 117 5 206 246 167 7 342 – 375 57 30 57 7 070
Securities arising from trading activities – – – 1 501 – 31 – – – – – – – 144 – 677
Loans and advances to customers (gross) 101 241 39 211 1 830 4 014 5 898 11 340 13 551 2 316 8 746 4 101 6 352 – 3 650 1 309 4 383 7 668 215 610
own originated loans and advances to customers securitised (gross) 8 329 – – – – – – – – – – – – – – – 8 329
other loans and advances (gross) – – – – – – – – – – – 365 – – – – 365
other assets – – – – – – 710 1 736 76 13 – – – 42 – 15 2 592
Total on-balance sheet exposures 110 180 39 211 1 905 4 464 64 717 12 051 94 215 6 844 13 843 4 383 6 891 365 7 763 1 408 5 185 10 666 384 091
guarantees^ 4 199 610 179 1 014 1 791 678 4 531 1 028 401 – 126 – 1 758 175 323 130 16 943
contingent liabilities, committed facilities and other 30 066 5 964 476 2 575 315 1 225 2 558 1 866 1 046 438 127 17 2 943 82 1 064 703 51 465
Total off-balance sheet exposures 34 265 6 574 655 3 589 2 106 1 903 7 089 2 894 1 447 438 253 17 4 701 257 1 387 833 68 408
Total gross credit and counterparty exposurespre-collateral or other credit enhancements 144 445 45 785 2 560 8 053 66 823 13 954 101 304 9 738 15 290 4 821 7 144 382 12 464 1 665 6 572 11 499 452 499
At 31 March 2016
cash and balances at central banks – – – – 7 801 – – – – – – – – – – – 7 801
Loans and advances to banks – – – – – – 26 779 – – – – – – – – – 26 779
non-sovereign and non-bank cash placements – – – – 102 562 3 337 1 781 1 469 211 – – 1 581 – 312 503 9 858
reverse repurchase agreements and cash collateral on securities borrowed 623 – – – – 151 37 389 – 675 – – – – – 74 – 38 912
Sovereign debt securities – – – – 41 325 – – – – – – – – – – – 41 325
Bank debt securities – – – – – – 13 968 – – – – – – – – – 13 968
other debt securities – – – 98 2 686 – 3 137 – 658 – – – 2 509 – – 3 673 12 761
derivative financial instruments – – 36 205 – 156 8 876 252 203 – 676 – 159 21 83 89 10 756
Securities arising from trading activities – – – 7 330 – 83 – 16 – – – – – 103 – 539
Loans and advances to customers (gross) 93 596 41 077 2 256 4 809 6 377 8 908 11 977 2 378 10 128 3 424 6 251 – 4 682 1 819 4 071 6 429 208 182
own originated loans and advances to customers securitised (gross) 7 973 – – – – – – – – – – – – – – – 7 973
other loans and advances (gross) – – – – – – – – – – – 398 – – – – 398
other assets – – 1 – – 2 484 1 556 92 3 – – – 20 – 11 2 169
Total on-balance sheet exposures 102 192 41 077 2 293 5 119 58 621 9 779 106 030 5 967 13 241 3 638 6 927 398 8 931 1 860 4 643 10 705 381 421
guarantees^ 3 536 842 – 990 1 917 30 8 168 62 136 – 11 – 1 822 – 65 188 17 767
contingent liabilities, committed facilities and other 24 845 2 265 432 814 309 782 5 924 1 664 1 142 222 100 – 4 514 3 2 208 935 46 159
Total off-balance sheet exposures 28 381 3 107 432 1 804 2 226 812 14 092 1 726 1 278 222 111 – 6 336 3 2 273 1 123 63 926
Total gross credit and counterparty exposurespre-collateral or other credit enhancements 130 573 44 184 2 725 6 923 60 847 10 591 120 122 7 693 14 519 3 860 7 038 398 15 267 1 863 6 916 11 828 445 347
^ Excludes guarantees provided to clients which are backed/secured by cash on deposit with the bank.

RIS
K M
AN
AG
EM
EN
T AN
D C
Ap
ITAl IN
foR
MATIo
N (u
NA
uD
ITED
)
THREE
(continued)
32 Investec Bank Limited salient financial information 2016
Risk management
Gross core loans and advances
Other credit and counterparty exposures Total
R’million30 Sept
201631 March
201630 Sept
201631 March
201630 Sept
201631 March
2016
High net worth and professional individuals 109 570 101 569 34 875 29 004 144 445 130 573
Lending collateralised by property – largely to private clients 39 211 41 077 6 574 3 107 45 785 44 184
agriculture 1 830 2 256 730 469 2 560 2 725
electricity, gas and water (utility services) 4 014 4 809 4 039 2 114 8 053 6 923
Public and non–business services 5 898 6 377 60 925 54 470 66 823 60 847
Business services 11 340 8 908 2 614 1 683 13 954 10 591
finance and insurance 13 551 11 977 87 753 108 145 101 304 120 122
retailers and wholesalers 2 316 2 378 7 422 5 315 9 738 7 693
manufacturing and commerce 8 746 10 128 6 544 4 391 15 290 14 519
construction 4 101 3 424 720 436 4 821 3 860
corporate commercial real estate 6 352 6 251 792 787 7 144 7 038
other residential mortgages – – 382 398 382 398
mining and resources 3 650 4 682 8 814 10 585 12 464 15 267
Leisure, entertainment and tourism 1 309 1 819 356 44 1 665 1 863
transport 4 383 4 071 2 189 2 845 6 572 6 916
communication 7 668 6 429 3 831 5 399 11 499 11 828
Total 223 939 216 155 228 560 229 192 452 499 445 347
Private client loans account for 66.4% of total gross core loans and advances, as represented by the industry classification ‘high net worth and professional individuals and lending collateralised by property’
Summary analysis of gross credit and counterparty exposures by industry
the remainder of core loans and advances largely relate to corporate client lending and are evenly spread across industry sectors.
other credit and counterparty exposures are largely reflective of cash and near cash balances held with institutions and central banks, thus the large balance reflected in the ‘public and non-business services’ and ‘finance and insurance’ sectors. these exposures also include off-balance sheet items such as guarantees, committed facilities and contingent liabilities, diversified across several industries.

RIS
K M
AN
AG
EM
EN
T AN
D C
Ap
ITAl IN
foR
MATIo
N (u
NA
uD
ITED
)
THREE
(continued)
33Investec Bank Limited salient financial information 2016
Risk management
Gross credit counterparty exposures by residual contractual maturity at 30 September 2016
R’million
Up to three months
Three to six
months
Six months to one
year
One to five
yearsFive to
10 years > 10 years Total
cash and balances at central banks 8 101 – – – – – 8 101
Loans and advances to banks 31 134 – 35 1 388 14 – 32 571
non-sovereign and non-bank cash placements 10 218 – – – – – 10 218
reverse repurchase agreements and cash collateral on securities borrowed 24 142 2 128 187 3 848 763 – 31 068
Sovereign debt securities 12 602 9 577 9 064 2 111 7 811 6 635 47 800
Bank debt securities 756 908 317 4 624 1 484 205 8 294
other debt securities 298 – 863 5 049 4 062 1 124 11 396
derivative financial instruments 2 034 1 023 738 2 423 852 – 7 070
Securities arising from trading activities 38 – 227 196 36 180 677
Loans and advances to customers (gross) 18 728 8 430 14 499 106 398 21 995 45 560 215 610
own originated loans and advances to customers securitised (gross) – – 2 35 346 7 946 8 329
other loans and advances (gross) – – – 365 – – 365
other assets 2 592 – – – – – 2 592
Total on-balance sheet exposures 110 643 22 066 25 932 126 437 37 363 61 650 384 091
guarantees^ 5 866 818 743 8 881 379 256 16 943
contingent liabilities, committed facilities and other 12 345 1 180 3 634 15 397 2 832 16 077 51 465
Total off-balance sheet exposures 18 211 1 998 4 377 24 278 3 211 16 333 68 408
Total gross credit and counterparty exposures pre-collateral or othercredit enhancements 128 854 24 064 30 309 150 715 40 574 77 983 452 499
^ Excludes guarantees provided to clients which are backed/secured by cash on deposit with the bank.
RIS
K M
AN
AG
EM
EN
T AN
D C
Ap
ITAl IN
foR
MATIo
N (u
NA
uD
ITED
)
THREE
(continued)
34 Investec Bank Limited salient financial information 2016
Risk management
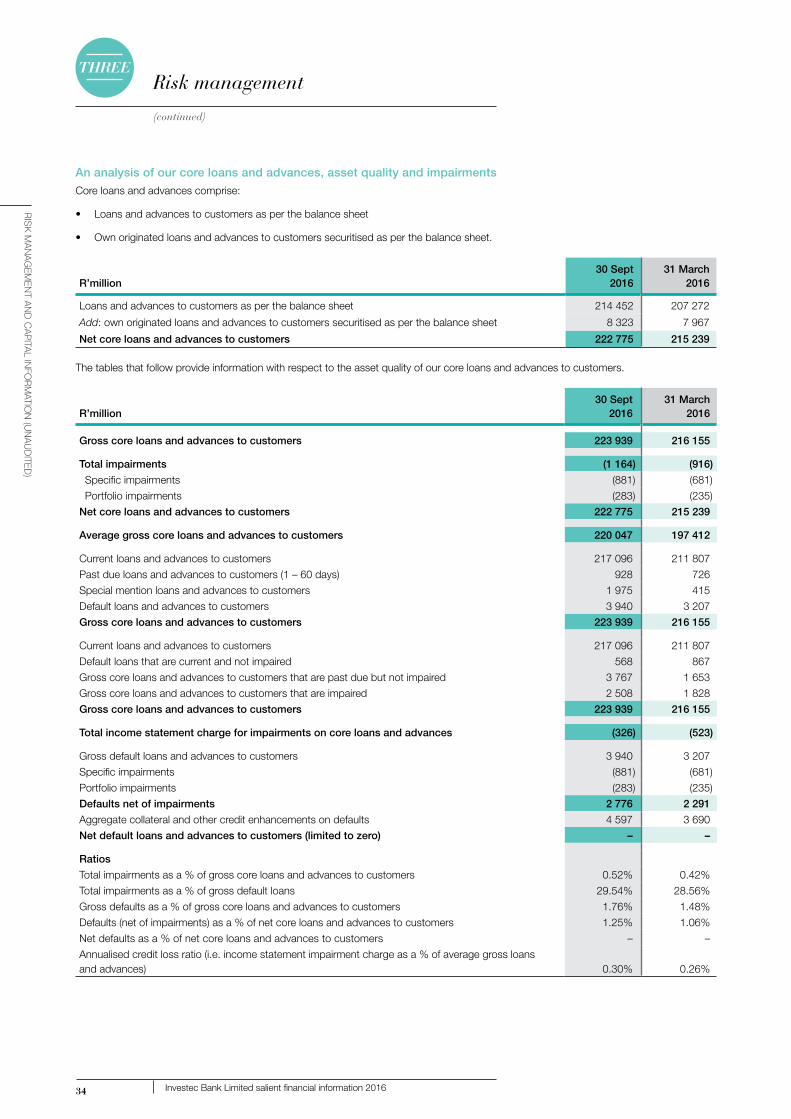
An analysis of our core loans and advances, asset quality and impairments
core loans and advances comprise:
• Loans and advances to customers as per the balance sheet
• own originated loans and advances to customers securitised as per the balance sheet.
R’million30 Sept
201631 March
2016
Loans and advances to customers as per the balance sheet 214 452 207 272
Add: own originated loans and advances to customers securitised as per the balance sheet 8 323 7 967
Net core loans and advances to customers 222 775 215 239
the tables that follow provide information with respect to the asset quality of our core loans and advances to customers.
R’million30 Sept
201631 March
2016
Gross core loans and advances to customers 223 939 216 155
Total impairments (1 164) (916)
Specific impairments (881) (681)
Portfolio impairments (283) (235)
Net core loans and advances to customers 222 775 215 239
Average gross core loans and advances to customers 220 047 197 412
current loans and advances to customers 217 096 211 807
Past due loans and advances to customers (1 – 60 days) 928 726
Special mention loans and advances to customers 1 975 415
default loans and advances to customers 3 940 3 207
Gross core loans and advances to customers 223 939 216 155
current loans and advances to customers 217 096 211 807
default loans that are current and not impaired 568 867
gross core loans and advances to customers that are past due but not impaired 3 767 1 653
gross core loans and advances to customers that are impaired 2 508 1 828
Gross core loans and advances to customers 223 939 216 155
Total income statement charge for impairments on core loans and advances (326) (523)
gross default loans and advances to customers 3 940 3 207
Specific impairments (881) (681)
Portfolio impairments (283) (235)
Defaults net of impairments 2 776 2 291
aggregate collateral and other credit enhancements on defaults 4 597 3 690
Net default loans and advances to customers (limited to zero) – –
Ratios
total impairments as a % of gross core loans and advances to customers 0.52% 0.42%
total impairments as a % of gross default loans 29.54% 28.56%
gross defaults as a % of gross core loans and advances to customers 1.76% 1.48%
defaults (net of impairments) as a % of net core loans and advances to customers 1.25% 1.06%
net defaults as a % of net core loans and advances to customers – –
annualised credit loss ratio (i.e. income statement impairment charge as a % of average gross loans and advances) 0.30% 0.26%

RIS
K M
AN
AG
EM
EN
T AN
D C
Ap
ITAl IN
foR
MATIo
N (u
NA
uD
ITED
)
THREE
(continued)
35Investec Bank Limited salient financial information 2016
Risk management
An age analysis of past due and default core loans and advances to customers
R’million30 Sept
201631 March
2016
default loans that are current 2 037 1 921 1 – 60 days 1 539 1 273 61 – 90 days 1 814 94 91 – 180 days 739 301 181 – 365 days 288 110 > 365 days 426 649 Past due and default core loans and advances to customers (actual capital exposure) 6 843 4 348
1 – 60 days 155 258 61 – 90 days 124 12 91 – 180 days 617 125 181 – 365 days 209 30 > 365 days 245 337 Past due and default core loans and advances to customers (actual amount in arrears) 1 350 762
A further age analysis of past due and default core loans and advances to customers
R’million
Current watchlist
loans1 – 60 days
61 – 90 days
91 – 180 days
181 – 365 days
> 365 days Total
At 30 September 2016
Watchlist loans neither past due nor impaired
total capital exposure 568 – – – – – 568
Gross core loans and advances to customers that are past due but not impaired
total capital exposure – 1 236 1 761 640 57 73 3 767
amount in arrears – 143 89 584 33 38 887
Gross core loans and advances to customers that are impaired
total capital exposure 1 469 303 53 99 231 353 2 508
amount in arrears – 12 35 33 176 207 463
At 31 March 2016
Watchlist loans neither past due nor impaired
total capital exposure 867 – – – – – 867
Gross core loans and advances to customers that are past due but not impaired
total capital exposure – 1 117 70 213 68 185 1 653
amount in arrears – 254 6 104 14 140 518
Gross core loans and advances to customers that are impaired
total capital exposure 1 054 156 24 88 42 464 1 828
amount in arrears – 4 6 21 16 197 244

RIS
K M
AN
AG
EM
EN
T AN
D C
Ap
ITAl IN
foR
MATIo
N (u
NA
uD
ITED
)
THREE
(continued)
36 Investec Bank Limited salient financial information 2016
An age analysis of past due and default core loans and advances to customers at 30 September 2016 (based on total capital exposure)
R’million
Current watchlist
loans1 – 60 days
61 – 90 days
91 – 180 days
181 – 365 days
> 365 days Total
Past due (1 – 60 days) – 928 – – – – 928
Special mention – 223 1 739 10 2 1 1 975
Special mention (1 – 90 days) – 223 1 614 10 * 2* 1* 1 850
Special mention (61 – 90 days and item well secured) – – 125 – – – 125
Default 2 037 388 75 729 286 425 3 940
Sub-standard 568 84 22 630 55 73 1 432
doubtful 1 469 304 53 99 231 352 2 508
Total 2 037 1 539 1 814 739 288 426 6 843
An age analysis of past due and default core loans and advances to customers at 30 September 2016 (based on actual amount in arrears)
R’million
Current watchlist
loans1 – 60 days
61 – 90 days
91 – 180 days
181 – 365 days
> 365 days Total
Past due (1 – 60 days) – 135 – – – – 135
Special mention – 3 84 8 – – 95
Special mention (1 – 90 days) – 3 – 8* – – 11
Special mention (61 – 90 days and item well secured) – – 84 – – – 84
Default – 17 40 609 209 245 1 120
Sub-standard – 6 5 577 32 38 658
doubtful – 11 35 32 177 207 462
Total – 155 124 617 209 245 1 350
* Largely relates to solvent deceased estates and bonds under registration at the deeds office. Due to the lengthy external process with respect to these exposures, which are out of the control of Investec, these exposures have been classified as special mention and will remain there until settled or their credit quality deteriorates.
Risk management

RIS
K M
AN
AG
EM
EN
T AN
D C
Ap
ITAl IN
foR
MATIo
N (u
NA
uD
ITED
)
THREE
(continued)
37Investec Bank Limited salient financial information 2016
An age analysis of past due and default core loans and advances to customers at 31 March 2016 (based on total capital exposure)
R’million
Current watchlist
loans1 – 60 days
61 – 90 days
91 – 180 days
181 – 365 days
> 365 days Total
Past due (1 – 60 days) – 726 – – – – 726
Special mention – 323 64 14 10 4 415
Special mention (1 – 90 days) – 323 9 14* 10* 4* 360
Special mention (61 – 90 days and item well secured) – – 55 – – – 55
Default 1 921 224 30 287 100 645 3 207
Sub-standard 868 66 6 200 58 181 1 379
doubtful 1 053 158 24 87 42 464 1 828
Total 1 921 1 273 94 301 110 649 4 348
An age analysis of past due and default core loans and advances to customers at 31 March 2016 (based on actual amount in arrears)
R’million
Current watchlist
loans1 – 60 days
61 – 90 days
91 – 180 days
181 – 365 days
> 365 days Total
Past due (1 – 60 days) – 59 – – – – 59
Special mention – 157 5 1 1 1 165
Special mention (1 – 90 days) – 157 – 1* 1* 1* 160
Special mention (61 – 90 days and item well secured) – – 5 – – – 5
Default – 42 7 124 29 336 538
Sub-standard – 38 – 103 13 139 293
doubtful – 4 7 21 16 197 245
Total – 258 12 125 30 337 762
* Largely relates to solvent deceased estates and bonds under registration at the deeds office. Due to the lengthy external process with respect to these exposures, which are out of the control of Investec, these exposures have been classified as special mention and will remain there until settled or their credit quality deteriorates.
Risk management
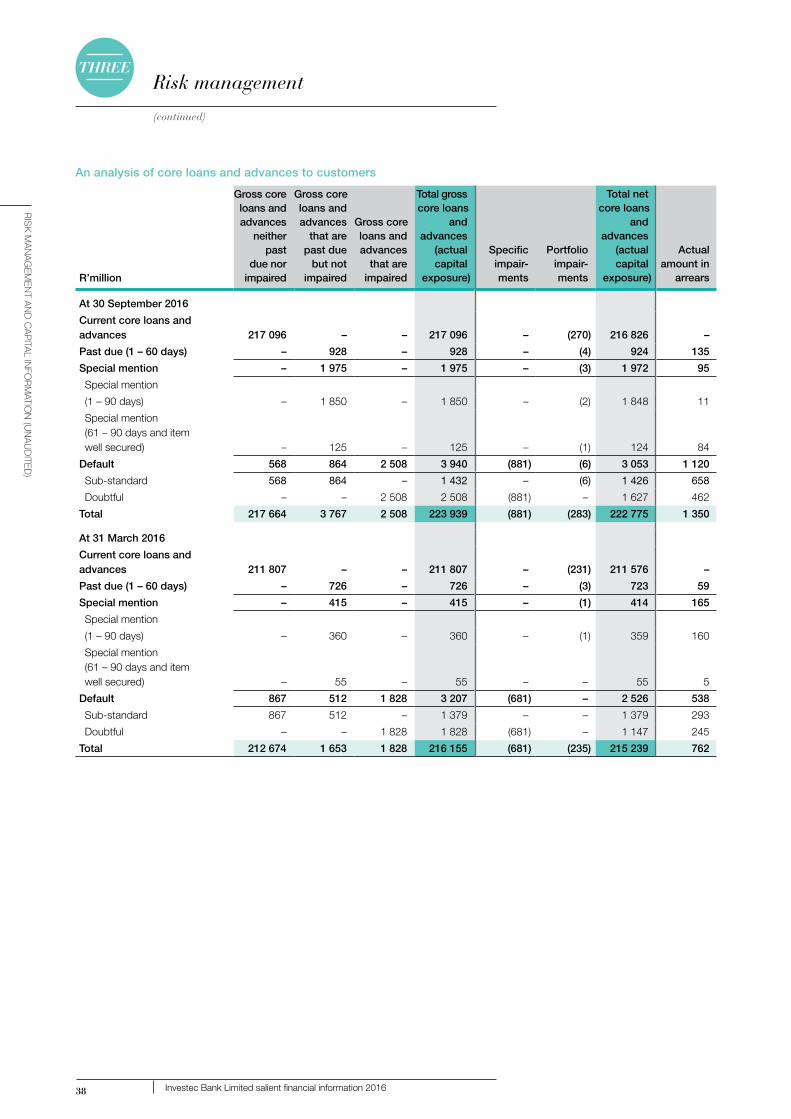
RIS
K M
AN
AG
EM
EN
T AN
D C
Ap
ITAl IN
foR
MATIo
N (u
NA
uD
ITED
)
THREE
(continued)
38 Investec Bank Limited salient financial information 2016
An analysis of core loans and advances to customers
R’million
Gross core loans and advances
neither past
due nor impaired
Gross core loans and advances
that are past due
but not impaired
Gross core loans and advances
that are impaired
Total gross core loans
and advances
(actual capital
exposure)
Specific impair-
ments
Portfolio impair-
ments
Total net core loans
and advances
(actual capital
exposure)
Actual amount in
arrears
At 30 September 2016
Current core loans and advances 217 096 – – 217 096 – (270) 216 826 –
Past due (1 – 60 days) – 928 – 928 – (4) 924 135
Special mention – 1 975 – 1 975 – (3) 1 972 95
Special mention
(1 – 90 days) – 1 850 – 1 850 – (2) 1 848 11
Special mention (61 – 90 days and item well secured) – 125 – 125 – (1) 124 84
Default 568 864 2 508 3 940 (881) (6) 3 053 1 120
Sub-standard 568 864 – 1 432 – (6) 1 426 658
doubtful – – 2 508 2 508 (881) – 1 627 462
Total 217 664 3 767 2 508 223 939 (881) (283) 222 775 1 350
At 31 March 2016
Current core loans and advances 211 807 – – 211 807 – (231) 211 576 –
Past due (1 – 60 days) – 726 – 726 – (3) 723 59
Special mention – 415 – 415 – (1) 414 165
Special mention
(1 – 90 days) – 360 – 360 – (1) 359 160
Special mention (61 – 90 days and item well secured) – 55 – 55 – – 55 5
Default 867 512 1 828 3 207 (681) – 2 526 538
Sub-standard 867 512 – 1 379 – – 1 379 293
doubtful – – 1 828 1 828 (681) – 1 147 245
Total 212 674 1 653 1 828 216 155 (681) (235) 215 239 762
Risk management

RIS
K M
AN
AG
EM
EN
T AN
D C
Ap
ITAl IN
foR
MATIo
N (u
NA
uD
ITED
)
THREE
(continued)
39Investec Bank Limited salient financial information 2016
An analysis of core loans and advances to customers and impairments by counterparty type
R’million
Private client, professional
and high net worth
individualsCorporate
sector
Insurance, financial services
(excluding sovereign)
Public and government
sector (including
central banks)
Trade finance
and other
Total core loans and
advances to customers
At 30 September 2016
Current core loans and advances 145 022 49 394 13 551 5 759 3 370 217 096
Past due (1 – 60 days) 670 152 – – 106 928
Special mention 295 66 – – 1 614 1 975
Special mention (1 – 90 days) 172 66 – – 1 612 1 850
Special mention (61 – 90 days and item well secured) 123 – – – 2 125
Default 2 794 810 – 139 197 3 940
Sub-standard 1 158 274 – – – 1 432
doubtful 1 636 536 – 139 197 2 508
Total gross core loans andadvances to customers 148 781 50 422 13 551 5 898 5 287 223 939
Total impairments (669) (280) (15) (61) (139) (1 164)
Specific impairments (439) (243) – (60) (139) (881)
Portfolio impairments (230) (37) (15) (1) – (283)
Net core loans and advances to customers 148 112 50 142 13 536 5 837 5 148 222 775
At 31 March 2016
Current core loans and advances 139 227 49 350 11 925 6 363 4 942 211 807
Past due (1 – 60 days) 546 100 – – 80 726
Special mention 402 – – – 13 415
Special mention (1 – 90 days) 360 – – – – 360
Special mention (61 – 90 days and item well secured) 42 – – – 13 55
Default 2 471 505 52 14 165 3 207
Sub-standard 1 310 – 52 14 3 1 379
doubtful 1 161 505 – – 162 1 828
Total gross core loans andadvances to customers 142 646 49 955 11 977 6 377 5 200 216 155
Total impairments (495) (270) (4) (4) (143) (916)
Specific impairments (306) (232) – – (143) (681)
Portfolio impairments (189) (38) (4) (4) – (235)
Net core loans and advancesto customers 142 151 49 685 11 973 6 373 5 057 215 239
Risk management
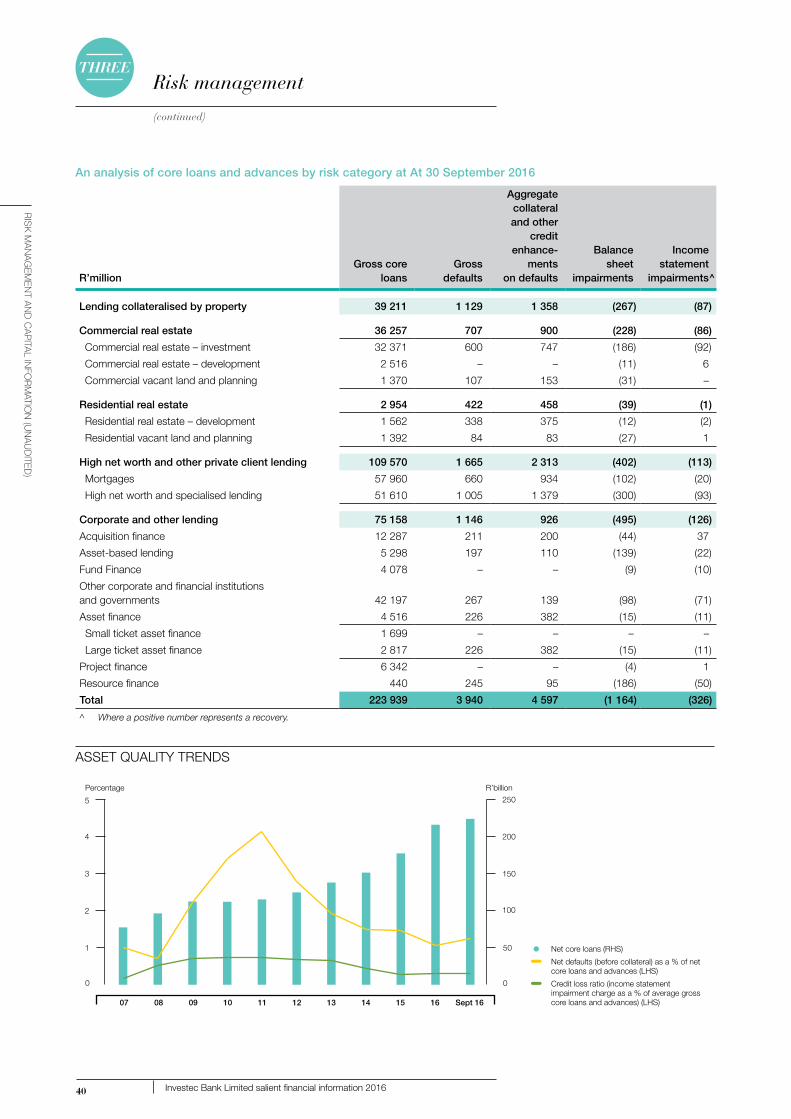
RIS
K M
AN
AG
EM
EN
T AN
D C
Ap
ITAl IN
foR
MATIo
N (u
NA
uD
ITED
)
THREE
(continued)
40 Investec Bank Limited salient financial information 2016
An analysis of core loans and advances by risk category at At 30 September 2016
R’millionGross core
loansGross
defaults
Aggregate collateral and other
credit enhance-
ments on defaults
Balancesheet
impairments
Income statement
impairments^
Lending collateralised by property 39 211 1 129 1 358 (267) (87)
Commercial real estate 36 257 707 900 (228) (86)
commercial real estate – investment 32 371 600 747 (186) (92)
commercial real estate – development 2 516 – – (11) 6
commercial vacant land and planning 1 370 107 153 (31) –
Residential real estate 2 954 422 458 (39) (1)
residential real estate – development 1 562 338 375 (12) (2)
residential vacant land and planning 1 392 84 83 (27) 1
High net worth and other private client lending 109 570 1 665 2 313 (402) (113)
mortgages 57 960 660 934 (102) (20)
High net worth and specialised lending 51 610 1 005 1 379 (300) (93)
Corporate and other lending 75 158 1 146 926 (495) (126)
acquisition finance 12 287 211 200 (44) 37
asset-based lending 5 298 197 110 (139) (22)
fund finance 4 078 – – (9) (10)
other corporate and financial institutions and governments 42 197 267 139 (98) (71)
asset finance 4 516 226 382 (15) (11)
Small ticket asset finance 1 699 – – – –
Large ticket asset finance 2 817 226 382 (15) (11)
Project finance 6 342 – – (4) 1
resource finance 440 245 95 (186) (50)
Total 223 939 3 940 4 597 (1 164) (326)
^ Where a positive number represents a recovery.
Percentage
0
50
100
150
200
250
ASSET QUALITY TRENDS
151413121110090807 Sept 1616
0
1
2
3
4
5
R’billion
Net core loans (RHS)
Net defaults (before collateral) as a % of net core loans and advances (LHS)
Credit loss ratio (income statement impairment charge as a % of average gross core loans and advances) (LHS)
Risk management

RIS
K M
AN
AG
EM
EN
T AN
D C
Ap
ITAl IN
foR
MATIo
N (u
NA
uD
ITED
)
THREE
(continued)
41Investec Bank Limited salient financial information 2016
An analysis of core loans and advances by risk category at 31 March 2016
R’millionGross core
loansGross
defaults
Aggregate collateral and other
credit enhance-
ments on defaults
Balancesheet
impairments
Income statement
impairments^
Lending collateralised by property 41 077 971 1 156 (205) (80)
Commercial real estate 37 677 501 666 (140) (70)
commercial real estate – investment 34 179 366 482 (97) (40)
commercial real estate – development 2 385 31 24 (19) (8)
commercial vacant land and planning 1 113 104 160 (24) (22)
Residential real estate 3 400 470 490 (65) (10)
residential development 1 668 194 217 (14) (71)
residential vacant land and planning 1 732 276 273 (51) 61
High net worth and other private client lending 101 569 1 500 2 167 (290) (283)
mortgages 54 493 495 839 (80) (45)
High net worth and specialised lending 47 076 1 005 1 328 (210) (238)
Corporate other lending 73 509 736 367 (421) (160)
acquisition finance 14 664 329 286 (70) (98)
asset-based lending 5 211 165 56 (143) (51)
fund finance 3 668 – – (9) (9)
other corporate and financial institutions and governments 38 954 106 25 (51) (10)
asset finance 4 081 – – (12) 21
Small ticket asset finance 1 421 – – – 13
Large ticket asset finance 2 660 – – (12) 8
Project finance 6 424 – – – 123
resource finance 507 136 – (136) (136)
Total 216 155 3 207 3 690 (916) (523)
^ Where a positive number represents a recovery.
Risk management

RIS
K M
AN
AG
EM
EN
T AN
D C
Ap
ITAl IN
foR
MATIo
N (u
NA
uD
ITED
)
THREE
(continued)
42 Investec Bank Limited salient financial information 2016
coLLateraL
A summary of total collateral is provided in the table below
Collateral held against
R’million
Core loans and advances
Other credit and
counterparty exposures* Total
At 30 September 2016
Eligible financial collateral 44 713 20 620 65 333
Listed shares 43 052 8 756 51 808
cash 1 661 2 1 663
debt securities issued by sovereigns – 11 862 11 862
Property charge 286 490 627 287 117
residential property 138 875 532 139 407
commercial property developments 9 977 95 10 072
commercial property investments 137 638 – 137 638
Other collateral 58 034 78 58 112
unlisted shares 7 851 – 7 851
charges other than property 12 874 – 12 874
debtors, stock and other corporate assets 6 947 – 6 947
guarantees 21 816 19 21 835
other 8 546 59 8 605
Total collateral 389 237 21 325 410 562
At 31 March 2016
Eligible financial collateral 33 841 24 555 58 396
Listed shares 32 862 7 905 40 767
cash 979 22 1 001
debt securities issued by sovereigns – 16 628 16 628
Property charge 281 274 587 281 861
residential property 141 202 482 141 684
commercial property developments 12 078 105 12 183
commercial property investments 127 994 – 127 994
Other collateral 54 733 1 354 56 087
unlisted shares 8 093 – 8 093
charges other than property 10 940 – 10 940
debtors, stock and other corporate assets 5 703 – 5 703
guarantees 20 737 35 20 772
other 9 260 1 319 10 579
Total collateral 369 848 26 496 396 344
* A large percentage of these exposures (for example bank placements) are to highly rated financial institutions where limited collateral would be required due to the nature of the exposure.
Risk management

RIS
K M
AN
AG
EM
EN
T AN
D C
Ap
ITAl IN
foR
MATIo
N (u
NA
uD
ITED
)
THREE
(continued)
43Investec Bank Limited salient financial information 2016
Investment risk in the banking book represents a moderate percentage of our total assets and is managed within appropriate risk limits
been transferred to a new vehicle, Investec equity Partners (IeP) on 11 January 2016. Investec Bank Limited holds a 45% stake alongside other strategic investors who hold the remaining 55% in IeP. the investment in IeP is reflected as an investment in an associate. We continue to pursue opportunities to help create and grow black-owned and controlled companies.
• Lending transactions: the manner in which we structure certain transactions results in equity, warrant and profit shares being held, predominantly within unlisted companies
• Property activities: we source development, investment and trading opportunities to create value and trade for profit within agreed risk parameters
• Central Funding: central funding is the custodian of certain equity and property investments.
the table below provides an analysis of income and revaluations recorded with respect to these investments.
R’million
Income/(loss) (pre-funding costs)
Unrealised** Realised** Dividends Other Total
Fair value through
equity
30 September 2016unlisted investments (283) 39 110 – (134) (2)Listed equities 56 – 89 – 145 31Investment and trading properties (38) 11 – – (27) –Warrants, profit shares and other embedded derivatives
11 96 – – 107 –
IeP* – – – 169 169 –
Total (254) 146 199 169 260 29
30 March 2016
unlisted investments (2 699) 3 597 185 – 1 083 (2)
Listed equities 91 (2) 200 – 289 207
Investments and trading properties (60) 75 _ – 15 _
Warrants, profit shares and other embedded derivatives
(56) 274 – – 218 –
IeP – – – – – –
Total (2 724) 3 944 385 – 1 605 205
* As explained above. ** In a year of realisation, any prior period mark-to-market gains/losses recognised are reversed in the unrealised line item.
Investment risk in the banking bookInveStment rISK deScrIPtIon
Investment risk in the banking book arises primarily from the following activities conducted within the group:
• Principal Investments: investments are selected based on the track record of management, the attractiveness of the industry and the ability to build value for the existing business by implementing an agreed strategy. Investments in listed shares may arise on the IPo of one of our investments. additionally listed investments may be considered where we believe that the market is mispricing the value of the underlying security or where there is the opportunity to stimulate corporate activity. a material portion of the principal investments have
Risk management

RIS
K M
AN
AG
EM
EN
T AN
D C
Ap
ITAl IN
foR
MATIo
N (u
NA
uD
ITED
)
THREE
(continued)
44 Investec Bank Limited salient financial information 2016
Summary of InveStmentS HeLd and StreSS teStIng anaLySeS
the balance sheet value of investments is indicated in the table below.
R’million
On-balance sheet
value of investments
30 Sept2016
Valuation change
stress test30 Sept
2016*
On-balance sheet
value of investments
31 Mar2016
Valuation change
stress test31 Mar
2016*
unlisted investments^ 3 657 549 2 803 420Listed equities 3 913 978 3 557 889
Investment and trading properties 100 20 177 35
Warrants, profit shares and other embedded derivatives 250 87 237 83Investment in associate (IeP)^^ 5 279 792 5 063 760Total 13 199 2 426 11 837 2 187
^ Includes the investment portfolio and non-current assets classified as held for sale as per the balance sheet.^^ As explained on page 8.* In order to assess our earnings sensitivity to a movement in the valuation of these investments the following stress testing parameters are applied:
Additional information
51.8%
9.6%
13.1%
11.2%
2.4%
11.9%
Finance and insurance
Manufacturing and commerce
Mining and resources
Real estate
Communication
Other
31 March 2016 (R6.6 billion)
43.8%
18.2%
11.0%
10.4%
8.8%
7.8%
Finance and insurance
Manufacturing and commerce
Mining and resources
Real estate
Communication
Other
30 September 2016 (R7.8 billion)
AN ANALYSIS OF THE INVESTMENT PORTFOLIO, WARRANTS, PROFIT SHARES AND OTHER EMBEDDED DERIVATIVES BY INDUSTRY OF EXPOSURE
Risk management
Stress test values applied
unlisted investments and IeP 15%
Listed equities 25%
trading properties 20%
Investment properties 10%
Warrants, profit shares and other embedded derivatives 35%
caPItaL requIrementS
In terms of Basel III capital requirements for Investec Bank Limited, unlisted and listed equities within the banking book are represented under the category ‘equity risk’ and investment properties, profit shares and embedded derivatives are considered in the calculation of capital required for credit risk.

RIS
K M
AN
AG
EM
EN
T AN
D C
Ap
ITAl IN
foR
MATIo
N (u
NA
uD
ITED
)
THREE
(continued)
45Investec Bank Limited salient financial information 2016
these securitisation transactions, which are considered to be traditional securitisations and in which a complete transfer of risk has deemed to have occurred for regulatory capital purposes. the group has retained an investment in all of these transactions. In terms of current securitisation rules, the group cannot act as liquidity provider to these transactions, and thus for these fox Street structures, the special purpose entity has an internal liquidity reserve that has been funded. credit mitigants have not been used in these transactions. an exemption notice in terms of securitisation rules has been applied for in relation to the fS1 and fS2 transactions. the fS3 to fS5 cLf transactions are within scope of the Bank’s act.
for regulatory capital purposes, the equity tranche held in the fS2 transaction, is treated as a deduction against capital. the capital treatment of cLf transactions is the same as if the homeloans were still on balance sheet. the group has no resecuritisation exposures in South africa.
credIt anaLySIS
In terms of our analysis of our credit and counterparty risk, exposures arising from securitisation/structured credit activities reflect only those exposures to which we consider ourselves to be at risk.
In addition, assets that have been securitised by our Private client division are reflected as part of our core lending exposures and not our securitisation/structured credit exposures as we believe this reflects the true nature and intent of these exposures and activities.
platforms with external third party originating intermediaries. our exposure to these platforms has reduced and been sold down over the last few years and at present we have a single limited warehouse funding line to one platform.
furthermore, we are sponsor to and provide a standby liquidity facility to Private mortgages 1 (rf) (Pty) Ltd. this facility, which totalled r1 million at 30 September 2016 (31 march 2016: r15 million), has not been drawn on and is reflected as off-balance sheet contingent exposures in terms of our credit analysis.
this exposure is risk weighted for regulatory capital purposes. the liquidity risk associated with this facility is included in the stress testing for the group and is managed in accordance with our overall liquidity position.
We have also sought out select opportunities in the credit/debt markets and traded and purchased in structured credit. these have largely been South african rmBS, which totalled r1.7 billion at 30 September 2016. these investments are risk weighted for regulatory capital purposes.
In addition, we have own originated, securitised assets in our Private client business in South africa. the primary motivations for the securitisation of assets within our Private client division are to:
• Provide an alternative source of funding
• act as a mechanism to transfer risk
• Leverage returns through the retention of equity tranches in low default rate portfolios.
total assets that have been originated and securitised by the Private client division amount to r8.3 billion at 30 September 2016 (31 march 2016: r8.0 billion) and consist of residential mortgages (r8.3 billion). Within these securitisation vehicles loans greater than 90 days in arrears amounted to r4.9 million.
fox Street 1 (fS1) to fox Street 5 (fS5) are rated by global credit ratings. the group has acted as sole originator and sponsor in
StreSS teStIng Summary
Based on the information at 30 September 2016, as reflected on page 44, we could have a r2.4 billion reversal in revenue (which assumes a year in which there is a ‘severe stress scenario’ simultaneously across all asset classes). this would not cause the group to report a loss, but could have a significantly negative impact on earnings for that period. the probability of all these asset classes in all geographies in which we operate being negatively impacted at the same time is very low, although the probability of listed equities being negatively impacted at the same time is very high.
Securitisation/structured credit activities exposuresovervIeW
the information provided below is meaningful in that it groups all these related activities in order for a reviewer to obtain a fuller picture of the activities that we have conducted in this space. Some of the information provided below overlaps with the group’s credit and counterparty exposure information.
the bank applies the standardised approach in the assessment of regulatory capital for securitisation exposures within its banking book and trading book. the trading book exposures at 31 march 2016 are not material, and therefore no further information is disclosed for these positions.
the information below sets out the initiatives we have focused on over the past few years, albeit that most of these business lines have been curtailed given the changes in the securitisation market.
our securitisation business was established over 15 years ago. over this time, we have arranged a number of residential and commercial mortgage-backed programmes, asset-backed commercial paper conduits (aBcP), and third party securitisations.
Historically, we have also assisted in the development of select securitisation
Risk management

RIS
K M
AN
AG
EM
EN
T AN
D C
Ap
ITAl IN
foR
MATIo
N (u
NA
uD
ITED
)
THREE
(continued)
46 Investec Bank Limited salient financial information 2016
Nature of exposure/activity
Exposure 30 Sept
2016R’million
Exposure31 Mar
2016R’million
Balance sheet and credit risk classification
Asset quality – relevant comments
Structured credit (gross exposure)* 1 654 772 other debt securities
rated 635 772
unrated 1 019 –
Loans and advances to customers and third party intermediary platforms (mortgage loans) (with the potential to be securitised) (net exposure)
336 367 other loans and advances
Private client division assets which have been securitised
8 323 7 967 own originated loans and advances to customers securitised
analysed as part of the group’s overall asset quality on core loans and advances
Liquidity facilities provided to third party corporate securitisation vehicles
– 15 off-balance sheet credit exposure as these facilities have remained undrawn and reflect a contingent liability on the bank
*Analysis of rated and unrated structured credit
30 September 2016 31 March 2016
R’million Rated** Unrated Total Rated** Unrated Total
uK and european rmBS 531 – 531 646 – 646
australian rmBS 104 – 104 126 – 126
South african rmBS – 1 019 1 019 – – –
Total 635 1 019 1 654 772 – 772
**A further analysis of rated structured credit
R’million AAA AA A BBB BB B C andbelow Total
uK and european rmBS – – 378 – 153 – – 531
australian rmBS – 104 – – – – – 104
Total at 30 September 2016 – 104 378 – 153 – – 635
Total at 31 March 2016 – 126 458 – – 188 – 772
Risk management

RIS
K M
AN
AG
EM
EN
T AN
D C
Ap
ITAl IN
foR
MATIo
N (u
NA
uD
ITED
)
THREE
(continued)
47Investec Bank Limited salient financial information 2016
Market risk in the trading book
traded marKet rISK deScrIPtIon
traded market risk is the risk that the value of a portfolio of instruments changes as a result of changes in underlying market risk factors such as interest rates, equity prices, commodity prices, exchange rates and volatilities. the market risk management team identifies, quantifies and manages this risk in accordance with Basel standards and policies determined by the board.
the focus of our trading activities is primarily on supporting client activity. our strategic intent is that proprietary trading should be limited and that trading should be conducted largely to facilitate clients in deal execution. Within our trading activities, we act as principal with clients or the market. market risk, therefore, exists where we have taken on principal positions resulting from market making, underwriting, investments and limited proprietary trading in the foreign exchange, capital and money markets. the focus of these businesses is primarily on supporting client activity.
traded marKet rISK governance Structure
to manage, measure and mitigate market risk, we have independent market risk management teams in each geography where we assume market risk. Local limits have been set to keep potential losses within acceptable risk tolerance levels.
a global market risk forum, mandated by the various boards of directors, manages the market risks in accordance with pre-approved principles and policies. risk limits are reviewed and set at the global market risk forum and ratified at errf in accordance with the risk appetite defined by the board. the appropriateness of limits is continually assessed with limits reviewed at least annually, in the event of a significant market event or at the discretion of senior management.
Risk management
management and meaSurement of traded marKet rISK
market risk management teams review the market risks in the trading books. detailed risk reports are produced daily for each trading desk and for the aggregate risk of the trading books.
these reports are distributed to management and traders. there is a formal process for management recognition and authorisation for any risk excesses incurred. the production of risk reports allows for the monitoring of all positions in the trading book against prescribed limits. Limits are set at trading desk level with aggregate risk across all desks also monitored against overall market risk appetite limits. trading limits are generally tiered, taking into account liquidity and the inherent risks of traded instruments. valuation models for new instruments or products are independently validated by market risk before trading can commence. each traded instrument undergoes various stresses to assess potential losses.
measurement techniques used to quantify market risk arising from our trading activities include sensitivity analysis, value at risk (var), stressed var (svar), expected tail loss (etL) and extreme value theory (evt). Stress testing and scenario analysis are used to simulate extreme conditions to supplement these core measures.
var numbers are monitored daily at the 95% and 99% confidence intervals, with limits set at the 95% confidence interval. etLs are also monitored daily at the 95% and 99% levels as is the worst case loss in the var distribution. Scenario analysis considers the impact of a significant market event on our current trading portfolios. We consider the impact of extreme yet plausible future economic events on the trading portfolio as well as possible worst case scenarios that are not necessarily as plausible.
the accuracy of the var model as a predictor of potential loss is continuously monitored through backtesting. this involves comparing the hypothetical (clean) trading revenues arising from the previous day’s closing positions with the one-day var calculated for the previous day on these same positions. If the revenue is negative and exceeds the one-day var, a backtesting exception is considered to have occurred. over time we expect the average rate of observed backtesting exceptions to be consistent with the percentile of the var statistic being tested.
In South africa, we have internal model approval from the SarB for general market risk for all trading desks with the exception of credit trading and therefore trading capital is calculated as a function of the 99% 10-day var as well as the 99% 10-day svar together with standardised specific risk capital for issuer risk. Backtesting results and a detailed stress-testing packs are submitted to the regulator on a monthly basis.
the table on page 48, contains the 95% one-day var figures for the trading businesses and the graphs that follow show the result of backtesting the total daily 99% one-day var against profit and loss figures for our trading activities over the reporting period. Based on these graphs, we can gauge the accuracy of the var figures, i.e. 99% of the time, the total trading activities are not expected to lose more than the 99% one-day var.
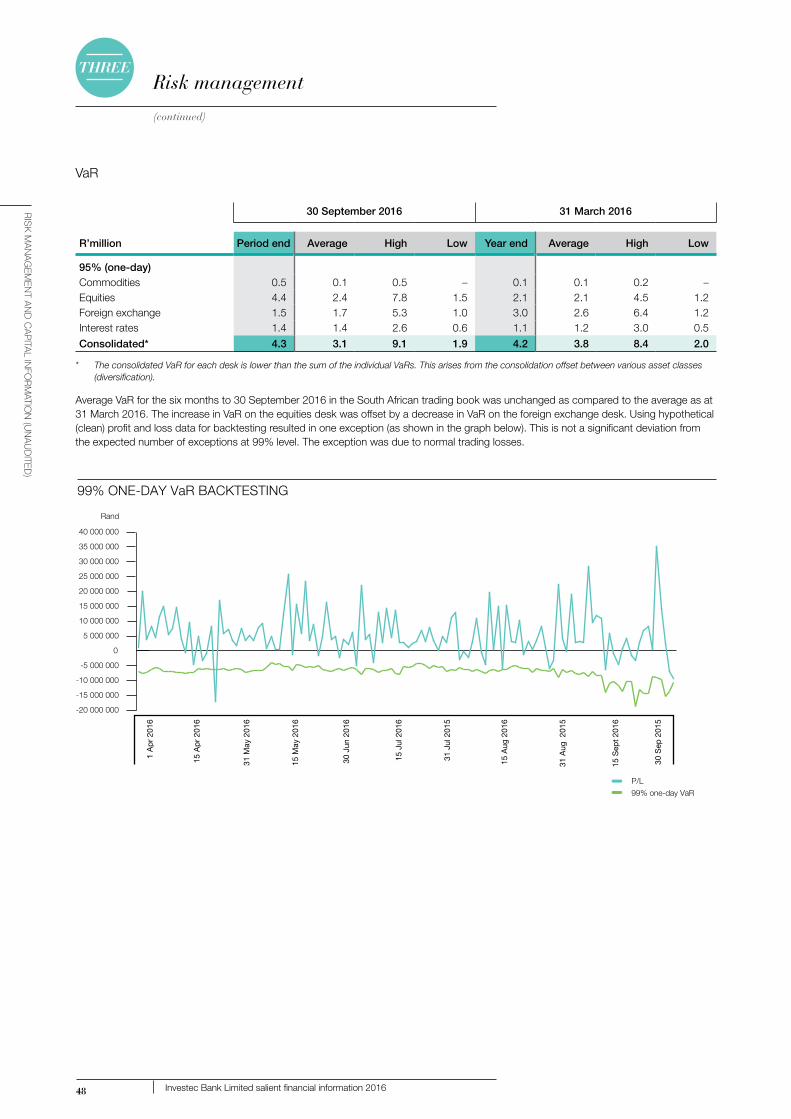
RIS
K M
AN
AG
EM
EN
T AN
D C
Ap
ITAl IN
foR
MATIo
N (u
NA
uD
ITED
)
THREE
(continued)
48 Investec Bank Limited salient financial information 2016
var
30 September 2016 31 March 2016
R’million Period end Average High Low Year end Average High Low
95% (one-day)commodities 0.5 0.1 0.5 – 0.1 0.1 0.2 –equities 4.4 2.4 7.8 1.5 2.1 2.1 4.5 1.2foreign exchange 1.5 1.7 5.3 1.0 3.0 2.6 6.4 1.2Interest rates 1.4 1.4 2.6 0.6 1.1 1.2 3.0 0.5
Consolidated* 4.3 3.1 9.1 1.9 4.2 3.8 8.4 2.0
* The consolidated VaR for each desk is lower than the sum of the individual VaRs. This arises from the consolidation offset between various asset classes (diversification).
average var for the six months to 30 September 2016 in the South african trading book was unchanged as compared to the average as at 31 march 2016. the increase in var on the equities desk was offset by a decrease in var on the foreign exchange desk. using hypothetical (clean) profit and loss data for backtesting resulted in one exception (as shown in the graph below). this is not a significant deviation from the expected number of exceptions at 99% level. the exception was due to normal trading losses.
P/L
99% one-day VaR
99% ONE-DAY VaR BACKTESTING
1 A
pr
2016
15 A
pr
2016
31 M
ay 2
016
15 M
ay 2
016
30 J
un 2
016
15 J
ul 2
016
15 A
ug 2
016
31 J
ul 2
015
31 A
ug 2
015
15 S
ept
2016
30 S
ep 2
015
Rand
-20 000 000
-15 000 000
-10 000 000
-5 000 000
0
5 000 000
10 000 000
15 000 000
20 000 000
25 000 000
30 000 000
35 000 000
40 000 000
Risk management

RIS
K M
AN
AG
EM
EN
T AN
D C
Ap
ITAl IN
foR
MATIo
N (u
NA
uD
ITED
)
THREE
(continued)
49Investec Bank Limited salient financial information 2016
etL 95% (one-day)
R’million30 Sept
201631 March
2016
commodities 0.7 0.2equities 5.1 5.0foreign exchange 2.2 4.5Interest rates 2.3 1.8Consolidated* 5.6 7.6
* The consolidated ETL for each desk is lower than the sum of the individual ETLs. This arises from the correlation offset between various asset classes (diversification).
StreSS teStIng
the table below indicates the potential losses that could arise if the portfolio is stress tested under extreme market conditions. the method used is known as extreme value theory (evt), the reported stress scenario below calculates the 99% evt which is a 1-in-8 year possible loss event. these numbers do not assume normality but rather rely on fitting a distribution to the tails of the distribution.
30 September 2016
R’million Period end Average High Low
31 March 2016
Year end
99% (using 99% EVT)
commodities 2.2 0.3 2.2 0.1 0.4
equities 34.0 31.3 71.7 19.0 30.9
foreign exchange 6.4 7.1 22.5 3.5 11.7
Interest rates 9.6 8.8 17.6 3.7 7.6
Consolidated** 32.1 32.4 74.4 14.3 39.3
** The consolidated ETL for each desk is lower than the sum of the individual ETLs. This arises from the correlation offset between various asset classes (diversification).
ProfIt and LoSS HIStogramS
the histogram below illustrates the distribution of daily revenue during the period for our trading businesses. the distribution is skewed to the profit side and the graph shows that positive trading revenue was realised on 100 days out of a total of 126 days in the trading business for the six months to 30 September 2016. the average daily trading revenue generated for the six months to 30 September 2016 was r2.9 million (31 march 2016: r2.1 million)
Risk management
Frequency: Days in the period
<-9.0 -8.0 -7.0 -6.0 -5.0 -4.0 -3.0 -2.0 -1.0 0 1.0 2.0 3.0 4.0 5.0 6.0 7.0 8.0 > 9.0
0
5
10
15
20
25
Pro�t/loss earned per day (R’million)
1
4
8
13 13
25 25
9 9
3
13
3
PROFIT AND LOSS

RIS
K M
AN
AG
EM
EN
T AN
D C
Ap
ITAl IN
foR
MATIo
N (u
NA
uD
ITED
)
THREE
(continued)
50 Investec Bank Limited salient financial information 2016
Balance sheet risk managementBaLance SHeet rISK deScrIPtIon
Balance sheet risk encompasses the financial risks relating to our asset and liability portfolios, comprising market liquidity, funding, concentration, non-trading interest rate and foreign exchange, encumbrance and leverage risks on balance sheet.
LIquIdIty rISK
Liquidity risk descriptionLiquidity risk is the risk that, despite being solvent, we have insufficient capacity to fund increases in assets, or are unable
only be able to do so with difficulty due to market disruptions or a lack of market liquidity.
Sources of liquidity risk include:
• unforeseen withdrawals of deposits
• restricted access to new funding with appropriate maturity and interest rate characteristics
• Inability to liquidate a marketable asset in a timely manner with minimal risk of capital loss
• unpredicted customer non-payment of loan obligations
• a sudden increased demand for loans in the absence of corresponding funding inflows of appropriate maturity.
to meet our payment obligations as they fall due, without incurring unacceptable losses. this includes repaying depositors or maturing wholesale debt. this risk is inherent in all banking operations and can be impacted by a range of institution- specific and market-wide events.
Liquidity risk is further broken down into:
• Funding liquidity: which relates to the risk that the bank will be unable to meet current and/or future cash flow or collateral requirements in the normal course of business, without adversely affecting its financial position or its reputation.
• Market liquidity: which relates to the risk that the bank may be unable to trade in specific markets or that it may
Risk management
R’million
0
30 000
60 000
90 000
120 000
150 000
CASH AND NEAR CASH TREND
Near cash (other ‘monetisable’ assets)
Near cash (central bank guranteed liquidity)
Cash
Oct 15 Dec 15 Jan 16Nov 15 Feb 16 Mar 16 Apr 16 May 16 Jun 16 Jul 16 Aug 16 Sep 16
AN ANALYSIS OF CASH AND NEAR CASH AT 30 SEPTEMBER 2016
BANK AND NON-BANK DEPOSITOR CONCENTRATION BY TYPE AT 30 SEPTEMBER 2016
41.2%
46.8%
12.0%
Cash
Central Bank cash placements and guaranteed liquidity
Near cash (other ‘monetisable’ assets)
R123 878 million
44.1%
19.2%
16.5%
10.2%
4.1%
5.9%
Other �nancials
Non-�nancial corporates
Individuals
Banks
Public sector
Small business
R323 837 million

RIS
K M
AN
AG
EM
EN
T AN
D C
Ap
ITAl IN
foR
MATIo
N (u
NA
uD
ITED
)
THREE
(continued)
51Investec Bank Limited salient financial information 2016
Risk management
The liquidity position of the bank remained sound with total cash and near cash balances amounting to R124 billion
Liquidity mismatch
the table that follows shows our contractual liquidity mismatch.
the table will not agree directly to the balances disclosed in the balance sheet since the table incorporates cash flows on a contractual, undiscounted basis based on the earliest date on which the group can be required to pay.
the table reflects that loans and advances to customers are largely financed by stable funding sources.
With respect to the contractual liquidity mismatch:
• no assumptions are made except as mentioned below, and we record all assets and liabilities with the underlying contractual maturity as determined by the cash flow profile for each deal
• as an integral part of the broader liquidity generation strategy, we maintain a liquidity buffer in the form of unencumbered cash, government, or rated securities and near cash against both expected and unexpected cash flows
• the actual contractual profile of this asset class is of little consequence, as practically Investec would meet any unexpected net cash outflows by repo’ing or selling these securities. We have:
– set the time horizon to ‘on demand’ to monetise our statutory liquid assets for which liquidity is guaranteed by the central bank;
– set the time horizon to one month to monetise our cash and near cash portfolio of ‘available-for-sale’ discretionary treasury assets, where there are deep secondary markets for this elective asset class; and
– reported the ‘contractual’ profile by way of a note to the tables.
With respect to the behavioural liquidity mismatch:
• Behavioural liquidity mismatch tends to display a fairly high probability, low severity liquidity position. many retail deposits, which are included within customer accounts, are repayable on demand or at short notice on a contractual basis. In practice, these instruments form a stable base for the group’s operations and liquidity needs because of the broad base of customers. to this end, behavioural profiling is applied to liabilities with an indeterminable maturity, as the contractual repayments of many customer accounts are on demand or at short notice but expected cash flows vary significantly from contractual maturity. an internal analysis model is used, based on statistical research of the historical series of products. this is used to identify significant additional sources of structural liquidity in the form of core deposits that exhibit stable behaviour. In addition, reinvestment behaviour, with profile and attrition based on history, is applied to term deposits in the normal course of business.

RIS
K M
AN
AG
EM
EN
T AN
D C
Ap
ITAl IN
foR
MATIo
N (u
NA
uD
ITED
)
THREE
(continued)
52 Investec Bank Limited salient financial information 2016
Contractual liquidity at 30 September 2016
R’million Demand
Up to one
month
One to three months
Three to six
months
Six months to one
year
One to five years
> Five years Total
cash and short-term funds – banks 34 775 3 686 751 – 37 1 423 – 40 672
cash and short-term funds –non-banks 9 952 5 219 42 – – – 10 218
Investment/trading assets and statutory liquids 47 548 15 760 6 845 1 351 1 932 19 702 31 017 124 155
Securitised assets 69 8 48 92 154 1 433 6 625 8 429
advances 6 977 4 432 13 241 14 657 20 583 104 145 50 753 214 788
other assets 5 521 459 214 1 126 137 – 5 689 13 146
Assets 104 842 24 350 21 318 17 268 22 843 126 703 95 834 411 408
deposits – banks (762) (1 711) (2 283) (2 722) (574) (24 868) (14) (32 934)
deposits – non-banks (131 365)^ (24 269) (47 445) (26 723) (29 573) (28 888) (2 640) (290 903)
negotiable paper (15) (7) (22) – (4 566) (808) – (5 418)
Securitised liabilities – – – – – – (728) (728)
Investment/trading liabilities (499) (790) (3 543) (6 160) (2 701) (15 960) (494) (30 147)
Subordinated liabilities – – – – – (758) (11 649) (12 407)
other liabilities – (117) (48) (175) (281) (148) (4 956) (5 725)
Liabilities (132 641) (26 894) (53 341) (35 780) (37 695) (71 430) (20 481) (378 262)
Shareholders’ funds – – – – – – (33 146) (33 146)
Contractual liquidity gap (27 799) (2 544) (32 023) (18 512) (14 852) 55 273 40 457 –
cumulative liquidity gap (27 799) (30 343) (62 366) (80 878) (95 730) (40 457) – –
^ Includes call deposits of R123.5 billion and the balance reflects term deposits which have finally reached/are reaching contractual maturity.
Behavioural liquidity
As discussed on page 51.
R’million Demand
Up to one
month
One to three months
Three to six
months
Six months to one
year
One to five years
> Five years Total
Behavioural liquidity gap 64 593 3 588 7 413 (3 065) (4 297) (147 366) 79 134 –
cumulative 64 593 68 181 75 594 72 529 68 232 (79 134) –
Risk management
non-tradIng IntereSt rate rISK deScrIPtIon
non-trading interest rate risk, otherwise known as interest rate risk in the banking book, is the impact on net interest earnings and sensitivity to economic value as a result of unexpected adverse movements in interest rates arising from the execution of our core business strategies and the delivery of products and services to our customers.
Sources of interest rate risk include:
• Repricing risk: arises from the timing differences in the fixed rate maturity and floating rate repricing of bank
assets, liabilities and off-balance sheet derivative positions. this affects the interest rate margin realised between lending income and borrowing costs when applied to our rate sensitive portfolios
• Yield curve risk: repricing mismatches also expose the bank to changes in the slope and shape of the yield curve
• Basis risk: arises from imperfect correlation in the adjustments of the rates earned and paid on different instruments with otherwise similar repricing characteristics
• Embedded option risk: we are not materially exposed to embedded option risk, as contract breakage penalties on
fixed-rate advances specifically cover this risk, while prepayment optionality is restricted to variable rate contracts and has no impact on interest rate risk
• Endowment risk: refers to the interest rate risk exposure arising from the net differential between interest rate insensitive assets, interest rate insensitive liabilities and capital.
the above sources of interest rate risk affect the interest rate margin realised between lending income and borrowing costs, when applied to our rate sensitive asset and liability portfolios, which has a direct effect on future net interest income and the economic value of equity.

RIS
K M
AN
AG
EM
EN
T AN
D C
Ap
ITAl IN
foR
MATIo
N (u
NA
uD
ITED
)
THREE
(continued)
53Investec Bank Limited salient financial information 2016
Risk management
Interest rate sensitivity gap
the table below shows our non-trading interest rate mismatch at 30 September 2016. these exposures affect the interest rate margin realised between lending income and borrowing costs assuming no management intervention.
R’million
Not > three months
> Three months
but < six months
> Six months
but < one year
> One year
but < five years
> Five years Non-rate
Totalnon-trading
cash and short-term funds – banks 30 191 185 37 – – 8 098 38 511
cash and short-term funds – non-banks 10 171 42 – – – 5 10 218
Investment/trading assets and statutory liquids 39 872 24 050 9 027 7 064 5 572 17 050 102 635
Securitised assets 8 429 – – – – – 8 429
advances 192 393 5 265 1 184 13 941 2 005 – 214 788
other assets 3 – – – – 4 081 4 084
Assets 281 059 29 542 10 248 21 005 7 577 29 234 378 665
deposits – banks (30 412) (2 098) (312) (112) – – (32 934)
deposits – non-banks (241 708) (19 497) (17 370) (9 155) (2 084) (1 039) (290 853)
negotiable paper (853) – (4 396) (169) – – (5 418)
Securitised liabilities (728) – – – – – (728)
Investment/trading liabilities (4 877) (3 388) – (574) – – (8 839)
Subordinated liabilities (10 805) (1 204) – (398) – – (12 407)
other liabilities (183) – (6) (19) – (4 058) (4 266)
Liabilities (289 566) (26 187) (22 084) (10 427) (2 084) (5 097) (355 445)
Intercompany loans 7 755 5 362 3 711 (4 592) (257) 1 888 13 867
Shareholders’ funds (1 121) – – – (386) (31 639) (33 146)
Balance sheet (1 873) 8 717 (8 125) 5 986 4 850 (5 614) 3 941
Off-balance sheet 8 842 (10 260) 5 157 (3 388) (4 479) 187 (3 941)
Repricing gap 6 969 (1 543) (2 968) 2 598 371 (5 427) –
cumulative repricing gap 6 969 5 426 2 458 5 056 5 427 – –
Economic value sensitivity at 30 September 2016
our preference for monitoring and measuring non-trading interest rate risk is economic value sensitivity. the table below reflects our economic value sensitivity to a 2% parallel shift in interest rates assuming no management intervention. the numbers represent the change to the value of the interest rate sensitive portfolios should such a hypothetical scenario arise. this sensitivity effect does not have a significant direct impact on our equity.
Sensitivity to the following interest rates (expressed in original currencies)
’million ZAR GBP USD EUR AUDOther(ZAR) All (ZAR)
200bps down 199.2 4.3 2.7 – 3.3 (0.8) 348.6
200bps up (132.7) (3.9) (6.5) (0.1) (1.2) 0.8 (305.7)

RIS
K M
AN
AG
EM
EN
T AN
D C
Ap
ITAl IN
foR
MATIo
N (u
NA
uD
ITED
)
THREE
(continued)
54 Investec Bank Limited salient financial information 2016
Risk management
LIquIdIty coverage ratIo (Lcr)
the objective of the Liquidity coverage ratio (Lcr) is to promote the short-term resilience of the liquidity risk profile of banks by ensuring that they have sufficient high quality liquid assets to survive a significant stress scenario lasting 30 calendar days.
In accordance with the provisions of section 6(6) of the South african Banks act 1990 (act no. 94 of 1990), banks are directed to comply with the relevant Lcr disclosure requirements, as set out in directive 6/2014 and directive 11/2014. this disclosure is in accordance with Pillar III of the Basel III liquidity accord.
the values in the table are calculated as the simple average of calendar daily values over the period 1 July 2016 to 30 September 2016 for Investec Bank Limited bank solo. all 62 business day observations were used. Investec Bank Limited consolidated group values use daily values for Investec Bank Limited bank solo, while those for other group entities use the average of July, august and September 2016 month-end values.
the minimum Lcr requirement is 70% throughout 2016 and will increase by 10% each year to 100% on 1 January 2019. this applies to both Investec Bank Limited bank solo and Investec Bank Limited consolidated group. Based on a recent Bank of mauritius proposal, Investec Bank mauritius (IBm) bank solo will also be required to meet the Lcr minimum requirement of 80% from the start of 2017.
Investec Bank Limited bank solo:
the main drivers of the Lcr results and the evolution of the contribution of inputs to the Lcr’s calculation over time:
• the structure and nature of deposits inside the 30-day window is the key driver of the Lcr. this weighted outflow is determined by the customer type of liabilities falling into the 30-day contractual bucket. In turn these deposit characteristics determine the targeted level of HqLa required to be held as a counterbalance to the modelled stressed outflows
• In order to manage the deposit mix in relation to tenor and client type, we establish targets for deposits to be raised by market, channel, product, tenor band and client type designed to restrict the weighted outflows falling into the 30-day window.
the composition of HqLa:
• the HqLa comprises primarily South african sovereign and central bank rand-denominated securities and debt instruments, all of which are eligible for SarB repo
• on average, Level 2 assets made up 3% of total HqLa and the SarB’s committed liquidity facility (cLf) contributed 7% to total HqLa
• Some foreign denominated government securities are included in the HqLa, subject to regulatory limitations.
changes since June 2016 quarter year end:
the average Lcr remains well surplus of regulatory requirements, decreasing by 4%, due to marginally higher growth in net cash outflows relative to HqLa.
Investec Bank Limited consolidated group:
our two banks, Investec Bank Limited (IBL) and Investec Bank (mauritius) Limited (IBm), contributed over 99% of the group’s combined HqLa and stressed cash inflows and outflows. IBm’s average stressed cash outflows of r6 billion are primarily to non-financial corporates, while its average stressed inflows of r9 billion is largely from banks. IBm bank solo currently has no Lcr requirement. there is no restriction on the contribution of IBm’s cash inflows to the group. consolidated group Lcr is better than IBL solo’s, mainly due to IBm’S surplus cash inflows.
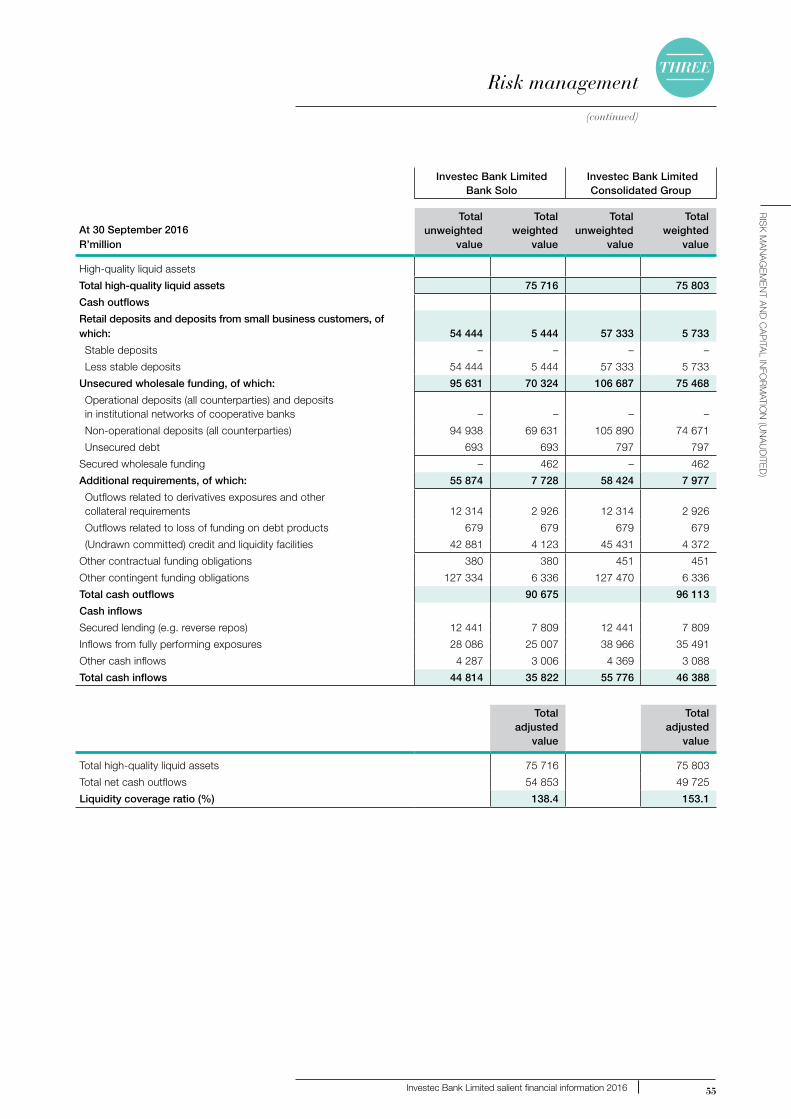
RIS
K M
AN
AG
EM
EN
T AN
D C
Ap
ITAl IN
foR
MATIo
N (u
NA
uD
ITED
)
THREE
(continued)
55Investec Bank Limited salient financial information 2016
Risk management
Investec Bank Limited Bank Solo
Investec Bank Limited Consolidated Group
At 30 September 2016 R’million
Total unweighted
value
Total weighted
value
Total unweighted
value
Total weighted
value
High-quality liquid assets
Total high-quality liquid assets 75 716 75 803
Cash outflows
Retail deposits and deposits from small business customers, of which: 54 444 5 444 57 333 5 733
Stable deposits – – – –
Less stable deposits 54 444 5 444 57 333 5 733
Unsecured wholesale funding, of which: 95 631 70 324 106 687 75 468
operational deposits (all counterparties) and deposits in institutional networks of cooperative banks – – – –
non-operational deposits (all counterparties) 94 938 69 631 105 890 74 671
unsecured debt 693 693 797 797
Secured wholesale funding – 462 – 462
Additional requirements, of which: 55 874 7 728 58 424 7 977
outflows related to derivatives exposures and other collateral requirements 12 314 2 926 12 314 2 926
outflows related to loss of funding on debt products 679 679 679 679
(undrawn committed) credit and liquidity facilities 42 881 4 123 45 431 4 372
other contractual funding obligations 380 380 451 451
other contingent funding obligations 127 334 6 336 127 470 6 336
Total cash outflows 90 675 96 113
Cash inflows
Secured lending (e.g. reverse repos) 12 441 7 809 12 441 7 809
Inflows from fully performing exposures 28 086 25 007 38 966 35 491
other cash inflows 4 287 3 006 4 369 3 088
Total cash inflows 44 814 35 822 55 776 46 388
Total adjusted
value
Total adjusted
value
total high-quality liquid assets 75 716 75 803
total net cash outflows 54 853 49 725
Liquidity coverage ratio (%) 138.4 153.1

RIS
K M
AN
AG
EM
EN
T AN
D C
Ap
ITAl IN
foR
MATIo
N (u
NA
uD
ITED
)
THREE
(continued)
56 Investec Bank Limited salient financial information 2016
Risk management
caPItaL Structure and caPItaL adequacy
R’million30 Sept
201631 March
2016
Tier 1 capital
Shareholders’ equity 31 612 30 331
Shareholders’ equity per balance sheet 33 146 31 865
Perpetual preference share capital and share premium (1 534) (1 534)
regulatory adjustments to the accounting basis 1 466 1 839
cash flow hedging reserve 1 466 1 839
deductions (692) (695)
goodwill and intangible assets net of deferred tax (692) (695)
Common equity tier 1 capital 32 386 31 475
Additional tier 1 capital 920 920
additional tier 1 instruments 1 534 1 534
Phase out of non-qualifying additional tier 1 instruments (614) (614)
Tier 1 capital 33 306 32 395
Tier 2 capital 12 522 10 726
collective impairments allowances 278 229tier 2 instruments 12 407 10 732 Phase out of non-qualifying tier 2 instruments (163) (235)
Total regulatory capital 45 828 43 121
Risk-weighted assets 307 062 295 752
Capital ratios
common equity tier 1 ratio 10.5% 10.6%
tier 1 ratio 10.8% 11.0%
total capital adequacy ratio 14.9% 14.6%
Leverage ratio 7.6% 7.3%

RIS
K M
AN
AG
EM
EN
T AN
D C
Ap
ITAl IN
foR
MATIo
N (u
NA
uD
ITED
)
THREE
(continued)
57Investec Bank Limited salient financial information 2016
Risk management
caPItaL requIrementS
R’million30 Sept
201631 March
2016
Capital requirements 31 858 30 684
credit risk – prescribed standardised exposure classes 24 369 23 603
corporates 12 704 13 278
Secured on real estate property 2 744 2 943
Short-term claims on institutions and corporates 6 119 4 876
retail 530 483
Institutions 537 813
other exposure classes 1 517 806
Securitisation exposures 218 404
equity risk 4 421 4 005
Listed equities 369 305
unlisted equities 4 052 3 700
counterparty credit risk 472 569
credit valuation adjustment risk 198 185
market risk 443 475
Interest rate 86 66
foreign exchange 116 212
commodities 4 4
equities 237 193
operational risk – standardised approach 1 955 1 847
Risk-weighted assets 307 062 295 752
credit risk – prescribed standardised exposure classes 234 883 227 504
corporates 122 448 127 985
Secured on real estate property 26 450 28 361
Short-term claims on institutions and corporates 58 978 47 001
retail 5 108 4 660
Institutions 5 172 7 838
other exposure classes 14 624 7 766
Securitisation exposures 2 103 3 893
equity risk 42 609 38 603
Listed equities 3 556 2 937
unlisted equities 39 053 35 666
counterparty credit risk 4 548 5 486
credit valuation adjustment risk 1 912 1 783
market risk 4 269 4 578
Interest rate 831 636
foreign exchange 1 117 2 039
commodities 35 46
equities 2 286 1 857
operational risk – standardised approach 18 841 17 798

RIS
K M
AN
AG
EM
EN
T AN
D C
Ap
ITAl IN
foR
MATIo
N (u
NA
uD
ITED
)
THREE
(continued)
58 Investec Bank Limited salient financial information 2016
Risk management
movement In totaL reguLatory caPItaL
the table below analyses the movement in common equity tier 1, additional tier 1 and tier 2 capital during the year.
Total regulatory capital flow statement
R’million30 Sept
201631 March
2016
Opening common equity tier 1 capital 31 475 28 315
dividends (965) (120)
Profit after taxation 1 611 3 475
movement in other comprehensive income 635 (389)
goodwill and intangible assets (deduction net of related tax liability) 3 (505)
other, including regulatory adjustments and transitional arrangements (373) 699
Closing common equity tier 1 capital 32 386 31 475
opening additional tier 1 capital 920 1 073
other, including regulatory adjustments and transitional arrangements – (153)
Closing additional tier 1 capital 920 920
Closing tier 1 capital 33 306 32 395
Opening tier 2 capital 10 726 10 319
new tier 2 capital issues 1 682 1 360
redeemed capital (184) (1 283)
collective impairment allowances 48 60
other, including regulatory adjustments and transitional arrangements 250 270
Closing tier 2 capital 12 522 10 726
Closing total regulatory capital 45 828 43 121
a Summary of caPItaL adequacy and Leverage ratIoS
30 Sept2016
31 Mar2016
common equity tier 1 (as reported) 10.5% 10.6%
common equity tier 1 (“fully loaded”)^^ 10.5% 10.6%
tier 1 (as reported) 10.8% 11.0%
total capital adequacy ratio (as reported) 14.9% 14.6%
Leverage ratio** – permanent capital 7.7%# 7.5%#
Leverage ratio** – current 7.6%# 7.3%#
Leverage ratio** – (“fully loaded”)^^ 7.4%# 7.1%#
^^ Based on the group’s understanding of current and draft regulations, “fully loaded” is based on Basel III capital requirements as fully phased in by 2022.** The leverage ratios are calculated on an end-quarter basis.# Based on revised BIS rules.

RIS
K M
AN
AG
EM
EN
T AN
D C
Ap
ITAl IN
foR
MATIo
N (u
NA
uD
ITED
)
THREE
(continued)
59Investec Bank Limited salient financial information 2016
Risk management
Summary comParISon of accountIng aSSetS verSuS Leverage ratIo exPoSure meaSure
Line # R’million30 Sept
201631 March
2016
1 total consolidated assets as per published financial statements 411 408 405 629
adjustments for:
2 Investments in banking, financial, insurance or commercial entities that are consolidated for accounting purposes but outside the scope of regulatory consolidation – –
3 fiduciary assets recognised on the balance sheet pursuant to the operative accounting framework but excluded from the leverage ratio exposure measure – –
4 derivative financial instruments (2 687) (2 973)
5 Securities financing transactions (i.e. repos and similar secured lending) (3 587) 389
6 off-balance sheet items (i.e. conversion to credit equivalent amounts of off-balance sheet exposures) 34 322 38 519
7 other adjustments (691) (693)
8 Leverage ratio exposure 438 765 440 871
Leverage ratIo common dIScLoSure temPLate
Line # R’million30 Sept
201631 March
2016
Leverage ratio framework
1 on-balance sheet items (excluding derivatives and Sfts, but including collateral) 369 707 350 873
2 asset amounts deducted in determining Basel III tier 1 capital (1 878) (693)
3 Total on-balance sheet exposures (excluding derivatives and SFTs) (sum of lines 1 and 2) 367 829 350 180
4 replacement cost associated with all derivatives transactions (i.e. net of eligible cash variation margin) 7 259 9 673
5 add-on amounts for Pfe associated with all derivatives transactions 2 775 3 197
6 gross-up for derivatives collateral provided where deducted from the balance sheet assets pursuant to the operative accounting framework – –
7 deductions of receivables assets for cash variation margin provided in derivatives transactions – –
8 exempted ccP leg of client-cleared trade exposures (900) –
9 adjusted effective notional amount of written credit derivatives – –
10 adjusted effective notional offsets and add-on deductions for written credit derivatives – –
11 Total derivative exposures (sum of lines 4 to 10) 9 134 12 870
12 gross Sft assets (with no recognition of netting), after adjusting for sales accounting transactions 26 090 34 936
13 netted amounts of cash payables and cash receivables of gross Sft assets – –
14 counterparty credit risk (ccr) exposures for Sft assets 1 391 4 366
15 agent transaction exposures – –
16 Total securities financing transaction exposures (sum line 12 to 15) 27 481 39 302
17 off-balance sheet exposure at gross notional amount 84 693 90 589
18 adjustments for conversion to credit equivalent amounts (50 372) (52 070)
19 Off-balance sheet items (sum line 17 and 18) 34 321 38 519
20 tier 1 capital 33 306 32 395
21 Total exposures (sum of lines 3, 11, 16 and 19) 438 765 440 871
22 Basel III leverage ratio 7.6% 7.3%

RIS
K M
AN
AG
EM
EN
T AN
D C
Ap
ITAl IN
foR
MATIo
N (u
NA
uD
ITED
)
THREE
60 Investec Bank Limited salient financial information 2016
Investec Bank Limiteda subsidiary of Investec Limited
fanI tItI (54)
non-executive chairmanBSc (Hons), MA, MBA
davId m LaWrence (65)
deputy chairmanBA (Econ) (Hons), MCom
SamueL e aBraHamS (77)
FCA, CA(SA)
ZarIna Bm BaSSa (52)
BAcc, DipAcc, CA(SA)
gLynn r Burger (59)
BAcc, CA(SA), H Dip BDP, MBL
davId frIedLand (63)
BCom, CA(SA)
Bernard Kantor (66)
CTA
StePHen KoSeff (64)
BCom, CA(SA), H Dip BDP, MBA
KHumo L SHuenyane (45)
BEcon, CA(England & Wales)
nISHLan SamuJH (42)
CA(SA)
BradLey taPnacK (69)
BCom, CA(SA)
Peter rS tHomaS (71)
CA(SA)
rIcHard J WaInWrIgHt (53)
chief executive officerBCom, CTA, CA(SA)
Directorate

FourAnnexures
(unaudited)
Investec Bank Limited salient financial information 2016

an
ne
xu
re
s
FOUR
62 Investec Bank Limited salient financial information 2016
Annexure 1 Dividend announcement
InveStec BanK LImIted
Incorporated in the republic of South africa registration number: 1969/004763/06 Share code: InLP ISIn: Zae000048393
Preference share dividend announcement
Non-redeemable non-cumulative non-participating preference shares (“preference shares”)declaration of dividend number 27
notice is hereby given that preference dividend number 27 has been declared by the Board from income reserves for the period 1 april 2016 to 30 September 2016 amounting to a gross preference dividend of 438.68108 cents per share payable to holders of the non-redeemable non-cumulative non-participating preference shares as recorded in the books of the company at the close of business on friday, 02 december 2016.
the relevant dates for the payment of dividend number 27 are as follows:
Last day to trade cum-dividend tuesday, 29 november 2016
Shares commence trading ex-dividend Wednesday, 30 november 2016
record date friday, 02 december 2016
Payment date monday, 12 december 2016
Share certificates may not be dematerialised or rematerialised between Wednesday, 30 november 2016 and friday, 02 december 2016, both dates inclusive.
additional information to take note of: • Investec Bank Limited tax reference number: 9675/053/71/5• the issued preference share capital of Investec Bank Limited is 15 447 630 preference shares in this specific class• the dividend paid by Investec Bank Limited is subject to South african dividend tax (dividend tax) of 15% (subject to any available
exemptions as legislated)• the net dividend amounts to 372.87892 cents per preference share for shareholders liable to pay the dividend tax and 438.68108 cents
per preference share for preference shareholders exempt from paying the dividend tax.
By order of the board
N van Wyk company Secretary
16 november 2016

an
ne
xu
re
s
FOUR
63Investec Bank Limited salient financial information 2016
Operating costsFor the six months to 30 September
R’million 2016 2015
Staff costs 2 084 2 055
Premises expenses (excluding depreciation) 209 188
equipment expenses (excluding depreciation) 97 111
Business expenses 222 196
marketing expenses 203 183
depreciation, amortisation and impairment of property, equipment and intangibles 79 78
2 894 2 811
Reverse repurchase agreements and cash collateral on securities borrowed and repurchase
agreements and cash collateral on securities lent R’million
30 Sept 2016
31 March 2016
Assets
reverse repurchase agreements 26 124 33 444
cash collateral on securities borrowed 4 944 5 468
31 068 38 912
Liabilities
repurchase agreements 16 721 16 916
16 721 16 916
Extract of other debt securities R’million
30 Sept 2016
31 March 2016
Bonds 8 039 11 150
commercial paper 78 84
floating rate notes 1 327 1 103
Liquid asset 298 298
asset-based securities 1 019 –
other investments 635 126
11 396 12 761
Extract of securities arising from trading activities R’million
30 Sept 2016
31 March 2016
Bonds 677 595
Listed equities 147 397
824 992
Extract of loans and advances to customers and other loans and advances R’million
30 Sept 2016
31 March 2016
gross loans and advances to customers 215 610 208 182
Impairments of loans and advances to customers (1 158) (910)
Specific impairments (880) (680)
Portfolio impairments (278) (230)
Net loans and advances to customers 214 452 207 272
gross other loans and advances to customers 365 398
Impairments of other loans and advances to customers (29) (31)
Specific impairments (6) (11)
Portfolio impairments (23) (20)
Net other loans and advances to customers 336 367
Annexure 2 Additional note disclosures

an
ne
xu
re
s
FOUR
(continued)
64 Investec Bank Limited salient financial information 2016
Annexure 2 Additional note disclosures
Extract of securitised assets and liabilities arising on securitisation R’million
30 Sept 2016
31 March 2016
gross own originated loans and advances to customers securitised 8 329 7 973Impairments of own originated loans and advances to customers securitised (6) (6)
Specific impairments (1) (1)Portfolio impairments (5) (5)
Net own originated loans and advances to customers securitised 8 323 7 967
Total other securitised assets 106 115
Other assets R’million
30 Sept 2016
31 March 2016
Settlement debtors 758 521trading properties 99 176Prepayments and accruals 792 316trading initial margins 462 324Investec Import Solutions debtors 1 607 1 456fee debtors 15 17other 618 846
4 351 3 656
Debt securities in issue R’million
30 Sept 2016
31 March 2016
repayable in:Less than three months 163 2 267three months to one year 4 442 170one to five years 813 5 228
5 418 7 665
Other liabilities R’million
30 Sept 2016
31 March 2016
Settlement liabilities 810 1 021other creditors and accruals 2 471 2 730other non-interest-bearing liabilities 1 593 1 291
4 874 5 042
Extract of perpetual preference share capital R’million
30 Sept 2016
31 March 2016
Perpetual preference share capital * *Perpetual preference share premium 1 534 1 534
1 534 1 534* Less than R1 million.
Extract of deferred taxation R’million
30 Sept 2016
31 March 2016
Losses carried forward 1 11 1
Extract of subordinated liabilities R’million
30 Sept 2016
31 March 2016
Issued by Investec Bank Limited 12 406 10 732Remaining maturities:In one year or less, or on demand 3 638 –In more than one year, but not more than two years 400 –In more than two years, but not more than five years 2 250 400In more than five years 6 118 10 332
12 406 10 732

an
ne
xu
re
s
FOUR
(continued)
65Investec Bank Limited salient financial information 2016
Offsetting
Amounts subject to enforceable
netting arrangements
Effects of offsetting on balance sheet
Related amounts not offset
At 30 September 2016Gross
amountsAmounts
offset
Net amountsreported on the balance
sheet
Financialinstruments
(includingnon-cashcollateral)
Net amount
Assets
cash and balances at central banks 8 101 – 8 101 – 8 101
Loans and advances to banks 40 803 (8 232) 32 571 – 32 571
non-sovereign and non-bank cash placements 10 218 – 10 218 – 10 218
reverse repurchase agreements and cash collateral on securities borrowed 31 068 – 31 068 – 31 068
Sovereign debt securities 47 800 – 47 800 (1 376) 46 424
Bank debt securities 8 294 – 8 294 (2 928) 5 366
other debt securities 11 396 – 11 396 (4 529) 6 867
derivative financial instruments 16 089 (4 268) 11 821 (4 228) 7 593
Securities arising from trading activities 824 – 824 (56) 768
Investment portfolio 7 073 – 7 073 – 7 073
Loans and advances to customers 216 367 (1 915) 214 452 – 214 452
own originated loans and advances to customers securitised 8 323 – 8 323 – 8 323
other loans and advances 336 – 336 – 336
other securitised assets 106 – 106 – 106
other assets 4 351 – 4 351 – 4 351
411 149 (14 415) 396 734 (13 117) 383 617
Liabilities
deposits by banks 34 252 (1 318) 32 934 – 32 934
derivative financial instruments 23 079 (11 182) 11 897 (4 228) 7 669
other trading liabilities 1 529 – 1 529 – 1 529
repurchase agreements and cash collateral on securities lent 16 721 – 16 721 (8 889) 7 832
customer accounts (deposits) 292 818 (1 915) 290 903 – 290 903
debt securities in issue 5 418 – 5 418 – 5 418
Liabilities arising on securitisation of own originated loans and advances 728 – 728 – 728
other liabilities 4 874 – 4 874 – 4 874
Subordinated liabilities 12 407 – 12 407 – 12 407
391 826 (14 415) 377 411 (13 117) 364 294
Annexure 2 Additional note disclosures

an
ne
xu
re
s
FOUR
(continued)
66 Investec Bank Limited salient financial information 2016
Annexure 2 Additional note disclosures
Amounts subject to enforceable
netting arrangements
Effects of offsetting on balance sheet
Related amounts not offset
At 31 March 2016Gross
amountsAmounts
offset
Net amountsreported on the balance
sheet
Financialinstruments
(includingnon-cashcollateral)
Net amount
Assets
cash and balances at central banks 7 801 – 7 801 – 7 801
Loans and advances to banks 40 148 (13 369) 26 779 – 26 779
non-sovereign and non-bank cash placements 9 858 – 9 858 – 9 858
reverse repurchase agreements and cash collateral on securities borrowed 38 912 – 38 912 – 38 912
Sovereign debt securities 41 325 – 41 325 – 41 325
Bank debt securities 13 968 – 13 968 (6 947) 7 021
other debt securities 12 761 – 12 761 (9 178) 3 583
derivative financial instruments 19 647 (3 804) 15 843 (7 540) 8 303
Securities arising from trading activities 992 – 992 (49) 943
Investment portfolio 6 360 – 6 360 – 6 360
Loans and advances to customers 208 679 (1 407) 207 272 – 207 272
own originated loans and advances to customers securitised 7 967 – 7 967 – 7 967
other loans and advances 367 – 367 – 367
other securitised assets 115 – 115 – 115
other assets 3 656 – 3 656 – 3 656
412 556 (18 580) 393 976 (23 714) 370 262
Liabilities
deposits by banks 38 780 (1 538) 37 242 – 37 242
derivative financial instruments 29 059 (15 635) 13 424 (7 540) 5 884
other trading liabilities 1 405 – 1 405 – 1 405
repurchase agreements and cash collateral on securities lent 16 916 – 16 916 (15 325) 1 591
customer accounts (deposits) 281 143 (1 407) 279 736 – 279 736
debt securities in issue 7 665 – 7 665 – 7 665
Liabilities arising on securitisation of own originated loans and advances 809 – 809 – 809
other liabilities 5 042 – 5 042 – 5 042
Subordinated liabilities 10 732 – 10 732 – 10 732
391 551 (18 580) 372 971 (22 865) 350 106

FOUR
67Investec Bank Limited salient financial information 2016
Notes

FOUR
68 Investec Bank Limited salient financial information 2016
Notes


2016
2016
Specialist Banking
Investec Bank Limited
Salient �nancial informationfor the six months ended30 September 2016


