Page 1
INVESTIGATE THE EFECTIVENESS OF STOP DRILL HOLE IN DELAYING
CRACK FROM CRACK INITIATION
SYAFIQ BIN HASHIM
Thesis submitted in fulfilment of the requirements for the award of the degree of
Bachelor of Mechanical Engineering
Faculty of Mechanical Engineering
UNIVERSITI MALAYSIA PAHANG
JUNE 2012
Page 2
v
ABSTRACT
Many failures in engineering applications or machine components have been caused
by a crack initiated from points at which stress was concentrated. As the stress
concentration level is higher than a critical value, continuous crack-growth results
in failure in the machine components. Crack initiation behavior has been evaluated
to prevent an early failure of machine equipment. Delaying the crack initiation is
important for the maintenance of machine elements as well as for the detection of
crack initiation. Hence, the main objective of this study is to investigate the delay of
crack using stop drilled holes. The investigation was based on the diameter of the
stop drilled holes, the location of stop drilled hole and the ancillary stop hole
drilled. The experiment and selected experiment on finite element analysis were
done in order to validate the result. The experiment was carried out by using tensile
test to obtain maximum applied load to the specimen while the finite element
analysis was analyzed by using ALGOR software to obtain the stress of the
specimen.The experimental results and the finite element analysis results show that
the crack initiation life of the specimen was longer when the diameter of the stop
drilled holes increased. The further the location of the stop drilled holes with the
slits location, the longer crack initiation life of the specimen. The influence of extra
stop-hole drill increase more time for delaying the crack on the specimen. From the
experiment the longest time on delaying crack propagation is 92.32% increase
compare before install stop-hole drill gained from Experiment 3. Thus, the
influence of the stop drilled holes on the crack initiation life has been proved.
Page 3
vi
ABSTRAK
Kebanyakan kegagalan dalam bidang kejuruteraan dan komponen mesin adalah
disebabkan permulaan retak yang bermula dari titik pada tekanan yang tertentu.
Apabila paras penumpuan tegasan adalah lebih tinggi daripada nilai kritikal bahan,
kesinambungan keretakan akan menyebabkan kegagalan dalam komponen mesin.
Permulaan retak telah dinilai bagi mencegah kegagalan awal dalam komponen
mesin. Melambatkan permulaan retak adalah penting bagi tujuaan penyeliaan
elemen-elemen dalam mesin. Maka, objektif utama kajian ini adalah untuk
mengkaji kelambatan permulaan retak dengan menggunakan penahan lubang yang
ditebuk ke atas besi lembut. Kajian adalah berdasarkan diameter, susunan penahan
lubang dan penambahan penahn lubang. Eksperimen dan juga analisis finite element
yang telah dipilih dijalankan untuk mengesahkan keputusan ujikaji. Eksperimen
telah dijalankan dengan munggunakan mesin tegangan untuk mendapatkan daya
maksimum yang dikenakan ke atas spesimen manakala analisis finite element
dianalisis menggunakan perisian ALGOR bagi mendapatkan nilai tekanan yang
dikenakan ke atas spesimen. Keputusan eksperimen dan analisis finite element
menunjukkan hayat permulaan retak lebih adalah lebih lama apabila saiz diameter
penahan lubang dititngkatkan. Semakin jauh lokasi penahan lubang dari lokasi
belahan, semakin lama hayat permulaan retak. Pengaruh daripada kehadiran ekstra
penahan lubang juga meningkatkan lagi masa untuk menahan retak pada spesimen.
Daripada eksperimen , masa terpanjang untuk melambatkan perambatan retak
adalah 92.32% peningkatan berbanding sebelum menebuk penahan lubang yang
diperolehi daripada eksperimen 3. Oleh itu, pengaruh penahan lubang pada
permulaan retak telah dibuktikan.
Page 4
vii
TABLE OF CONTENTS
Page
SUPERVISOR’S DECLARATION ii
STUDENT’S DECLARATION iii
ACKNOWLEDGEMENTS iv
ABSTRACT v
ABSTRAK vi
TABLE OF CONTENTS vii
LIST OF TABLES x
LIST OF FIGURES xii
LIST OF SYMBOLS xv
LIST OF ABBREVIATIONS xvi
CHAPTER 1 INTRODUCTION
1.1 Project Background 1
1.2 Problem Statement 2
1.3 Scope Of Study 2
1.4 Objectives of the Project 3
1.5 Summary 3
CHAPTER 2 LITERATURE REVIEW
2.1 Introduction 4
2.2 Crack 4
2.2.1 Concept of Fracture Mechanic 5
2.2.1.1 Crack modes and stress intensity factor 5
2.2.1.2 Plastic zone at the crack tip 8
2.2.2 Factors influencing crack initiation behaviour 9
2.2.2.1 Stress Concentration factor 10
2.2.2.2 Fatigue notch factor 11
2.3 STOP-HOLE DRILL 12
2.3.1 Stop-hole Parameters 13
2.3.1.1 Diameter of stop-hole drill 13
Page 5
viii
2.3.1.2 Location of stopping holes 21
2.3.1.3 Additional of stop-holes 26
CHAPTER 3 METHODOLOGY
3.1 Flow Chart 37
3.2 Materials and Specimens 38
3.3 Stop Drilling Procedure 41
3.3.1 Specimen for Experiment 1 41
3.3.2 Specimen for Experiment 2 42
3.3.3 Specimen for Experiment 3 47
3.4 Tensile test 48
3.5 Finite element analysis 50
3.6 Model Validation 51
CHAPTER 4 RESULT AND DISCUSSION
4.1 Introduction 52
4.2 Tensile Machine Results 52
4.2.1 Result of Experiment 1 52
4.2.2 Result of Experiment Two 55
4.2.2.1Result of Category A 55
4.2.2.2 Result of Category B 57
4.2.3 Experiment 3 60
4.3 Result of Numerical Analysis 62
4.3.1 FEA Result Crack Plate 62
4.3.2 FEA Result Experiment 1 66
4.3.2.1 FEA Result Experiment 2 Category A 69
4.4 Result Validation 71
CHAPTER 5 CONCLUSION
5.1 Conclusion 74
5.2 Recommendation 75
Page 6
ix
REFERENCES 76
APPENDICES
79
A1 Gantt chart for FYP1 79
A2 Gantt chart for FYP 2 80
B1 Crack behaviour on crack plate 81
B2 Crack behaviour on Experiment 1, diameter ∅ 2.8mm 82
B3 Specimen preparation for Experiment 2, category A at 11.2mm
from the edge specimen
83
B4 Specimen preparation for Experiment 2, category B (x=3.6mm,
y=3.6mm)
84
B5 Crack behaviour on Experiment 2, category B (x=3.6mm,
y=3.6mm)
85
B6 Specimen Preparation for Experiment 3 86
B7 Crack behaviour for Experiment 3 87
C1 Data for Crack test 88
C2 Data for Experiment (Figure 4.1) 89
C3 Data for Experiment 2, category A (Figure 4.2) 90
C4 Data for Experiment 2 Category B, y-axis constant 3.6mm
(Figure 4.3)
91
C5 Data for Experiment 2 Category B, y-axis constant 5.2mm
(Figure 4.4)
92
C6 Data for Experiment 3 (Figure 4.5) 93
Page 7
x
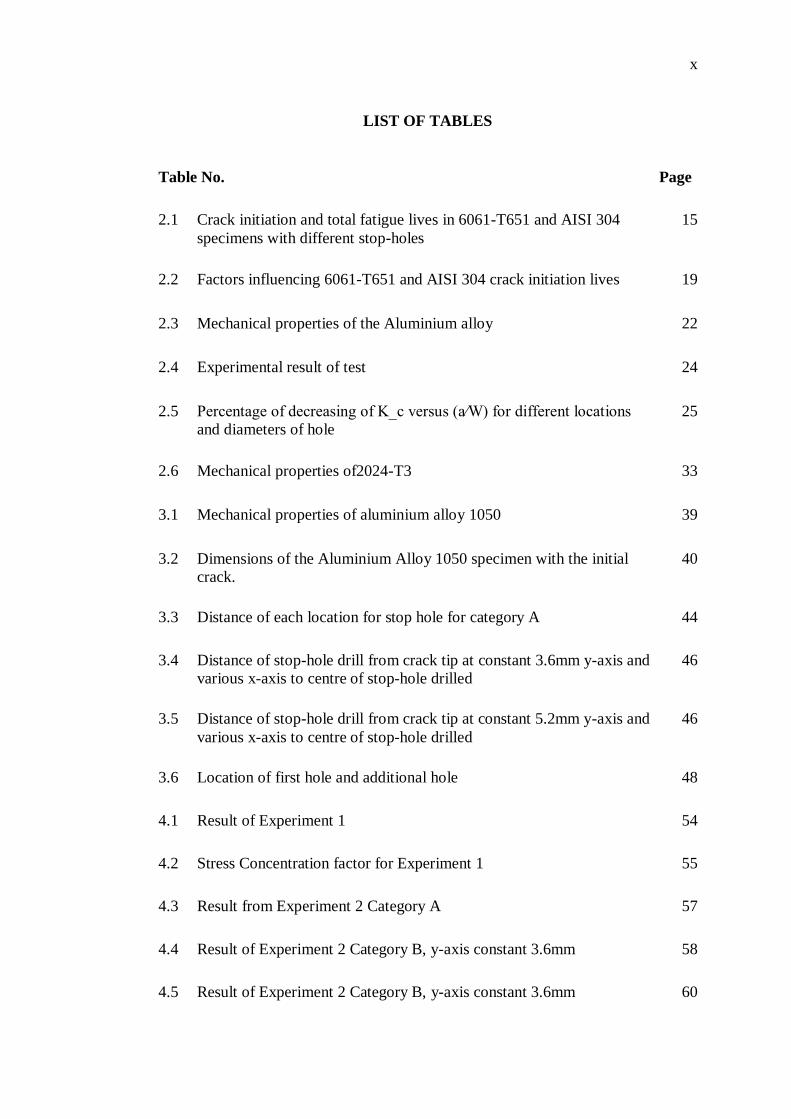
LIST OF TABLES
Table No. Page
2.1 Crack initiation and total fatigue lives in 6061-T651 and AISI 304
specimens with different stop-holes
15
2.2 Factors influencing 6061-T651 and AISI 304 crack initiation lives 19
2.3 Mechanical properties of the Aluminium alloy 22
2.4 Experimental result of test 24
2.5 Percentage of decreasing of K_c versus (a⁄W) for different locations
and diameters of hole
25
2.6 Mechanical properties of2024-T3 33
3.1 Mechanical properties of aluminium alloy 1050 39
3.2 Dimensions of the Aluminium Alloy 1050 specimen with the initial
crack.
40
3.3 Distance of each location for stop hole for category A 44
3.4 Distance of stop-hole drill from crack tip at constant 3.6mm y-axis and
various x-axis to centre of stop-hole drilled
46
3.5 Distance of stop-hole drill from crack tip at constant 5.2mm y-axis and
various x-axis to centre of stop-hole drilled
46
3.6 Location of first hole and additional hole 48
4.1 Result of Experiment 1 54
4.2 Stress Concentration factor for Experiment 1 55
4.3 Result from Experiment 2 Category A 57
4.4 Result of Experiment 2 Category B, y-axis constant 3.6mm 58
4.5 Result of Experiment 2 Category B, y-axis constant 3.6mm 60
Page 8
xi
4.6 Comparison of distance of y-axis for constant 3.6mm and 5.2mm 60
4.7 Result of Experiment 3 62
4.8 Distribution of stress along the cut of crack plate 65
4.9 Von Misses Stress along x-axis (denote as triangle, Figure 4.11),
Experiment 1
67
4.10 Von Misses Stress along x-axis (denote as triangle, Figure 4.11)
Experiment 2, category A
70
4.11 Result comparison experiment 1 72
4.12 Result comparison experiment 2, category A 73
Page 9
xii
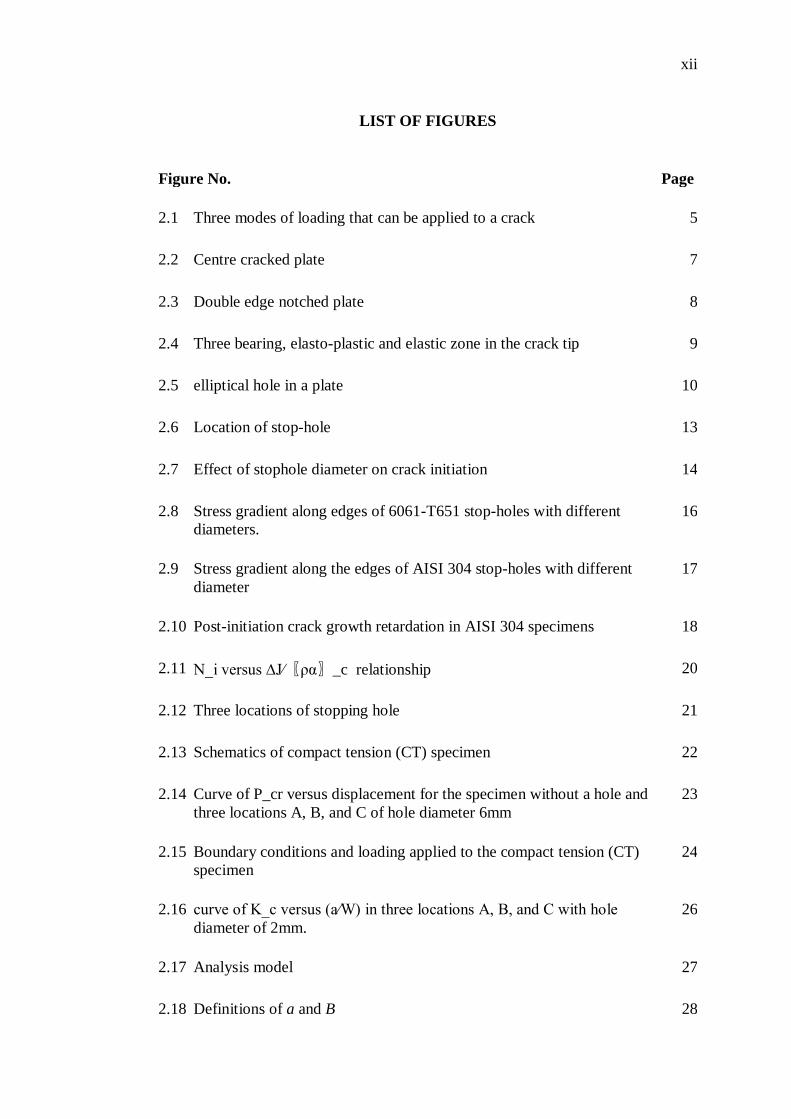
LIST OF FIGURES
Figure No. Page
2.1 Three modes of loading that can be applied to a crack 5
2.2 Centre cracked plate 7
2.3 Double edge notched plate 8
2.4 Three bearing, elasto-plastic and elastic zone in the crack tip 9
2.5 elliptical hole in a plate 10
2.6 Location of stop-hole 13
2.7 Effect of stophole diameter on crack initiation 14
2.8 Stress gradient along edges of 6061-T651 stop-holes with different
diameters.
16
2.9 Stress gradient along the edges of AISI 304 stop-holes with different
diameter
17
2.10 Post-initiation crack growth retardation in AISI 304 specimens 18
2.11 N_i versus ∆J⁄〖ρα〗_c relationship 20
2.12 Three locations of stopping hole 21
2.13 Schematics of compact tension (CT) specimen 22
2.14 Curve of P_cr versus displacement for the specimen without a hole and
three locations A, B, and C of hole diameter 6mm
23
2.15 Boundary conditions and loading applied to the compact tension (CT)
specimen
24
2.16 curve of K_c versus (a⁄W) in three locations A, B, and C with hole
diameter of 2mm.
26
2.17 Analysis model 27
2.18 Definitions of a and B 28
Page 10
xiii
2.19 Stress concentration factor, K_t at point A in various angles of Ɵ with
δ=1.6mm ;(a) d_1=2mm (b)d_1=3.2mm
29
2.20 Stress concentration factor, K_t at point A in various angles of Ɵ with
δ=0.8mm ;(a) d_1=2mm (b)d_1=3.2mm
30
2.21 Relationship between stress concentration factor, K_t at point A and
ratio of various hole diameters R_d with θ=0°, where R_d=d_2⁄d_1 ; (a)
d_1=2mm
32
2.22 Geometry of specimen 33
2.23 Schematic representation of the stop-hole drill method of the specimen
experiments of base type (a), and (b) and (c) the case where adding an
hole
34
2.24 Fatigue lives of specimens where δ=0.8mm and θ=0° under applied
stress σ_a=62MPa
35
3.1 Project flow chart 38
3.2 Schematics of Aluminium Alloy 1050 40
3.3 Actual specimen of Aluminium Alloy 1050 with initial Crack 41
3.4 Specimen for Experiment 1 42
3.5 Specimen for Experiment 2 for category A 43
3.6 Specimen for Experiment 2 for category B 45
3.7 Specimen for Experiment 3 47
3.8 Universal Tensile Machine DTU-900 MH Series 49
3.9 Clamping position of the plate 50
3.10 Meshed Specimen using ALGOR software 51
4.1 Graph of Experiment 1 53
4.2 Graph of Experiment 2 Category A 56
4.3 Graph of Experiment 2 Category B, y-axis constant 3.6mm 58
Page 11
xiv
4.4 Graph of Experiment 2 Category B, y-axis constant 5.2mm 59
4.5 Graph of Experiment 3 61
4.6 Model of Crack Plate 63
4.7 Model of Crack plate half cut 63
4.8 Von Misses Stress of Crack Plate 64
4.9 View at Max Von misses Stress of Crack Plate 65
4.10 Crack Von Misses Stress along the cut of x-axis (Figure 4.8, denote by
triangle shape)
66
4.11 Model specimen for experiment 1 67
4.12 Experiment 1 Von Misses Stress along the cut of x-axis (Figure 4.11,
denote by triangle shape)
68
4.13 simulation of Maximum Von Misses Stress for Experiment 1 69
4.14 Experiment 2, Category A Von Misses Stress along the cut of x-axis
(Figure 4.11, denote by triangle shape)
70
4.15 ALGOR simulation of Maximum Von Misses Stress for Experiment 2,
category A
71
Page 12
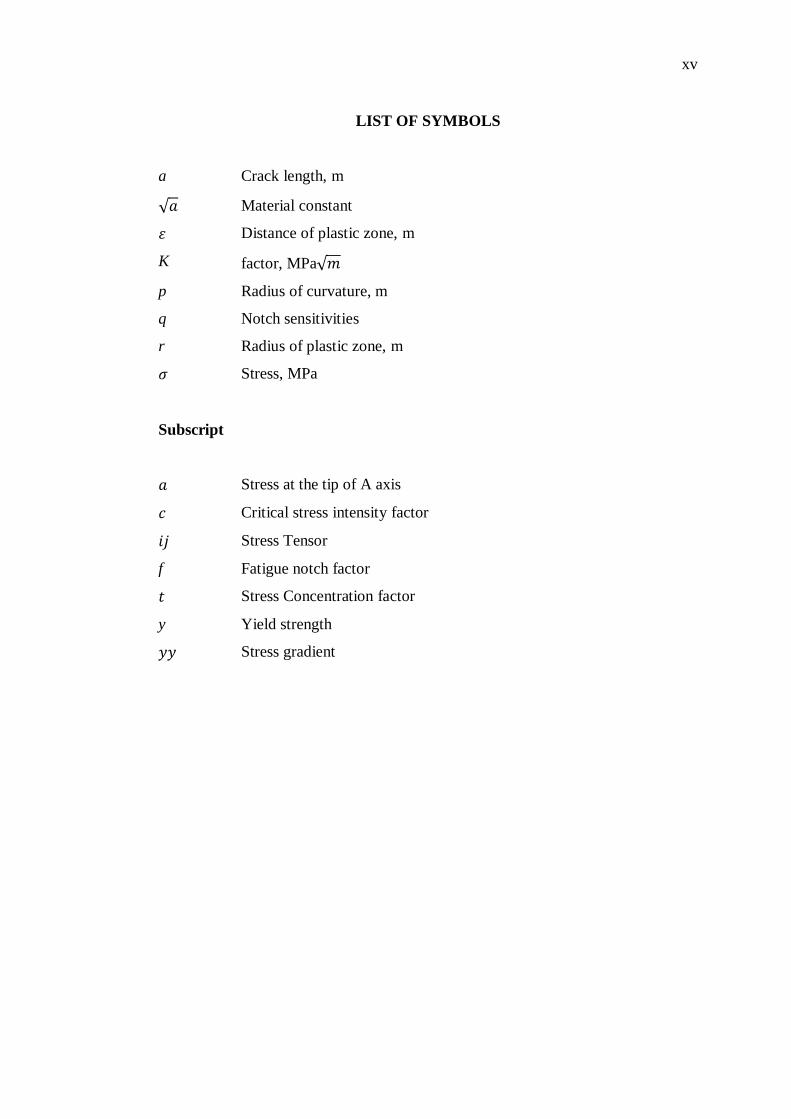
xv
LIST OF SYMBOLS
a Crack length, m
Material constant
Distance of plastic zone, m
K factor, MPa
p Radius of curvature, m
q Notch sensitivities
r Radius of plastic zone, m
Stress, MPa
Subscript
Stress at the tip of A axis
Critical stress intensity factor
Stress Tensor
f Fatigue notch factor
Stress Concentration factor
y Yield strength
Stress gradient
Page 13
xvi
LIST OF ABBREVIATIONS
AISI American Iron and Steel Institute
ASTM American Society for Testing Materials
FE Finite Element
FEA Finite Element Analysis
FEM Finite Element Model
Page 14
1
CHAPTER 1
INTRODUCTION
1.1 Project Background
Many failures in engineering applications or machine components have been
caused by a fatigue crack. Any plates that undergoing vibration or the defect on
manufacturing of the plates can cause an initiation crack. The fatigue crack initiated
from points at which the stress concentrated. Where the stress concentration level is
higher than a critical value the crack-growth will grow larger and longer until the
plate failed. Thus, introducing repairing method could be useful to arrest the crack-
growth before the failure.
A number of investigations have been performed to prolong the fatigue life
of the cracked components. The crack repair lies in retarding or arresting the crack
propagation, which can be achieved by reducing crack-tip intensity, introducing
residual compressive stresses, and reducing crack-tip stress concentrations (Broek,
1986). The reduction of crack-tip stress intensity occurred by crack filling (Song,
1998; Shin, 2000), composite patches (Schubbe, 1999; Baker, 1993) and welding
repair (Linnert, 1967). The introduction of residual compressive stresses was
through overloading (Novotny, 1986; Vardar, 1988), indentation (Miyagawa, 1985;
Song, 2002) cold expansion (Buxbaum, 1987; Ball, 1998) and defence hole drilling
(Miyagawa, 1985, Goto, 1996). The reduction of crack-tip stress concentrations was
by stop-hole drilling (Ghfiri, 2000).
One of the most popular techniques of arresting fatigue crack propagation
was stop-hole method. The stop-hole method is an emergency repair technique that
Page 15
2
has been employed for a long time to extend the fatigue life of cracked structural
components that cannot be replaced as soon as the crack discovered (Broek, 1986;
Shubbe, 1999). This classical resource is used in many maintenance crews all over
the world since it is relatively inexpensive, simple and fast to apply. In its simplest
form, this method consists of boring a hole in the vicinity of, or centred at the crack
tip, to transform the crack into notch, increasing in this way the residual fatigue life
of the cracked structure in comparison to the life it would have if not repaired.
However, the appropriate modelling of stop-holes drill is not simple. Several
parameters can influence the fatigue life increment caused by stop-hole. Among
them, at least the radius, the position and the surface finish of hole; the type and the
size of the crack; the geometry and the mechanical properties of component; the
magnitude of the load; and the residual stresses around the stop-hole border can all
influence the effectiveness of the repair.
1.2 Problem Statement
Stop-hole drill needs an appropriate way to be model so that can delay
propagation of the crack. But there are several parameters that need to be followed
to make sure stop-drilled hole effectively delay the crack plate.
1.3 Scope Of Study
In this research, the fatigue crack initiation lives prediction of specimen
aluminium alloy improving with stop-hole method will be investigate. The initiation
cracks will be delayed by diverting the cracks to detour to less important section.
This investigations concern to the stop-hole drill method with various techniques
applied. The techniques that will be studies are the improvement of fatigue life of
mild steel with different type of diameters of stop-hole. Besides that, the location of
stop-hole drill will also determined as one of the factor influence in improvement of
fatigue crack of specimen. Also the study focuses on the effectiveness of providing
additional holes or ancillary holes following the drilling at the crack tips. The
Page 16
3
effectiveness of thus techniques will be developed by doing an experiments using
tensile machine.
1.4 Objectives Of the Project
The objectives of the research are to investigate the effectiveness with
appropriate techniques of stop-hole to delay the crack line from crack initiation by;
1. Suitable diameter of the stop-hole drill.
2. Suitable location for the stop-hole drill.
3. Application of additional hole following the stop-hole drill at the crack
tip.
1.5 Summary
Chapter 1 has been discussed briefly about project background,
problem statement, objective and scope of the project on the effectiveness of
the stop-hole drill in enhancing the fatigue crack life of material. This chapter is as a
fundamental for the project and act as a guidelines for project research completion.
Page 17
4
CHAPTER 2
LITERATURE REVIEW
2.1 Introduction
The purpose of this chapter is to provide a review of past research efforts
related to crack behaviour, factor influencing crack initiation, stop-hole drilled and
also finite element analysis. A review of other relevant research studies is also
provided. Substantial literature has been studied on stress history computation,
techniques of arresting crack using stop-hole drill, and fatigue life prediction after
introducing stop-hole drill. However, little information can be found on integrated
durability evaluation methods. The review is organized chronologically to offer
insight to how past research efforts have laid the groundwork for subsequent
studies, including the present research effort. The review is detailed so that the
present research effort can be properly tailored to add to the present body of
literature as well as to justly the scope and direction of present research.
2.2 Crack
A fracture happen when an object is separate into two or more pieces under
applied of stress. A crack say to accompany fracture which the crack propagates
through the material that end up separate the material into two pieces. Crack
properties are different for ductile material and brittle material. In ductile material,
cracks slowly propagate through material and it is accompanied with large plastic
deformation. The crack will stop unless extra stress is applied. For brittle material,
crack is spreading fast with no plastic deformation. The crack that propagates in
brittle material will continue to grow once they are initiated (Anderson, 2005).
Page 18
5
2.2.1 Concept of Fracture Mechanic
2.2.1.1 Crack modes and stress intensity factor
There are three types of loading that a crack can experience, as shown in
Figure 2.1.
Figure 2.1: Three modes of loading that can be applied to a crack
Source: Anderson T.L 2005
A tensile stress field gives rise to mode 1, the opening crack propagation mode.
Mode 2 is the sliding mode, which due to in-plane shear and mode 3 is tearing
mode, which arises from out-of-plane shear. In this experiment we will only
consider the mode 1, since it is common in practice and crack behaviour almost
related to mode 1.
In study of crack, stress intensity factor plays a big role that take account the
stresses in the vicinity of crack tip. If the quantity reaches its critical values, crack
will initiates (Khoshravan, 2007).Irwin (1957) (Irwin, 1957) research found a
Page 19
6
method of calculating the stress field in any linear elastic cracked body if polar
coordinate axis with the origin at the crack tip was define. The equation is given by
(2.1)
where is stress tensor, is the distance from the crack tip, is the angle with
respect to the plane of the crack, and fij are functions that are independent of the
crack geometry and loading conditions. Irwin called constant K as stress intensity
factor. Since fij is dimensionless units , stress intensity factor, has units of
stress. .( .). Since experiment is conducted only stress on tensile
field, calculation taken only on mode 1 crack, the opening crack propagation mode
is taken. The equation is given as
(2.2)
Equation 2.2 can written as
(2.3)
Broek (Broek, 1972) then derive relationship between stress intensity factor and
crack length:
(2.4)
F is the correction factor of , which is given in the different forms by researchers.
Since our specimen is initially crack at the edge of the plate, the correction factor of
specimen must be considered. The edge of the crack can be obtained by slicing the
plate in Figure 2.2 through the middle of the plate.
Page 20
7
Figure 2.2: Centre cracked plate
Source: Michael Janssen
The stress intensity factor for the edge of the crack is given by
(2.5)
which increase by 12% increase in for the edge of the crack that cause from
different boundary conditions at the free edge. Further study by Tada (Michael) is
related to our test specimen shown the calculation of double edge notched plate
given as
(2.6)
Page 21
8
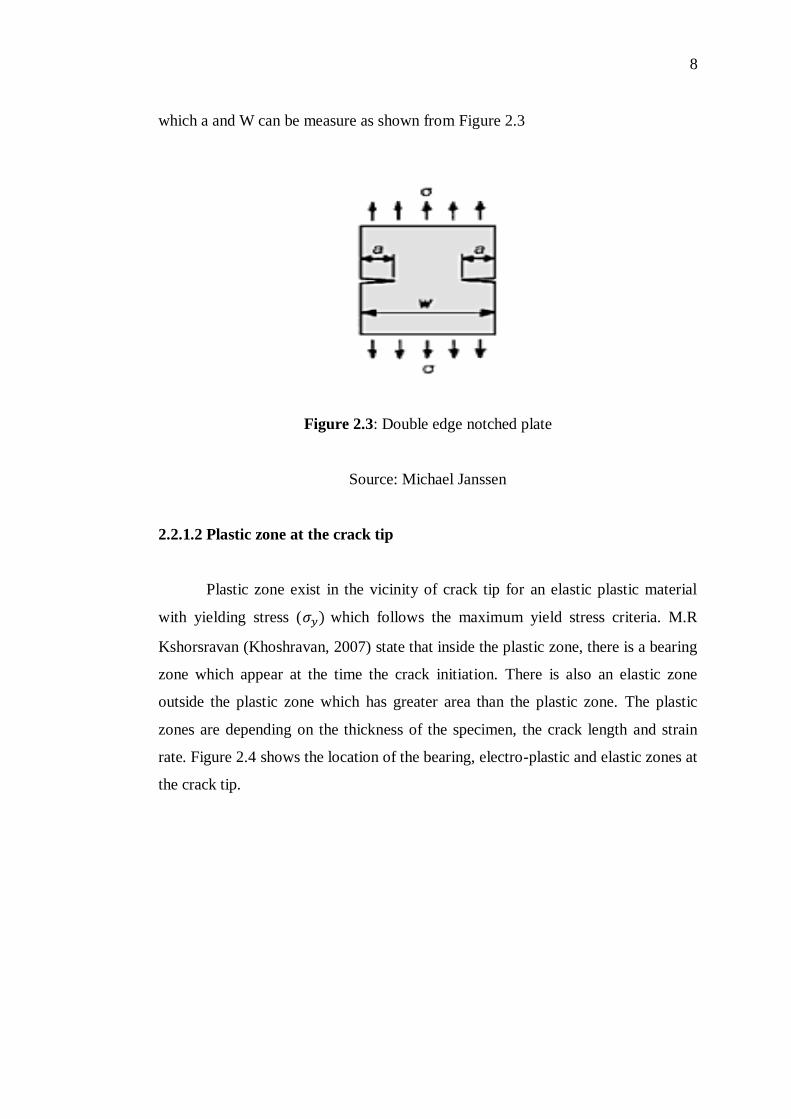
which a and W can be measure as shown from Figure 2.3
Figure 2.3: Double edge notched plate
Source: Michael Janssen
2.2.1.2 Plastic zone at the crack tip
Plastic zone exist in the vicinity of crack tip for an elastic plastic material
with yielding stress ( which follows the maximum yield stress criteria. M.R
Kshorsravan (Khoshravan, 2007) state that inside the plastic zone, there is a bearing
zone which appear at the time the crack initiation. There is also an elastic zone
outside the plastic zone which has greater area than the plastic zone. The plastic
zones are depending on the thickness of the specimen, the crack length and strain
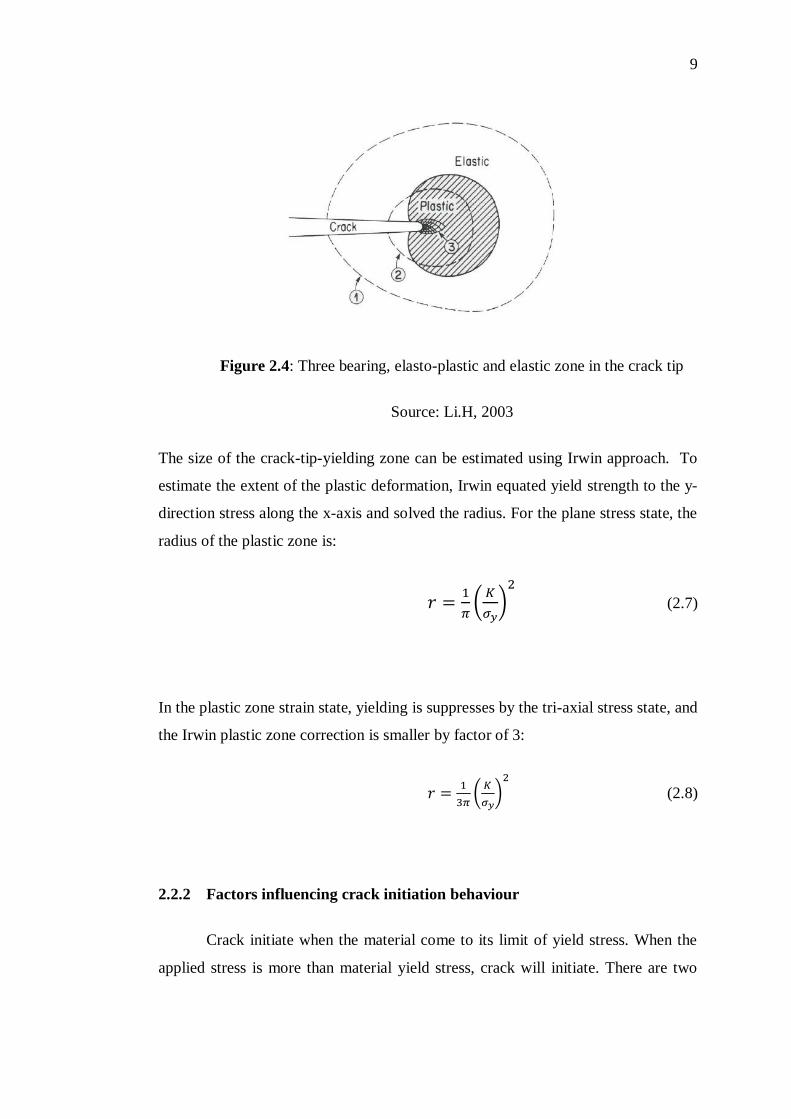
rate. Figure 2.4 shows the location of the bearing, electro-plastic and elastic zones at
the crack tip.
Page 22
9
Figure 2.4: Three bearing, elasto-plastic and elastic zone in the crack tip
Source: Li.H, 2003
The size of the crack-tip-yielding zone can be estimated using Irwin approach. To
estimate the extent of the plastic deformation, Irwin equated yield strength to the y-
direction stress along the x-axis and solved the radius. For the plane stress state, the
radius of the plastic zone is:
(2.7)
In the plastic zone strain state, yielding is suppresses by the tri-axial stress state, and
the Irwin plastic zone correction is smaller by factor of 3:
(2.8)
2.2.2 Factors influencing crack initiation behaviour
Crack initiate when the material come to its limit of yield stress. When the
applied stress is more than material yield stress, crack will initiate. There are two
Page 23
10
main factors that influence the crack initiation behaviour that are stress
concentration factor, and fatigue notch factor.
2.2.2.1 Stress Concentration factor
Stress concentration is a location in an object where stress concentrated. An
object is strongest when force is evenly distributed over its area, so a reduction in
area for example caused by a crack, results in a localized in stress. Material will fail
when the crack propagated cause from exceeding stress concentration of the
materials theoretical cohesive strength. Fatigue cracks always start at stress
concentration, so removing such defects increases the fatigue strength. Inglis
(Inglis, 1913) have provided a quantitative evidence for the stress concentration
effect of flaws, analyzed elliptical holes in flat plates. His analyses included an
elliptical hole 2a long by 2b wide with an applied stress perpendicular to the major
axis of the ellipse (Figure 2.5).
Figure 2.5: Elliptical hole in a plate
Source: Michael Janssen
Page 24
11
The stress at the tip of the major axis (which is point A) is given by
(2.9)
The ratio
is defined as the stress concentration factor, . Then Inglis found
more convenient to express equation 2.9 in terms of radius of curvature :
(2.10)
Where
(2.11)
For delaying crack, we must design the geometry to minimize stress concentrations.
The geometry can be achieve by drill hole with relatively large diameter causes a
smaller stress concentration then a sharp end of crack.
2.2.2.2 Fatigue notch factor
The effect of notches on the fatigue life is accounted for by the fatigue notch
factor, , which depends on not only notch geometry and loading modes but also
on material types, and its follows the Peterson expression (Peterson, 1959).
(2.12)