(IJACSA) International Journal of Advanced Computer Science and Applications, Vol. 8, No. 11, 2017 320 | Page www.ijacsa.thesai.org Investigate the use of Anchor-Text and of Query- Document Similarity Scores to Predict the Performance of Search Engine Abdulmohsen Almalawi Computer Science Department Faculty of Computing and Information Technology King Abdulaziz University, Jeddah, Saudi Arabia Rayed AlGhamdi Information Technology Department Faculty of Computing and Information Technology King Abdulaziz University, Jeddah, Saudi Arabia Adel Fahad Department of Computer Science College of Computer Science and Information Technology Al Baha University, Al Baha, Saudi Arabia Abstract—Query difficulty prediction aims to estimate, in advance, whether the answers returned by search engines in response to a query are likely to be useful. This paper proposes new predictors based upon the similarity between the query and answer documents, as calculated by the three different models. It examined the use of anchor text-based document surrogates, and how their similarity to queries can be used to estimate query difficulty. It evaluated the performance of the predictors based on 1) the correlation between the average precision (AP), 2) the precision at 10 (P@10) of the full text retrieved results, 3) a similarity score of anchor text, and 4) a similarity score of full- text, using the WT10g data collection of web data. Experimental evaluation of our research shows that five of our proposed predictors demonstrate reliable and consistent performance across a variety of different retrieval models. Keywords—Data mining; information retrieval; web search; query prediction I. INTRODUCTION The need to find useful information is an old problem. With more and more electronic data becoming available, finding information that is relevant becomes more challenging. About 85% of internet users employ search engines as information access tools [1], [2]. The rapid growth of the internet makes it difficult for information retrieval systems to satisfy users information needs. Searching in billions of documents will return hundreds of thousands of potentially useful documents. Due to the impossibility of going through the enormous number of documents to see whether they satisfy an information need, many information retrieval techniques have been introduced. Ranking documents according to their similarity to the information needed is one of the techniques that attempts to overcome the challenge of searching in large information repositories. A number of information retrieval models have been introduced. These models can be classified into set-theoretic, algebraic and probabilistic models. In our research, we used three models. Two of them were classified under probabilistic models and the third under algebraic models. Ranking relevant documents according to their similarity to a user‟s information need is not the only problem that is facing the information retrieval systems. The quality of returned answers is related to the quality of the submitted query (request). Poorly performing queries are a significant challenge for information retrieval systems. This issue has been investigated by Information Retrieval (IR) researchers. In particular, query difficulty prediction has been studied since 2003 [3]. It is expected that knowing the performance of a query can help retrieval systems to make a decision, which determines the optimal retrieval strategy, to be used in this situation for obtaining satisfactory results. Thus, studding query difficulty prediction is an interesting problem in its own right. Knowing the query performance requires the ability of differentiating the queries that perform well from the others that perform poorly. Many predictors have been proposed in order to estimate the difficulty of a query. All these predictors vary in use of resources, to infer the query performance. For example, query model and collection model were used to measure the query clarity by Cronen-Townsend et al. [4]. In our work, we investigate new resources and combinations of approaches. All our investigations are compared to two baseline approaches (MaxIDF and SCS) that were chosen to have good performance in previous papers [5], [6]. We use anchor-text and full-text similarity scores as sources of evidence. The full-text similarity scores for each query are obtained by running each query on the index of document collection (WT10G), where each document returned in the search result list is assigned with a similarity score. Anchor- text is a text that appears on a link and surfers used to click on to reach the destination pointed by this link. It is considered as meaningful element for hyperlink in an HTML page. Eiron and McCurley [7] observed that anchor-texts and queries are very similar. Thus, using anchor-text leads to many advantages, for instance, processing anchor-text is faster than processing the data collection and could be used an evidence of the importance of web page, which many links pointed to it. Furthermore, it exists for pages that could not be indexed by a text search engines such as pages that majority of their contents are images or multimedia files. It is observed by Craswell et al. [8] in Site Finding (a search task where the users is interested in findings a specific named resource) that ranking based on link anchor-text is twice as effective as ranking based on document content. For anchor-text similarity scores for each
Transcript
(IJACSA) International Journal of Advanced Computer Science and Applications,
Vol. 8, No. 11, 2017
320 | P a g e
www.ijacsa.thesai.org
Investigate the use of Anchor-Text and of Query-
Document Similarity Scores to Predict the
Performance of Search Engine
Abdulmohsen Almalawi
Computer Science Department
Faculty of Computing and
Information Technology
King Abdulaziz University, Jeddah,
Saudi Arabia
Rayed AlGhamdi
Information Technology Department
Faculty of Computing and
Information Technology
King Abdulaziz University, Jeddah,
Saudi Arabia
Adel Fahad
Department of Computer Science
College of Computer Science and
Information Technology
Al Baha University, Al Baha, Saudi
Arabia
Abstract—Query difficulty prediction aims to estimate, in
advance, whether the answers returned by search engines in
response to a query are likely to be useful. This paper proposes
new predictors based upon the similarity between the query and
answer documents, as calculated by the three different models. It
examined the use of anchor text-based document surrogates, and
how their similarity to queries can be used to estimate query
difficulty. It evaluated the performance of the predictors based
on 1) the correlation between the average precision (AP), 2) the
precision at 10 (P@10) of the full text retrieved results, 3) a
similarity score of anchor text, and 4) a similarity score of full-
text, using the WT10g data collection of web data. Experimental
evaluation of our research shows that five of our proposed
predictors demonstrate reliable and consistent performance
across a variety of different retrieval models.
Keywords—Data mining; information retrieval; web search;
query prediction
I. INTRODUCTION
The need to find useful information is an old problem. With more and more electronic data becoming available, finding information that is relevant becomes more challenging. About 85% of internet users employ search engines as information access tools [1], [2]. The rapid growth of the internet makes it difficult for information retrieval systems to satisfy users information needs. Searching in billions of documents will return hundreds of thousands of potentially useful documents. Due to the impossibility of going through the enormous number of documents to see whether they satisfy an information need, many information retrieval techniques have been introduced. Ranking documents according to their similarity to the information needed is one of the techniques that attempts to overcome the challenge of searching in large information repositories. A number of information retrieval models have been introduced. These models can be classified into set-theoretic, algebraic and probabilistic models. In our research, we used three models. Two of them were classified under probabilistic models and the third under algebraic models. Ranking relevant documents according to their similarity to a user‟s information need is not the only problem that is facing the information retrieval systems. The quality of returned answers is related to the quality of the submitted query
(request). Poorly performing queries are a significant challenge for information retrieval systems. This issue has been investigated by Information Retrieval (IR) researchers. In particular, query difficulty prediction has been studied since 2003 [3]. It is expected that knowing the performance of a query can help retrieval systems to make a decision, which determines the optimal retrieval strategy, to be used in this situation for obtaining satisfactory results. Thus, studding query difficulty prediction is an interesting problem in its own right.
Knowing the query performance requires the ability of differentiating the queries that perform well from the others that perform poorly. Many predictors have been proposed in order to estimate the difficulty of a query. All these predictors vary in use of resources, to infer the query performance. For example, query model and collection model were used to measure the query clarity by Cronen-Townsend et al. [4]. In our work, we investigate new resources and combinations of approaches. All our investigations are compared to two baseline approaches (MaxIDF and SCS) that were chosen to have good performance in previous papers [5], [6]. We use anchor-text and full-text similarity scores as sources of evidence. The full-text similarity scores for each query are obtained by running each query on the index of document collection (WT10G), where each document returned in the search result list is assigned with a similarity score. Anchor-text is a text that appears on a link and surfers used to click on to reach the destination pointed by this link. It is considered as meaningful element for hyperlink in an HTML page. Eiron and McCurley [7] observed that anchor-texts and queries are very similar. Thus, using anchor-text leads to many advantages, for instance, processing anchor-text is faster than processing the data collection and could be used an evidence of the importance of web page, which many links pointed to it. Furthermore, it exists for pages that could not be indexed by a text search engines such as pages that majority of their contents are images or multimedia files. It is observed by Craswell et al. [8] in Site Finding (a search task where the users is interested in findings a specific named resource) that ranking based on link anchor-text is twice as effective as ranking based on document content. For anchor-text similarity scores for each
(IJACSA) International Journal of Advanced Computer Science and Applications,
Vol. 8, No. 11, 2017
321 | P a g e
www.ijacsa.thesai.org
query, we ran each query on the index of anchor-text document surrogates. We therefore investigated the use of anchor-text similarity, and whether it can be used to predict query performance. We investigated the use of full-text similarity by running the same topics on the index of the document collection. The third investigation was conducted on one of the document surrogate properties, such the number of anchor-text in each document. We also investigate combinations of approaches. The idea is that in this way, the different strengths of alternative sources of evidence can be combined. We combine the first approach (full-text similarity) with the second approach (anchor-text similarity) in order to see the power of their union of predicting the query performance. Finally, we investigate the combination of each approach (full-text similarity and anchor-text similarity) with the approach MaxIDF. We conduct our experiments using well-known WT10G collection of web documents, and two testbeds from the Text REtrieval Conference (TREC). The results indicate a promising future for query performance prediction, particularly when combining some approaches.
II. RELATED WORK
He and Ounis [6] proposed and evaluated a number of pre-retrieval predictors. They concluded that two of them have strong correlation with average precision. The best two predictors are the simpli_ed query clarity score ( ) and the average inverse collection term frequency ( ). The SCS predictor calculates the Kullbak-Leibler divergence between the collection model and query model. The is calculated by
∑ ( | ) ( | )
( ) (1)
Where ( | ) given by , qtf is the numbers of occurrences of a query term in the query and ql is the total number of terms in the query. ( ) : is the collection model, it is given by , where is how many times a query term occurs in the collection and is the number of terms in the whole collection. Due to its demonstrated performance, we use as a baseline in our experiments below.
The predictor is observed that it has a strong correlation with query performance and it is given by
∏ ( )
(2)
Where is the number of occurrences of a query term in the whole collection is the number of distinct terms in the whole collection, and ql is the query length. The MaxIDF predictor [5] was demonstrated to have a strong correlation with query performance. MaxIDF is calculated by using the largest IDF value of any term in the query. Due to its correlation effectiveness, we use MaxIDF as a second baseline for our experiments. Zhao et al. [9] proposed two new families of pre-retrieval predictors based on the similarity score between query and collection and the variability of distribution of query terms in the collection. The predictors that are based on similarity exploit two common resources of evidence; term frequency (TF) and inverse document frequency (IDF). The first predictor is SCQ that computes the similarity between the query and collection. The second predictor is as result of bias
against long query; they divided the SCQ by the length of the query where the length is calculated by summing the number of query terms that occur in the collection. The third predictor, they suggest that the performance of query can be determined by the query term that has the highest SCQ score. The predictors of the second family hinge on hypothesis that considers standard deviation of term weights as a predictor of an easy or hard query. If the standard deviation of term weights across the collection is high, this would indicate that the term is easy and the system is able to choose the best answer. However, if the standard deviation is low, this indicates that term is hard to be differentiated by system and therefore, the performance could be weak. From this approach, three predictors proposed. The predictor of variability score, normalised variability score and the maximum variability score.
The clarity score is proposed by Cronen-Townsend et al. [4]. They suggest that the quality of query can be estimated by calculating the divergence between query language and a collection of documents and, moreover, query with high clarity score correlates positively with the average precision in variety of TREC test sets. It is observed by Cronen-Townsend et al. [4] that queries that have high clarity scores outperform the ones that have low clarity scores in term of retrieving relevant documents.
The prediction of query difficulty has been studied in intranet search by Macdonald et al. [10] and they found satisfied results to predict the query performance by using the average inverse collection term frequency ( ) and the query scope [6] predictors. The shown prediction results were highly effective when the range of query length was between one to two terms. In their experiments, query performance inversely proportional to query length.
Carmel et al. [11] tried to find the reasons for the problem that makes a query difficult. They attribute the difficulty to three main components of topic: the used expression that describes the information need (request), the relevant document set to topic, and data collection. A strong relationship between these components and the topic difficulty were found. In this work, they found a correlation between the average precision and the distance between the set of retrieved document and the collection as measured by the Jensen-Shannon divergence.
Mothe and Tanguy [12] examined the relationship of 16 different TREC queries linguistic features and the average precision scores. Each feature can be viewed as a clue to a linguistically specific characteristic, morphological, syntactical or semantic. Tow among these features: syntactic links span and polysemy value; had a significant impact on precision scores. Although the correlation was not high, the research demonstrates a promising correlation between some linguistic features and query performance.
Using learning methods to estimate the query difficulty are proposed by Yom-Tov et al. [13]. In this work, the agreement between the top N results of the full query and top N results of each term in that query is taken into account as the basic idea of estimation of query difficulty. The learning methods in this work are based on two features. First, the intersection between
(IJACSA) International Journal of Advanced Computer Science and Applications,
Vol. 8, No. 11, 2017
322 | P a g e
www.ijacsa.thesai.org
the top N results of full query and the top N results of each query term. Second, the rounded logarithm of the document frequency of each query term. Two estimators used in this research are a histogram and a modified tree-based estimator. The first one is used when the number of sub-queries is large and the second used for short queries. These algorithms were tested on the TREC8 and WT10g collection. The number of topics used with these collections is 200 and 100 respectively. They concluded that the estimators trained on 200 TREC topics were able to predict the precision of untrained 49 (new) topics. Moreover, these estimators can be used to perform selective automatic query expansion for easy queries only. The results in this work showed that quality of query performance is proportional to the query length therefore, some opening questions arise that need to be taken in account, such as how the quality of query performance of short queries can be improved and how the amount of training data can be restricted.
Research was conducted using the query difficulty prediction to perform Metasearch and Federation proposed by Yom-Tov et al. [14]. They argue that the ranked list of documents returned from each search engine or each document collection can be merged by using query difficulty prediction score. The Metasearch technique is, several search engines perform retrieval operation from one document collection while, the Federation technique is, one search engine used to do retrieval from several document collections. The calculation of the query difficulty prediction score in this work is adapted from the approach [13] that proposed a learning algorithm for query difficulty prediction. They used the overlaps between the results of full query and its sub-queries to compute the difficulty prediction. The experimental tools used in this work are Robust Track topics. They used the same document collection for both Metasearch and Federation experiments. In the Federation experiment, they split the collection into four parts while, in the Metasearch experiment, they used available desktop search engines and same collection without splitting. They concluded that using the query difficulty prediction that computed for each dataset (in Federation) or each search engine (in Metasearch) could form a unified ranked list of results.
In the experiments conducted by Yom-Tov et al. [15] focus on query difficulty prediction and the benefits of using query performance prediction in some applications such as:
Query expansion (QE) - It is a method that used to improve the retrieval performance by adding terms to the original query. The terms can be chosen from top retrieved documents that were identified as relevant or they can be selected from thesaurus, a synonym table. QE can improve the performance of some queries, but has been shown to decrease the performance of others. The determination of whether to use QE or not can be decided by knowing the performance of submitted query whether it is easy or hard. Using QE with easy queries improves the system performance, but it is detrimental to hard ones. [16]
Modifying search engine parameters - By using the estimator parameters can be tuned to suitable value
according to the current situation. For example, we can tune the value that assigns to keywords and lexical affinities “pairs of closely related words which contain exactly one of the original query terms” [16]. The lexical affinities usually take the weight 0.25, while keywords take 0.70. These assigned values are an average that can be suitable for difficult and easy topics alike. However, using estimator (by which topic can be determined whether easy or hard) helps system to assign greater weight to lexical affinities when the topic is difficult and lower weight to easy topics.
Switching between different parts of topic - It is observed by Yom-Tov et al. [17] that some topics are not answered very well by using only the short title part while, they are answered very well by using the longer description part. Therefore, they used the estimator to determine which part of the topic should be used in order to optimise the system performance. The title part used for the difficult topics, while the description part used for easy topics.
Many different predictors have been proposed in the literature. We used two well-known predictors, SCS and MaxIDF that have been shown to perform well, as baselines in our experiments.
III. OUR APPROACH
Six post-retrieval predictors of query performance were proposed. Three predictors are based on using a single source of evidence, while the rest are combined predictors, joined together in variant weights. These predictors were investigated using the WT10g collection and anchor-text document surrogates. The proposed predictors are demonstrated as follows:
A. Single Predictors
1) The similarity of full text predictor uses the similarity
scores between a query and documents in the collection that
are returned by a retrieval model. For example, for a particular
query, the Okapi BM25 similarity function can be used to
calculate a similarity score between that query and each
document in the collection. Search results are then ranked by
decreasing similarity score.
However, the actual similarity weights can differ markedly between queries: for example, for some queries the top similarity score may be very high, while for others, even the best similarity match may give a relatively lower score. The intuition behind our similarity of full text predictor is therefore that the actual level of the similarity value can provide evidence about how well the query has been able to match with possible answers in the collection. In other words, if the similarity scores are relatively high, then this is evidence for good matches (and therefore we expect this to be an easy query). On the other hand, relatively low similarity scores for even the top matching documents provide evidence that the query is hard.
Since retrieval models generally return a list of documents ordered by decreasing similarity score, w the predictor can be based on different numbers of similarity scores. For example,
(IJACSA) International Journal of Advanced Computer Science and Applications,
Vol. 8, No. 11, 2017
323 | P a g e
www.ijacsa.thesai.org
we could focus on only the top match, or take the mean similarity score of the top 10 matched. In general, we investigate the parameter N which represented the depth of the result list from which we take the average similarity score, as our query difficulty predictor.
We investigate values of N = 1, 10, 50, 100, 500 and 1000. The correlation between each of these variants of the predictor is correlated with average precision (AP) and precision at 10 (P@10) to determine the effectiveness of the prediction.
The similarity of anchor-text predictor, the intuition behind this kind of predictor, is same as the one in the similarity of full-text predictor in addition to the usefulness of anchor-text of giving an accurate description for destination documents. Furthermore, anchor-texts and queries are very similar in terms of many aspects [7]. If the similarity scores of retrieved documents are high, this indicates these documents are pointed by links that their anchor-text may be same as the information need (query). Therefore, submitted topic can be easily answered. Conversely, if the assigned similarity scores are low, this is evidence that the query is relatively more difficult.
We run each query on the index of anchor-text document surrogates in order to obtain the similarity score, and take the mean of top N (1, 10, 50, 100, 500, and 1000) ranked surrogates as the similarity score for each query. After that, we calculate the correlation coefficient between the similarity score of anchor-text and average precision of full-text and precision at 10 retrieved documents of full-text. It is hypothesised that similarity of anchor-text predictor can be used to predict the performance of the search system for that query.
2) The number of anchor-text predictor, this predictor uses
the count of the number of pieces of anchor-text in each
document surrogate. We hypothesise that document surrogate
that has many pieces of anchor-text, has an important content,
because many links point to it. Therefore, we replace the
similarity scores of ranked documents returned by search
system (runs on index of full-text) with the number of anchor-
text that corresponds to each document. The score for each
query is calculated by taking the mean of top N (1, 10, 50, 100,
500, and 1000) ranked documents. We calculate the correlation
coe_cient between the predicted score and average precision of
full-text and precision at 10 retrieved documents of full-text.
B. Combined Predictors
These predictors combine two scores by using a simple linear combination approach to combine two scores. The intuitive idea of combining two approaches is about using variants of resources to predict the query performance. Combining strengths of each individual approach may result in a powerful predictor that outperforms each individual predictor. We calculate the joint score as follows:
( )
( ) (3)
1) The similarity of full-text combined with anchor-text, we
join the similarity score of full-text with the similarity score of
anchor-text in variant weights and take the mean of top (1,
10, 50, 100, 500, and 1000) ranked documents as the similarity
score for each query. We calculate the correlation between the
predicted score and average precision of full-text and precision
at 10 retrieved documents of full-text. We hypothesise that
combining these predictors by specific weight will improve
their performance compare to using a single predictor.
2) The similarity of full-text combined with MaxIDF, we
combine the similarity of full-text combined with MaxIDF (the
maximum of inverse document frequency for query terms). We
take the mean of top , and calculate the correlation
coefficient between the predicted score and average precision
of full-text and precision at 10 retrieved documents of full-text.
The similarity of anchor-text combined with MaxIDF, we combine the similarity of anchor-text with MaxIDF. We take the mean of top , and calculate the correlation coefficient same as the above ones.
IV. EXPERIMENTAL SETUP
The study relied on experimental methodology in order to investigate the effectiveness of the adopted approach. In our experiments, we used the facilities (a test set of documents, questions and evaluation software) that are provided by the Text REtrieval Conference (TREC) project in order to evaluate the work. The ultimate goal of TREC is to create the infrastructure necessary for comparable research in information retrieval.
A. Test Collection
The test collections used in the work are WT10g collection and document surrogates (it has same documents in terms of number, name and format, but their contents are consist of anchor-text fragments that point to).
1) The WT10g (web track 10 gigabytes) The WT10g collection is a 10 GB crawl of the World Wide
Web from 1997 used to evaluate new proposed algorithms and approaches, and it is widely used in information retrieval experiments. It is a static snapshot of the web and it is a common dataset which used by researchers to conduct their experiments within controlled environment. The features of the collection are:
Non-English and binary data has been eliminated.
Elimination of large quantities of duplicate data.
It supports distributed information retrieval experiments very well.
The key properties of the collection are summarised in TABLE I.
(IJACSA) International Journal of Advanced Computer Science and Applications,
Vol. 8, No. 11, 2017
324 | P a g e
www.ijacsa.thesai.org
TABLE I. PROPERTIES OF WT10G
Documents 1,692,096
Servers 11,680
Inter-server links 171,740
Documents with out-links 1,295,841
Documents with in-links 1,532,012
2) Document surrogates To create document surrogates, we harvested all anchor-
text from the WT10g collection. Then, all anchor-text fragments that point at a document A, are concatenated together to form a document surrogate, A. Fig. 1 gives an example of a document surrogate.
Fig. 1. A document surrogate.
TABLE II. below demonstrates the document surrogates statistics.
TABLE II. STATISTICS OF DOCUMENT SURROGATES
Document surrogates 1,689,111
Document surrogates that contain at least one anchor-text 1,333,787
Document surrogates that don't contain anchor-text(empty) 355,324
Hyperlinks that point to existing documents 11,528,211
Hyperlinks that point to non-existing documents 7,642,241
Valid hyperlinks in WT10g 19,170,452
Identical documents in WT10g 2,985
The Valid hyperlinks in WT10g: These are the hyperlinks that have anchor-text by which a particular document (pointed by a link) can be inquired. For example, the email hyperlinks were not considered as valid links therefore, they were neglected.
Identical documents in WT10g: It is claimed in this collection that identical documents eliminated. That sounds correct in terms of comparing documents URL against crawled documents URLs list. But, “the URL to a particular resource can be represented in many different formats” [18]. One example of identical documents found although, they are considered not be identical as follows:
First document: The document number is
<DOCNO>WTX095 B48 113</DOCNO> The document's URL is http://www.sfbayacm:org:80/
Second document: The document number is
<DOCNO>WTX093 B25 417 </DOCNO> The document's URL is http://www.sfbayacm.org:80/home.shtml
From this example, the URLs do not appear to be identical although they represent one resource. After standardising these
URLs according to the standardisations proposed by Ali [18], the final standardised URL for both document one and two is as follows: http://www.sfbayacm.org.
In our research, it is very important to consider these issues because of the need of accuracy of storing the anchor-text into a right document surrogate. If anchor-text not stored into a right document surrogate, this will lead to inaccurate search results. In this research, we standardised all documents URLs and hyperlinks targets (are what the links point to) that occur in these documents as well.
Hyperlinks point to existing documents: the sum of Hyperlinks that are valid and point to existing documents in document collection (WT10g).
Hyperlinks point to non-existing documents: the sum of Hyperlinks that are valid and point to elsewhere. Their targets are not within document collection (WT10g). This number could be propositional to the size of used collection, that is, it could be less when document collection is large and via verse.
B. Topic Set and Relevance Judgments
TREC has produced a series of test collections. Each test collection consists of a set of documents, a set of topics and a corresponding set of relevance judgments (relevant documents for each topic).
The topics used in this research are from web Track:
TREC-9 ad hoc query set of 50 queries (451-500)
TREC-10 ad hoc query set of 50 queries (501-550)
Each topic consists of three fields that describe the users‟ information need: a title, a description and a narrative field. The used field in this work is a title field. The title field was stemmed and stopwords were removed. The stemming algorithm that was used is Porter [19] and the SMART retrieval system stop list used to remove stopwords.
Relevance judgments are a list of answers called „qrles‟ accompanied with each query set. These answers were judged by a human. They are used to evaluate the search results returned by a system. We used in this research „qrels.501-550.trec10.web‟ and „qrels.451-500.trec9.web‟ that belong to TREC-10 and TREC-9, respectively.
C. Evaluation of Prediction
We report results based on three correlation coefficients:
1) The Pearson correlation
2) Spearman correlation
3) Kendall‟s tau correlation
The higher the value of the correlation, the better predictor is at determining query difficulty. We also report the P-value of the associated statistical hypothesis test for each correlation. When P < 0:05, the strength of the correlation is statically significant.
D. Baselines
We take two predictors as a baseline to our proposed predictors. First predictor is Simplified Clarity Score (SCS)
Wildcards and other shell special characters </body>
</html>
</DOC>
(IJACSA) International Journal of Advanced Computer Science and Applications,
Vol. 8, No. 11, 2017
325 | P a g e
www.ijacsa.thesai.org
that was proposed by He and Ounis [20]. Second predictor is maximum inverse document frequency (MaxIDF) [5].
E. Retrieval Models
There are many different models used in information retrieval IR. These models differ from one another in terms of used mathematical basis and models properties. In this paper, we use three ranked retrieval models: Okapi MB25 and Unigram language model and Vector Space model. The first two models are based on Probabilistic theorem, and similarity between query and document is computed as probabilities that a document is relevant for a given query. While, the third one represents document and query as vectors, and similarity is represented as a scalar value. Although, these models compute or estimate the Similarity between query and documents (in order to rank documents according to their descending similarity scores), they have different calculation and parameters. Thus, we setup the optimal and recommended values for each model as follows:
1) Okapi MB25 retrieval function (probabilistic model) K1 = 1:2
K3 = 1000
B = 0:75
These values are default and found to be effective in many different collections [21].
2) Vector Space model (cosine metric)
3) There are no parameters that need to be setup. Unigram language model using Dirichlet prior smoothing.
Dirichlet prior value = 2000, this found to be optimal prior value [22].
F. The Zettair Search Engine
The Zettair search engine is an open source. It was designed and written by the RMIT university Search Engine Group [23]. It was formally known as Lucy. There are many features of this engine, including:
Speed and scalability
Supporting TREC experiments
Running on many platforms
Boolean, ranked, and phrase querying
Easy to make installation and configuration
The version used in this work is 0.9.3, it is considered as a stable tested product.
G. Evaluation Program
The trec_eval program made available by TREC [3] is used to evaluate the retrieval results against the relevance judgments that belong to the topics that invoked to the retrieval system. The report that generated by this program gives some statistics for each topic:
The number of relevant documents in the test collection and relevant document retrieved by the retrieval system.
Common metrics such as mean average precision (MAP), R-precision, mean reciprocal rank and precision at N retrieved documents.
Interpolated precision at fixed levels of recall.
V. RESULTS AND DISCUSSION
Varity of predictors were explored, which involved a number of parameter settings. We explore using the mean of top N (1, 10, 50, 100, 500, and 1000) ranked documents as the similarity score for each query in all our approaches. We use variant values of N in order to determine the best value that correlates well against the actual performance average precision and precision at 10 retrieved documents. The results are therefore structured according to the following categories:
Single predictors
1) The mean of top N of the similarity of full-text scores.
2) The mean of top N of the similarity of anchor-text
scores.
3) The mean of top N of the number of anchor-text in each
document.
Combined predictors
In these approaches, the combining computation is defined as:
( )
( ) (4)
1) The mean of top N of the similarity of full-text scores
combined with anchor-text scores.
2) The mean of top N of the similarity of full-text scores
combined with MaxIDF scores.
3) The mean of top N of the similarity of anchor-text
scores combined with MaxIDF scores.
The predictors are evaluated for three retrieval models, as explained in experimental setup section:
1) Okapi MB25 retrieval function (probabilistic model)
2) Vector Space model (cosine metric)
3) Unigram language model, using Dirichlet prior
smoothing.
In our experiments, we used TREC 9 as training set in order to determine optimal parameters, while TREC 10 is used as evaluation set to test the optimal setting obtained from training. Two predictors used as baselines, MaxIDF and SCS. To measure the effiectiveness of our predictors, we use three correlation coefficients: Pearson (Cor), Kendall (Tau), and Spearman (Rho) between the predicted scores and average precision (AP), and precision at 10 (P@10), on the WT10G collection by using three retrieval models: Okapi, Cosine and Dirichlet.
We first present the results of baseline predictors, and then present the results of our proposed predictors.
(IJACSA) International Journal of Advanced Computer Science and Applications,
Vol. 8, No. 11, 2017
326 | P a g e
www.ijacsa.thesai.org
H. The Results of Baseline Predictors
Table 3, in the appendices, summarizes the results of correlations of Pearson (Cor), Kendall (Tau), and Spearman (Rho) of the MaxIDF predictor with average precision (AP) and precision at 10 (P@10). The results are given with respect to three retrieval models (Okapi, Cosine and Dirichlet) and the use of two topics: TREC 9 as training set and TREC 10 as evaluation set. The p-value is shown in bold when correlations are statistically significant at the 0.05 level.
The correlations of baseline predictor (MaxIDF) with average precision (AP) are statistically significant on TREC-9 for all correlation coefficients except for the linear correlation (Cor),but on TREC-10 are only statistically significant and showing high important correlation with the performance of the Okapi and Dirichlet retrieval models while, with Cosine model are not significant. However, the most correlations of this predictor with precision at 10 (P@10) are not significant. Although a few numbers of correlations are statistically significant, they cannot achieve the consistency of performance between the training set (TREC-9) and evaluation set (TREC-10). Overall, it can be seen that only correlations (Tau and Cor) with average precision (AP) with two retrieval models (Okapi
and Dirichlet) are statistically and consistently significant with the training set (TREC-9) and evaluation set (TREC-10).
TABLE IV. summarizes the results of correlations of Pearson (Cor), Kendall (Tau), and Spearman (Rho) of the SCS predictor with average precision (AP) and precision at 10 (P@10). The results are given with respect to three retrieval models (Okapi, Cosine and Dirichlet) and the use of two topics: TREC 9 as training set and TREC 10 as evaluation set. The p-value is shown in bold when correlations are statistically significant at the 0.05 level.
The results demonstrate that correlation coefficients of SCS predictor with average precision (AP) are statistically significant and highly effective for TREC-9 with Cosine model and only two of them (Tau, Cor) with Okapi model, while these correlation coefficients are not significant for Dirichlet model. The correlations of this predictor with precision at 10 (P@10) are only significant for Cosine model on TREC-9. There is no consistency between the training set and the evaluation set achieved by this predictor. Overall, the performance of the SCS predictor is less than MaxIDF predictor in terms of consistency and statistical significance for all correlation coefficients across most retrieval models and topics.
TABLE III. PEARSON (COR), KENDALL (TAU), AND SPEARMAN (RHO) CORRELATION BETWEEN MAXIDF PREDICTOR AND AVERAGE PRECISION (AP) AND
PRECISION AT 10 (P@10) ON THE WT10G COLLECTION, BY USING THE OKAPI METRIC, COSINE METRIC, AND DIRICHLET METRIC
0 Okapi metric. Cosine metric. Dirichlet metric. Correlation Test
(IJACSA) International Journal of Advanced Computer Science and Applications,
Vol. 8, No. 11, 2017
327 | P a g e
www.ijacsa.thesai.org
I. The Results of our Proposed Predictors
1) Single Predictors This section presents the results of predictors that based on
one source of evidence: similarity of full-text; similarity of anchor-text, and the number of anchor-text predictors. The variable parameter that was used in our experiments is the number of top ranked document similarity scores that are averaged. In this research, we used six values to tune this parameter: 1, 10, 50,100,500 and 1000.We choose the optimal parameter that performs very well on training set TREC 9. Then, we test these obtained settings on the evaluation set TREC 10.
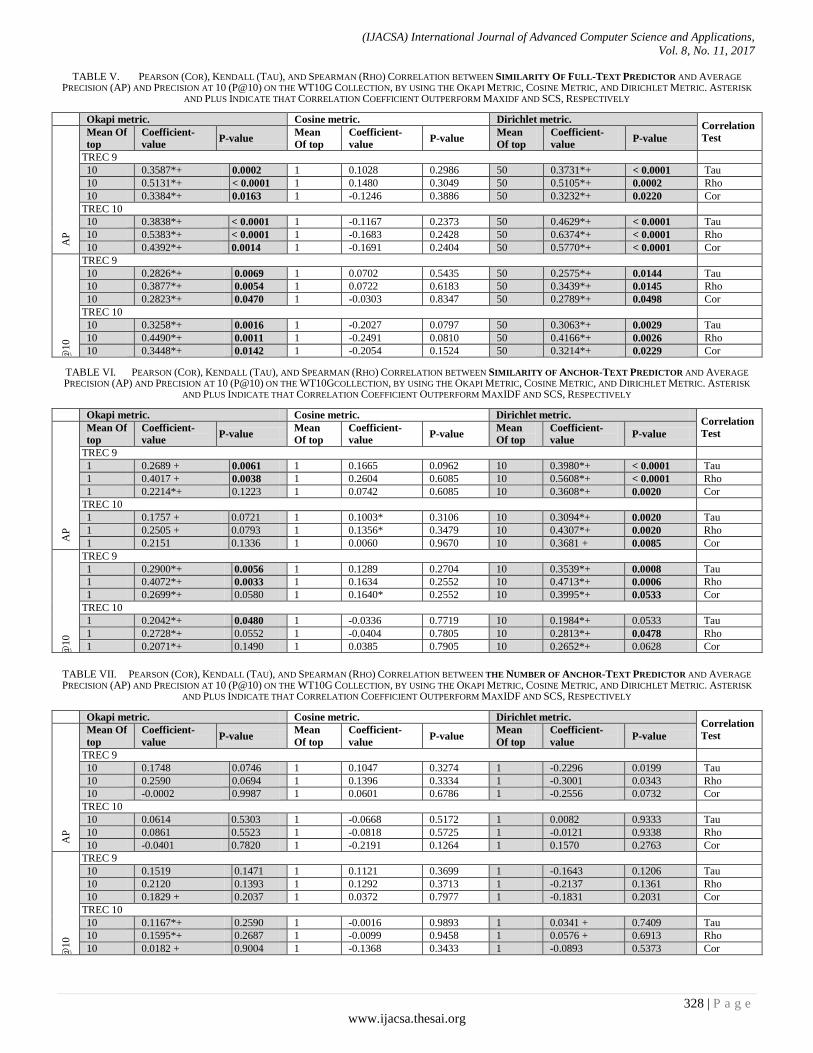
TABLE I. 5 shows the results of correlations of Pearson (Cor), Kendall (Tau), and Spearman (Rho) of the similarity of full-text predictor with average precision (AP) and precision at 10 (P@10). The results are given with respect to three retrieval models (Okapi, Cosine and Dirichlet) and the use of two topics: TREC-9 as training set and TREC-10 as evaluation set. The p-value is shown in bold when correlations are statistically significant at the 0.05 level.
The three correlation coefficients of similarity of full-text predictor with average precision (AP) and precision at 10 (P@10) are statistically significant for the probabilistic retrieval models (Okapi and Dirichlet) on the training (TREC-9) and evaluation (TREC-10) sets. It is apparent that no correlation coefficients for Cosine model are significant at all. The optimal parameter values of the mean of top ranked document similarity scores vary for each retrieval model. This predictor is showing promising correlation with Okapi model, when the mean of top 10 ranked document similarity scores, is taken on all query sets. However, with Dirichlet model, the best value is 50. It is noted from the results that similarity of full-text predictor with Dirichlet model gives the highest prediction performance. Overall, comparing this predictor with the baseline ones, it outperforms them and all correlation coefficients with performance of two retrieval models (Okapi and Dirichlet) appear statistically and consistently significant on all topics. Although, some correlation coefficients of baseline predictors show significant performance with Cosine model on training set (TREC-9) only, they are not effective for use with the Cosine model, because of losing the consistency of performance between training and evaluation sets.
The results of TABLE VI. 6 demonstrate the correlation coefficients (Pearson (Cor), Kendall (Tau), and Spearman (Rho)) of the similarity of anchor-text predictor with average precision (AP) and precision at 10 (P@10). The results are given with respect to three retrieval models (Okapi, Cosine and Dirichlet) and the use of two topics: TREC-9 as training set and TREC-10 as evaluation set. The p-value is shown in bold when correlations are statistically significant at the 0.05 level.
The results of three correlations of the anchor-text similarity predictor with average precision (AP) of Okapi model are only statistically significant with coefficients of
Kendall (Tau), and Spearman (Rho) on training set (TREC-9) while, all correlations are not effective for the evaluation set (TREC-10). This predictor performs poorly with the Cosine model. On other hand, it shows consistent performance for TREC-9 and TREC-10 with the Dirichlet model.
The results of correlations with P@10 for the Okapi model appear statistically significant on TREC-9 using Kendall (Tau) and Spearman (Rho) coefficients. It is seen that Kendall (Tau) coefficient keeps the performance consistency on TREC-10. Moreover, correlations with P@10 for Cosine model are not significant. All correlation coefficients for The Dirichlet model performance are statistically significant on TREC-9 although, they lose performance consistency for TREC-10 except for Spearman (Rho) coefficient. The results of the anchor-text predictor show actuated performance across correlation coefficients, retrieval models and topics. This predictor is comparative for the baseline SCS predictor, while less strong than the baseline MaxIDF and the similarity of full-text predictors.
TABLE VII. 7 summarizes the obtained results of correlation coefficients of the anchor-text predictor with average precision (AP) and precision at 10 (P@10). The results are given with respect to three retrieval models (Okapi, Cosine and Dirichlet) and the use of two topics: TREC-9 as training set and TREC-10 as evaluation set. The p-value is shown in bold when correlations are statistically significant at the 0.05 level.
The number of anchor-text predictor shows no significant effect. It is the worst predictor and is not recommended for use.
2) Combined Predictors This section presents the results of predictors that are based
on combining two sources of evidence: similarity of full-text with similarity of anchor-text, similarity of full-text with MaxIDF, similarity of anchor-text with MaxIDF. The variable parameters used in our experiments are based on two parameters: the alpha parameter (determines the weight given to first approach and second approach in the linear combination) and the number of top ranked document similarity scores averaged, after combining. In this work, nine values are used to tune alpha parameter: 0.1, 0.2, 0.3, 0.4, 0.5, 0.6, 0.7, 0.8, 0.9, and six values to tune second parameter: 1, 10, 50,100,500 and 1000. We chose the optimal value of first parameter and second parameter based on training set TREC 9. Then, we test these fixed parameter values on evaluation set TREC 10.
TABLE VIII. 8 demonstrates correlation coefficients of combining similarity of full-text with similarity of anchor-text predictor with average precision (AP) and precision at 10 (P@10). The results are given with respect to three retrieval models (Okapi, Cosine and Dirichlet) and the use of two topics: TREC-9 as training set and TREC-10 as evaluation set. The p-value is shown in bold when correlations are statistically significant at the 0.05 level.
(IJACSA) International Journal of Advanced Computer Science and Applications,
Vol. 8, No. 11, 2017
328 | P a g e
www.ijacsa.thesai.org
TABLE V. PEARSON (COR), KENDALL (TAU), AND SPEARMAN (RHO) CORRELATION BETWEEN SIMILARITY OF FULL-TEXT PREDICTOR AND AVERAGE
PRECISION (AP) AND PRECISION AT 10 (P@10) ON THE WT10G COLLECTION, BY USING THE OKAPI METRIC, COSINE METRIC, AND DIRICHLET METRIC. ASTERISK
AND PLUS INDICATE THAT CORRELATION COEFFICIENT OUTPERFORM MAXIDF AND SCS, RESPECTIVELY
(IJACSA) International Journal of Advanced Computer Science and Applications,
Vol. 8, No. 11, 2017
329 | P a g e
www.ijacsa.thesai.org
TABLE VIII. PEARSON (COR), KENDALL (TAU), AND SPEARMAN (RHO) CORRELATION BETWEEN COMBINING SIMILARITY OF FULL-TEXT WITH SIMILARITY
OF ANCHOR-TEXT PREDICTOR AND AVERAGE PRECISION (AP) AND PRECISION AT 10 (P@10) ON THE WT10G COLLECTION, BY USING THE OKAPI METRIC, COSINE METRIC, AND DIRICHLET METRIC. ASTERISK AND PLUS INDICATE THAT CORRELATION COEFFICIENT OUTPERFORM MAXIDF AND SCS, RESPECTIVELY
(IJACSA) International Journal of Advanced Computer Science and Applications,
Vol. 8, No. 11, 2017
330 | P a g e
www.ijacsa.thesai.org
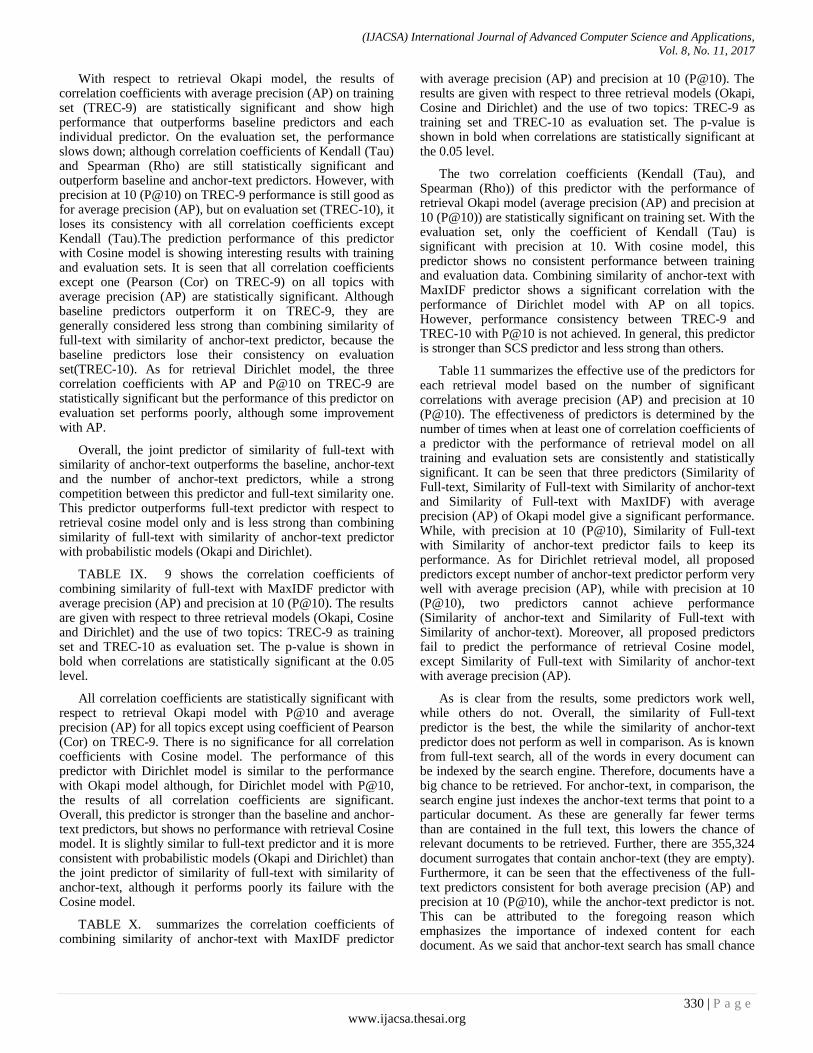
With respect to retrieval Okapi model, the results of correlation coefficients with average precision (AP) on training set (TREC-9) are statistically significant and show high performance that outperforms baseline predictors and each individual predictor. On the evaluation set, the performance slows down; although correlation coefficients of Kendall (Tau) and Spearman (Rho) are still statistically significant and outperform baseline and anchor-text predictors. However, with precision at 10 (P@10) on TREC-9 performance is still good as for average precision (AP), but on evaluation set (TREC-10), it loses its consistency with all correlation coefficients except Kendall (Tau).The prediction performance of this predictor with Cosine model is showing interesting results with training and evaluation sets. It is seen that all correlation coefficients except one (Pearson (Cor) on TREC-9) on all topics with average precision (AP) are statistically significant. Although baseline predictors outperform it on TREC-9, they are generally considered less strong than combining similarity of full-text with similarity of anchor-text predictor, because the baseline predictors lose their consistency on evaluation set(TREC-10). As for retrieval Dirichlet model, the three correlation coefficients with AP and P@10 on TREC-9 are statistically significant but the performance of this predictor on evaluation set performs poorly, although some improvement with AP.
Overall, the joint predictor of similarity of full-text with similarity of anchor-text outperforms the baseline, anchor-text and the number of anchor-text predictors, while a strong competition between this predictor and full-text similarity one. This predictor outperforms full-text predictor with respect to retrieval cosine model only and is less strong than combining similarity of full-text with similarity of anchor-text predictor with probabilistic models (Okapi and Dirichlet).
TABLE IX. 9 shows the correlation coefficients of combining similarity of full-text with MaxIDF predictor with average precision (AP) and precision at 10 (P@10). The results are given with respect to three retrieval models (Okapi, Cosine and Dirichlet) and the use of two topics: TREC-9 as training set and TREC-10 as evaluation set. The p-value is shown in bold when correlations are statistically significant at the 0.05 level.
All correlation coefficients are statistically significant with respect to retrieval Okapi model with P@10 and average precision (AP) for all topics except using coefficient of Pearson (Cor) on TREC-9. There is no significance for all correlation coefficients with Cosine model. The performance of this predictor with Dirichlet model is similar to the performance with Okapi model although, for Dirichlet model with P@10, the results of all correlation coefficients are significant. Overall, this predictor is stronger than the baseline and anchor-text predictors, but shows no performance with retrieval Cosine model. It is slightly similar to full-text predictor and it is more consistent with probabilistic models (Okapi and Dirichlet) than the joint predictor of similarity of full-text with similarity of anchor-text, although it performs poorly its failure with the Cosine model.
TABLE X. summarizes the correlation coefficients of combining similarity of anchor-text with MaxIDF predictor
with average precision (AP) and precision at 10 (P@10). The results are given with respect to three retrieval models (Okapi, Cosine and Dirichlet) and the use of two topics: TREC-9 as training set and TREC-10 as evaluation set. The p-value is shown in bold when correlations are statistically significant at the 0.05 level.
The two correlation coefficients (Kendall (Tau), and Spearman (Rho)) of this predictor with the performance of retrieval Okapi model (average precision (AP) and precision at 10 (P@10)) are statistically significant on training set. With the evaluation set, only the coefficient of Kendall (Tau) is significant with precision at 10. With cosine model, this predictor shows no consistent performance between training and evaluation data. Combining similarity of anchor-text with MaxIDF predictor shows a significant correlation with the performance of Dirichlet model with AP on all topics. However, performance consistency between TREC-9 and TREC-10 with P@10 is not achieved. In general, this predictor is stronger than SCS predictor and less strong than others.
Table 11 summarizes the effective use of the predictors for each retrieval model based on the number of significant correlations with average precision (AP) and precision at 10 (P@10). The effectiveness of predictors is determined by the number of times when at least one of correlation coefficients of a predictor with the performance of retrieval model on all training and evaluation sets are consistently and statistically significant. It can be seen that three predictors (Similarity of Full-text, Similarity of Full-text with Similarity of anchor-text and Similarity of Full-text with MaxIDF) with average precision (AP) of Okapi model give a significant performance. While, with precision at 10 (P@10), Similarity of Full-text with Similarity of anchor-text predictor fails to keep its performance. As for Dirichlet retrieval model, all proposed predictors except number of anchor-text predictor perform very well with average precision (AP), while with precision at 10 (P@10), two predictors cannot achieve performance (Similarity of anchor-text and Similarity of Full-text with Similarity of anchor-text). Moreover, all proposed predictors fail to predict the performance of retrieval Cosine model, except Similarity of Full-text with Similarity of anchor-text with average precision (AP).
As is clear from the results, some predictors work well, while others do not. Overall, the similarity of Full-text predictor is the best, the while the similarity of anchor-text predictor does not perform as well in comparison. As is known from full-text search, all of the words in every document can be indexed by the search engine. Therefore, documents have a big chance to be retrieved. For anchor-text, in comparison, the search engine just indexes the anchor-text terms that point to a particular document. As these are generally far fewer terms than are contained in the full text, this lowers the chance of relevant documents to be retrieved. Further, there are 355,324 document surrogates that contain anchor-text (they are empty). Furthermore, it can be seen that the effectiveness of the full-text predictors consistent for both average precision (AP) and precision at 10 (P@10), while the anchor-text predictor is not. This can be attributed to the foregoing reason which emphasizes the importance of indexed content for each document. As we said that anchor-text search has small chance
(IJACSA) International Journal of Advanced Computer Science and Applications,
Vol. 8, No. 11, 2017
331 | P a g e
www.ijacsa.thesai.org
to retrieve relevant documents because of lack of document surrogates content, and therefore, this chance can be barely found with precision at 10 (P@10).The Number of anchor-text predictor is the worst predictor, and does not perform well on the training set or evaluation set. The speculative reasons that can be stated are two reasons: first, enormous numbers of document surrogates do not contain anchor-text which may be relevant. The second reason is that, while the number of anchor-text items pointing to a document can be an indication of the importance of that document; this does not necessarily mean that the document is actually relevant.
TABLE XI. COMPARISON OF PREDICTOR EFFECTIVENESS FOR EACH
RETRIEVAL MODEL WITH AVERAGE PRECISION (AP) AND PRECISION AT 10
(P@10)
Metric Predictor Okapi Dirichlet Cosine
AP
Similarity of Full-text 3 3 -
Similarity of anchor-text - 3 -
Number of anchor-text - - -
Similarity of Full-text with
Similarity of anchor-text 2 2 2
Similarity of Full-text with MaxIDF
2 3 -
Similarity of anchor-text
with MaxIDF - 3 -
P@10
Similarity of Full-text 3 3 -
Similarity of anchor-text - - -
Number of anchor-text - - -
Similarity of Full-text with
Similarity of anchor-text - - -
Similarity of Full-text with
MaxIDF 2 2 -
Similarity of anchor-text with MaxIDF
- 1 -
Where, 1; 2 and 3 are the number of correlation coefficients (Tau, Cor and Rho) that are consistent and
statistically significant on all topics(TREC-9 and TREC-10)
VI. CONCLUSIONS AND FUTURE WORK
Query difficulty prediction aims to determine, in advance of showing a set of search results to a user, whether the results are likely to be useful. The ultimate aim, if prediction is successful, is to optimize the performance of search engines. Many predictors have been proposed since the emergence of this technique. Despite intensive research in this area, effective prediction of query difficulty is still an open question for researchers. This study aims to investigate the effectiveness of using full-text and anchor-text similarities to predict the performance of retrieval systems that run on full-text. Six predictors have been proposed in this study, three of which are based on one source of evidence, while the rest are based on combining two sources of evidence. We conducted our experiments on WT10G data collection of web documents, and document surrogates (created by harvesting all anchor-text from the WT10g collection) and used three retrieval models: Okapi BM25 retrieval function; vector space model; unigram language model (using Dirichlet prior smoothing). Three different correlation coefficients (Pearson (Cor), Kendall (Tau), and Spearman (Rho) correlation) were used to evaluate the performance of the techniques, by calculating the correlation
between the predicted performance and the average precision (AP) and precision at 10 (P@10) for each retrieval model. Queries from TREC-9 were used as a training set to determine suitable parameter settings. TREC-10 queries were used as the evaluation set. The performance of the proposed predictors were compared with the performance of two baseline predictors (MaxIDF and SCS) that have been shown to work well in the literature.
The results of some of our proposed predictors demonstrate promising performance and provide a significant correlation between predicted performance and actual performance of retrieval systems, compared with the baseline predictors. These predictors are divided into two classifications: single predictors and combined predictors. The single predictors are similarity of full-text; similarity of anchor-text and the number of anchor-text. The first two predictors outperform the baselines in most correlations, and work well with the Okapi and Dirichlet retrieval models. However, they perform poorly for the Cosine model. As for combined predictors, they are similarity of full-text with similarity of anchor-text, similarity of full-text with MaxIDF, and similarity of anchor-text with MaxIDF. It is apparent from the results of our study that the performance of combined predictors is broadly stronger than baseline and single predictors. It is noted that the performance of each predictor depends on the used retrieval system, correlation coefficient and query set. None can highly perform for all retrieval systems and query sets with all correlation coefficients. Therefore, we recommend that the suitable predictors be chosen for each retrieval model. For Okapi, the best performance overall is given by the Similarity of Full-text, Similarity of Full-text with MaxIDF and Similarity of Full-text with Similarity of anchor-text predictors with average precision (AP), while with precision at 10 (P@10) the first two predictors. For language model (Dirichlet), all proposed predictors work well with AP except the number of anchor-text predictor, while with P@10, similarity of Full-text and similarity of Full-text with MaxIDF predictors work well. For Cosine function, only similarity of Full-text with similarity of anchor-text predictor work well with AP, while none works well with P@10.
In our results, it can be seen that the proposed predictors perform poorly for the Cosine model. In future work, we intend to investigate the issue behind this poor performance. It was seen that using different correlation coefficients leads to different results about the performance of predictors. Therefore, a further methodology of query difficulty prediction is needed to determine appropriate measures for this task. The average count of anchor-text for non-empty document surrogates is 8.6 anchor- texts; while document surrogates that do not contain anchor-text (empty) number 355,324 documents. The small number of anchor-text in each document surrogate and the large number of empty document surrogates can be attributed to the small size of the test collection (WT10G). This is because the empty document surrogates could be pointed to by links, but not in this test collection and non-empty document surrogates could be pointed by more links. Therefore, we plan to carry out follow-up experiments on larger data collections.
(IJACSA) International Journal of Advanced Computer Science and Applications,
Vol. 8, No. 11, 2017
332 | P a g e
www.ijacsa.thesai.org
REFERENCES
[1] S. Lawrence and C. Giles. Accessibility of information on the web. intelligence, 11(1):32-39, 2000.
[2] Borgman, Christine L. Scholarship in the digital age: Information, infrastructure, and the Internet. MIT press, 2010.
[3] NIST, editor. Overview of the TREC 2004 Robust Retrieval Track, 2004.
[4] S. Cronen-Townsend, Y. Zhou, and W. Croft. Predicting query performance. In Proceedings of the 25th annual international ACM SIGIR conference on Research and development in information retrieval, pages 299-306. ACM New York, NY, USA, 2002.
[5] F. Scholer, H. Williams, and A. Turpin. Query association surrogates for web search. Journal of the American Society for Information Science and Technology, 55(7), 2004.
[6] B. He and I. Ounis. Inferring query performance using pre-retrieval predictors. Lecture notes in computer science, pages 43-54, 2004.
[7] N. Eiron and K. McCurley. Analysis of anchor text for web search. In Proceedings of the 26th annual international ACM SIGIR conference on Research and development in informaion retrieval, pages 459-460. ACM New York, NY, USA, 2003.
[8] N. Craswell, D. Hawking, and S. Robertson. Effective site finding using link anchor information. In Proceedings of the 24th annual international ACM SIGIR conference on Research and development in information retrieval, pages 250-257. ACM New York, NY, USA, 2001.
[9] Zhao, Rongkuo, Thomas Koschny, and Costas M. Soukoulis. "Chiral metamaterials: retrieval of the effective parameters with and without substrate." Optics express 18.14 (2010): 14553-14567.
[10] C. Macdonald, B. He, and I. Ounis. Predicting query performance in intranet search. In ACM SIGIR, volume 5, 2005.
[11] D. Carmel, E. Yom-Tov, A. Darlow, and D. Pelleg. What makes a query difficult? In Proceedings of the 29th annual international ACM SIGIR conference on Research and development in information retrieval, pages 390-397. ACM New York, NY, USA, 2006.
[12] J. Mothe and L. Tanguy. Linguistic features to predict query difficulty-a case study on previous TREC campaigns. In SIGIR workshop on
Predicting Query Difficulty Methods and Applications, pages 7-10, 2005.E. Yom-Tov, S. Fine, D. Carmel, and A. Darlow. Learning to estimate query difficulty: including applications to missing content detection and distributed information retrieval. In Proceedings of the 28th annual international ACM SIGIR conference on Research and development in information retrieval, pages 512-519. ACM New York, NY, USA, 2005a.
[13] E. Yom-Tov, S. Fine, D. Carmel, and A. Darlow. Metasearch and Federation using Query Difficulty Prediction. Carmel et al, 2005b.
[14] E. Yom-Tov, S. Fine, D. Carmel, A. Darlow, and E. Amitay. Juru at TREC 2004: Experiments with prediction of query difficulty. In Proceedings of the Thirteenth Text REtrieval Conference (TREC 2004), 2005c.
[15] D. Carmel, E. Farchi, Y. Petruschka, and A. Soffer. Automatic query wefinement using lexical affinities with maximal information gain. In Proceedings of the 25th annual international ACM SIGIR conference on Research and development in information retrieval, pages 283-290. ACM New York, NY, USA, 2002.
[16] E. Yom-Tov, S. Fine, D. Carmel, A. Darlow, and E. Amitay. Improving document retrieval according to prediction of query difficulty. In Working Notes of Text Retrieval Conference (TREC 2004), pages 393-402, 2004.
[17] H. Ali. Effective Web Crawlers. PhD thesis, RMIT University, Mar. 2008.
[18] M. Porter. An algorithm for suffix stripping. Program: electronic library and information systems, 40(3): 211-218, 2006.
[19] B. He and I. Ounis. Query performance prediction. Information Systems, 31(7):585-594, 2006.
[20] S. Walker and S. Robertson. Okapi/keenbow at TREC-8. NIST Special Publication, pages 500-246, 1999.
[21] C. Zhai and J. Lafferty. Two-stage language models for information retrieval. In Proceedings of the 25th annual international ACM SIGIR conference on Research and development in information retrieval, pages 49-56. ACM New York, NY, USA, 2002.
[22] S. E. Group. The Zettair Search Engine. RMIT university, 2009. http://www.seg.rmit.edu.au/zettair (last accessed 20-5-2011).