Bienen, B., Byrne, B. W., Houlsby, G. T. & Cassidy, M. J. (2006). Ge ´otechnique 56, No. 6, 367–379 367 Investigating six-degree-of-freedom loading of shallow foundations on sand B. BIENEN*, B. W. BYRNE†, G. T. HOULSBY† and M. J. CASSIDY* Laboratory studies of the response of shallow foundations have previously considered only planar loading. This paper describes experimental work carried out using a loading device that applies general loading onto model shallow foundations. The loading, involving all six degrees of freedom [vertical (V), horizontal (H 2 , H 3 ), torsion (Q) and overturning moment (M 2 , M 3 )], has been applied to a 150 mm diameter circular flat rough foundation on a loose dry silica sand. Aspects of the loading rig design are briefly described, but the main focus is the presenta- tion of the experimental results. These provide evidence for the generalisation of existing work-hardening plasti- city models from planar loading to general loading condi- tions. This evidence is used to extend an existing numerical model to the six-degree-of-freedom case, and the simulation results are compared with the experimen- tal results. KEYWORDS: footings/foundations; numerical modelling and analysis; offshore engineering; sands; settlement; soil/structure interaction Les e ´tudes en laboratoire de la re ´ponse de fondations peu profondes n’ont jusqu’ici pris en compte que la charge planaire. Cet expose ´ de ´crit les travaux expe ´rimentaux effectue ´s en utilisant un dispositif de charge qui applique une charge ge ´ne ´rale a ` deux mode `les de fondations peu profondes. La charge, qui met en oeuvre les six degre ´s de liberte ´ [verticale (V), horizontale (H 2 , H 3 ), torsion (Q) et moment de retournement (M 2 , M 3 )], a e ´te ´ applique ´e a ` une fondation plate circulaire de 150 mm de diame `tre dans un sable de silice sec et meuble. Nous de ´crivons brie `vement les aspects de cette installation mais ce qui importe vraiment est la pre ´sentation des re ´sultats expe ´ri- mentaux. Ceux-ci fournissent une preuve en faveur de la ge ´ne ´ralisation des mode `les existants de plasticite ´ durcis- sant a ` froid des conditions de charge planaire sous condition de charge ge ´ne ´rale. Cette preuve est utilise ´e pour e ´largir un mode `le nume ´rique existant au cas de liberte ´ de six degre ´s ; les re ´sultats de la simulation sont compare ´s aux re ´sultats expe ´rimentaux. INTRODUCTION Understanding the response of circular shallow foundations to general loading is an important branch of geotechnical engineering. In particular, when considering the design of the foundations for offshore structures it is important to understand the load–displacement response (that is, the stiffness) as well as the ultimate capacity. This is the case for the two offshore structures shown in Fig. 1. The first is a concept for an offshore wind turbine, and the second repre- sents a mobile jack-up drilling unit. The severe loading conditions found offshore often lead to large vertical (V), horizontal (H) and moment (M) loads being applied to the foundations, with typical resultant loads for the two applica- tions shown in the figure. There are clearly differences in the magnitudes of loads applied to the structures, and the foundations must be designed to carry these loads safely. A typical assumption is that the loads applied to the structure are in-plane. However, for both of the applications shown this is clearly a simplification of the actual conditions. For instance, in the case of the wind turbine the wind and wave directions may not be collinear. Therefore the loads applied to the foundation cannot be represented as planar. Similarly, for the mobile drilling unit the environmental forces on the structure might apply torsions to the foundations as well as moment and horizontal loads that are not co-planar. There- fore, to correctly predict the response and capacity of these structures it is necessary to understand the effect that three- dimensional loading conditions might have on the foundation response. Earlier studies such as those by Meyerhof (1953), Hansen (1961, 1970) and Vesic (1973, 1975) considered ultimate capacity of shallow foundations under the applied in-plane loads. Foundation shape and load eccentricity were ac- counted for with empirical parameters. However, this ap- proach is not appropriate for prediction of foundation stiffness and incorporation into numerical analysis packages. More recent studies (Gottardi et al., 1999; Martin & Houlsby, 2000, 2001; Byrne & Houlsby, 2001; Cassidy et al., 2002; Houlsby & Cassidy, 2002) have developed an alternative framework based on the theory of strain-harden- ing plasticity. In these studies the theoretical development has been linked with experimental work to calibrate the models. The theories provide a very satisfactory simulation Manuscript received 3 January 2006; revised manuscript accepted 25 April 2006. Discussion on this paper closes on 1 February 2007, for further details see p. ii. * Centre for Offshore Foundation Systems, University of Western Australia. † Department of Engineering Science, University of Oxford, UK. Fig. 1. Two different structures where three-dimensional effects must be accounted for
Transcript
Bienen, B., Byrne, B. W., Houlsby, G. T. & Cassidy, M. J. (2006). Geotechnique 56, No. 6, 367–379
367
Investigating six-degree-of-freedom loading of shallow foundations onsand
B. BIENEN*, B. W. BYRNE†, G. T. HOULSBY† and M. J. CASSIDY*
Laboratory studies of the response of shallow foundationshave previously considered only planar loading. Thispaper describes experimental work carried out using aloading device that applies general loading onto modelshallow foundations. The loading, involving all six degreesof freedom [vertical (V), horizontal (H2, H3), torsion (Q)and overturning moment (M2, M3)], has been applied toa 150 mm diameter circular flat rough foundation on aloose dry silica sand. Aspects of the loading rig designare briefly described, but the main focus is the presenta-tion of the experimental results. These provide evidencefor the generalisation of existing work-hardening plasti-city models from planar loading to general loading condi-tions. This evidence is used to extend an existingnumerical model to the six-degree-of-freedom case, andthe simulation results are compared with the experimen-tal results.
Les etudes en laboratoire de la reponse de fondations peuprofondes n’ont jusqu’ici pris en compte que la chargeplanaire. Cet expose decrit les travaux experimentauxeffectues en utilisant un dispositif de charge qui appliqueune charge generale a deux modeles de fondations peuprofondes. La charge, qui met en oeuvre les six degres deliberte [verticale (V), horizontale (H2, H3), torsion (Q) etmoment de retournement (M2, M3)], a ete appliquee aune fondation plate circulaire de 150 mm de diametredans un sable de silice sec et meuble. Nous decrivonsbrievement les aspects de cette installation mais ce quiimporte vraiment est la presentation des resultats experi-mentaux. Ceux-ci fournissent une preuve en faveur de lageneralisation des modeles existants de plasticite durcis-sant a froid des conditions de charge planaire souscondition de charge generale. Cette preuve est utiliseepour elargir un modele numerique existant au cas deliberte de six degres ; les resultats de la simulation sontcompares aux resultats experimentaux.
INTRODUCTIONUnderstanding the response of circular shallow foundationsto general loading is an important branch of geotechnicalengineering. In particular, when considering the design ofthe foundations for offshore structures it is important tounderstand the load–displacement response (that is, thestiffness) as well as the ultimate capacity. This is the casefor the two offshore structures shown in Fig. 1. The first is aconcept for an offshore wind turbine, and the second repre-sents a mobile jack-up drilling unit. The severe loadingconditions found offshore often lead to large vertical (V),horizontal (H) and moment (M) loads being applied to thefoundations, with typical resultant loads for the two applica-tions shown in the figure. There are clearly differences inthe magnitudes of loads applied to the structures, and thefoundations must be designed to carry these loads safely. Atypical assumption is that the loads applied to the structureare in-plane. However, for both of the applications shownthis is clearly a simplification of the actual conditions. Forinstance, in the case of the wind turbine the wind and wavedirections may not be collinear. Therefore the loads appliedto the foundation cannot be represented as planar. Similarly,for the mobile drilling unit the environmental forces on thestructure might apply torsions to the foundations as well asmoment and horizontal loads that are not co-planar. There-fore, to correctly predict the response and capacity of thesestructures it is necessary to understand the effect that three-
dimensional loading conditions might have on the foundationresponse.
Earlier studies such as those by Meyerhof (1953), Hansen(1961, 1970) and Vesic (1973, 1975) considered ultimatecapacity of shallow foundations under the applied in-planeloads. Foundation shape and load eccentricity were ac-counted for with empirical parameters. However, this ap-proach is not appropriate for prediction of foundationstiffness and incorporation into numerical analysis packages.More recent studies (Gottardi et al., 1999; Martin &Houlsby, 2000, 2001; Byrne & Houlsby, 2001; Cassidy etal., 2002; Houlsby & Cassidy, 2002) have developed analternative framework based on the theory of strain-harden-ing plasticity. In these studies the theoretical developmenthas been linked with experimental work to calibrate themodels. The theories provide a very satisfactory simulation
Manuscript received 3 January 2006; revised manuscript accepted25 April 2006.Discussion on this paper closes on 1 February 2007, for furtherdetails see p. ii.* Centre for Offshore Foundation Systems, University of WesternAustralia.† Department of Engineering Science, University of Oxford, UK.
����
����
���� ���
����
�����
������
Fig. 1. Two different structures where three-dimensional effectsmust be accounted for
of the load–displacement behaviour of shallow foundations,and are now being applied to other soil–structure interactionproblems (such as pipelines).
For combined loading on circular foundations the theoryhas four components
(a) a yield surface determining the interaction between therelevant loads (V, M/2R, H)
(b) a description of the elastic behaviour of the footing forload states within the yield surface
(c) a hardening law that defines how the yield surfaceexpands or contracts
(d) a plastic potential that describes the incremental plasticdisplacements at yield.
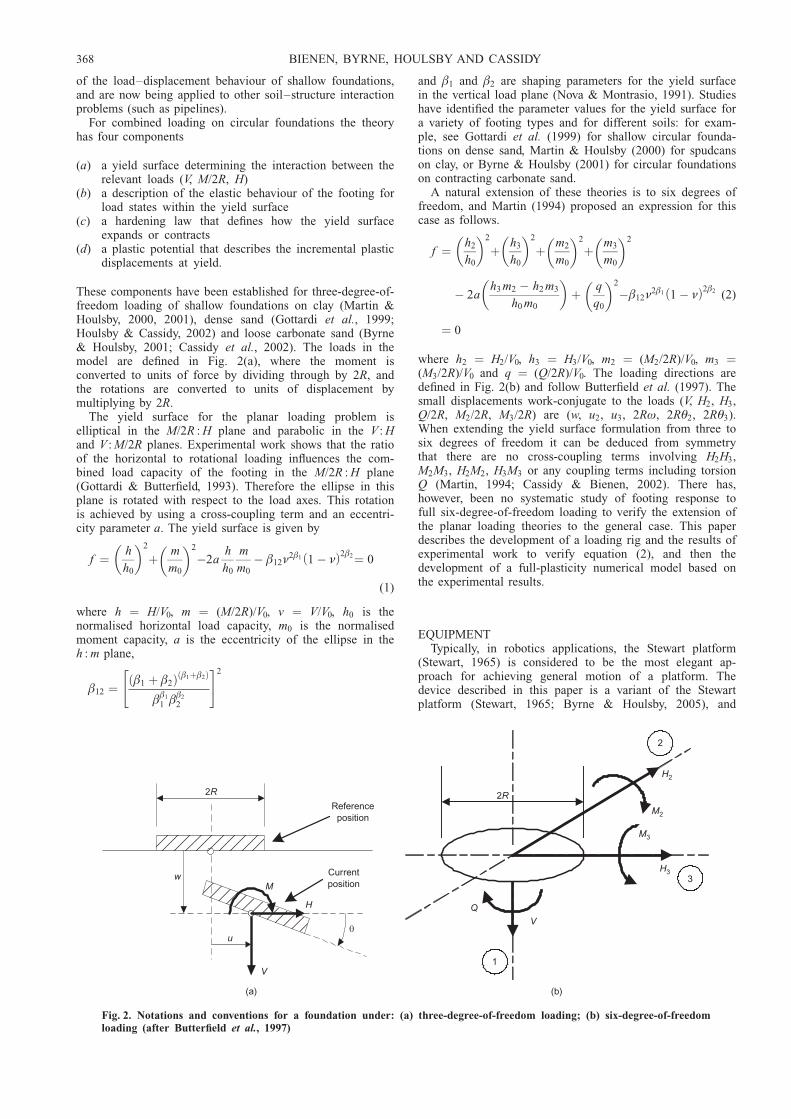
These components have been established for three-degree-of-freedom loading of shallow foundations on clay (Martin &Houlsby, 2000, 2001), dense sand (Gottardi et al., 1999;Houlsby & Cassidy, 2002) and loose carbonate sand (Byrne& Houlsby, 2001; Cassidy et al., 2002). The loads in themodel are defined in Fig. 2(a), where the moment isconverted to units of force by dividing through by 2R, andthe rotations are converted to units of displacement bymultiplying by 2R.
The yield surface for the planar loading problem iselliptical in the M/2R : H plane and parabolic in the V : Hand V : M/2R planes. Experimental work shows that the ratioof the horizontal to rotational loading influences the com-bined load capacity of the footing in the M/2R : H plane(Gottardi & Butterfield, 1993). Therefore the ellipse in thisplane is rotated with respect to the load axes. This rotationis achieved by using a cross-coupling term and an eccentri-city parameter a. The yield surface is given by
f ¼ h
h0
� �2
þ m
m0
� �2
�2ah
h0
m
m0
� �12�2�1 1 � �ð Þ2�2¼ 0
(1)
where h ¼ H/V0, m ¼ (M/2R)/V0, v ¼ V/V0, h0 is thenormalised horizontal load capacity, m0 is the normalisedmoment capacity, a is the eccentricity of the ellipse in theh : m plane,
�12 ¼ �1 þ �2ð Þ �1þ�2ð Þ
��1
1 ��2
2
" #2
and �1 and �2 are shaping parameters for the yield surfacein the vertical load plane (Nova & Montrasio, 1991). Studieshave identified the parameter values for the yield surface fora variety of footing types and for different soils: for exam-ple, see Gottardi et al. (1999) for shallow circular founda-tions on dense sand, Martin & Houlsby (2000) for spudcanson clay, or Byrne & Houlsby (2001) for circular foundationson contracting carbonate sand.
A natural extension of these theories is to six degrees offreedom, and Martin (1994) proposed an expression for thiscase as follows.
f ¼ h2
h0
� �2
þ h3
h0
� �2
þ m2
m0
� �2
þ m3
m0
� �2
� 2ah3 m2 � h2 m3
h0 m0
� �þ q
q0
� �2
��12�2�1 1 � �ð Þ2�2 (2)
¼ 0
where h2 ¼ H2/V0, h3 ¼ H3/V0, m2 ¼ (M2/2R)/V0, m3 ¼(M3/2R)/V0 and q ¼ (Q/2R)/V0. The loading directions aredefined in Fig. 2(b) and follow Butterfield et al. (1997). Thesmall displacements work-conjugate to the loads (V, H2, H3,Q/2R, M2/2R, M3/2R) are (w, u2, u3, 2Rø, 2RŁ2, 2RŁ3).When extending the yield surface formulation from three tosix degrees of freedom it can be deduced from symmetrythat there are no cross-coupling terms involving H2H3,M2M3, H2M2, H3M3 or any coupling terms including torsionQ (Martin, 1994; Cassidy & Bienen, 2002). There has,however, been no systematic study of footing response tofull six-degree-of-freedom loading to verify the extension ofthe planar loading theories to the general case. This paperdescribes the development of a loading rig and the results ofexperimental work to verify equation (2), and then thedevelopment of a full-plasticity numerical model based onthe experimental results.
EQUIPMENTTypically, in robotics applications, the Stewart platform
(Stewart, 1965) is considered to be the most elegant ap-proach for achieving general motion of a platform. Thedevice described in this paper is a variant of the Stewartplatform (Stewart, 1965; Byrne & Houlsby, 2005), and
��
��
�
����������������
���������������
��
�
���
��
��
�
��
��
��
���
���
Fig. 2. Notations and conventions for a foundation under: (a) three-degree-of-freedom loading; (b) six-degree-of-freedomloading (after Butterfield et al., 1997)
368 BIENEN, BYRNE, HOULSBY AND CASSIDY
similar arrangements are used, for instance, in the automo-bile industry for dynamic testing of vehicles.
The testing rigThe system uses six actuators that, at one end, are
connected to the loading platform, and at the other areconnected to a stiff reaction frame. Provided that six prop-erly arranged actuators are used, pinned at both ends, then itis possible to achieve six-degree-of-freedom motion of theplatform by changing the lengths of the actuators in acoordinated fashion. By careful selection of the actuatorgeometry, it is possible to ensure that the control problem iswell conditioned, so that calculations proceed in a straight-forward fashion.
The disadvantage of the Stewart platform is that thesimple motions are not linearly or independently related tothe motion of any individual actuator, unlike the planarloading system designed by Martin (1994). Quite complexcontrol routines are required to ensure that all actuatorsmove in concert to achieve the desired motion. Fig. 3 showsthe loading rig as constructed, showing three actuatorsapproximately vertical and three actuators approximatelyhorizontal. This arrangement ensures that the problem iswell conditioned, as the main motions can be directly relatedto the motions of a subset of the actuators. For example, toachieve vertical movement the three vertical actuators mustmove the same distance, whereas only a slight adjustment ofthe horizontal actuators is required.
The actuators, supplied by Ultra Motion, are linear actua-tors each powered by an Animatics SmartMotor. This is abrushless DC servo-motor incorporating an integrated con-trol system comprising a motion controller, encoder andamplifier. The actuators have a maximum extension of200 mm and can move at rates of up to 5 mm/s. Commandsto individual actuators can specify relative motions, position,velocity or acceleration, and they can be executed simulta-neously. A number of sequential moves can be downloadedto on-board memory on the actuators, and then executedaccording to a synchronised clock system. This makes itpossible to execute complicated platform motions providedone can determine, in advance, a time history of theindividual actuator motions required.
The control programA program has been written in Visual Basic to control the
system. The program allows input of a sequence of moves interms of the motions (w, u2, u3, ø, Ł2, Ł3) of the platform,known as the pose. These motions can be described in termsof a rotation and translation matrix (that is, a transformationmatrix). By using the transformation matrix, applied to thecoordinates of the platform, it is possible to determine therequired lengths of each actuator for a particular move. Tomove the platform to the new position simply requiresextending/retracting each actuator to its required length. Thiscalculation procedure is known as the inverse kinematicsproblem and is a simple analytical calculation.
���
���������������������������
�����������������
!"����������#$�����%����������
!"����������# &'(���������
)�����%
���
���
Fig. 3. Loading apparatus, showing: (a) general arrangement; (b) close-up of footing and LVDT arrangement; (c) detail of six-degree-of-freedom load cell
SIX-DEGREE-OF-FREEDOM LOADING OF SHALLOW FOUNDATIONS ON SAND 369
The reverse calculation, called the forward kinematicsproblem, is not so straightforward, and requires an iterativesolution. If the lengths of each actuator are known, then it ispossible to calculate the new pose of the platform. Withinthe actuators are linear potentiometers that allow measure-ment of the current length of each actuator, and thereforecan be used to determine the pose of the platform. Bothinverse and forward kinematics procedures are performedwithin the software.
A typical test proceeds by determining the initial platformpose using the forward procedure. The user then specifies asequence of moves. These moves are broken into incrementsso that the non-linearity of motion of each actuator can becaptured. The inverse procedure is used to calculate for eachof the moves the required length of each actuator. A file ofactuator lengths with time (position–time data) is recorded.The relevant data from this file are sent to each actuator,and each movement is executed simultaneously. While themoves are being performed the control program logs thedata. In particular, the actuator lengths are recorded andthe platform pose is calculated and displayed. Currently theloading device can execute displacement-controlled motionsand only relatively simple load control sub-tests. The testsdescribed in this paper are all displacement controlled.
Load cellThe load cell measures the six components of load on the
foundation, which for these tests was a rough flat circularfooting 150 mm in diameter. The load cell is a thin-walledcylinder, fabricated from aluminium alloy, of radius r ¼27.5 mm, wall thickness t ¼ 0.475 mm and length 70 mm.The thin-walled section was machined from a larger block,leaving heavy end flanges with an appropriate transitionfrom cylinder to flanges to minimise stress concentrations. Atotal of 32 strain gauges are fixed to the outer surface of thecylinder to measure appropriate strains. Fig. 3(c) shows thecompleted cell. The strain gauges were arranged in sixWheatstone bridge circuits, each corresponding to the meas-urement of a particular load component. Each circuit wasfully compensated for temperature. Eight gauges were usedfor the vertical and torque circuits, and four gauges for eachof the moment and horizontal load circuits. The cell wascalibrated by applying known loads and measuring the out-put from all six circuits. By varying the loads one at a time,it is possible to determine components of the matrix Xrelating loads to voltages in the equation C ¼ XF, where Cis the circuit output vector and F is the load vector. Invert-ing X produces a six-by-six calibration matrix, so that loadsare calculated during the experiment. As the loads arecalculated they need to be transformed from the localcoordinate system (that is, the rotated system) back to theglobal system so that they are in accordance with theconvention shown in Fig. 2(b).
Small LVDT systemOne determination of the platform pose is achieved by using
the linear potentiometers within the actuators. This, however,provides only a coarse measurement of the platform pose. Inparticular, the rig stiffness affects the accuracy of this meas-urement. To achieve more accurate displacements a system ofsmall linear variable displacement transducers (LVDTs)(20 mm range) is used. These are placed in a similar config-uration to that of the actuators, but supported on a separateframe, as shown in Fig. 3(a). The forward kinematics calcula-tion is used to determine the pose of the platform, given thelengths of the LVDTs. This allows very fine resolution of thefoundation movement, to the order of a few micrometres.
Soil characteristicsThe experiments were carried out on dry yellow Leighton
Buzzard 14/25 silica sand. The characteristics are sum-marised in Table 1, and further information can be found inSchnaid (1990). The sand was carefully placed into the tankto achieve a very loose state. The average density of all testswas 14.80 kN/m3, which corresponds to a relative density Rd
of 5%. An overview of all the tests completed, includingdetails of the soil density for each test, can be found inBienen et al. (2005).
EXPERIMENTAL WORKThe experimental programme was designed to allow ver-
ification of the theory for six-degree-of-freedom loading.Specifically, the testing concentrated on ‘swipe’ testing (Tan,1990; Martin, 1994; Gottardi et al., 1999; Byrne, 2000;Martin & Houlsby, 2000), including in-plane swipe tests,torsion swipe tests and out-of-plane loading combinations, asthese have not been tested before. The swipe tests can beused to determine the shape of the yield surface. Otherexperiments, such as vertical loading tests and radial dis-placement tests, were performed to investigate the elasticresponse, the hardening behaviour and the flow rule. Asummary of the different tests is given in Table 2. Moredetails of the experiments and all of the data are found inBienen et al. (2005).
Yield surfaceA swipe is performed by vertically loading the footing to
a prescribed value, after which the footing is translated orrotated while the vertical displacement is kept constant. Themeasured loads provide direct information on the shape ofthe yield surface for that load path. If several of these testsare carried out at different deviatoric load combinations thenit is possible to fit a surface to the data, such as the onegiven by equation (1) for three degrees of freedom. Thisstrategy has been successfully used for the three-degree-of-freedom footing models. The same strategy can be employedfor the six-degree-of-freedom expression (equation (2)),although the number of tests becomes many times greater.In six degrees of freedom the swipes include both planarloadings and out-of-plane loadings. In order to reduce thenumber of tests to a feasible number, careful planning oftests is required (see Table 2).
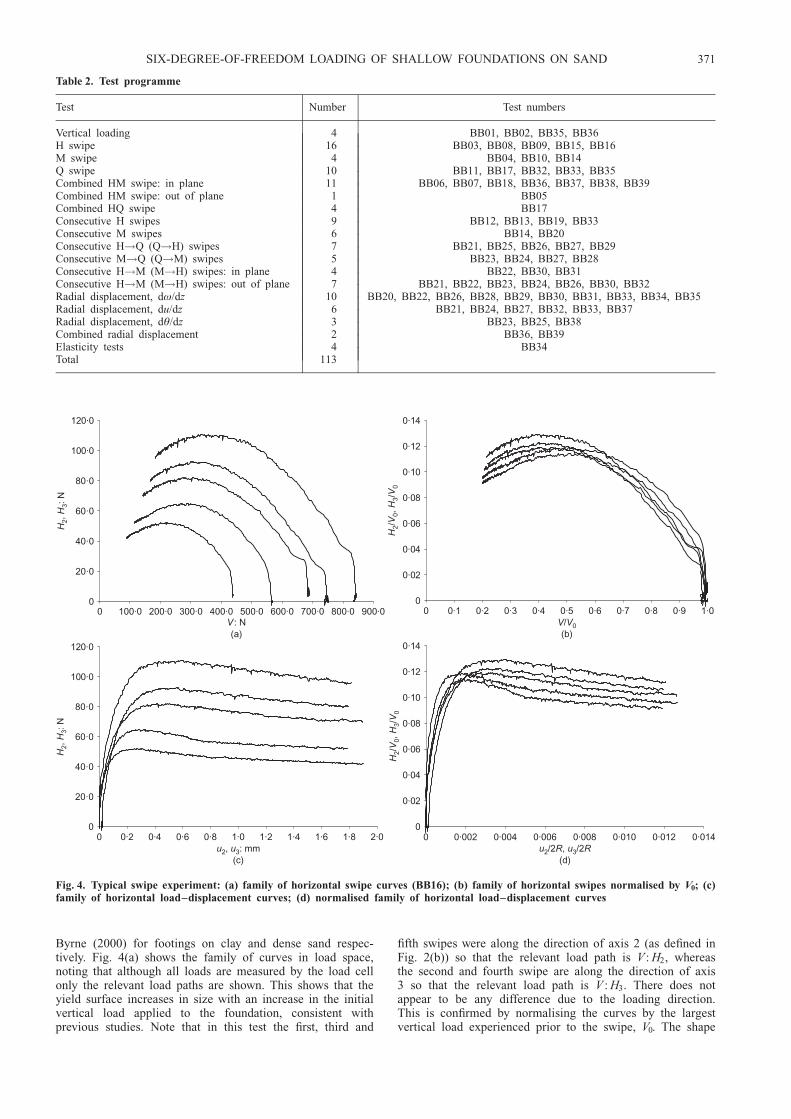
A typical series of swipe tests for horizontal translationsis shown in Fig. 4. The experiments were carried out bymoving the footing to a predetermined vertical displacement,locking at that displacement, and then translating the footinghorizontally. Once the test is completed the footing istranslated back to its original position before being pene-trated further into the sand, where a further test can becarried out. Provided that sufficient vertical penetration oc-curs, so that the virgin penetration line is rejoined, it isassumed that the previous test history will be erased and thatthe footing is penetrating through virgin soil. This allowsseveral tests to be completed on any one sample. Thisstrategy was employed successfully by Martin (1994) and
Particle sizes D10, D30, D50, D60: mm 0.63, 0.70, 0.80, 0.85Specific gravity, Gs 2.65Coefficient of uniformity, Cu 1.3Minimum dry density, ªmin: kN/m3 14.65Maximum dry density, ªmax: kN/m3 17.58Critical state friction angle, �cs: degrees 34.3
370 BIENEN, BYRNE, HOULSBY AND CASSIDY
Byrne (2000) for footings on clay and dense sand respec-tively. Fig. 4(a) shows the family of curves in load space,noting that although all loads are measured by the load cellonly the relevant load paths are shown. This shows that theyield surface increases in size with an increase in the initialvertical load applied to the foundation, consistent withprevious studies. Note that in this test the first, third and
fifth swipes were along the direction of axis 2 (as defined inFig. 2(b)) so that the relevant load path is V : H2, whereasthe second and fourth swipe are along the direction of axis3 so that the relevant load path is V : H3. There does notappear to be any difference due to the loading direction.This is confirmed by normalising the curves by the largestvertical load experienced prior to the swipe, V0. The shape
Fig. 4. Typical swipe experiment: (a) family of horizontal swipe curves (BB16); (b) family of horizontal swipes normalised by V0; (c)family of horizontal load–displacement curves; (d) normalised family of horizontal load–displacement curves
SIX-DEGREE-OF-FREEDOM LOADING OF SHALLOW FOUNDATIONS ON SAND 371
and size of the normalised curves given in Fig. 4(b) aresimilar. The load–displacement curves associated with thisfamily of tests are plotted in Fig. 4(c). The peak horizontalload is mobilised fairly quickly after the translation com-mences. Fig. 4(d) shows that the normalised curves are alsosimilar in load–displacement space.
Similar responses are evident for tests where rotations areapplied to the foundation at constant vertical displacement.Fig. 5(a) compares the results from a horizontal swipe, arotational swipe and a torsional swipe test. The plot showsthat the yield surface size differs for each of the loadingmodes, and the shape varies slightly as well. The swipes inthe horizontal plane show a larger yield surface than thosein the rotational plane. The yield surface mapped out bytorsional swipes is smaller still. Although the size of theyield surface in the respective planes differs, the three testsshown trace similar paths when normalised by the maximumpure load capacity in the respective direction. This isillustrated in Fig. 5(b), where the loads other than verticalare collapsed into a normalised deviator force
It is clear that the shapes for the different modes ofloading are slightly different. We, however, assume that theshapes are the same, so as to simplify the fitting of equation(2) to the data. We also make the simplifying assumptionthat the values of the parameters h0 , m0 and q0 remainconstant with footing penetration, although Byrne &Houlsby (2001) suggest that h0 is a function of footingembedment. Further swipes were carried out that use acombination of translation and rotation, either in-plane orout-of-plane. The results of all 46 pure swipe tests arecollated in Fig. 6 using equation (4). This figure also showsthe best-fit parabolic yield surface. The yield surface para-meters, obtained by carrying out a least-squares regressionof the data onto equation (2), are given by
h0 ¼ 0:122, m0 ¼ 0:075, q0 ¼ 0:033
a ¼ �0:112, �1 ¼ 0:76, �2 ¼ 0:76
The yield surface parameters determined for the loosesilica sand here agree well with previous studies on differentdensities and even different sands (Cassidy, 1999; Gottardiet al., 1999; Byrne & Houlsby, 2001). Of course, theseprevious studies involved loading that is a subset of theloading patterns applied here.
A special set of swipe tests were carried out that involvechanging the direction of the swipe during the test. Forinstance, Fig. 7 shows the load data from a test whereinitially the footing was horizontally translated 0.25 mmalong axis 2 before being translated 1.75 mm along axis 3.
�
�*��
�*��
�*��
�*�+
�*�
�*�
�*�
0
�
1
�
�*��
�*��
�*��
�*+�
*��
*��
0
�1
��/��,��
�/��,��/�
���,��
�/��
��,��
�/��
��
� �* �*� �*� �*� �*� �*� �*. �*+ �* *��/�����
�/�
�
� �* �*� �*� �*� �*� �*� �*. �*+ �* *��/�����
Fig. 5. Three different swipe tests: (a) normalised by V0; (b) inthe plane X/V0
�
�*�
�*�
�*�
�*+
*�
*�
*�
2���3����"��$���������
��
� �4 �4� �4� �4� �4� �4� �4. �4+ �4 4����
Fig. 6. All swipe tests in deviator plane with best-fit yieldsurface
��*��
�
�*��
�*��
�*��
�*�+
�*�
�*�
�*�����
��/��,��
�/��
� �* �*� �*� �*� �*� �*� �*. �*+ �* *��/��
Fig. 7. Load paths traced by footing under combination ofconsecutive perpendicular horizontal translations
372 BIENEN, BYRNE, HOULSBY AND CASSIDY
Correspondingly, H2 increases and tracks around a yieldsurface. On changing the direction, H2 drops while H3 picksup and continues the track around the yield surface. Forcomparison the figure shows the yield surface for horizontalloads as defined by the parameter h0 above. Also shown inthe figure is a line that represents the point at which thedirection changes. Note that in the experiment the loadingrig is not infinitely stiff, and therefore after the change indirection there is still some movement along the axis 2direction although the main translation is along axis 3. Thisresults in a slower reduction in H2 than would be predictedby the numerical model. Several different combinations ofthese tests (38 in total) are listed in Table 2 and includetests where a translation is followed by a rotation and viceversa.
Hardening lawFigure 8(a) shows the typical vertical load–displacement
responses measured in the tests. Two tests were devotedsolely to vertical loading, and the initial vertical loadingcurves from the swipe tests provided extra data. The smallamount of scatter between the curves illustrates the repeat-ability of the tests and the uniformity in soil sample prepara-tion. Also shown in Fig. 8(a) is the hardening lawexpression fitted to the vertical load–displacement curves.The expression has the form
V0 ¼ k1wp
1 þ wp=w1
� �1 þ wp=w2
� �" #
(5)
where wp is the plastic component of the vertical displace-
ment (Cassidy et al., 2002). Note that Fig. 8(a) is presentedin terms of the total vertical displacement, which consists ofthe plastic displacement (as described in equation (5)) andan elastic displacement (described in the next section). Theparameters achieving the best fit for equation (5) are
k1 ¼ 51:25 N=mm, w1 ¼ 20:5 mm, w2 ¼ 8 mm
However, in a similar way to the results reported by Byrneyrne & Houlsby (2001), hardening as a function of theplastic vertical displacement did not capture the measuredresponse completely. Analysis of the radial displacementexperimental data showed that the pure vertical load capacityV0 calculated by fitting the yield surface expression usingthe measured loads gives significantly higher values thanpredicted by the hardening law (that is, the yield surface islarger than predicted by the current vertical plastic penetra-tion level). This implies that the hardening must be afunction of the radial plastic movements (translations androtations) as well as of the vertical movements. Equation (5)can be rewritten to incorporate radial hardening such that V0
is a function of the total plastic displacement, as follows.
V0 ¼ k1zp
1 þ zp=w1
� �1 þ zp=w2
� �" #
(6)
The total plastic displacement can be obtained by summa-tion of the incremental plastic displacement, given by
which now comprises all the plastic displacement compo-nents. The values for k1, w1 and w2 remain as before,because they achieved the best fit for purely vertical dis-placement. In order to establish the new parameters for themodel with radial hardening, both the hardening law and theyield surface parameters need to be adjusted until the resultsbecome consistent. The yield surface parameters presentedpreviously represent the best-fit values for the model thatincludes radial hardening. The additional radial hardeningparameters for equation (7) are
c1 ¼ 1:07, c2 ¼ 0:62, c3 ¼ 1:09
Figure 8(b) shows that this hardening law matches theexperimental data reasonably well. The best-fit values for theradial components of the hardening law are slightly largerthan the values suggested by Byrne & Houlsby (2001) forthe horizontal and rotational components of hardening on aloose carbonate sand. Further work is required to understandthe relationship between the nature and state of the soil andthis component of the model.
ElasticityTo establish parameters to describe the elastic behaviour
of the foundations several vertical unload–reload loops wereperformed during the vertical load displacement tests. Thisallows an assessment of the vertical elastic stiffness Kv, andanalysis of the data gives Kv ¼ 5.5 kN/mm. The elasticstiffness for the other degrees of freedom can be derivedfrom this vertical stiffness by considering the elastic stiffnessmatrix for circular footings, as follows.
Fig. 8. Hardening relationship: (a) compared with verticalload–displacement results; (b) compared with radial displace-ment results
SIX-DEGREE-OF-FREEDOM LOADING OF SHALLOW FOUNDATIONS ON SAND 373
dV
dH2
dH3
dQ=2R
dM2=2R
dM3=2R
8>>>>>><>>>>>>:
9>>>>>>=>>>>>>;
¼ 2GR
3
kv 0 0 0 0 0
0 kh 0 0 0 �kc
0 0 kh 0 kc 0
0 0 0 kq 0 0
0 0 kc 0 km 0
0 �kc 0 0 0 km
26666664
37777775
dw
du2
du3
2Rdø2RdŁ2
2RdŁ3
8>>>>>><>>>>>>:
9>>>>>>=>>>>>>;
(8)
The stiffness coefficients can be established by finiteelement analysis, such as those derived by Doherty & Deeks(2003) as kv ¼ 2.904, kh ¼ 2.901, km ¼ 0.548, kc ¼ �0.208and kq ¼ 0.918. Knowing the vertical elastic stiffness, theshear modulus can be derived (in these tests G � 12.7 MN/m2), and the entire elastic stiffness matrix can be estab-lished.
Flow ruleTo assess the flow behaviour and therefore define the
plastic potential requires tests that expand the yield surfacein a predefined manner. In a radial displacement test thefooting is moved into the soil at a fixed displacement ratiowhile the corresponding loads are measured. The footing iscontinually at yield. The combined load point must lie onthe current yield surface, and the displacement ratio at thatpoint enables the direction of plastic displacement at yieldto be identified. Various radial displacement tests have beencarried out to provide information about the flow rule,particularly in the torsional plane, where very limited experi-mental data are available.
The analysis of the data is carried out by considering theplastic deviatoric displacement direction evaluated from themeasured displacement data. For the three-degree-of-freedomcase Cassidy (1999) expressed the incremental plastic dis-placements at yield in the radial direction (that is, thedisplacement that is work conjugate to the load X defined inequation (4)) as
d�p,experiment ¼ º@ f
@X¼ º
2X
V 20
(9)
where º is a multiplier defining the magnitude of plasticdisplacement. This is derived from the continuity condition,which ensures that during yield the load point lies on thecurrent yield surface and therefore holds for the true loadingcase. To allow comparisons of plastic displacements numeri-cally predicted from measured loads and those actuallyfollowed in the experiments, equation (9) can be rewrittenfor the six-degree-of-freedom case as
d�2p,experiment ¼
1
1 � a2f(h0du2p)2 þ (h0du3p)2
þ ½m0(2RdŁ2p)�2 þ [m0(2RdŁ3p)]2g
þ 2ah0 m0
1 � a2[du3p(2RdŁ2p) � du2p(2RdŁ3p)] þ q2
0(2Rdøp)2
(10)
If associated flow is assumed for the X : V plane it ispossible to obtain a theoretical prediction of displacementsby differentiation of the yield surface function (equation(9)). The experimentally observed incremental plastic displa-cements (d�p : dwp) were found, however, to require non-
associated flow in this plane. The evidence for this is shownin Fig. 9, where the radial displacement test data have beenplotted in terms of tan�1(X/V) against tan�1(d�p/dwp). Forcomparison the figure shows predictions for associated flowand for various degrees of non-association using the flowrule given by
g V , H2, H3, M3=2R, M2=2R, Q=2Rð Þ
¼ H2
Æh h0V 90
� �2
þ H3
Æh h0V 90
� �2
þ M2=2R
Æm m0V 90
� �2
þ M3=2R
Æm m0V 90
� �2
�2aH3 M2=2R � H2 M3=2R
ÆhÆm h0 m0V 920
!
þ Q=2R
Æqq0V 90
!2
� �3 þ �4ð Þ �3þ�4ð Þ
��3
3 ��4
4
" #2V
V 90
� �2�3
1 � V
V 90
� �2�4
¼ 0
(11)
where the parameter V 90 represents the maximum purevertical load for the plastic potential such that it intersectsthe yield surface at the point of the current load state. �3
and �4 represent shaping parameters, and Æh, Æm and Æq areassociation factors as described by Cassidy (1999), Cassidyet al. (2002), Houlsby & Cassidy (2002) and Cassidy &Cheong (2005). In order to simplify the analysis of the datathe curvature parameters �3 and �4 are assumed to be equal.The association parameters Æh and Æm are taken to be equal,because the number of tests carried out does not allow anydistinction to be deduced with confidence. However, it isnecessary to use a higher value for Æq because the degree ofnon-association is much higher for this direction. The sum-mary best-fit parameters are
�3 ¼ �4 ¼ 0:52, Æh ¼ Æm ¼ 3:3, Æq ¼ 5:0
Curves representing this combination of parameters areshown in Fig. 9; note that these parameters are used in thenumerical predictions shown in the sections that follow. If,however, it is necessary to make all the association para-meters equal, the best-fit parameters are
�3 ¼ �4 ¼ 0:52, Æh ¼ Æm ¼ Æq ¼ 3:7
In the radial displacement tests the ratio of the applieddisplacements is held constant. Therefore a large number ofexperiments are required to collect a range of informationon the degree of non-association in a plane. An alternativeapproach to obtain information about the flow behaviour is
Fig. 9. Radial displacement tests and predictions for variousdegrees of non-association
374 BIENEN, BYRNE, HOULSBY AND CASSIDY
to carry out constant vertical load tests. These are similar toswipe tests, but the vertical load is held constant rather thanthe vertical displacement. It is not yet possible to carry outthis type of test with the equipment described here.
The study of flow has concentrated on planes that includevertical load and displacement. For plastic displacements inthe rotational-horizontal (M, H) planes, associated flow hasbeen assumed. This is based on the experimental evidencefrom three-degree-of-freedom investigations such as reportedby Gottardi et al. (1999), Martin & Houlsby (2000, 2001),Byrne & Houlsby (2001), Cassidy et al. (2002) and Houlsby& Cassidy (2002). The series of tests reported in this paperhas not focused on investigating this aspect of behaviour.
NUMERICAL PREDICTIONSThe experimental work above forms the basis for develop-
ing numerical models, such as that reported by Houlsby &Cassidy (2002), and in particular extending them from threeto six degrees of freedom. Based on the work of Martin &Houlsby (2000) and Houlsby & Cassidy (2002), a numericalfooting plasticity model has been developed called ISIS. Theremainder of this paper will outline the development of thismodel to account for six degrees of freedom and theresulting numerical predictions of the experimental work. Asummary of the parameters determined from the analysis ofthe experimental work is shown in Table 3. One of thedevelopments derived from the experimental work was toincorporate, into ISIS, hardening as a function of radialdisplacements rather than solely as a function of the verticalplastic penetration.
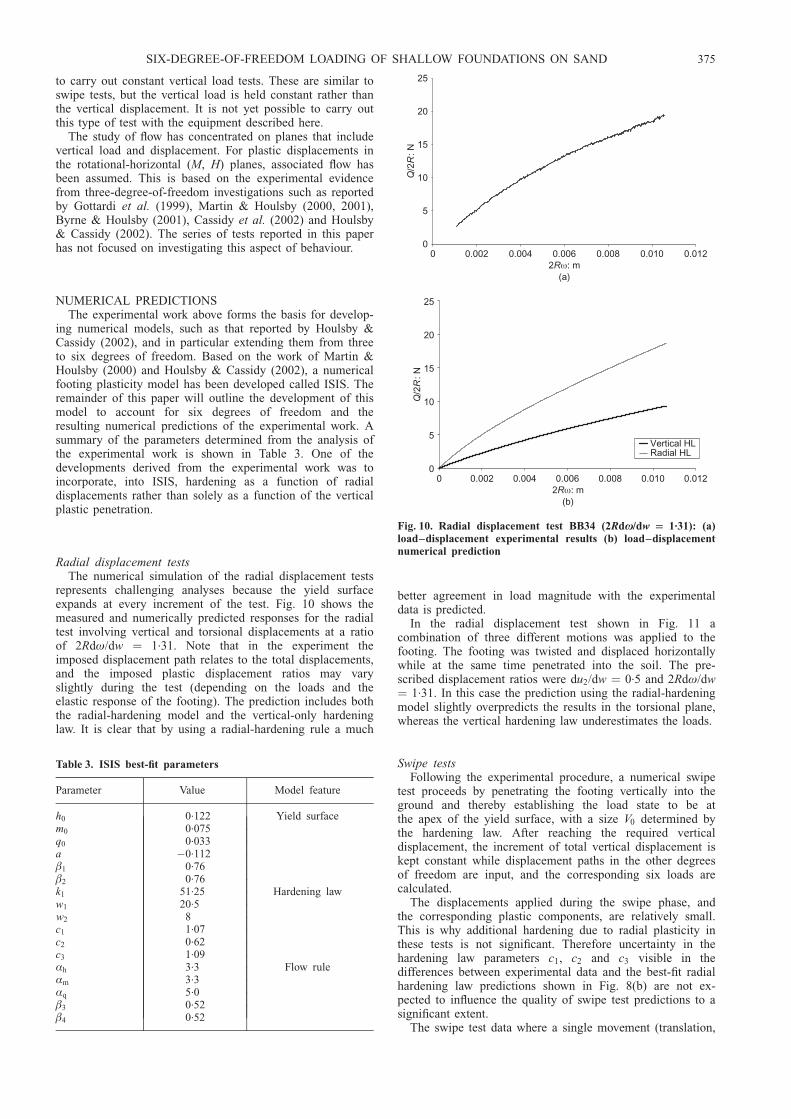
Radial displacement testsThe numerical simulation of the radial displacement tests
represents challenging analyses because the yield surfaceexpands at every increment of the test. Fig. 10 shows themeasured and numerically predicted responses for the radialtest involving vertical and torsional displacements at a ratioof 2Rdø/dw ¼ 1.31. Note that in the experiment theimposed displacement path relates to the total displacements,and the imposed plastic displacement ratios may varyslightly during the test (depending on the loads and theelastic response of the footing). The prediction includes boththe radial-hardening model and the vertical-only hardeninglaw. It is clear that by using a radial-hardening rule a much
better agreement in load magnitude with the experimentaldata is predicted.
In the radial displacement test shown in Fig. 11 acombination of three different motions was applied to thefooting. The footing was twisted and displaced horizontallywhile at the same time penetrated into the soil. The pre-scribed displacement ratios were du2/dw ¼ 0.5 and 2Rdø/dw¼ 1.31. In this case the prediction using the radial-hardeningmodel slightly overpredicts the results in the torsional plane,whereas the vertical hardening law underestimates the loads.
Swipe testsFollowing the experimental procedure, a numerical swipe
test proceeds by penetrating the footing vertically into theground and thereby establishing the load state to be atthe apex of the yield surface, with a size V0 determined bythe hardening law. After reaching the required verticaldisplacement, the increment of total vertical displacement iskept constant while displacement paths in the other degreesof freedom are input, and the corresponding six loads arecalculated.
The displacements applied during the swipe phase, andthe corresponding plastic components, are relatively small.This is why additional hardening due to radial plasticity inthese tests is not significant. Therefore uncertainty in thehardening law parameters c1, c2 and c3 visible in thedifferences between experimental data and the best-fit radialhardening law predictions shown in Fig. 8(b) are not ex-pected to influence the quality of swipe test predictions to asignificant extent.
The swipe test data where a single movement (translation,
SIX-DEGREE-OF-FREEDOM LOADING OF SHALLOW FOUNDATIONS ON SAND 375
rotation or combinations) was applied to the footing wereused to define the yield surface parameters. Some of thesingle-movement swipe tests were predicted numerically toshow accuracy of these parameters. However, Houlsby &Cassidy (2002) and Cassidy et al. (2002) provide severalretrospective simulations of horizontal and moment swipedata, and so therefore they are not repeated here. Thisprevious work did not examine the torsional swipe tests, andso we present a numerical prediction here.
Figure 12 shows the measured and predicted responses ina torsional swipe test. With the plastic potential parametersas derived from the experimental work (shown in Fig. 9),the predicted load–displacement response exhibits a pro-nounced peak, strain-softening and a low residual torsionalcapacity. This has not been observed in the experimentaldata, where there is virtually no softening after the peakload has been reached. The underprediction of torsion isreflected in the load plane (compare Figs 12(a) and 12(b)).The remarkable softening in the prediction is due principallyto an extreme sensitivity to the way flow is modelled, andthis aspect of the modelling requires further refinement. Forcomparison, if the flow parameters are derived so that a bestfit of the torsional swipe (from Fig. 12) is obtained as shownin Fig. 13(a), then it is not possible, using the currentformulation, to match the radial displacement test data suchas that from Fig. 10 accurately (shown in Fig. 13(b)).
Swipe testing with changing displacement pathAn important aspect of moving from a three- to a six-
degree-of-freedom model is the ability to predict the response
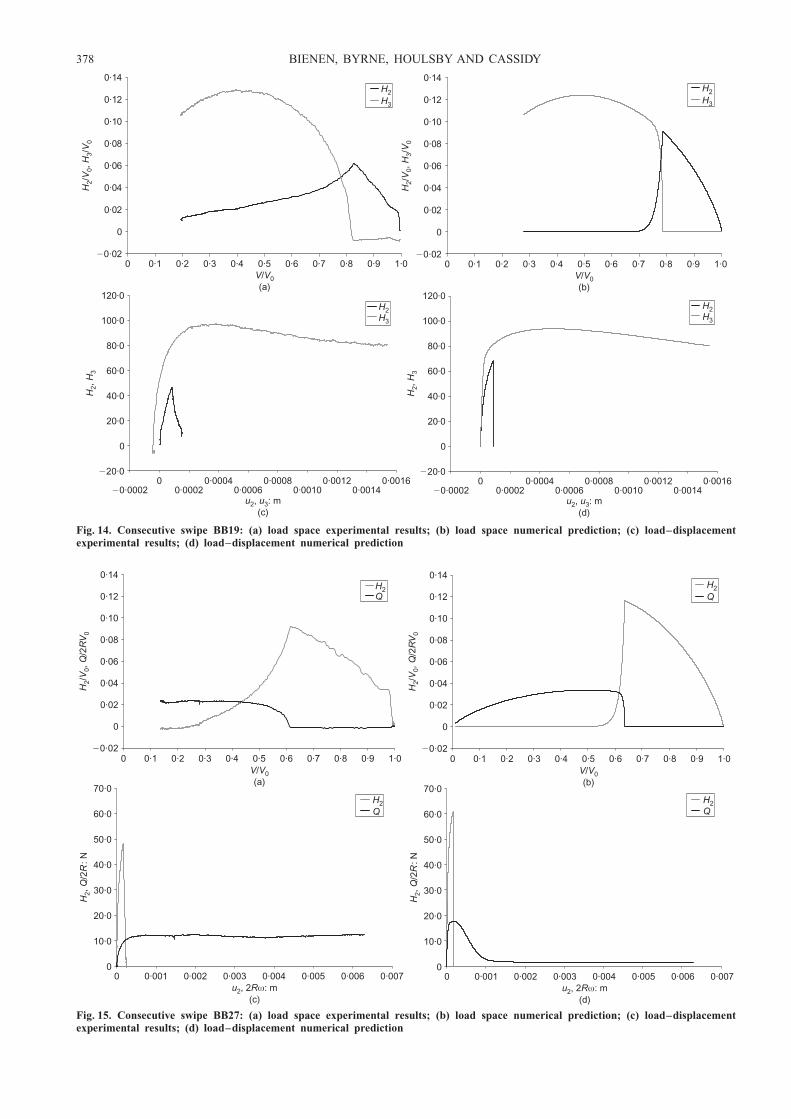
of the footing to a change in loading direction. As describedpreviously, several swipe tests incorporated a change indisplacement direction during the swipe, and an exampleresponse was shown in Fig. 7. A numerical prediction of thisresult is shown in Fig. 14. The numerical test involvedpreloading the footing to the target vertical displacement,followed by horizontal translation, while keeping the verticaldisplacement constant. After a short translation the footingwas translated perpendicular to the original direction.
The prediction matches the experimental data well for thecombined horizontal swipe shown in Fig. 14. The slightdifference in the prediction of the change in direction inload space (that is, smaller vertical load) is likely to be dueto an overestimation of the shear modulus. It is alsoimportant to be aware that the input data for the numericalsimulations were idealised from the experimental data. Inthe experiment u2 increased slightly after the application ofu3. There were also some minor movements of the otherdegrees of freedom. If the actual experimental displacementpaths are used for input into the numerical model a slightlycloser fit to the experiment is obtained.
The results from a numerical simulation of a secondcomplex swipe test are shown in Fig. 15, where reasonablygood agreement is evident. The overprediction of horizontalload by the numerical model is attributed largely to thiscurve falling slightly below the average curve that h0 isbased on. The result in the torsional direction is less good,as with the prediction of the single torsion swipe. While inload space the prediction is reasonable, the numerical load–displacement curve does not provide a good match to theexperimental data, again showing much stronger softening.
As highlighted in the previous section further work isrequired to address this shortcoming in the model.
In carrying out the retrospective analyses of the swipetests and radial displacement tests it was evident that anaccurate determination of the shear modulus G is important.Unload–reload loops in the vertical load–displacement testsallow the shear modulus to be estimated; however, typicallythese loops are hysteretic in character, and so assessing themodulus requires some judgement.
CONCLUSIONThe development of hardening plasticity models for repre-
senting foundation response has been dependent on bothexperimental and theoretical development. Initially, experi-mental research on three-degree-of-freedom loading allowedthe development of models applicable for planar loading(and structures). Though the theoretical framework describ-ing the extension to a six-degree-of-freedom model had beensuggested, this paper describes the results of an experimentalprogramme required to verify those extensions and to derivenumerous model parameters.
Specifically, a series of vertical load–displacement tests,swipe tests and radial displacement tests were carried out usinga loading device capable of applying general loading to modelfoundations. This represents the first comprehensive set ofexperimental evidence of the load–displacement behaviour ofa shallow foundation under true six-degree-of-freedom load-ing. The footing used in the experimental work was a roughcircular flat foundation, and it was tested on loose silica sand.
The results have allowed the yield surface and plasticpotential expressions for a six-degree-of-freedom plasticitymodel formulation to be assessed. A hardening law wassuggested that included radial hardening components similarto work reported by Byrne & Houlsby (2001). The elastic
stiffness was derived from unload–reload loops of verticalload–displacement tests. Finally, best-fit values for the plas-ticity model parameters in six degrees of freedom wereevaluated and presented.
Retrospective analyses of the experiments using a numer-ical formulation of the plasticity model, named ISIS, showeda good agreement with the experimental data. However,further research is required to increase the confidence in theradial hardening law parameters as well as the flow ruleparameters, especially in the torsional direction.
ACKNOWLEDGEMENTSThe first author gratefully acknowledges the support of an
International Postgraduate Research Scholarship of Australiaand the University of Western Australia Postgraduate Stu-dents Association Research Travel Award. The work de-scribed in this paper forms part of a programme ofcollaboration between the University of Oxford and theUniversity of Western Australia funded under ARC Interna-tional Linkage Award LX0560459.
The experimental equipment described in this paper wasdeveloped in Oxford and funded by the Lubbock Trustees,the Royal Society, EPSRC and the Department of Engineer-ing Science at Oxford. The authors are grateful for the workof Clive Baker and Chris Waddup, who constructed theloading device, and to Llywellyn ap Gwillym, Ed Stiles andRachel Williams, who have contributed to the developmentof the equipment.
H , H2, H3 horizontal forceh, h2, h3 normalised horizontal force
h0, m0, q0 maximum normalised forceKv vertical elastic stiffness
kv, k h, k m, kc, kq elastic stiffness coefficientsk1, w1, w2 hardening expression parameters
M , M2, M3 momentm, m2, m3 normalised moment
Q torsionq normalised torsionR footing radius
u, u2, u3 horizontal displacementV vertical force
V0 maximum vertical force applied to foundationV 90 vertical load associated with plastic potentialv normalised vertical forcew vertical displacementX deviator forcex normalised deviator forcez total displacement
Æh, Æm, Æq association factors for plastic potential�1, �2, �12 shaping parameters for the yield surface�3, �4, �34 shaping parameters for the plastic potentialŁ, Ł2, Ł3 rotation
º plastic multiplier� displacement conjugate to deviator forceø twist
Subscriptp plastic displacement
REFERENCESBienen, B., Byrne, B. W. & Houlsby, G. T. (2005). Six degree-of-
freedom loading of a circular flat footing on loose sand:Experimental data, Report No OUEL 2289/05. Oxford: Depart-ment of Engineering Science, University of Oxford.
Butterfield, R., Houlsby, G. T. & Gottardi, G. (1997). Standardisedsign conventions and notation for generally loaded foundations.Geotechnique 47, No. 4, 1051–1054; corrigendum 48, No. 1,157.
Byrne, B. W. (2000). Investigations of suction caissons in densesand. DPhil. thesis, University of Oxford.
Byrne, B. W. & Houlsby, G. T. (2001). Observations of footingbehaviour on loose carbonate sands. Geotechnique 51, No. 5,463–466.
Byrne, B. W. & Houlsby, G. T. (2005). Investigating 6 degree-of-freedom loading on shallow foundations. Proceedings of theinternational symposium on frontiers in offshore geotechnics(ISFOG), Perth, 477–482.
Cassidy, M. J. (1999). Non-linear analysis of jack-up structuressubjected to random waves. DPhil. thesis, University of Oxford.
Cassidy, M. J. and Bienen, B. (2002). Three-dimensional numericalanalysis of jack-up structures on sand. Proc. 12th Int. Offshoreand Polar Engineering Conf., Kitakyushu, 807–814.
Cassidy, M. J. & Cheong, J. (2005). The behaviour of circularfootings on sand subjected to combined vertical-torsion loading.Int. J. Phys. Model. Geotech. 5, No. 4, 1–14.
Cassidy, M. J., Byrne, B. W. and Houlsby, G. T. (2002). Modellingthe behaviour of circular footings under combined loading onloose carbonate sand. Geotechnique 52, No. 10, 705–712.
Doherty, J. P. & Deeks, A. J. (2003). Elastic response of circularfootings embedded in a non-homogeneous half-space. Geotech-nique 53, No. 8, 703–714.
Gottardi, G. & Butterfield, R. (1993). On the bearing capacity ofsurface footings on sand under general planar loads. SoilsFound. 33, No. 3, 68–79.
Gottardi, G., Houlsby, G. T. and Butterfield, R. (1999). Plasticresponse of circular footings on sand under general planarloading. Geotechnique 49, No. 4, 453–469.
Hansen, J. B. (1961). A general formula for bearing capacity,Bulletin No 11. Copenhagen: Danish Geotechnical Institute.
Hansen, J. B. (1970). A revised and extended formula for bearingcapacity, Bulletin No 28, pp. 5–11. Copenhagen, Danish Geo-technical Institute.
Houlsby, G. T. & Cassidy, M. J. (2002). A plasticity model for thebehaviour of footings on sand under combined loading. Geotech-nique 52, No. 2, 117–129.
Martin, C. M. (1994). Physical and numerical modelling of offshorefoundations under combined loads. DPhil thesis, University ofOxford.
Martin, C. M. & Houlsby, G. T. (2000). Combined loading ofspudcan foundations on clay: laboratory tests. Geotechnique 50,No. 4, 325–338.
Martin, C. M. & Houlsby, G. T. (2001). Combined loading ofspudcan foundations on clay: numerical modelling. Geotech-nique 51, No. 8, 687–700.
Meyerhof, G. G. (1953). The bearing capacity of foundations undereccentric and inclined loads. Proc. 3rd Int. Conf. Soil Mech.Found. Engng, Zurich, 1, 440–445.
Nova, R. & Montrasio, L. (1991). Settlement of shallow foundationson sand. Geotechnique 41, No. 2, 243–256.
Schnaid, F. (1990). A study of the cone-pressuremeter test in sand.DPhil thesis, University of Oxford.
Stewart, D. (1965). A platform with six degrees of freedom. Proc.Instn Mech. Engrs 180, No. 15, 371–384.
Tan, F. S. C. (1990). Centrifuge and numerical modelling of conicalfootings on sand. PhD thesis, University of Cambridge.
Vesic, A. S. (1973). Analysis of ultimate loads of shallow founda-tions. J. Soil Mech. Found. Div. ASCE 99, No. 1, 45–73.
Vesic, A. S. (1975). Bearing capacity of shallow foundations. InFoundation engineering handbook (eds H. F. Winterkorn andH. Y. Fang), pp. 121–147. New York: Van Nostrand.
SIX-DEGREE-OF-FREEDOM LOADING OF SHALLOW FOUNDATIONS ON SAND 379