Page 1
Journal of Economics and Sustainable Development www.iiste.org
ISSN 2222-1700 (Paper) ISSN 2222-2855 (Online)
Vol.7, No.11, 2016
137
Investigating the Effect of Fertilizer Subsidy on Agricultural
Production and its Implication on Food Security in Nigeria (1981-
2012)
1Binuomote, S. O and
2K. A. Odeniyi
1Department of Agricultural Economics,
Ladoke Akintola University of Technology, P. M. B. 4000,
Ogbomoso. Nigeria
[email protected] ; +2348033879828
2Department of Agricultural and Food Economics,
School of Agriculture, Policy and Development,
University of Reading, Berkshire
Abstract
The study examines the impact of government funded fertilizer subsidies on agricultural
production in Nigeria. The data for this study are primarily time series data at macro level
spanning from 1981 to 2012. Data on agricultural gross domestic product, exchange rate,
crude oil price, capital, agricultural land, foreign direct investment into the agricultural
sector and data on fertilizer subsidy costs were sourced from the Food and Agricultural
Organization (FAO) online Statistical data base of the United Nations, Penn world data of
the University of Pennsylvania and Central Bank of Nigeria (CBN) statistical bulletin and the
National Bureau of Statistics, Federal Ministry of Agriculture, International Fertilizer
Development Centre (IFDC), Federal Fertilizer Department (FFD), Project Coordinating
Unit (PCU) and Farm management survey and advisory services. The Johansen approach to
cointegration and error correction modeling was used in analyzing the data. The results show
that capital, foreign direct investment into the Nigeria agricultural sector and fertilizer
subsidy cost all have positive and significant effects on agricultural production in Nigeria.
The coefficient for the error correction mechanism (ECM) is -1.234 which indicates that the
deviation of agricultural production, proxy as gross domestic product (LAGDP) from the
long-run equilibrium level is corrected by about 123% in the current period. This shows that
the speed of adjustment of the Nigerian agricultural production to the state of equilibrium is
very high (all things being equal).
Keywords: Fertilizer, Subsidy, Cointegration, Nigeria, Agriculture.
1.0 Introduction
Fertilizer is one of the major farm inputs for achieving the green revolution objective in the
world. According to Dada (2006), during the Africa Fertilizer Summit, it is generally
believed that not less than 50% of incremental crop output in the past five decades is
attributable to fertilizer use. Owing to fertilizer use, along with other inputs such as seeds and
agro chemicals, many countries of the world with high population densities have been able to
achieve, relatively, food self-sufficiency in the past decades (World Bank, 2004).
Unfortunately, the benefits of green revolution did not accrue significantly to sub-Saharan
Page 2
Journal of Economics and Sustainable Development www.iiste.org
ISSN 2222-1700 (Paper) ISSN 2222-2855 (Online)
Vol.7, No.11, 2016
138
Africa to any perceptible extent due, among other reasons, to inadequate use of fertilizer
(FGN, 2005).
Agriculture, forests, and fisheries together contribute about 32 percent of the gross domestic
product (GDP) in Nigeria. Moreover, the sector employs about 60 percent of the working
rural population (World Bank 2012). Additionally, the Nigerian agricultural sector
contributed more than 50 percent of its GDP growth between 2000 and 2007 (Headey et al.
2010). This under-scores the key role of agriculture in Nigeria’s efforts to transform the
economy. However, agricultural GDP growth in Nigeria has largely been due to area
expansion rather than to increased productivity. Indeed, agricultural yields in Nigeria have
been stagnant or declining, raising concerns about the sector’s sustainability and rural poverty
reduction efforts in general. The large contribution of the agricultural sector and the large
share of the working population employed in the sector underscore that agricultural
development must be part of any poverty reduction strategy in Nigeria.
In Nigeria, Agricultural productivity estimates showed a decline in productivity growth from
1960s to the 1980s. The decline of agriculture production in the country began with the arrival
of the petroleum boom in the early 1970. Although, the country has witnessed strong
economic growth in the past few years, averaging 8.8 percent real annual GDP growth from
2000 to 2007 (Dayo et., al. 2009). However, the agriculture sector has lagged behind GDP
growth, growing at 3.7 percent in 2007. The over dependency on crude oil discovery at the
expense of agriculture that contribute large percentage to our nation GDP might be one of the
reason agriculture production in Nigeria still suffer set back. Moreover, the country currently
has 75 percent of its land suitable for agriculture that might have enhance agricultural
production to a large and reasonable extent, but only 40% is cultivated (Omorogiuwa et., al.
2014). Sadly speaking, the repeated re cultivation of the 40% land suitable for agriculture
couple with erosion and Flooding over the years also takes some millions of arable land out of
production each year during the rainy season. The fragility and high susceptibility of the soils
in Nigeria to degradation and loss of nutrients make augmentation through the use of
fertilizers necessary to obtain reasonable yield (Alimi, Ajewole, Awosola and Idowu, 2006).
Meanwhile, developing a competitive commercial sector for supplying agricultural inputs like
fertilizer is critical for sustainable agricultural sector growth. The role of fertilizer to
positively increase and improve production can never be swept under the carpet and this is
well established all over the world. Fertilizer use in average for the world, Africa and Nigeria
is given as 91kg/ha; 19kg/ha; and 8kg/ha respectively ( Idachaba, 2006). But Nigerians
fertilizer usage is far less than the FAO recommended (200kg/ha) rate. Therefore, the need for
Nigeria to intensify fertilizer use so as to improve agricultural productivity and raise rural
income in the face of a rapidly growing population and worsening poverty incidence has
become obvious (Idachaba, 2006). The governments stated reason for fertilizer subsidies in
the country as a means of relief to farmers that cannot afford the high free market fertilizer
price; the implication is that the crop product price to fertilizer price ratio is too low for
farmers to invest in fertilizer (Nwagbo, 2005). Hence fertilizer subsidy policy reform over the
years has been to boost productivity in the country.
Agricultural input subsidies, including those on fertilizer, have been one of the widely used
policy instruments in developing countries to develop a vibrant private sector for the supply
of such inputs, as well as for raising farmers’ income and agricultural productivity. The
effectiveness of such subsidy programs has attracted much discussion in the literature. Public
Page 3
Journal of Economics and Sustainable Development www.iiste.org
ISSN 2222-1700 (Paper) ISSN 2222-2855 (Online)
Vol.7, No.11, 2016
139
input subsidies are rarely the best policy for developing the commercial input sector as it leads
to Pareto inefficient resource allocation. This tends to induce overuse of inputs and creates
uncompetitive private agro-dealers who cannot survive without a permanent subsidy.
However, subsidies can be a second best policy if their use can address various market
failures (Stiglitz 1987). Moreover, subsidies can be a second best policy for the development
of the commercial input sector, if the use of subsidies on inputs can crowd-in the commercial
sector by addressing key market failures. However a key condition of the use of subsidies for
such purposes is that the subsidies help the sector to grow sustainably so there will be no need
for subsidies in the longer term.
There has been a lot of fertilizer policy reform in Nigeria over the years. A key feature of
Nigeria’s old system of fertilizer subsidy was a very active role of the state in fertilizer
delivery. The federal government was in fact the sole procurer of fertilizer. Since 1970s,
fertilizer has heavily been subsidized, with the rate that has been high as 95 % . Between the
late 1980s and mid-1990s, domestic fertilizer production as a percentage of the total supply
varied from 46 to 60 percent. According to Nagy and Edun (2002); Fertilizer was subsidize at
the minimum rate of 65% to maximum rate of 87% between 1990 and 1996. In 1997-1998
and 2000, fertilizer was not subsidized at all. However, a federal subsidy was reintroduced in
1999 at a level of 25% and continues at this rate today.
The issue of fertilizer subsidy in Nigeria has long been in existent with many literates’ minds
investigating into its policy reform /challenges/shortfall and its prospect taken into
consideration some specific crops in an area, state or the country. But very few literate minds
investigate fertilizer effects generally on agricultural production. Hence, this study seeks to
add to the existing body of knowledge the effects of fertilizer subsidy on agricultural
production in Nigeria.
Okolo (2004) described the fertilizer supply in Nigeria as still inadequate. This accounts to
some extent for its low usage. One major impetus to fertilizer usage is an improvement of the
fertilizer market. Federal government of Nigeria implemented an annual program of
monopolized fertilizer procurement and distribution between 1977-1996 and it suffer
consequences of enormous wastage and diversions. Olufokunbi and Titilola (1993) said a
large percentage of demand for fertilizers has not at any time been met. Most of the actual
prices paid are as much as, or even higher than what the landed cost actually are. They further
agreed that unintended beneficiaries are the one that have been gaining from fertilizer
marketing arrangement.
Issues around fertilizer procurement, distribution and subsidy policies in Nigeria have
been discussed extensively by Nagy and Edun (2002), Ayinde et al (2009) and a host of
others. For instance, it was pointed out that, in 1997-1998 and 2000, fertilizer was not
subsidized at all and the business was turned to an unprepared private sector which was
initially or unwilling to respond adequately (Nagy and Edun 2002). Consequently, fertilizer
use fell from a peak of 1.2 million tons in 1992 to 56,708 tons in 1997. Even upon
reintroduction of fertilizer subsidy to Nigerians in 1999, there were still low consumption of
fertilizers as the purchase and distribution system is heavily politicized.
The subsidy policy was widely recognized as being associated with multiple problems,
including wide-scale corruption and inefficiencies. Over 776 billion naira ($4.8 billion) was
estimated to have been lost to corruption in total, averaging 26 billion naira ($162.5 million)
of losses annually (Adesina 2014).
Page 4
Journal of Economics and Sustainable Development www.iiste.org
ISSN 2222-1700 (Paper) ISSN 2222-2855 (Online)
Vol.7, No.11, 2016
140
The pertinent question bothering one’s mind as a Nigerian has always been, why has Nigeria
not yet been food secured amidst of inputs subsidies introduced and reintroduced over the
years? Amidst of huge money invested to subsidized fertilizer input to farmers in the country,
Can we then say as a nation that fertilizer subsidies over the years has any effects on our
production as a country? If so, which effects can we really say it has on our agricultural
production and to what extent can we predict the effects of fertilizer subsidy on our country
production or crop performance. Moreover, what are the likely short comings of the fertilizer
subsidy policy reform in the country? What are helpful recommended input subsidy policy
reforms that can make our nation great in its productions? Answer to most of these questions
which are needed urgently is what this study intends to look into.
2. 0 Methodology
2.1 Analytical technique
Error correction and co-integration model:
The study adopts the Johansen (1988) procedure in co-integration. The concept of co-
integration (Hendry, 1986), (Hall, 1986) and (Mills, 1990), creates the link between integrated
process and the concept of steady equilibrium. The first step in co-integration analysis is to
test the order integration of the variables. Following Ajetomobi et al (2007), a series is said to
be integrated if it accumulated some past effects, so that following any disturbance, the series
will rarely return to any particular mean value, hence is non-stationary. Non-stationary of time
series has always been regarded as a problem in econometric analysis. Philip (1986) shows
that, in general, the statistical properties of regression analysis using non-time series are
dubious notwithstanding promising diagnostic test statistics from such regression analysis.
The order of integration is given by the number of times a series needs to be differenced so as
to make it stationary. According to Charemza and Deadman (1992), a stochastic process is
said to be stationary if the joint and conditional probability distributions of the processes are
unchanged if displaced in time. If the series are co-integrated of the same order, a linear
relationship between these variables can be estimated and examining the order of this linear
relationship can test for co-integration. The grim fact is that economist look for the presence
of stationary co-integrated relationships since only theses can be used to describe long-run
stable equilibrium. The Granger representation theorem states that if set variables are co-
integrated (1,1); implying that the residual is co-integrated of 1(0), then there exists an Error
correction model describing the relationship.
Cointegration with Multiple Equations: The Johansen Approach
The Johansen’s Full Information Maximum Likelihood (FIML) approach (Johansen, 1988;
Johansen and Juselius, 1990) allows the estimation of all possible cointegrating relationships
and develops a set of statistical tests to test hypotheses about how many cointegrating vectors
is important as under-or over-estimation has potentially serious consequences for estimation
and inference. Under-estimation implies the omission of empirically relevant error-correction
terms and over-estimation implies that the distribution of statistics is non-standard.
The Johansen maximum likelihood approach for multivariate cointegration is based on the
following vector autoregressive (VAR) model:
Page 5
Journal of Economics and Sustainable Development www.iiste.org
ISSN 2222-1700 (Paper) ISSN 2222-2855 (Online)
Vol.7, No.11, 2016
141
)1(...1 tktkttt uZAZAZ
Where Zt is an (nx1) vector of I (I) variables (containing both endogenous and exogenous
variables), Ai is an (n x n) matrix of parameters, ut is (n x 1) vector of white noise errors.
Since Zt is assumed to be non-stationary, it is convenient to rewrite (7) in its first-difference
or error correction form (Cuthbertson et al., 1992) as:
....,,21,1....,,,...
)2(...
1211
1111
ki
tktktktt
AAAandkIiAAAI
whereuZZZZ
This specification provides information about the short-run and long-run adjustments to the
changes in Zt through the estimates of I and respectively. Equation (14) differs from the
standard first-differenced form of the VAR model only through the inclusion of term Zt-k.
This term provides information about the number of cointegrating relationship among the
variables in Zt is given by the rank of the matrix . If the rank of the matrix r, is 0 < r < n,
there are r linear combinations of the variables in Z1 that are stationary. In this case, the
matrix can be decomposed into two matrices and such that = ,, where is the error
correction term and measures the speed of adjustment in Zt and contains r distinct
cointegrating vectors i.e., the cointegrating relationships between the non-stationary variables.
Johansen (1988) used the reduced rank regression procedure to estimate the and matrices
and identified tests to test the number of distinct cointegrating vectors that exist, as well as to
test hypotheses about the matrices. He demonstrated that the maximum likelihood estimate of
can be estimated as the eigenvector and the related eigenvalues by solving the following
equation:
)3(01 ISSSSI okookokk
Where Soo is the residual matrix obtained by regressing Xt on its lagged differences, i.e.,
kkktt SXX ....,, 11 is the residual matrix obtained by regressing Xt-k on its lagged
differences, i.e., okkokt SandSX ,1 are the cross-products of residual matrixes Skk and Soo.
However if there are variables which are I (0) and are insignificant in the long-run
cointegrating space but affect the short-run model, (15) can be rewritten as:
)4(11 ttkttt uDZZZ
Where Dt represents the I (0) variables, which are often included to take account of short-run
shocks to the system such as policy interventions. These variables typically enter as dummy
variables.
Two likelihood ratio (LR) tests are conducted for detecting the presence of a single
cointegrating vector. The first test is the trace test statistic:
)5(121
i
r
p
itrace InInQ T
which tests the null hypothesis of at most r cointegrating vectors against the alternative that it
is greater than r. The second is the maximal-eigenvalue test:
Page 6
Journal of Economics and Sustainable Development www.iiste.org
ISSN 2222-1700 (Paper) ISSN 2222-2855 (Online)
Vol.7, No.11, 2016
142
)6(11:2, 1 rma InTrIrQInx
Which tests the null hypothesis of r cointegrating vectors against the alternative, that is ,r+1.
The critical values of these tests have been derived by Monte Carlo Simulations and tabulated
by Johansen (1988) and Osterwald- Lenum (1992). Harris (1995, p. 89) noted that
‘….between these two LR tests for contegration, the trace test shows more robustness to both
skewness and excess kurtosis in (the residuals) than the maximal eigenvalue test.
A characteristic feature of the error-correction formulation of (2) is that it includes both the
differences and the levels of the series in the same model; thus there is no loss of information
about the long-run equilibrium relationship between the variables. A number of issues need to
be addressed before using this methodology. First, the endogenous variables included in VAR
are all I (I). Second, the additional exogenous variables included in the VAR which explain
the short-run behavior need to be I (0). Third, the choice of lag length k (i.e. order) in the
vector autoregressive (VAR) is important and the Akaike Information Criterion (AIC) or
Schwarz Information Criterion (SBC) is often used. However, the information criteria may
not be adequate when errors contain moving average terms.
Hall (1991) argued that the Johansen maximum likelihood estimation procedure for
cointegrating vectors may be sensitive to the selection of the order of VAR. When the order of
VAR is too short, serial correlation among the residuals may result and test statistic becomes
unreliable. Conversely, if the order of VAR is too high, there is an upward bias in the test
statistics, again causing doubts on their reliability. Therefore, in the light of this sensitivity to
the VAR length, Hall suggested that when applying the Johansen procedure the effect of
varying the VAR specification should be examined. He suggested that in choosing k, one
should first select an arbitrary high order for the VAR and then work through the likelihood
ratio test statistics to determine the validity of restrictions imposed by successive reductions
in its value. The correction order of the VAR is where a restriction on the lag length is
rejected.
In this study we use the adjusted likelihood ratio (LR) statistics (Sims, 1980) to test the null
hypothesis that the order or the VAR is k against the alternative that it is k+1. We substantiate
this with the AIC and SBC criteria. The fourth issue in Johansen’s procedure in testing for
cointegration is the inclusion of deterministic components, i.e., constant and/or trend in the
long-run relationship arises. In general, the specification of the model depends upon the
characteristics of the data. We expand (6) to take into account the options needed for the
appropriate model to be used.
)7(21212111 tkttt utuZuZZ
Where tZZ ktkt ,1,1
, t is the time trend. We examine three models, labeled as Models 2-4
(Harris, 1995 p. 96):
Model 2: If the data exhibits no linear trends in its level form, then the constant is restricted to
the cointegrating space (i.e., long-run model), thus 0221 u . The critical values for
this model can be found in Table 1* in Osterwald-Lenum (1992).
Model 3: If the data shows linear trends in level form, then the constant is restricted in both
the cointegrating space and the short-run model (although the constant in the cointegrating
space is assumed to be cancelled by the constant in the short-run, leaving only a constant in
Page 7
Journal of Economics and Sustainable Development www.iiste.org
ISSN 2222-1700 (Paper) ISSN 2222-2855 (Online)
Vol.7, No.11, 2016
143
the short-run model). So, 021 . The critical values for this model can be found in
Table 1 in Osterwald-Lenum (1992).
Model 4: If the data indicate no quadratic trends in level form, the trend is not allowed in the
short-run model: but if there is some long-run linear growth in the data e.g., technological
progress), then the trend is restricted in the cointegrating space, so 02 . The critical values
for this model can be found in Table 2* in Osterwald-Lenum (1992). In practice, the structure
of the data provides little information as to which of these three models is appropriate.
Johansen (1992), based on the so called Pantula principle, suggested that the joint hypothesis
of both the rank order and the deterministic components (constant and/or trend) is tested in
determining the appropriate model. Thus, all three models are estimated and the results from
the most restrictive one (i.e., r = 1, Model 2) through to the least restrictive one (i.e., r = n – 1,
Model 4) are presented. The testing procedure is then to move through the most restrictive
model at each stage comparing the traceor max - test statistic to its critical value and only
stopping when the null hypothesis is accepted (Harris, 1995, p. 97).
The issue of the estimated coefficients being the long-run elasticities in the cointegrating
vector is not clear. This is true when there are only two variables in the cointegrating vector,
but when there are more than two variables, the dynamics of the VAR raise some doubts
about this interpretation (Lutkepohl, 1993, pp. 379-380). Nevertheless, some authors (for
example Hallam and Zanoli, 1993; Townsend and Thirtle, 1994) interpret the estimated
coefficients as the long-run elasticities. Since cointegration implies that a stationary long-run
relationship exists among the series in the cointegrated system and as these series are linked
by common stochastic trends, movements among the variables are not independent and there
are systematic co-movements among them. Moreover, any deviation from the long-run
equilibrium influences the time paths of the cointegrated series. Impulse response or
dynamitic multiplier analysis can be used to investigate these interrelationships among the
variables in dynamic models and to assess adjustments to long-run equilibrium.
Model Specification
We specified the hypothesized structural relationship for agricultural gross domestic product
which is will be specified as follows:
LAGDP = β1 + β2LER + β3LPco + β4LK + β5LLb + β6LLd + β7LF + T + µ
………. (8)
Where LAGDP is the agricultural gross domestic product; LEX is the exchange rate; LPo is the
price of crude oil; LK is the invested capital; LLb is the quantity of labour, LLd is the size of
agricultural land in hectares; LF is the amount invested on fertilizer subsidy. The estimated
linearized function of the above specification was found to give the lead equation, on which
the discussions were made.
Page 8
Journal of Economics and Sustainable Development www.iiste.org
ISSN 2222-1700 (Paper) ISSN 2222-2855 (Online)
Vol.7, No.11, 2016
144
The error correction model
First, the variables, in equation (1) were tested for unit root using the ADF technique while
Johansen (1988) reduced-rank test for co-integration was used to test for co-integrations
relationship between selected set of variables at crop level data. The error correction model
(ECMs) estimated are shown in (2) below. ECM in (2) represents the short run behaviour of
agricultural gross domestic product in (2) while equation (1) represents the long run static
equations. The parameter λ, which is negative, in general measures the speed of adjustment
towards the long run equilibrium relationship between the variables in (2). The optimum lag
lengths to be included in equations (2) were determined based on Akaike Information
Criterion (AIC).
Static long run model for agricultural gross domestic product
LAGDP = β1 + β2LEX + β3LPo + β4LK + β5LLb + β6LLd + β7LF + T + µ (8)
Error correction model (ECM) for the agricultural gross domestic product model is also given
as equation (2)
where ∆ represents first differencing, λ measures the extent of correction of errors by
adjusting in independent variable, β measures the long-run elasticities while γ measures the
short-run elasticities. General-to-specific modelling technique of Hendry and Erricson (1991)
is followed in selecting the preferred ECM. This procedure first estimate the ECM with
different lag lengths for the difference terms and, then, simplify the representation by
eliminating the lags with insignificant parameters.
Data and data source
The data for this study are time series data at macro level spanning from 1981 to 2012. All the
data were largely sourced from Food and Agricultural Organization (FAO) online Statistical
data base of the United Nations, Penn world data of the University of Pennsylvania and
Central Bank of Nigeria (CBN) statistical bulletin and the National Bureau of Statistics. Other
sources of data include the Ministry of Agriculture, Agricultural Development Projects
(ADPs), International Fertilizer Development Centre (IFDC), Federal Fertilizer Department
(FFD), Project Coordinating Unit (PCU) and Farm management survey and advisory services.
The data include agricultural gross domestic product, exchange rate, crude oil price, capital,
agricultural land, foreign direct investment into the agricultural sector and data on fertilizer
subsidy.
Page 9
Journal of Economics and Sustainable Development www.iiste.org
ISSN 2222-1700 (Paper) ISSN 2222-2855 (Online)
Vol.7, No.11, 2016
145
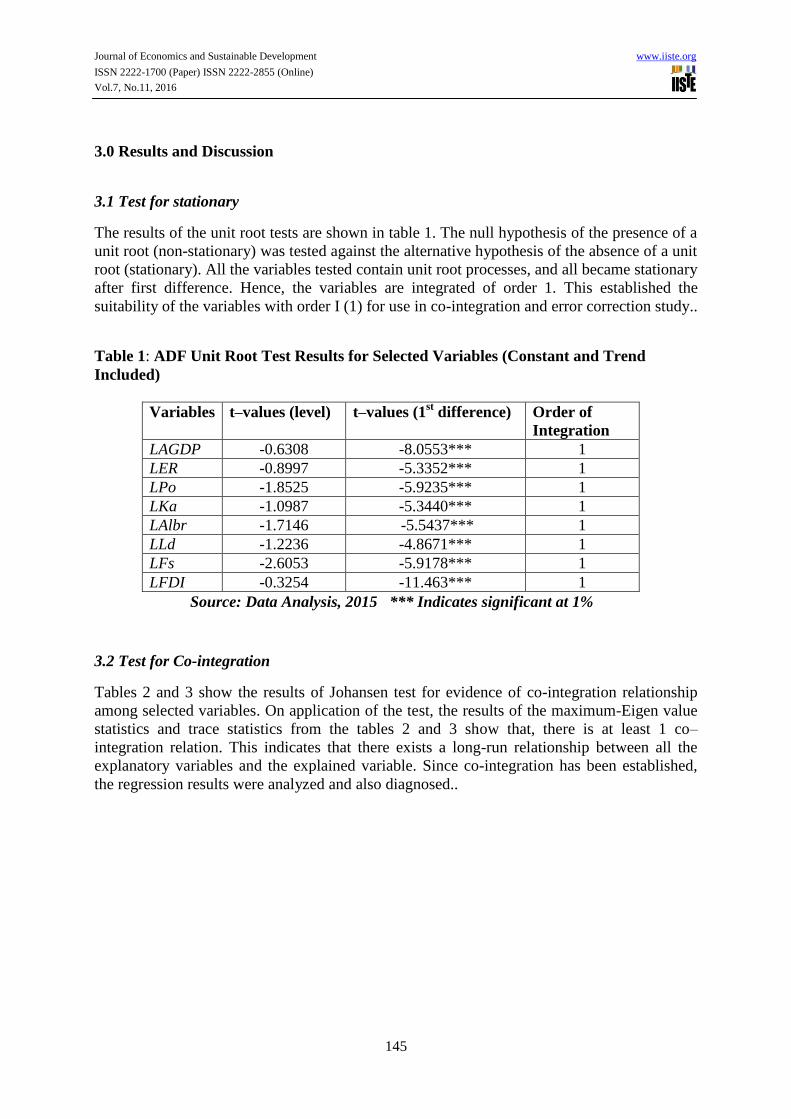
3.0 Results and Discussion
3.1 Test for stationary
The results of the unit root tests are shown in table 1. The null hypothesis of the presence of a
unit root (non-stationary) was tested against the alternative hypothesis of the absence of a unit
root (stationary). All the variables tested contain unit root processes, and all became stationary
after first difference. Hence, the variables are integrated of order 1. This established the
suitability of the variables with order I (1) for use in co-integration and error correction study..
Table 1: ADF Unit Root Test Results for Selected Variables (Constant and Trend
Included)
Variables t–values (level) t–values (1st difference) Order of
Integration
LAGDP -0.6308 -8.0553*** 1
LER -0.8997 -5.3352*** 1
LPo -1.8525 -5.9235*** 1
LKa -1.0987 -5.3440*** 1
LAlbr -1.7146 -5.5437*** 1
LLd -1.2236 -4.8671*** 1
LFs -2.6053 -5.9178*** 1
LFDI -0.3254 -11.463*** 1
Source: Data Analysis, 2015 *** Indicates significant at 1%
3.2 Test for Co-integration
Tables 2 and 3 show the results of Johansen test for evidence of co-integration relationship
among selected variables. On application of the test, the results of the maximum-Eigen value
statistics and trace statistics from the tables 2 and 3 show that, there is at least 1 co–
integration relation. This indicates that there exists a long-run relationship between all the
explanatory variables and the explained variable. Since co-integration has been established,
the regression results were analyzed and also diagnosed..
Page 10
Journal of Economics and Sustainable Development www.iiste.org
ISSN 2222-1700 (Paper) ISSN 2222-2855 (Online)
Vol.7, No.11, 2016
146
Table 2
Unrestricted Cointegration Rank Test (Trace)
Hypothesized Trace 0.05
No. of CE(s) Eigenvalue Statistic Critical Value Prob.**
None * 0.787235 135.0420 95.75366 0.0000
At most 1 * 0.728440 87.06745 69.81889 0.0012
At most 2 0.497670 46.65670 47.85613 0.0645
At most 3 0.363665 25.31328 29.79707 0.1505
At most 4 0.295452 11.30037 15.49471 0.1937
At most 5 0.014227 0.444206 3.841466 0.5051
Trace test indicates 2 cointegrating eqn(s) at the 0.05 level
* denotes rejection of the hypothesis at the 0.05 level
**MacKinnon-Haug-Michelis (1999) p-values
Source: Data analysis 2015
Table 3
Unrestricted Cointegration Rank Test (Maximum Eigenvalue) Hypothesized Max-Eigen 0.05
No. of CE(s) Eigenvalue Statistic Critical Value Prob.** None * 0.787235 47.97458 40.07757 0.0053
At most 1 * 0.728440 40.41075 33.87687 0.0072
At most 2 0.497670 21.34342 27.58434 0.2560
At most 3 0.363665 14.01291 21.13162 0.3640
At most 4 0.295452 10.85616 14.26460 0.1615
At most 5 0.014227 0.444206 3.841466 0.5051 Max-eigenvalue test indicates 2 cointegrating eqn(s) at the 0.05 level
* denotes rejection of the hypothesis at the 0.05 level
**MacKinnon-Haug-Michelis (1999) p-values
Source: Data analysis, 2015
3.3 Short-run error correction results and diagnostics
The solved static long- run equation for agricultural productivity in Nigeria as well as its short
– run equation is given in table 3 below. The R2 value of 0.726 for the ECM in table 4 shows
that the overall goodness of fit of the ECM is satisfactory. This means that only about 73% of
the variation in agricultural gross domestic product is explained by the explanatory variables,
the remaining 27% is inherent in error term or white noise. However, a number of other
diagnostic were also carried out in order to test the validity of the estimates and their
suitability for policy discussion. The Autoregressive Conditional Hetoroscedasticity (ARCH)
Page 11
Journal of Economics and Sustainable Development www.iiste.org
ISSN 2222-1700 (Paper) ISSN 2222-2855 (Online)
Vol.7, No.11, 2016
147
test for testing heteroscedasticity in the error process in the model has an F-statistic of 0.0249
which is statistically insignificant. This attests to the absence of heteroscedasticity in the
model. The Breusch – Godfrey Serial correlation Langrange Multiplier (LM) test for higher
order - serial correlation with an insignificant calculated F – statistic of 0.918 confirms the
absence of serial correlation in the residuals. The Jacque- Bera 2 - statistic of 2.28 for the
normality in the distribution in the error process shows that the error process is normally
distributed.
The estimated model passes a battery of diagnostic tests and the graphical evidence (CUSUM
and CUSUMQ graphs) indicate that the model is fairly stable during the sample period. The
analysis of the stability of the long-run coefficients together with the short-run dynamics, the
cumulative sum (CUSUM) and the cumulative sum of squares (CUSUM) point to the in-
samples stability of the model (see CUSUM and CUSUMQ in Figures 1 to 4).
From the battery of diagnostic tests presented and discussed above, this study concludes that
the model in this study was estimated well and that the observed data fits the model
specification adequately, thus the residuals in the results are expected to be distributed as
white noise and the coefficient valid for policy discussions.
It could be observed from the results in table 4 that the coefficient of error correction term
(ECM) carries the expected negative sign and it is significant at 1%. The significance of the
ECM supports co-integration and suggests the existence of long-run steady equilibrium
between agricultural gross domestic product in Nigeria and other determining factors in the
specified model. The coefficient of -1.234 indicates that the deviation of agricultural gross
domestic product (AGDP) from the long-run equilibrium level is corrected by about 123% in
the current period. This shows that the speed of adjustment of the Nigerian agricultural
production to the state of equilibrium is very high.
The exchange rate has a positive coefficient of 0.089 and 0.006 in the short and long-run
respectively. While the coefficient in the short-run is statistically significant at 1%, it is not
significant in the long-run. The elasticity values of exchange rate in both the short and long-
run suggests that devaluation has a great tendency to decrease import of agricultural material
if other components of exchange rate devaluation are well managed, thereby encouraging
local production which will subsequently increase agricultural productivity.
In the short-run, crude oil price has a negative and significant coefficient of -0.026. However,
in long-run, it has a negative but insignificant coefficient of -0.033. The elasticity value
obtained for crude oil price in the short-run is in line with theoretical expectation since we
expect that as the world price of crude oil increase, the focus on agricultural productivity will
further shift towards oil export as it has always been the case in Nigeria
The coefficient of capital is significant both in the long-run and the short-run. The coefficient
is 1.70 in the long-run with a significance level of 1% while the coefficient in the short-run is
1.598 and it is significant at 10%. These results suggest that a unit increase in agricultural
capital will drive agricultural productivity to increase by almost 2 units increase in the long
run and short-run.
In the long-run, agricultural land has a negative coefficient of -0.180 which is statistically
insignificant. In the short-run however, it has a negative significant coefficient of 1.210. This
result suggests that a unit increase in the hectarage of land employed in agricultural
production in Nigeria will result in a corresponding reduction of the nations agricultural GDP
Page 12
Journal of Economics and Sustainable Development www.iiste.org
ISSN 2222-1700 (Paper) ISSN 2222-2855 (Online)
Vol.7, No.11, 2016
148
by 1.210 units. Although this is contrary to theoretical expectation, it could be a result of
overuse of the same portions of land over the years. It will be of necessity for the farmers to
allow the land fallow and open new frontiers of agricultural lands for better production in the
country.
Foreign direct investment into the Nigerian agricultural sector has a coefficient of 0.051 in the
long-run and coefficient of 0.036 in the short run and both are significant 5% level. These
results suggest in the long- run, a unit increase in the LFDI inflow into the Nigerian
agricultural sector will significantly increases agricultural production by 0.051 unit while in
the short-run, a unit increase in LFDI inflow into the nation’s agricultural sector will increase
agricultural production by 0.035 unit. From these results, it is apparent that LFDI is playing a
positive and significant role in the agricultural sector of the Nigerian economy. It is therefore
important that the government of Nigeria encourages more foreign investment into the
Nigerian agricultural sector and also creates a conducive investment climate for the foreign
investors.
The coefficient for fertilizer subsidy in the long-run in Nigeria is 0.051 and it is significant at
5%. This result suggests that if government can effectively monitor the subsidy programme
and distribution of fertilizer in Nigeria, it will go a long in improving agricultural production
in Nigeria.
Table 4: Long-run result of Effect of Fertilizer
Subsidy on Agricultural Production in Nigeria
Included observations: 33 after adjustments
Dependent Variable: LAGDP
Variable
Coefficien
t Std. Error t-Statistic Prob.
C -13.86796 8.666452 -1.600189 0.1216
LEX 0.005999 0.014182 0.423001 0.6758
LPO -0.033695 0.027845 -1.210077 0.2371
LK 1.702578 0.146657 11.60925 0.0000
LLD -0.183668 0.390810 -0.469967 0.6423
LFDI 0.051500 0.020190 2.550814 0.0170
LFS 0.007642 0.002805 2.724115 0.0114
Source: Data Analysis 2015
Page 13
Journal of Economics and Sustainable Development www.iiste.org
ISSN 2222-1700 (Paper) ISSN 2222-2855 (Online)
Vol.7, No.11, 2016
149
Table 5: Parsimonious Short- run Error Modeling of
Effect of Fertilizer Subsidy on Agricultural
Production in Nigeria
Dependent Variable: D(LAGDP)
Included observations: 32 after adjustments
Variable
Coefficien
t Std. Error t-Statistic Prob.
C -0.009063 0.021910 -0.413644 0.6828
D(LEX) 0.089071 0.025650 3.472568 0.0020
D(LPO) -0.026933 0.014719 -1.829844 0.0797
D(LK) 1.593750 0.848183 1.879017 0.0724
D(LLD) -1.210196 0.489919 -2.470196 0.0210
D(LFDI) 0.035284 0.012658 2.787608 0.0102
D(LFS) -0.001811 0.002802 -0.646370 0.5242
ECM(-1) -1.234096 0.164127 -7.519170 0.0000
R-squared 0.788369 Mean dependent var 0.046594
Adjusted R-squared 0.726643 S.D. dependent var 0.068122
S.E. of regression 0.035617 Akaike info criterion -3.619686
Sum squared resid 0.030445 Schwarz criterion -3.253252
Log likelihood 65.91497 F-statistic 12.77211
Durbin-Watson stat 1.686368 Prob(F-statistic) 0.000001
Source: Data Analysis 2015
ARCH Test for Heteroscedasticity:
F-statistic 0.024961 Probability 0.875559
Obs*R-squared 0.026659 Probability 0.870300
Source: Data Analysis 2015
Breusch-Godfrey Serial Correlation LM Test:
F-statistic 0.917699 Probability 0.414193
Obs*R-squared 2.464097 Probability 0.291694
Source: Data Analysis 2015
Page 14
Journal of Economics and Sustainable Development www.iiste.org
ISSN 2222-1700 (Paper) ISSN 2222-2855 (Online)
Vol.7, No.11, 2016
150
0
2
4
6
8
10
12
14
-0.10 -0.05 -0.00 0.05
Series: Residuals
Sample 2 33
Observations 32
Mean 1.17e-18
Median -0.003337
Maximum 0.065766
Minimum -0.091634
Std. Dev. 0.031339
Skewness -0.390770
Kurtosis 4.049028
Jarque-Bera 2.281683
Probability 0.319550
Figure 3
-15
-10
-5
0
5
10
15
10 12 14 16 18 20 22 24 26 28 30 32
CUSUM 5% Significance
Page 15
Journal of Economics and Sustainable Development www.iiste.org
ISSN 2222-1700 (Paper) ISSN 2222-2855 (Online)
Vol.7, No.11, 2016
151
Figure 4
4.0 Conclusion and Policy Recommendations
It can be concluded that fertilizer subsidy which is one of the major policy thrust of the
government of Nigeria to improve agricultural production has the capacity to improve
agricultural productivity in Nigeria. However, the success of any fertilizer subsidy scheme in
Nigeria partly depends on an effective reduction of the crowding out effects of the subsidy on
the commercial fertilizer sector. This is possible only through both improved targeting of
beneficiaries and effectively complementary policies that raise the financial return to fertilizer
use among intended beneficiaries.
5. 0 References
Adesina, A. A. (2014) “Nigeria’s Agricultural Transformation”. Presentation at the Nigeria
Summit 2014 in Lagos, Nigeria.
Ajetomobi, J. O., Ayanwale, B. A. and S. O. Binuomote (2007) Economic effect of
Developments Aid in Nigeria: A Cointegration Analysis. Pakistan Journal of Social
Sciences 4(1) 1992- 1997.
Alimi, T, O.C. Ajewole, O.O. Awesola and E.O. Idowu (2006). Economic Rationale of
Commercial Organic Fertilizer Technology in Osun State of Nigeria. Retrieved on
26.12.2009 from www.horticulture.researchjournals.pdf.
-0.4
0.0
0.4
0.8
1.2
1.6
10 12 14 16 18 20 22 24 26 28 30 32
C U S U M o f S q u a r e s 5 % S i g n i f i c a n c e
Page 16
Journal of Economics and Sustainable Development www.iiste.org
ISSN 2222-1700 (Paper) ISSN 2222-2855 (Online)
Vol.7, No.11, 2016
152
Ayinde, O.E., M.O. Adewumi and F.I. Omotosho (2009). Effect of Fertilizer Policy on Crop
Production in Nigeria. The Social Sciences Vol.4(1): 53-58, 2009 ISSN:1818-5800.
Retrieved on 08.01.2010 from htt://www.medwellpublishing. com/journals.asp?
Dada, B.O. (2006). Keynote Address delivered at the National Stakeholders Workshop held in
Abuja, April 11-12th .
Idachaba, F.S. (2006). An Overview of Nigeria’s Fertilizer Sector. Paper presented at the
National Stakeholders’ Workshop held in Abuja, April 11-12th
.
implications. In Alternative pricing and distribution systems for fertilizers in Nigeria:
Nagy, J.G. and O. Edun (2002). Assessment of Nigerian Government Fertilizer Policy and
Suggested Alternative Market-Friendly Policies. Consultants to IFDC.
Nwagbo, E.C. (2005). Preliminary Assessment of the Fertilizer Voucher System. Report
prepared for the FAO/SPFS. Sept.
Omorogiuwa O., Zivkovic J., and Ademoh F.(2014). The role of agriculture in the economic
development of Nigeria European Scientific Journal, Vol.10, PP 134.
Hall, S. G. (1991). “Measuring structural change, using the kalman filter.” Economics of
Planning. 26:1- 13.
Hallam, D. and R. Zanoli (1993), ‘Error correction models and Agricultural Supply Response;
European Review of Agricultural Economics. 2 pp 111 – 120.
Harris, R. (1995) Using cointegration analysis in Econometric modeling. Prentice
Hall,Harvester Wheatsheaf
Hendry, D. F. and N. R. Ericsson (1991) Modeling the Demand for Narrow Money in the
United Kingdom and the United States. European Economic Review: 35(4) 833-886.
Johansen, S. (1988) Statistical Analysis of Co-integrating Vectors. Journal of Economic
Dynamics and Control 12:23-254.
Cuthbertson, K., Hall, S.G. and , M.P. Taylor. 1992. Applied econometric techniques. Ann
Arbor MI: University of Michigan Press.
Sims, C. A. [1980], “Macroeconomics and reality” Econometrica, vo 48, pp 1-48.
Osterwald-Lenum, Michael (1992). “A Note with Quantiles of the Asymptotic
Distribution of the Maximum Likelihood Cointegration Rank Test Statistics,”
Oxford Bulletin of Economics and Statistics, 54, 461–472.
Johansen, S., and K. Juselius (1992), "Testing Structural Hypotheses in a Multivariate
Cointegration Analysis of the PPP and UIP for UK," Journal of Econometrics, 53,
211-244.
Page 17
Journal of Economics and Sustainable Development www.iiste.org
ISSN 2222-1700 (Paper) ISSN 2222-2855 (Online)
Vol.7, No.11, 2016
153
Lutkepol, H. (1993). Introduction to Multiple Time Series Analysis. Berlin: Springer- verlag
Olufokunbi, B., and T. Titilola. 1993. Fertilizer pricing and subsidies in Nigeria: Issues and
implications. In Alternative pricing and distribution systems for fertilizers in
Nigeria: Proceedings of a symposium organized by the Federal Agricultural
Coordinating Unit, eds. N.B. Mijindadi, D.O.A Phillip, and P. Jayaraman. April 2
1993. Ibadan, Nigeria.
Charemza, W.W. And D.F. Deadman (1992), New Directions In Econometric Practice,
Edward Elgar, England
World Bank(2004). Retrieved from www.wb.org
Okolo, D.A. (2004). Regional Study on Agricultural Support, Nigeria’s Case. Report
Prepared for the FAO.
Stiglitz J. 1987. “Some theoretical aspects of agricultural policies.” The World Bank Research
Observers 2 (1), 43–60.