doi.org/10.26434/chemrxiv.8241887.v2 Investigating the Effect of Positional Isomerism on the Assembly of Zirconium Phosphonates Based on Tritopic Linkers Marco Taddei, Stephen J. I. Shearan, Anna Donnadio, Mario Casciola, Riccardo Vivani, Ferdinando Costantino Submitted date: 30/07/2019 • Posted date: 30/07/2019 Licence: CC BY-NC-ND 4.0 Citation information: Taddei, Marco; Shearan, Stephen J. I.; Donnadio, Anna; Casciola, Mario; Vivani, Riccardo; Costantino, Ferdinando (2019): Investigating the Effect of Positional Isomerism on the Assembly of Zirconium Phosphonates Based on Tritopic Linkers. ChemRxiv. Preprint. We report on the use of a novel tritopic phosphonic linker, 2,4,6-tris[3-(phosphonomethyl)phenyl]-1,3,5-triazine, for the synthesis of a layered zirconium phosphonate, named UPG-2. Comparison with the structure of the permanently porous UPG-1, based on the related linker 2,4,6-tris[4-(phosphonomethyl)phenyl]-1,3,5-triazine, reveals that positional isomerism disrupts the porous architecture in UPG-2 by preventing the formation of infinitely extended chains connected through Zr-O-P-O-Zr bonds. The presence of free, acidic P-OH groups and an extended network of hydrogen bonds makes UPG-2 a good proton conductor, reaching values as high as 5.7x10 -4 S cm -1 . File list (3) download file view on ChemRxiv Taddei_Manuscript_ChemRxiv_v2.pdf (542.03 KiB) download file view on ChemRxiv Taddei_ESI_ChemRxiv_v2.pdf (2.09 MiB) download file view on ChemRxiv UPG-2.cif (16.03 KiB)
Transcript
doi.org/10.26434/chemrxiv.8241887.v2
Investigating the Effect of Positional Isomerism on the Assembly ofZirconium Phosphonates Based on Tritopic LinkersMarco Taddei, Stephen J. I. Shearan, Anna Donnadio, Mario Casciola, Riccardo Vivani, FerdinandoCostantino
Submitted date: 30/07/2019 • Posted date: 30/07/2019Licence: CC BY-NC-ND 4.0Citation information: Taddei, Marco; Shearan, Stephen J. I.; Donnadio, Anna; Casciola, Mario; Vivani,Riccardo; Costantino, Ferdinando (2019): Investigating the Effect of Positional Isomerism on the Assembly ofZirconium Phosphonates Based on Tritopic Linkers. ChemRxiv. Preprint.
We report on the use of a novel tritopic phosphonic linker,2,4,6-tris[3-(phosphonomethyl)phenyl]-1,3,5-triazine, for the synthesis of a layered zirconium phosphonate,named UPG-2. Comparison with the structure of the permanently porous UPG-1, based on the related linker2,4,6-tris[4-(phosphonomethyl)phenyl]-1,3,5-triazine, reveals that positional isomerism disrupts the porousarchitecture in UPG-2 by preventing the formation of infinitely extended chains connected throughZr-O-P-O-Zr bonds. The presence of free, acidic P-OH groups and an extended network of hydrogen bondsmakes UPG-2 a good proton conductor, reaching values as high as 5.7x10⁻⁴ S cm-1.
File list (3)
download fileview on ChemRxivTaddei_Manuscript_ChemRxiv_v2.pdf (542.03 KiB)
download fileview on ChemRxivTaddei_ESI_ChemRxiv_v2.pdf (2.09 MiB)
download fileview on ChemRxivUPG-2.cif (16.03 KiB)
unit consists of one Zr atom sitting on an inversion centre
(special position with multiplicity = 1), one H4mttbmp2-
fragment and two water molecules (each with occupancy of
0.75). The Zr atom is octahedrally coordinated by six oxygen
atoms belonging to six different phosphonate groups (three of
which are crystallographically independent and three
generated by symmetry). Each H4mttbmp2- molecule is
coordinated to three different Zr atoms through monodentate
phosphonate groups. The resolution of PXRD data is not
sufficient to locate hydrogen atoms, but, based on
electroneutrality requirements, we can deduce that four of six
P-O groups coordinated to Zr are negatively charged P-O-,
whereas two of them are neutral P=O. The presence of purely
monodentate phosphonate groups is, to the best of our
knowledge, observed here for the first time in any known
zirconium phosphonate. This feature leads to lack of connection
among ZrO6 octahedra, which remain isolated from each other
(the shortest Zr-Zr distance is 8.82 Å). The connection of
isolated ZrO6 octahedra and H4mttbmp2- units gives rise to a
layered structure, with layers about 9 Å thick lying in the bc
plane. Each layer is connected to adjacent ones through a
network of hydrogen bonds extending along the b axis that
involves free P-O groups and two water molecules sitting in the
interlayer space (Figure S17). Detailed views of the network of
hydrogen bonds involving each phosphonate group and each
water molecule are provided in Figures S18-22. In addition, a
system of π-π stacking interactions extending along the a axis
exists among the aromatic rings of H4mttbmp2-, further
contributing to efficient stacking of layers (Figure S23).
Given the similar linkers used for the synthesis of UPG-1 and
UPG-2, detailed analysis and comparison of their structural
features is in order. The two compounds were prepared in very
similar reaction conditions: same temperature (80 °C), same
Zr/linker/HF ratio (1:1:50), same concentration of metal and
linker (0.018 M). Therefore, the differences in the resulting
crystal structures can purely be attributed to the influence of
the geometrical arrangement of the linkers. UPG-1 and UPG-2
display identical chemical composition (if extraframework
water molecules are not considered), with the same Zr/linker
ratio (1:2) and the linkers in the same protonation state (four
protons of the original six are retained after reaction with the
metal). Both linkers display a cis-trans-trans configuration of the
phosphonate groups, with respect to the aromatic backbone,
however the intramolecular P-P distances are significantly
different: 13.0, 14.7 and 14.9 Å in UPG-1; 6.8, 12.4 and 13.8 Å in
UPG-2 (Figure 2). This suggests that H4mttbmp2- can adopt a
more “compact” conformation than H4pttbmp2-. A simple
optimisation of the molecular structure of the linker H6mttbmp
using the Merck molecular force field 94 (MMFF94),33 as
implemented in the software Avogadro,34 reveals that the
lowest energy configuration achievable displays two
intramolecular hydrogen bonds between two phosphonic
groups (Figure S24). The possible presence of these non-
covalent interactions also in reaction conditions could explain
why the linker H6mttbmp prefers the more compact
conformation. As a result, the connectivity between the organic
linkers and the metal atoms in UPG-1 and UPG-2 is remarkably
different: both H4pttbmp2- and H4mttbmp2- are coordinated to
3
Please do not adjust margins
Please do not adjust margins
three Zr atoms, but the former linker displays one bidentate,
one monodentate and one non-coordinated phosphonate
group (Figure 2a), whereas the latter linker displays three
monodentate phosphonate groups (Figure 2b). The presence of
bidentate phosphonate groups in UPG-1 is ultimately crucial to
afford connection of adjacent Zr atoms along the c axis direction
and formation of infinite inorganic building units (IBUs) (Figure
S25). These 1D IBUs are connected in the remaining two
dimensions by the organic linkers, resulting in the formation of
a 3D framework (Figure S1). As previously discussed, the lack of
polydentate phosphonate groups prevents formation of
extended IBUs in UPG-2 and, as a consequence, the structure
cannot extend in the third dimension, giving rise to a 2D layered
motif.
Figure 2. Linker conformation and connectivity in UPG-1 (a) and UPG-2 (b). Color code:
Zr, pink; P, green; N, blue; O, red; C, gray.
The thermogravimetric curve of UPG-2, measured under air, is
shown in Figure 3. The first weight loss, occurring at
temperature lower than 130 °C, is attributed to the desorption
of three water molecules per formula unit (calculated: 4.0%;
observed: 4.0%). The compound is then stable until about 280
°C, when another 5.0% weight loss is observed. This loss could
be due to some degree of condensation of the many free P-O
groups present in the structure. Similar behaviour was observed
for UPG-1.19 Decomposition of the organic part of the structure
takes place above 480 °C. The total weight loss at 1200 °C is
73.4%. Zirconium phosphonates with P/Zr ratio ≥ 2 usually
thermally decompose to ZrP2O7.35, 36 This product is also the
only crystalline phase observed in the PXRD pattern of the
decomposition residue of UPG-2 after TGA (Figure S26),
allowing to calculate a weight loss of 80.0%, larger than the
observed one. Since UPG-2 features an unusually high P/Zr ratio
of 6, it is possible that part of the phosphonate groups is not
completely decomposed at 1200 °C and a mixture of ZrP2O7 and
other, amorphous phosphorus containing residues is formed.
Figure 3.Thermogravimetric curve of UPG-2.
The proton conductivity of pellets of UPG-2 was measured at
100 °C, under controlled relative humidity (RH). Figure 4 shows
that the conductivity increases by a factor of ca. 7, from 8.5x10-
5 to 5.7x10⁻⁴ S cm-1, with increasing RH from 40 to 95%. The
value at 95% RH is in line with those previously observed for
other Zr phosphonates.37 To get insight into the physical origin
of the proton transport, the hydration of UPG-2 was
determined under the same conditions used to measure the
conductivity. At 100 °C and 95% RH, UPG-2 takes up 6.2 water
molecules per unit formula (about one water molecule per –PO3
group), while 0.8 water molecules are lost after lowering RH to
40%. This loss appears to be too small to account for the large
conductivity changes observed in this RH range. Therefore, it
may be inferred that the pellet conductivity originates mainly
from surface/intergrain proton transport and is affected by the
hydration of the microcrystal surface, which is expected to be
more susceptible than bulk hydration to RH changes. The
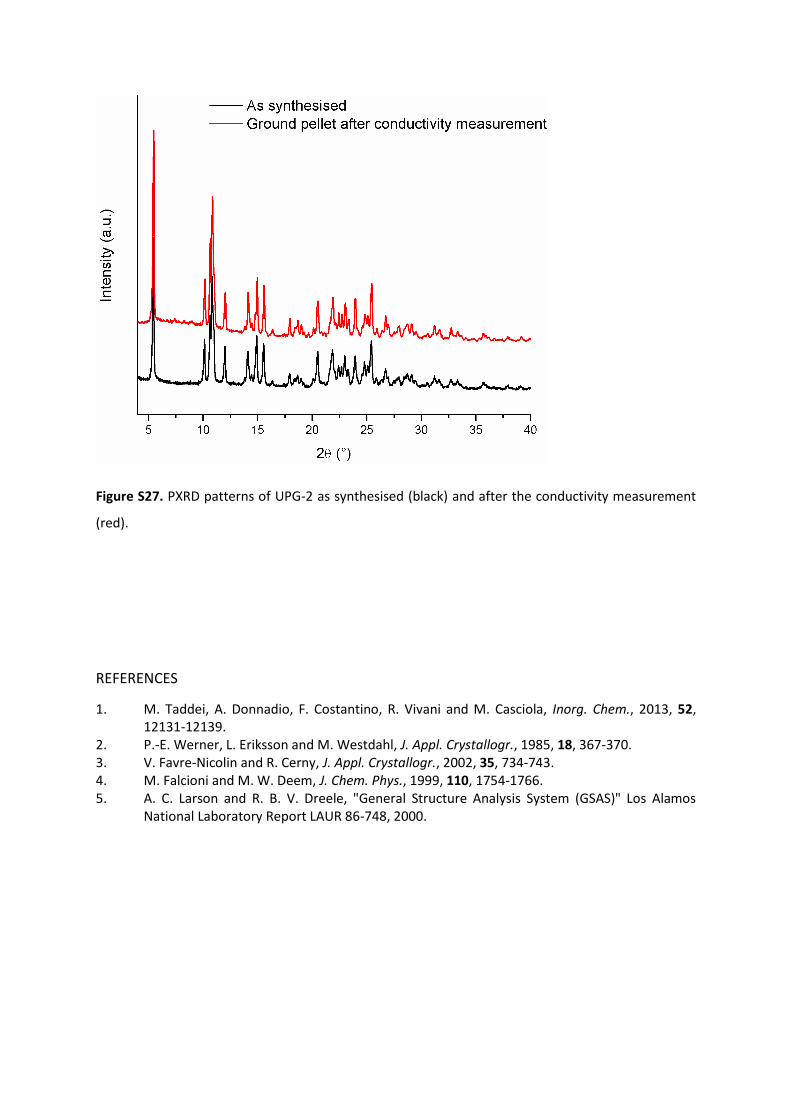
excellent stability of UPG-2 in measurement conditions is
proved by the PXRD pattern of the ground pellet, which is
practically identical to that of the as synthesized material
(Figure S27).
Figure 4. Proton conductivity of UPG-2 at 100 °C as a function of relative humidity.
Conclusions
In this work, we have investigated the effect of positional
isomerism in tritopic phosphonic linkers on the assembly of the
crystal structure of the relative Zr4+ derivatives. We found that
4
Please do not adjust margins
Please do not adjust margins
combination of Zr4+ and H6mttbmp, having -CH2-PO3H2 groups
in meta position with respect to the central triazine core,
affords a compound with unprecedented 2D layered structure
featuring isolated Zr octahedra (UPG-2), as opposed to the 3D
open framework obtained when H6pttbmp, having -CH2-PO3H2
groups in para position with respect to the central triazine core
(UPG-1). The main structure-driving factor seems to be the
ability of H6mttbmp to adopt a conformation where the
intramolecular P-P distances are significantly shorter than in
H6pttbmp, thus preventing formation of extended inorganic
building units and development of the crystal structure in the
third dimension. This is attributed to the presence of
intramolecular hydrogen bonding interactions between
phosphonic groups in the free linker. Thanks to the large
number of hydrogen bonds involving phosphonic groups and
water molecules, UPG-2 is a good proton conductor, reaching
conductivity as high as 5.7x10⁻⁴ S cm-1 at 100 °C and 95% relative
humidity. These results add to the existing body of knowledge
concerning the crystal engineering of Zr phosphonates and can
help in designing new phosphonic linkers with specific
geometrical features to induce formation of structural
arrangements with the desired dimensionality.
Conflicts of interest
There are no conflicts to declare.
Acknowledgement
The authors acknowledge the European Union’s Horizon 2020
research and innovation programme under the Marie
Skłodowska-Curie grant agreement No 663830 (M.T.) and the
National Mass Spectrometry Facility (NMSF) at Swansea
University.
Notes and references
1. K. Maeda, Microporous Mesoporous Mater., 2004, 73, 47-55.
2. S. J. I. Shearan, N. Stock, F. Emmerling, J. Demel, P. A. Wright, K. D. Demadis, M. Vassaki, F. Costantino, R. Vivani, S. Sallard, I. Ruiz Salcedo, A. Cabeza and M. Taddei, Crystals, 2019, 9, 270.
3. J. M. Taylor, R. Vaidhyanathan, S. S. Iremonger and G. K. Shimizu, J. Am. Chem. Soc., 2012, 134, 14338-14340.
4. S. S. Iremonger, J. Liang, R. Vaidhyanathan and G. K. Shimizu, Chem. Commun., 2011, 47, 4430-4432.
5. S. S. Iremonger, J. Liang, R. Vaidhyanathan, I. Martens, G. K. Shimizu, T. D. Daff, M. Z. Aghaji, S. Yeganegi and T. K. Woo, J. Am. Chem. Soc., 2011, 133, 20048-20051.
6. B. S. Gelfand, J. B. Lin and G. K. Shimizu, Inorg. Chem., 2015, 54, 1185-1187.
7. B. S. Gelfand, R. P. S. Huynh, S. P. Collins, T. K. Woo and G. K. H. Shimizu, Chem. Mater., 2017, 29, 10469-10477.
8. B. S. Gelfand, R. P. Huynh, R. K. Mah and G. K. Shimizu, Angew. Chem. Int. Ed., 2016, 55, 14614-14617.
9. J. Hynek, P. Brazda, J. Rohlicek, M. G. S. Londesborough and J. Demel, Angew. Chem. Int. Ed., 2018, 57, 5016-5019.
10. M. Taddei, F. Costantino, A. Ienco, A. Comotti, P. V. Dau and S. M. Cohen, Chem. Commun., 2013, 49, 1315-1317.
11. M. Taddei, A. Ienco, F. Costantino and A. Guerri, RSC Adv., 2013, 3, 26177.
12. X. Zhao, J. G. Bell, S.-F. Tang, L. Li and K. M. Thomas, J. Mater. Chem. A, 2016, 4, 1353-1365.
13. S.-F. Tang, X.-B. Pan, X.-X. Lv, S.-H. Yan, X.-R. Xu, L.-J. Li and X.-B. Zhao, CrystEngComm, 2013, 15, 1860.
14. T. Zheng, Z. Yang, D. Gui, Z. Liu, X. Wang, X. Dai, S. Liu, L. Zhang, Y. Gao, L. Chen, D. Sheng, Y. Wang, J. Diwu, J. Wang, R. Zhou, Z. Chai, T. E. Albrecht-Schmitt and S. Wang, Nat. Comm., 2017, 8, 15369.
15. M. Taddei, F. Costantino and R. Vivani, Eur. J. Inorg. Chem., 2016, 2016, 4300-4309.
16. G. Yücesan, Y. Zorlu, M. Stricker and J. Beckmann, Coord. Chem. Rev., 2018, 369, 105-122.
17. A. D. G. Firmino, F. Figueira, J. P. C. Tomé, F. A. A. Paz and J. Rocha, Coord. Chem. Rev., 2018, 355, 133-149.
18. M. Taddei, F. Costantino, R. Vivani, S. Sabatini, S. H. Lim and S. M. Cohen, Chem. Commun., 2014, 50, 5737-5740.
19. M. Taddei, F. Costantino, F. Marmottini, A. Comotti, P. Sozzani and R. Vivani, Chem. Commun., 2014, 50, 14831-14834.
20. N. Hermer, H. Reinsch, P. Mayer and N. Stock, CrystEngComm, 2016, 18, 8147-8150.
21. N. Hermer and N. Stock, Dalton Trans., 2015, 44, 3720-3723.
22. S. F. Tang, J. J. Cai, L. J. Li, X. X. Lv, C. Wang and X. B. Zhao, Dalton Trans., 2014, 43, 5970-5973.
23. A. Schütrumpf, A. Bulut, N. Hermer, Y. Zorlu, E. Kirpi, N. Stock, A. Ö. Yazaydın, G. Yücesan and J. Beckmann, ChemistrySelect, 2017, 2, 3035-3038.
24. J. K. Zaręba, Inorg. Chem. Commun., 2017, 86, 172-186. 25. Y. Zorlu, D. Erbahar, A. Çetinkaya, A. Bulut, T. S. Erkal, O.
Yazaydin, J. Beckmann and G. Yücesan, Chem. Commun., 2019, 55, 3053-3056.
26. T. Rhauderwiek, K. Wolkersdörfer, S. Øien-Ødegaard, K.-P. Lillerud, M. Wark and N. Stock, Chem. Commun., 2018, 54, 389-392.
27. T. Rhauderwiek, H. Zhao, P. Hirschle, M. Döblinger, B. Bueken, H. Reinsch, D. De Vos, S. Wuttke, U. Kolb and N. Stock, Chem. Sci., 2018, 9, 5467-5478.
28. B. Wang, T. Rhauderwiek, A. K. Inge, H. Xu, T. Yang, Z. Huang, N. Stock and X. Zou, Chem. Eur. J., 2018, 24, 17429-17433.
29. G. K. Shimizu, R. Vaidhyanathan and J. M. Taylor, Chem. Soc. Rev., 2009, 38, 1430-1449.
30. K. J. Gagnon, H. P. Perry and A. Clearfield, Chem. Rev., 2012, 112, 1034-1054.
31. R. G. Pearson, J. Am. Chem. Soc., 1963, 85, 3533-3539. 32. T. Devic and C. Serre, Chem. Soc. Rev., 2014, 43, 6097-
6115. 33. T. A. Halgren, J. Comp Chem., 1996, 17, 490-519. 34. M. D. Hanwell, D. E. Curtis, D. C. Lonie, T. Vandermeersch,
E. Zurek and G. R. Hutchison, J. Cheminformatics, 2012, 4, 17.
35. M. Taddei, F. Costantino and R. Vivani, Inorg. Chem., 2010, 49, 9664-9670.
36. R. Vivani, F. Costantino, U. Costantino and M. Nocchetti, Inorg. Chem., 2006, 45, 2388-2390.
37. M. Taddei, A. Donnadio, F. Costantino, R. Vivani and M. Casciola, Inorg. Chem., 2013, 52, 12131-12139.
5
Please do not adjust margins
Please do not adjust margins
TABLE OF CONTENTS
Combination of the novel linker 2,4,6-tris[3-
(phosphonomethyl)phenyl]-1,3,5-triazine and Zr(IV)
afforded a layered compound that lacks extended
inorganic connectivity and displays good proton
conductivity.
download fileview on ChemRxivTaddei_Manuscript_ChemRxiv_v2.pdf (542.03 KiB)
Investigating the effect of positional isomerism on the
assembly of zirconium phosphonates based on tritopic
linkers
Marco Taddei,1,* Stephen J. I. Shearan,1 Anna Donnadio,2 Mario Casciola,3 Riccardo Vivani,2 Ferdinando
Costantino3
1Energy Safety Research Institute, Swansea University, Fabian Way, Swansea, SA1 8EN, United
Kingdom 2Dipartimento di Scienze Farmaceutiche, University of Perugia, Via del Liceo 1, 06123 Perugia, Italy 3 Dipartimento di Chimica Biologia e Biotecnologia, University of Perugia, Via Elce di Sotto 8, 06123
Å. The statistical weight of these restraints was decreased as the refinement proceeded. The position
of water molecules was determined using difference Fourier maps, which showed two peaks of
residual electron density in the interlayer space. The occupancy of these water molecules was
arbitrarily set to 0.75, in agreement with the observed weight loss from TGA, discussed herein. Finally,
atomic displacement parameters were refined by constraining them to have the same value. At the
end of the refinement, the shifts in all parameters were less than their standard deviations.
Table S1 lists the crystal data and refinement details. Figure S16 shows the final Rietveld and difference
plots.
Table S1. Structural data and refinement details for UPG-2.
empirical formula C48H50N6O21P6Zr
formula weight 1323
crystal system triclinic
space group P-1
a/Å 8.8147(4)
b/Å 9.6066(5)
c/Å 16.338(1)
α/° 88.426(4)
β/° 83.914(4)
γ/° 85.607(4)
volume/Å3 1371.4(2)
Z 1
calculated density/g cm-3 1.59
data range/°2θ 4-80
wavelength/Å 1.54056
n. of data points 4470
n. of reflections 1626
n. of parameters 151
n. of restraints 136
Rpa 0.0395
Rwpb 0.0511
RF2c 0.05960
GOFd 2.91
a Rp = |Io-Ic | / Io; bRwp = [ w(Io-Ic) 2 / wIo2 ]1/2; cRF2 = |Fo
2 - Fc2 | / |Fo
2 |; d GOF = [ w(Io-Ic)2 /
(No - Nvar)]1/2
Figure S16. Final Rietveld plot for UPG-2, reporting the observed pattern (red symbols), the calculated
pattern (green line), and their difference (pink line). Black markers at the bottom indicate the
calculated positions of peaks.
Figure S17. View of the hydrogen bonding network existing between the layers of UPG-2. Zr octahedra
belonging to adjacent layers are coloured different for the sake of clarity. Colour code: Zr, pink/light
blue; P, green; O, red; C, grey. Hydrogen bonds are represented as red dashed lines.
Figure S18. View of the hydrogen bonding interactions involving the phosphonate group centred
around P26. Colour code: Zr, pink; P, green; O, red; C, grey. Hydrogen bonds are represented as red
dashed lines.
Figure S19. View of the hydrogen bonding interactions involving the phosphonate group centred
around P31. Colour code: Zr, pink; P, green; O, red; C, grey. Hydrogen bonds are represented as red
dashed lines.
Figure S20. View of the hydrogen bonding interactions involving the phosphonate group centred
around P36. Colour code: Zr, pink; P, green; O, red; C, grey. Hydrogen bonds are represented as red
dashed lines.
Figure S21. View of the hydrogen bonding interactions involving Ow1. Colour code: P, green; O, red.
Hydrogen bonds are represented as red dashed lines.
Figure S22. View of the hydrogen bonding interactions involving Ow2. Colour code: P, green; O, red.
Hydrogen bonds are represented as red dashed lines.
Figure S23. Space filling model view of the system of π-π stacking interactions extending along the a
axis. Colour code: N, blue; C, grey.
Figure S24. Optimised conformations of the H6mttbmp linker and their relative energy, normalised to
the energy of the least stable conformer (a). Colour code: P, yellow; O, red; N, blue; C, grey; H, white.
Hydrogen bonds are represented as red dashed lines.
Figure S25. Comparison of the 1D IBU found in UPG-1 (left) and the 0D IBU in UPG-2 (right). Colour
code: Zr, pink; P, green; O, red; C, grey.
Figure S26. Calculated PXRD pattern for ZrP2O7 (COD 1010464) (black) and PXRD pattern of the TGA
residue for UPG-2 (red).
Figure S27. PXRD patterns of UPG-2 as synthesised (black) and after the conductivity measurement
(red).
REFERENCES
1. M. Taddei, A. Donnadio, F. Costantino, R. Vivani and M. Casciola, Inorg. Chem., 2013, 52, 12131-12139.
2. P.-E. Werner, L. Eriksson and M. Westdahl, J. Appl. Crystallogr., 1985, 18, 367-370. 3. V. Favre-Nicolin and R. Cerny, J. Appl. Crystallogr., 2002, 35, 734-743. 4. M. Falcioni and M. W. Deem, J. Chem. Phys., 1999, 110, 1754-1766. 5. A. C. Larson and R. B. V. Dreele, "General Structure Analysis System (GSAS)" Los Alamos
National Laboratory Report LAUR 86-748, 2000.
download fileview on ChemRxivTaddei_ESI_ChemRxiv_v2.pdf (2.09 MiB)