i INVESTIGATING THE EFFECTIVENESS OF PROBLEM-BASED LEARNING IN THE FURTHER MATHEMATICS CLASSROOMS by ALFRED OLUFEMI FATADE Submitted in accordance with the requirements for the degree of DOCTOR OF PHILOSOPHY IN MATHEMATICS, SCIENCE AND TECHNOLOGY EDUCATION - WITH SPECIALISATION IN MATHEMATICS EDUCATION at the UNIVERSITY OF SOUTH AFRICA PROMOTER: PROF. L. D. MOGARI JOINT PROMOTER: PROF. A. A. ARIGBABU NOVEMBER 2012
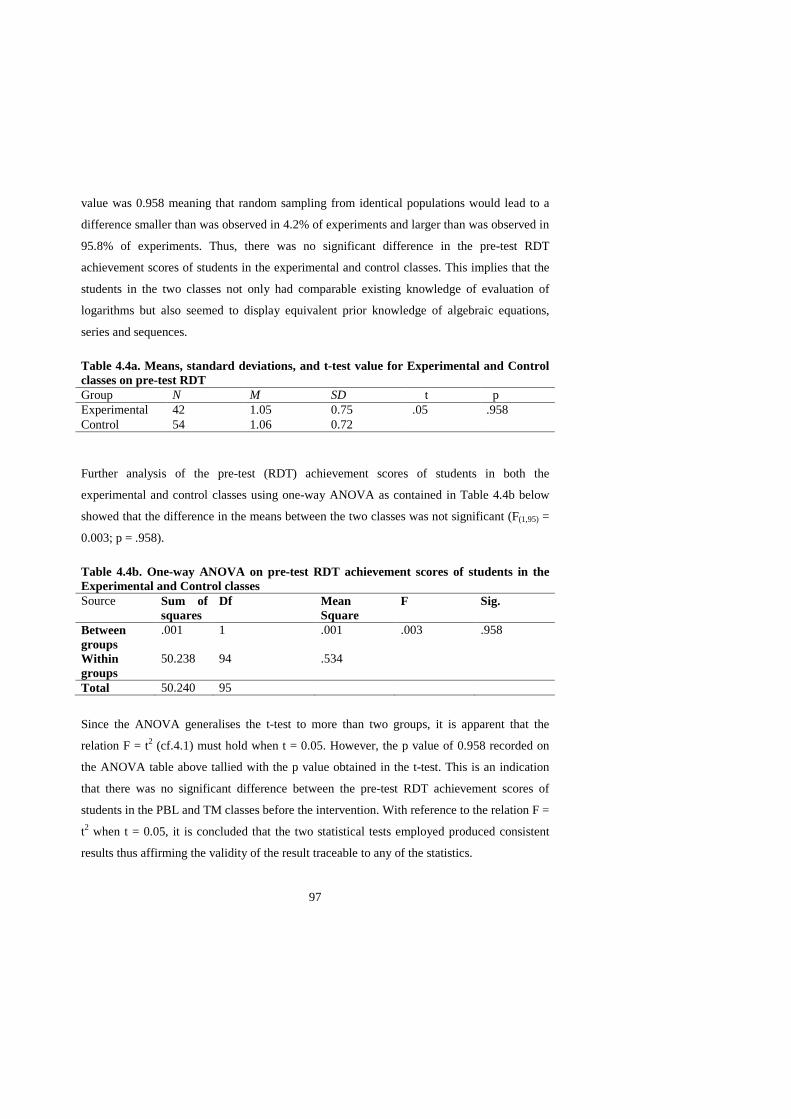
Transcript
i
INVESTIGATING THE EFFECTIVENESS OF PROBLEM-BASED LEARNING IN
THE FURTHER MATHEMATICS CLASSROOMS
by
ALFRED OLUFEMI FATADE
Submitted in accordance with the requirements
for the degree of
DOCTOR OF PHILOSOPHY
IN MATHEMATICS, SCIENCE AND TECHNOLOGY EDUCATION
- WITH SPECIALISATION IN MATHEMATICS EDUCATION
at the
UNIVERSITY OF SOUTH AFRICA
PROMOTER: PROF. L. D. MOGARI
JOINT PROMOTER: PROF. A. A. ARIGBABU
NOVEMBER 2012
ii
ABSTRACT The study investigated the effectiveness of Problem-based learning (PBL) in the Further
Mathematics classrooms in Nigeria within the blueprint of pre-test-post-test non-equivalent
control group quasi-experimental design. The target population consisted of all Further
Mathematics students in the Senior Secondary School year one in Ijebu division of Ogun
State, Nigeria. Using purposive and simple random sampling techniques, two schools were
selected from eight schools that were taking Further Mathematics. One school was randomly
assigned as the experimental while the other as the control school. Intact classes were used
and in all, 96 students participated in the study (42 in the experimental group taught by the
researcher with the PBL and 54 in the control group taught by the regular Further
Mathematics teacher using the Traditional Method (TM)).
Four research questions and four research hypotheses were raised, answered, and tested in the
study. Four research instruments namely pre-test manipulated at two levels: Researcher-
Designed Test (RDT) (r = 0.87) and Teacher- Made Test (TMT) (r = 0.88); post-test
manipulated at two levels: RDT and TMT; pre-treatment survey of Students Beliefs about
Further Mathematics Questionnaire (SBFMQ) (r = 0.86); and post-treatment survey of
SBFMQ were developed for the study. The study lasted thirteen weeks (three weeks for pilot
study and ten weeks for main study) and data collected were analysed using Mean, Standard
deviation, Independent Samples t-test statistic, and Analysis of Variance.
Results showed that there were statistically significant differences in the mean post-test
achievement scores on TMT (t=-3.58, p<0.05), mean post-test achievement scores on RDT
(t=-5.92, p<0.05) and mean post-treatment scores on SBFMQ (t=-6.22, p<0.05) between
students exposed to the PBL and those exposed to the TM, all in favour of the PBL group.
Results also revealed that there was statistically significant difference in the post-test
achievement scores on TMT at knowledge (t= -23.97, p<0.05) and application (t= -11.41,
p<0.05) but not at comprehension (t= -0.50, p>0.05, ns) levels of cognition between students
exposed to the PBL and the TM.
Based on the results, the study recommended that the PBL should be adopted as alternative
instructional strategy to the TM in enhancing meaningful learning in Further Mathematics
iii
classrooms and efforts should be made to integrate the philosophy of PBL into the pre-service
teachers’ curriculum at the teacher-preparation institutions in Nigeria.
iv
DECLARATION
I declare that ‘Investigating the effectiveness of problem-based learning in Further
Mathematics classrooms’ is my own work and that all the sources that I have used or
quoted have been acknowledged by means of complete references
SIGNATURE DATE
Revd A. O. Fatade
30th November, 2012
v
ACKNOWLEDGEMENTS
I sincerely give all honour and praises to the eternal God, rock of ages, immortal,
invisible and the only wise God for strengthening and sustaining me to complete this
programme successfully.
I express my appreciation to my dear late Promoter, Prof. Lovemore J. Nyaumwe who
passed on to glory in June 2012. His sense of duty and devotion, thoroughness in
painstakingly going through the thesis word-by-word, page by page and chapter by
chapter is highly commendable. May the Lord in His infinite mercy comfort, soothing,
provide and support the wife and children he left behind and may his soul find peace in
the bossom of the Lord Almighty.
I acknowledge the timely intervention of Prof. David Mogari who stood in the gap
created by the demise of Prof. Nyaumwe and despite his tight schedule found it
worthwhile to help me out of the lock-jam. May the God of Heaven and Earth reward
him abundantly, Amen.
I also appreciate the efforts and sacrifice of my Joint Promoter, Prof. Abayomi A.
Arigbabu, Dean College of Science and Information Technology (TASUED) who is
resident here in Nigeria. His unflinching support cognitively and encouragement saw this
research work to a logical end. I cannot forget the positive role played by, Prof. Harrison
Atagana, Director of ISTE, Prof. D.C.J. Wessels (my second promoter), Prof. Jeanne
Kriek, both of ISTE, Dr M. Kolawole Onasanya, and Dr. Adeneye O. A. Awofala of
University of Lagos, Nigeria.
I want to acknowledge with thanks the various roles played by the following
personalities in Pretoria that will remain permanently engraved in my memory: Bukky
Ojo, Segun Ajigini, The Aregbesolas, Segun Adeyefa, Faleye, Maggi Mokolabi, Dapo
Adewunmi, Prof. Meschach B. Ogunniyi and a host of others
I express my heartfelt and sincere appreciation to my dearest wife and loving children
for their absolute understanding, good and moral behaviour and endurance while I was
far away in Pretoria. My wife took charge of the church, my role at Scripture Union,
nuclear and extended family apart from her own job. I appreciate it all.
vi
I thank all my brothers and sisters including Tunde Lemo, Deputy Governor (Operations)
Central Bank of Nigeria, Reuben Sogaolu, Wale Oludiya, Idowu Olaogun, Olalere
Abass, Olumuyiwa Alaba, Emmanuel Oyekanlu and a host of others for their spiritual
and moral support.
I am more than grateful to the management of Tai Solarin University of Education under
the good leadership of the then Vice-Chancellor, Prof. Olukayode O. Oyesiku for
granting me the approval to spend six months out of my accumulated leave for my
programme in South Africa. I cannot forget to appreciate the moral support given to me
by Prof. Segun Awonusi, my new Vice-Chancellor and the management team. God bless
you all.
To my colleagues in the Department of Mathematics and College of Science and
Information Technology, Mr, Dele Sogbesan for the language editing, and University in
general, I thank you all.
vii
DEDICATION
To my creator, the all-knowing GOD, the unchangeable changer, the unmovable mover,
unshakeable shaker, who preserved and sustained my life and the entire household in
actualizing my lifelong dream.
viii
TABLE OF CONTENTS
ABSTRACT ............................................................................................................................. II
DECLARATION.................................................................................................................... IV
ACKNOWLEDGEMENTS .................................................................................................... V
DEDICATION....................................................................................................................... VII
TABLE OF CONTENTS ................................................................................................... VIII
LIST OF TABLES ............................................................................................................. XVII
LIST OF FIGURES ............................................................................................................ XIX
CHAPTER ONE ....................................................................................................................... 1
2011) none of these studies investigated the effects of PBL on students’
achievement/performance in the subject domain along the level of either Bloom or TIMSS
taxonomies.
19
1.1.5 Bloom Taxonomy versus TIMSS Taxonomy
In 1948, a committee of colleges led by Benjamin Bloom started the enquiry into the
classification of educational goals and objectives into three domains: Cognitive (mental
skills), Affective (growth in feelings or emotional areas-attitude); and Psychomotor (manual
or physical skills-skills) and completed their work in 1956. Although Bloom and his
associates worked on the three domains, much emphasis was given to the cognitive domain.
The resulting classification in the cognitive domain is now commonly referred to as Bloom’
Taxonomy of the Cognitive Domain. In Bloom taxonomy of the cognitive domain,
educational objectives can be arranged in a hierarchy starting from the simplest behaviour or
skill to the most complex and this provides a useful structure with which to categorise and
analyse test items (Simkin & Kuechler, 2005). The six levels in Bloom cognitive taxonomy
include: knowledge, comprehension, application, analysis, synthesis, and evaluation. The
Bloom taxonomy of the cognitive domain has undergone revision (Anderson & Krathwohl,
2001) and the revised version of Bloom’s taxonomy validated the original by mapping six
well researched cognitive processes to a set of knowledge levels derived directly from the
original taxonomy (Simkin & Kuechler, 2005).
One other taxonomy closely related to the Bloom taxonomy of the cognitive domain is the
TIMSS taxonomy. The TIMSS taxonomy outlines the skills and abilities associated with the
cognitive dimension. The cognitive dimension is divided into three domains based on what
students have to know and do when confronting the various items developed for the TIMSS
assessment. The first domain, knowing, covers facts, procedures, and concepts students need
to know, while the second domain, applying, focuses on the ability of the student to apply
knowledge and conceptual understanding in a problem situation. The third domain,
reasoning, goes beyond the solution of routine problems to encompass unfamiliar situations,
complex contexts, and multi-step problems (TIMSS, 2007). The three cognitive dimensions
in TIMSS taxonomy can be derived from the original Bloom’s taxonomy of the cognitive
domain. The first domain, knowing relates to the knowledge and comprehension domains in
the Bloom’s cognitive taxonomy. The second domain, applying relates to the application
domain while the third domain in TIMSS taxonomy relates to the analysis, synthesis, and
evaluation domains of Bloom’s cognitive taxonomy. The first three domains in the Bloom
20
cognitive taxonomy are termed the lower-order cognitive domains while the last three
domains are collectively referred to as the higher-order cognitive domains.
However, the Bloom’s cognitive taxonomy is chosen in this study for several reasons: First, it
is the most widely known (Simkin & Kuechler, 2005) and therefore, the most accessible to
senior secondary school students in Nigeria. Second, it is used in more prior (Simkin &
Kuechler, 2005) and current studies (Awofala, Fatade & Ola-Oluwa, 2012) than any other
taxonomy and this enables this work to be more easily compared to prior work. Third,
Bloom’s taxonomy is regarded as a stricter hierarchy than any other taxonomy (Krathworhl,
2002) with less overlap between levels. Finally, a hierarchical taxonomy has significant
benefits when proposing a domain-specific operationalisation for creating examinations
because each question that requires specific evidence of achievement is more precisely traced
to a specific level of understanding (Simkin & Kuechler, 2005). This study foreclosed the use
of TIMSS taxonomy because Nigeria is yet to join the leagues of nation participating in
TIMSS study. In this study, students were assessed using the TMT and the RDT. The TMT
reflected the true state of the test being conducted in a normal classroom setting in Nigeria
and senior secondary school students are expected to be well grounded on the lower-order
cognitive domain of the Bloom’s taxonomy whereas students are expected to display prowess
on the higher-order cognitive domain of the Bloom’s taxonomy at the tertiary levels in
Nigeria. The RDT was used in this study to assess students’ higher-order cognitive domain of
the Blooms’ taxonomy.
1.2 Problem Statement
The relatively low enrolment and general poor performance of students in Further
Mathematics at the Senior School Certificate Examinations in Nigeria are indications of and
invitation to serious future problems in producing skilled and knowledgeable engineers and
scientists in the country. Teachers’ poor method of teaching as earlier stated has been
identified as one of the major factors responsible for students’ low enrolment and poor
performances in Further Mathematics. The search for an enduring, appropriate and effective
method of teaching Further Mathematics is yet to be fruitful, and this constitutes a major
problem. This study therefore, seeks to investigate the effectiveness of PBL in Further
Mathematics in senior secondary school year one in Ogun State in Nigeria.
21
1.3 Motivation for the study
The problems of ineffective teaching and learning of Further Mathematics in Nigerian
secondary schools have eaten deep to the very foundation of the nation’s technological
growth and need urgent surgical operation. The current state of malaise in Mathematics and
Further Mathematics has to be discontinued; otherwise, the nation’s technological
development would be greatly impeded (Azuka, 2003). No doubt, Further Mathematics has
been engulfed in a web of implementation problems. Students are not interested in the subject
and most of the few qualified Mathematics graduate teachers are not willing to teach the
subject. Mathematics is the queen and bedrock of all the sciences and is the major pillar on
which the technological development of any nation rests (Fatade, Wessels & Arigbabu,
2011). If the pillar is adequately fortified, there will not be any collapse. Azuka (2003:20)
questioned:
Where lays the hope of our economic and technological development? How can Nigeria effectively realize her vision of economic and technological development, if the situation is not improved upon?
Nation building and economic growth is highly dependent on an efficient and effectively
improved technology. Nigeria being conscious of this fact stipulates in her National Policy
on Education (FRN, 2004) that admission into the Universities shall be in 60:40 in favour of
the sciences and 70:30 into the Polytechnics and Colleges of Technology in favour of the
Sciences and Technical and Vocational. Government projection could not be achieved as
many prospective science students failed to secure admission into Tertiary Institutions due to
their poor performances especially in Mathematics at the Unified Tertiary Matriculation
Examination (UTME). The Government is worried at the development as more liberal Arts
students find it easier to pass the UTME. Many students do not register for Further
Mathematics or attempt to attend the classes during their Senior Secondary School. Further
Mathematics topics are however included at the Mathematics questions that students have to
take at the UTME. The Government needs to urgently address the issue if the country aims at
economic and technological development.
The inexhaustible number of problems plaguing the different levels of education in Nigeria
with particular reference to teaching and learning of Further Mathematics at the senior
secondary school level should not be seen as an incurable ailment. The healing process will
Comment [T1]: Any difference between NPE 2004 and NERDC 2004. Consitency, pls
22
however be gradual and has to commence from the source. The source is no other place than
the very starting point of introducing Further Mathematics to students at the senior secondary
school and using effective instructional methods such as the PBL that can nurture students’
inquiry during lessons. Dalton (1985) opined that if we hope to prepare children to meet the
demands of tomorrow, we must not spoon-feed them with facts and instructions. It is an
invitation to mental unemployment. Children must learn to think for themselves, innovate,
create, and imagine alternative ways to get to the same goal, to seek and solve problems.
Mathematics is the key to open doors of opportunity as it is a critical filter to a variety of
prestigious career options. No longer just the language of science, mathematics now
contributes in direct and fundamental ways to business, finance, health and defence. For
students, it opens doors to careers. For citizens, it enables informed decisions. For nations, it
provides knowledge to compete in a technological and information driven economy. To
participate fully in the world of the future no nation can afford to lag behind in tapping the
power of mathematics (NRC, 1989). The importance of Further Mathematics could then be
better imagined. Teachers’ method of delivery apart from subject content at all levels of
education in Nigeria has been identified to be deficient and inadequate (FME, 2002). The
need to identify and adopt an efficient and pragmatic method of teaching that is learner-
centred is inevitable in the nation’s quest to increase students’ credit pass rate in Mathematics
and Further Mathematics at WASSCE.
Considering the scenario painted above, the need for research into the teaching and learning
of Further Mathematics is imperative. Hence, the present study focused on the effectiveness
of PBL in the Further Mathematics classroom.
1.4 Aims of the study
The researcher carried out this study to find out whether the use of the PBL approach in the
Further Mathematics classroom would have any significant effect on students’ general
achievement.
Specifically, the aims of the study were:
A. To investigate the effect of PBL approach on students’ achievements in Further
Mathematics.
23
B. To examine the impact of PBL approach on students’ beliefs about Further
Mathematics.
C. To determine the effectiveness of PBL approach on students’ achievement in TMT in
Further Mathematics along the lower-order cognitive level of Bloom’s taxonomy.
1.5 Research questions
The study provided Yes/No answers to the following research questions:
(i) Will there be any significant difference in the post-test achievement scores on
TMT between students exposed to the PBL and those exposed to the TM?
(ii) Will there be any significant difference between the post-test achievement
scores on RDT between students exposed to the PBL and those exposed to the
TM?
(iii) Will there be any significant difference in the post-treatment scores on
SBFMQ between students exposed to the PBL and those exposed to the TM?
(iv) Will there be any significant difference between the students’ achievement
scores in TMT post-test disaggregated into knowledge, comprehension and
application levels of cognition of Bloom’s taxonomy after being exposed to
the PBL and the TM?
1.6 Research hypotheses
The following null hypotheses were stated and tested at .05 level of significance in the study
Ho1: There is no significant difference in the post-test achievement scores on TMT between
students exposed to the PBL and those exposed to the TM.
Ho2: There is no significant difference in the post-test achievement scores on RDT between
students exposed to the PBL and those exposed to the TM.
Ho3: There is no significant difference in the post-treatment scores on SBFMQ between
students exposed to the PBL and those exposed to the TM.
24
Ho4: There is no significant difference between the students’ achievement scores in TMT post-
test disaggregated into knowledge, comprehension and application levels of cognition of
Bloom’s taxonomy after being exposed to the PBL and the TM.
1.7 Significance of the study
The Nigerian Government has invested huge amounts of money on the training of Primary
and Secondary school teachers on pedagogical content knowledge through National Teachers
Institute in collaboration with the office of the Millennium Development Goals. The
continuous training has not improved students’ performance at WASSCE. The need to try
other modern methods of teaching should be a welcome idea.
PBL approach offers teachers an opportunity to continue learning mathematics from outside
and within their practice. The findings and the results of this study have both educational and
research implications in the Nigerian education context. The effectiveness of PBL in this
study lies in the fact that it stimulates students’ level and ways of thinking. The method
allows students to make decisions of their own. It helps students to develop their ability to
frame and ask questions. PBL method makes students to be bold and convinced when a
solution is appropriate or not. It agitates the minds of the students via their experience to be
able to defend their discoveries; hence, the method stimulates their reasoning capability. The
method encourages discussion between and among the students. It promotes interpersonal
relationships among the students.
Head teachers of Primary schools, Principals, Classroom teachers of Secondary schools and
Ministry of Education officials might benefit from the findings of this study. They are all
regarded as contributors to the making of educational policies at one stage or the other.
Students annual poor performances in Mathematics and Further Mathematics at all the
external examinations in Nigeria is a national concern among curriculum developers, policy
makers, parents, teacher preparation institutions and the Government. It is the Government’s
responsibility through its agencies to recommend and provide enabling environment for the
implementation of any new method of teaching in all the schools.
The study is therefore significant in the sense that its findings might provide essential
baseline information and necessary ingredients to help address the problem of students’
25
attrition in Further Mathematics classroom. It could, indeed, be regarded as a contribution to
knowledge and as a way of assisting the Government of Nigeria to find a lasting solution to
the malaise of poor performance in Further Mathematics that has eaten deep into the very
foundation of Nigeria’s technological growth.
1.8 Scope and limitation of the study
The Federal Republic of Nigeria is made up of 36 states, which could be further categorized
into six geo-political zones, namely, North-West, North-East, North-Central, South-West,
South-East and South-South. The present study was limited to Ogun State in the South West
geo-political zone. Western education came to Nigeria through Ogun State in 1843. Ogun
State is thus classified as one of the educationally advantaged States in the country, and it has
become a reference point to other states in the area of education. It would have been ideal for
the study to cover the four divisions of the state but factors such as time, distance and the
need for the researcher to personally, handle the experimental class led to the decision to limit
the study to one State. The proximity of the researcher to the control and experimental
schools enhanced the administration of research instruments and, indeed, the feasibility of the
entire research.
1.9 Definition of terms
Effectiveness: is the capability of producing a desired result.
Problem-Based Learning (PBL): The PBL is one of the modern methods of teaching that
allows each learner to construct his/her own schema
Further Mathematics (FM): This is one of the subjects that students register for at the
Senior Secondary Schools, though it is classified as optional. Further Mathematics is different
from Mathematics in that the former encompasses the latter in addition to some rudiments of
tertiary mathematics such as calculus, matrices, vectors and mechanics.
1.10 Structure of the thesis
CHAPTER ONE: INTRODUCTION
In this chapter the introduction, orientation and background to the study are discussed. In
addition, the motivation, problem statement, research questions, research hypotheses,
26
significance of the study and the aims of the study are clearly stated. Statistics of student
entries and results at the West African Senior School Certificate Examination (WASSCE) in
Mathematics and Further Mathematics over a period 20 and 15 years are respectively
included to reflect the students’ performance in Mathematics and Further Mathematics. The
curriculum goals and expectations, examination format and duration are all explained in this
chapter.
CHAPTER TWO: LITERATURE REVIEW
In this chapter, the conceptual analysis of PBL is explained. The students’ mathematical
beliefs and achievements, differences between PBL and Problem-solving are discussed. Some
case studies on successful stories, advantages and challenges of the PBL are highlighted.
Pedagogical discourse on Subject-Content Knowledge (SCK), Pedagogical-Content
Knowledge (PCK) and Curricula-Knowledge (CK) are thoroughly explained. The teaching of
some specific topics in Senior Secondary School year one Further Mathematics curriculum is
demonstrated using the PBL and the TM. Lastly, Learning Trajectory and its criteria are
discussed.
CHAPTER THREE: RESEARCH METHODOLOGY
This section describes the methodology followed in addressing the research questions and
hypotheses. In this section, the research methodology/ paradigm, research design, population
and sample, the research instruments, procedure for data collection, data analysis and
interpretation, limitations of the study, and validity and reliability are discussed.
CHAPTER FOUR: PRESENTATION OF RESULTS
In the preceding chapter, the research methodology employed in the study was explained.
This chapter presents the results obtained in the main study in order to answer the research
questions that guided this study as stated in chapter one. The raw data from the field for pre-
and post- tests in both the experimental and control classes are analysed and summarised
using descriptive statistics of tables. Other relevant descriptive statistical tools such as the
mean and standard deviation obtained in the tests (TMT and RDT) and questionnaire
(SBFMQ) were used in the study. However, the summary of the results concludes the
chapter.
27
CHAPTER FIVE: SUMMARY OF THE STUDY, DISCUSSION, CONCLUSSION AND
RECOMMENDATIONS
The summary of major findings of the study is given in this chapter. Based on this,
suggestions and recommendations are made. The chapter concludes with suggestions for
future research in problem-based learning.
28
CHAPTER TWO
LITERATURE REVIEW
2.1 Introduction
In this chapter, the conceptual analysis of PBL is explained. Students’ mathematical beliefs
and achievements, differences between PBL and Problem-solving are discussed. Some case
studies on successful stories, advantages and challenges of PBL are highlighted. Pedagogical
discourse on Subject-Content Knowledge (SCK), Pedagogical-Content Knowledge (PCK)
and Curricula-Knowledge (CK) are thoroughly explained. The teaching of some specific
topics in the Senior Secondary School year one Further Mathematics curriculum is
demonstrated using PBL and TM. Lastly, the Learning Trajectory and its criteria are
discussed.
2.2 Conceptual analysis of PBL
There does not exist presently a universally accepted definition of PBL as researchers ascribe
varieties of definitions and meanings to it. For example, Simon & Schifter (1991) describe
PBL as an alternative pedagogy, a new paradigm of mathematics instruction, long in
gestation which has begun to find the support necessary to contest the old traditional method
of instruction. PBL is also a classroom strategy that organizes mathematics instructions
around problem solving activities and affords students more opportunities to think critically,
present their creative ideas and communicate with peers mathematically (Krulic & Rudnick,
1999; Hiebert et al., 1996, 1997; Kyeong Ha, 2003). Major (2001) defined PBL as an
educational approach in which complex problems serve as the context and the stimulus for
learning. The common denominator to the varieties of PBL definitions is that students
actively construct their own knowledge of mathematics. The current study adopts this notion
of PBL.
Problem-Based Learning (PBL) was first established as part of the education of physicians in
medical school at McMaster University, Hamilton, Ontario, Canada in the 1960s. Developed
by Howard Barrows, this strategy has grown into an instructional approach, which is finding
success in elementary through high school throughout the state of Illinois Mathematics and
Science Academy and beyond. PBL was originally developed out of the perceived need to
29
produce graduates who were prepared to deal with the information explosion, and who could
think critically and solve complex problems (Major, 2001). PBL is rooted in Dewey’s
“learning by doing and experiencing” principle (Dewey, 1938 in Hiebert et al., 1996). Dewey
advocated engaging the learner in everyday problems to facilitate learning. Hiebert et al.
(1996) proposed alternative principle by building on John Dewey’s idea of “reflective
inquiry” that curriculum and instruction be guided by the basic principle that students
problematize their subjects.
Smith (1997) described Hiebert et al. submission as a relatively narrow view of school
mathematics content. He remarked that while they are correct to argue that topics
traditionally taught in routine and uninteresting ways can be problematized, their implicit
view of content is inconsistent with the problematizing process itself. He stated further that if
students are encouraged to engage in that process seriously and articulate what they find
interesting and problematic, and do not expect to be assigned problems to solve, their
interests would inevitably lead them to ponder a much richer and wider range of
mathematical ideas. Problematizing, according to Hiebert et al. (1996) if pursued seriously,
will burst the boundaries of the traditional school mathematics curriculum. To problematize
is to “wonder why things are, to inquire, to search for solutions, and to resolve incongruities”.
When students problematize mathematics, they become “engaged in genuine problem
solving” and find, present and discuss “alternative solution methods”. Whether tasks become
“problematic” and engaging, there emphasis depends more on how teachers and students treat
them than on their source e.g. ‘‘real–life situations”. Hiebert et al. (1996) admitted that the
principle in mathematics fits under the umbrella of problem solving, but their own
interpretation differs from many problem-solving approaches.
Educational and Professional schools also began to feel many of the same needs as medical
schools, so they began to adopt the approach as well, although in different forms, such as
hybrid PBL, and traditional curricula and course-by course models; again the approach
spread to institutions around the world (Boud & Feletti, 1991). A search for a change from
the traditional method of teaching resulted in the National Council of Teachers of
Mathematics (NCTM) adopting a veritable pragmatic alternative method for effective
teaching and learning of mathematics, which incorporates the characteristics of PBL (NCTM,
2000). PBL is an active learning approach which enables students to become aware of and
30
determine his/her problem solving ability and learning needs, to learn how to learn, to be able
to make knowledge operative and to perform group works “in the face of real life problems”
(Akinoglu &Tandogan, 2007). Hence, the current study sought to determine its effectiveness
in the learning of Further Mathematics in Nigeria.
Literature reveals that studies have focused on the use of PBL model in primary education,
secondary and post-secondary education by the 1980s (Duch, Gallagher, Kaptan, &
Korkmaz, in Akinoglu & Tandogan, 2007). In the current study, PBL was used in secondary
school education. The PBL approach is a learning model which centres on students, develops
active learning, problem-solving skills and field knowledge, and is based on understanding
and problem-solving (Major, 2001). The PBL model turns the student from a passive
information recipient to an active, free self-learner and problem solver, and it slides the
emphasis of educational programme from teaching to learning. This model enables students
to learn new knowledge by facing him/her with the problems to be solved, instead of
burdened contents (Ndlovu, 2008). The PBL teaching approach is at present not in vogue in
the Nigerian educational system. Teachers in Nigeria, as in other countries in the world hold
beliefs that the traditional method of teaching is ineffective and highly unproductive
(Awodeyi, 2003) in teaching curricular contents. The students are exposed to the curriculum
that is more theoretical than practical (Azuka, 2003) thereby resulting into teachers adopting
instructional strategies that are largely traditional. Most times students find themselves
memorising mathematics formulae for passing examinations. Students do not immediately
realize the applications of what they are taught and find it difficult to conceptualise the topics
being taught, not to talk of the applications (Mji, 2003).
An enabling environment for the implementation of the PBL approach is yet to be put on
ground by Government and stakeholders in the Nigerian education. . This might be due,
among other reasons, to acute shortage of teaching facilities, textbooks written with PBL
focus, orientation, and teachers that are trained in the PBL pedagogical approach.
Government has made some efforts to address the problem of ineffective teaching methods
being used in our classrooms. One of such efforts is the Second Primary Education Project
(PEP II) and Teaching and Learning Studies. Under PEP II, the Universal Basic Education
Programme (UBEP) carried out a number of activities across the country to improve the
quality of teaching and learning in primary schools. Two types of research activities were
31
undertaken that would contribute to improvement in the content and management of teacher
education and training. These are; (a) national surveys of teachers and teacher education
programme, and (b) action research and development activities in classrooms and across
school clusters (UBEC, 2002). Participatory method of approach was planned for the use of
the project. PBL, however accommodates this method and still possesses other features that
can enhance effective teaching and learning of Further Mathematics.
2.3 Students’ mathematical beliefs and achievements
Research on beliefs dates a long way back. Beliefs are paramount, given that they can
generate psychological domains of behaviour. In the same way, belief about Mathematics can
determine how one chooses to mentally construct the whole idea of Mathematics. Beliefs are
personal principles, constructed from experience that an individual employs often
unconsciously to interpret new experiences and information and to guide action (Pajares,
1992). Cobb (1986) defined beliefs as an individual personal assumption about the nature of
reality. The importance of beliefs in the life of a student is stressed again because these
assumptions constitute the goal-oriented activity. Beliefs play a significant role in directing
human’s perceptions and behaviour. In learning environments, students’ belief might
propagate the idea for achievements and smoothness of learning. The current study focused
on the impact of PBL on learners’ beliefs. In the Mathematics learning process, students’
beliefs about the nature of Mathematics and factors related to the learning are two
components that always concern Mathematics educators. Fennema & Sherman (1978)
reported that middle school and high school students who achieved higher scores on tests of
mathematical achievement perceived Mathematics to be more useful than lower-achieving
students did. Schreiber (2000) studied attributions associated with successful achievement
and found that the more a student believed that success in Mathematics was caused by natural
ability, the higher the test score.
Several researchers (Amarto & Watson, 2003; Chick, 2002; Morris, 2001) have reported that
pre-service teachers do not always have the conceptual understanding of the mathematics
content they will be expected to teach. Alridge & Bobis (2001) reported a change in beliefs
about Mathematics towards a more utilitarian and problem solving perspective because of a
university education programme. Schuck and Grootenboer (2004) stated that research ‘on the
beliefs of student teachers has found that prospective primary school teachers generally hold
32
beliefs about mathematics that prevent them from teaching mathematics that empower
children’. House (2006) conducted a study to compare the relationship of mathematics beliefs
and achievement of elementary school students in Japan and the United States based on the
Third International Mathematics and Science Study (TIMSS). The study revealed that
students in Japan scored above the International averages.
Chen & Zimmerman (2007) compared the mathematical beliefs between American and
Taiwanese and found that the Taiwanese students surpassed the American students in
mathematics achievement. Their result supported the TIMSS (1995) report on the
International comparison of the two countries. Chen and Zimmerman (2007) concluded that
there were more similarities in mathematics beliefs regarding mathematical competence of
Taiwanese and American students. The results of the study showed that students from both
countries have undistinguishable beliefs in the difficulty level of mathematics questions
especially the easy and difficult mathematics items. De Corte & Op’t Eynde (2003)
conducted a research on mathematics beliefs among Belgium secondary school students and
the findings showed that most students believed that mathematics was an interesting
discipline to be learnt. They also found that there was a significant difference among students
in terms of their mathematics ability.
2.4 Differences between PBL and PROBLEM-SOLVING
PBL as the name connotes starts with a problem to be solved and students working in a PBL
environment must become skilled in problem solving, creative thinking and critical thinking
(Kyeong Ha, 2003). One way to widen students’ perspectives and to encourage deep learning
is to stimulate class discussion face to face. Effective discussions have the potential to guide
and motivate students, and provide a safe and conducive environment for learning and
communication exchange. An opening question that encourages higher order thinking will set
the tone for the rest of the discussion. The richest discussions are those that open up
participants’ minds to many possibilities rather than close them down to a right or wrong
answer. These are some of the attributes of PBL. Mathematics is to be taught through
problem solving and problem-based tasks or activities are the vehicles by which the desired
curriculum is developed (Van de Walle, 2007). The learning is an outcome of the problem-
solving process. Hence, the interest in this study was to determine whether PBL could
improve the students’ problem solving performance.
33
Problem solving is not a spectator sport, nor is it necessarily the matching of acquired
knowledge to new situations but a searching for a solution by actions that seem appropriate
(Simmons, 1993). Problem solving, according to Blum et al (1989) simply refers to the entire
process of dealing with a problem, pure or applied in attempting to solve it. In mathematics
education, problem solving is considered in two ways, (i) as an object of research on issues
such as; how is problem solving related to other aspects of thinking mathematically. (ii) In
relation to mathematics instruction, where issues concerning the inclusion and
implementation of problem solving in mathematics curricula addressed. Applied problems
which can also be referred to as, a real problem situation has to be simplified, idealised,
structured and be made more precise by the solver according to his/her interest.
Wigley (1992) described two models for teaching and learning that were used in the
classroom in his article titled ‘Models for Mathematics Teaching’. One was called The Path
Smoking Model (PSM) and the other was called an Alternative-the Challenging Model (CM).
While the PSM ensures that, the syllabus is covered quickly and its teachers use it to help
students achieve success in public examinations; the CM asserts that the understanding of the
Mathematics is more important than examination success. The CM allows students build on
their understanding of Mathematics through discussions and strategic problem solving. In
CM teachers’ role is not to teach but to support and present initial challenges for the students
to build on their mathematical knowledge. Realistic Mathematics Education and Diagnostic
teaching are two approaches to teaching and learning that made use of the Challenging Model
features. These two approaches allow students to understand mathematics for themselves
through problem solving and allow teachers to take a step back and observe the learning
process.
In summary, the PBL is a classroom strategy that organizes mathematics instructions around
problem solving activities and affords students more opportunities to think critically, present
their creative ideas and communicate with peers mathematically. Problem solving, according
to Blum et al. (1989) simply refers to the entire process of dealing with a problem, pure or
applied in attempting to solve it. However, RME is one of the approaches to teaching and
learning that allows students to understand mathematics for themselves through problem
solving and allows teachers to take a step back and observe the learning process.
34
2.5 Case studies on successful stories of PBL
The researcher investigated from literature the extent to which problem-based learning
approach has been used in the teaching of mathematics to students at various levels of
education. Considerable literature on PBL dates in the nineties. For example, Gallagher,
Stepian, Sher & Workman (1995) study on PBL in science classrooms found that PBL
creates an environment in which students (a) participate actively in the learning process, (b)
take responsibility for their own learning, and (c) become better learners in terms of time-
management skills and ability to define topics, access different resources, and evaluate the
validity of these resources. Krynock & Robb (1996) corroborated the findings of Gallagher et
al. (1995) in a study ‘Is PBL a problem for your curriculum?’ In a comparison of PBL with
TM, Krynock & Robb (1999) noted that in PBL student activity is the norm with students
working in groups, confering with others, doing labs, creating physical displays, or consulting
resources outside the classroom. They noted further that PBL enables students to solve real
problems about their world with accurate, logical, and creative solutions using skills that
connect to different subject areas. In a paper presented by Achilles & Hoover (1996) titled
‘Exploring PBL in Grades 6-12’, submitted that PBL appears to improve critical thinking,
communication, mutual respect, teamwork, and inter-personal skills and increases students’
interest in a course. Gordon, Rogers, Comfort, Gavula, & McGee (2001), West (1992),
Savoie & Hughes (1994) and McBroom & McBroom (2001) also supported these views.
Ward (2007) looked at issues involved in developing and implementing an effective student-
centred, problem-based mathematics-learning environment for English Second Language
(ESL) students. He used a case study approach to describe the evolution (development,
implementation, evaluation) along ‘constructivist lines’ of a mathematics learning-
environment within the foundation year of what could be termed, a selective Arab University.
He used SPAIN (Successful-Pictorial-Algorithmic-‘Illgebraic’-Numeric) to determine a
student’s problem-solving veracity and preference. Although not a conclusive method he
remarked, SPAIN allows us to identify students with limited problem-solving strategies and
also students who are gifted-and talented in this respect. Students in this procedure are guided
through what is initially a relatively simple problem that increases in complexity.
Sungur & Tekkaya (2006) of the Middle East Technical University, Turkey used Motivated
Strategies for Learning Questionnaire to investigate the effectiveness of problem-based
35
learning and traditional instructional approaches on various facets of students’ self-regulated
learning, including motivation and learning strategies. Results revealed that PBL students had
higher levels of intrinsic goal orientation, task value, use of elaboration learning strategies,
critical thinking, meta-cognitive self-regulation, effort regulation, and peer learning compared
with control group students. Iroegbu (1998) in a study of Problem-based learning, numerical
ability and gender as determinants of achievement in line graphing skills in Nigerian Senior
Secondary School Physics found that PBL was more effective than TM in facilitating
students’ achievement. Hoffman & Ritchie (1997) affirmed that PBL could promote transfer
of knowledge and skills gained in the school to daily life. It is against this background the
current study is pursued with a view to determining whether PBL can enhance learning and
change students’ beliefs.
Şahin (2009) investigated the correlations of PBL and traditional students’ course grades,
expectations and beliefs about physics and selected student variables in an introductory
physics course in engineering faculty. PBL and traditional groups were found to be no
different in their responses to the Maryland Physics Expectations Survey (MPEX) and in
their physics grades. In addition, students who showed effort and studied hard tended to
obtain higher physics grades. Şahin (2009) in a pretest-posttest quasi-experimental study of
the effect of instructional strategy manipulated at two levels; modular-based active learning
(problem-based learning [PBL]) method and traditional lecture method on university
students’ expectations and beliefs in a calculus-based introductory physics course measured
with the Maryland Physics Expectations (MPEX) survey revealed that average favourable
scores of both groups on the MPEX survey were substantially lower than that of experts and
that of other university students reported in the literature. He maintained that students’
favourable scores on the MPEX survey dropped significantly after one semester of instruction
and both PBL and traditional groups displayed similar degree of ‘expert’ beliefs. He
concluded that university students’ expectations and beliefs about physics and physics
learning deteriorated as a result of one semester of instruction whether in PBL or traditional
context.
Albanese & Mitchell (1993) concluded that problem-based instructional approaches were less
effective in teaching basic science content (as measured by Part I of the National Board of
Medical Examiners exam), whereas Vernon & Blake (1993) reported that PBL approaches
36
were more effective in generating student interest, sustaining motivation, and preparing
students for clinical interactions with patients. Mixed results were also observed in the studies
by Moust, Van Berkel & Schmidt (2005) and Prince (2004) in which the latter maintained
that it is difficult to conclude if it is better or worse than traditional curricula, and that ‘it is
generally accepted …that PBL produces positive student attitudes’ (p. 228) whereas the
former concluded that PBL has a positive effect on the process of learning as well as on
learning outcomes. According to Major & Palmer (2001) students in PBL courses often
report greater satisfaction with their experiences than non-PBL students whereas Beers
(2005) demonstrated no advantage in the use of PBL over more traditional approaches.
2.6 Advantages and challenges of PBL
The modes of instruction and education have undergone significant changes with the passage
of time. PBL is one of such novel modes of imparting knowledge to the aspiring students.
Teaching and learning are no longer limited to classroom sessions where one person takes the
centre stage to deliver knowledge and a group of students remain at the receiving end. The
present day education has expanded its wings to more practical methods of teaching wherein
students are allowed to experiment and explore beyond the instructor led knowledge. PBL is
one such way of teaching students where they use their prior knowledge to solve problems
and learn new things in the process. PBL is more likely to motivate and excite the students to
learn, wherein they need to play an active role in analyzing things for a given assignment.
PBL enhances the problem solving skills of the students as opposed to providing only
theoretical knowledge. Learning, therefore, goes beyond bookish knowledge and helps the
students face and see through practical problems. PBL allows students to use prior knowledge
to solve new problems and ensures deeper understanding. Learning is enhanced when new
information is presented through a meaningful context and comes in conflict with the existing
knowledge. PBL demands a collaborative approach towards problem solving, thus, creating
an environment in which the students learn to see various approaches to solve one problem
through group interactions. This makes the team members’ responsible for each other and not
just for one's own self. PBL demands a unique relation between the students and the teacher.
This, in turn, allows the students to partially determine their course of action with the help of
the teacher, making learning more interesting, engaging and activity based.
37
Across the nations, according to Science Teachers Association of Nigeria (STAN) (1992),
some of the identified teacher-related causes of ineffective teaching of Mathematics and
Further Mathematics, apart from the teaching method adopted, are low morale of teachers
because of the low ranking of the teaching profession, poor preparation of teachers and lack
of motivation of many mathematics teachers. Others are inadequate knowledge of the subject
matter, lack of skills/competence required for teaching, lack of skills of improvisation and
shortage of qualified mathematics graduate teachers. These factors are underpins that are
likely to jeopardize the positive effects of any alternative method of teaching adopted by
teachers in place of the ineffective traditional method that has been discussed earlier.
Several researchers like Adler (1997), Franco, Sztajn, & Ortigao (2007) among others, for
reasons best known to them, avoided the use of the name problem-based learning. Other
names used by them like participatory-inquiry approach, collaborative/cooperative learner-
centred describes nothing else than problem-based learning approach. This is one of the
major problems even among mathematics educators. The principals of schools where
problem-based learning approach was to be implemented had to be motivated in terms of
having job satisfaction and be convinced well of its suitability before giving approval for its
implementation.
Some of the reasons given by the school principals against the use of Problem-based learning
were that the method prevented teachers to cover all the topics in the scheme for a specified
term and the allocation of just two periods per week on the school timetable. Others were that
teachers had to be motivated and had job satisfaction, otherwise the approach could be
handled haphazardly, and the fear of the school management and the parents on how well the
students performed in standardised tests. The paucity of qualified mathematics graduate
teachers was a major concern to the school management, placing further mathematics periods
in the afternoon when most of the teachers seemed to have exhausted themselves and non-
periodical review of mathematics curricula at the teacher preparation institutions.
Akinoglu & Tandogan (2007:74) remarked that the following points might militate against
effective implementation or non-adoption of problem-based learning approach in the school
system that cut across all levels of education:
(i) It could be difficult for teachers to change their teaching styles.
38
(ii) It could take more time for students to solve problematic situations when these
situations are firstly presented in the class.
(iii) Groups or individuals may finish their works earlier or later.
(iv) Problem-based learning requires rich material and research.
(v) It is difficult to implement Problem-based learning model in all the classes. It is
fruitful to use this strategy with students who could not fully understand the value
or scope of the problems with social content.
Resistance against the adoption of problem-based learning includes the time and energy
involved in terms of the teacher who faces an examination-driven mathematics curriculum.
Others are the culture of a traditional classroom that reflects the culture of the traditional
society where most learners come from, the need or cost of material resources and the
challenges involved in changing the classroom environment from a transmission of
knowledge to an argumentative and discursive-based method of instruction Akinoglu &
Tandogan (2007).
2.7 Pedagogical discourse
The South African National Curriculum Statement Grade R-9 and the submissions of Van der
Walt & Maree (2007) seem to have adopted Shulman’s (1987) theory of constituents for an
effective teaching and learning because the seven different roles expected from a learning
facilitator are almost identical to Shulman’s categorisation of the knowledge base. Ball, Bass,
Sleep, & Thames in Kotsopoulos & Lavigne (2008) proposed a framework that describes the
knowledge associated with mathematics knowledge for teaching (MKT). The framework
consists of four “distinct domains” (Ball, Bass, Sleep & Thames in Kotsopolous & Lavigne
2008): common content knowledge (CCK)-the mathematical knowledge of the school
curriculum; specialised content knowledge (SCK)- the mathematical knowledge that teachers
use in teaching that goes beyond the Mathematics of the curriculum itself. Others are
knowledge of students and content (KSC) - the intersection of knowledge about students and
knowledge about Mathematics; and knowledge of teaching and content (KTC) -intersection
of knowledge about teaching and knowledge about Mathematics. Three bodies of literature
39
inform this study (i.e. Shulman, 1986, 1987; Van der Walt & Maree, 2007; Kotsopoulos &
Lavigne, 2008).
The studies by Shulman (1986, 1987); Van der Walt & Maree (2007); Kotsopoulos &
Lavigne (2008) centred generally on how effective teaching and learning of Mathematics
could be achieved. The current study investigated the effectiveness of PBL. Divergent views
were expressed on the pertinent question of “which one comes first, how to teach or what to
teach”? It is a predicament, because it is a question about teacher’s knowledge. The common
belief in the society is that if a teacher knows Mathematics very well, he or she is the best
person to teach Mathematics, nevertheless, what about “knowing to teach Mathematics?”
Fennema & Franke (1992) determined the components of Mathematics teachers’ knowledge
as knowledge of Mathematics – content knowledge consisting of the nature of Mathematics
and the mental organisation of teacher knowledge; knowledge of mathematical
representations; knowledge of students, that is, knowledge of the students’ cognition and
knowledge of teaching and decision-making. The argument here is that all these forms of
knowledge are essential in the derivation of beliefs about PBL as a mode of learning.
2.7.1 Different Components of Mathematics Teachers’ Knowledge
The first component of Mathematics teachers’ knowledge refers to teachers having
conceptual understanding of Mathematics. Fennema & Franke (1992) argue that if a teacher
has a conceptual understanding of Mathematics, this will influence classroom instruction in a
positive way; it is therefore important for teachers to have Mathematics knowledge. They
also emphasise the importance of knowledge of mathematical representations, because
Mathematics is perceived as a composition of a large set of highly related abstractions. They
state that if teachers do not know how to translate those abstractions into a form that enables
learners to relate Mathematics to what they already know, the students would not learn with
understanding. It is for this reason this study determined the PBL’s potential to recognize
what the students already know and the extent to which PBL can enable learning with
understanding. Knowledge of students’ cognitions is seen as one of the important
components of teacher knowledge, because, according to Fennema & Franke (1992), learning
is based on what happens in the classroom, and not only on what students do, but on the
40
learning environment is important for learning. “Knowledge of teaching and decision
making” is the last component of teacher knowledge.
Teachers’ beliefs, knowledge, judgments, and thoughts have an effect on the decisions they
make which influence their plans and actions in the classroom. In what Kotsopoulos &
Lavigne (2008:18) referred to as shaping this research is the growing body of scholarship
known as “mathematics for teaching”. According to them, this scholarship suggests that there
is a complex interrelated and multi-faceted core knowledge required for teaching
Mathematics that ought to inform how Mathematics teacher education is conceived of and
how ongoing professional development amongst teachers occurs. However, Ball (2000)
suggested that to improve teachers’ sense of what content knowledge matters in teaching,
teachers would need to identify core activities of teaching, such as figuring out what students
know; choosing and managing representations of ideas; appraising, selecting, and modifying
textbooks. She said further that teachers should decide among alternative courses of action,
and analyse the subject matter knowledge and insight entailed in these activities.
Researchers that theorize about Mathematics for teaching seem to have agreed on the need
for teachers to possess enough subject content knowledge in such a way as to be able to know
how to use Mathematics to develop students’ understanding (Adler, & Davis, 2006; Ball &
Bass, 2001; Davis & Simmt, 2006). This is in agreement with the momentum for reform in
Mathematics education that started in the early 1980s. Mathematics educators were
responding to a “back to basics” movement, which culminated in problem solving becoming
an important strand in the Mathematics curriculum (Van de Walle, 2007). The researcher
however observed from NCTM (2000) that the emphasis of the reform is also on pedagogical
content knowledge (PCK) and not only on the subject content knowledge (SCK). In Shulman
(1986:4) reactions to what he referred to as infamous aphorism, words that have plagued
members of the teaching profession for nearly a century of George Bernard Shaw’s “He who
can, does, He who cannot teaches” described the statement as a calamitous insult to the
teaching profession, yet one readily repeated even by teachers. This saying is in line with
what PBL prescribes.
41
2.7.2 Shulman’s Submissions on Teachers’ Knowledge
Inquiries into conceptions of teacher knowledge with the tests for teachers that were used in
the USA during the last century at both State and country levels according to Shulman (1986)
reveal that the idea of testing teacher competence in subject matter and pedagogical skill has
been in existence before the 1980 era of educational reform. Comparatively, the emphasis on
the subject matter to be taught in today’s standards stands in sharp contrast to the emerging
policies of the 1980s. The evaluation of teachers emphasizes the assessment of capacity to
teach. The assessment is usually claimed to rest on a “research-based” conception of teacher
effectiveness. Where did the subject matter go? What happened to the content? Perhaps Shaw
was correct as he accurately anticipated the standards for teaching in 1985: He who knows,
does. He who cannot teaches (Shulman 1986:4). The absence of focus on subject matter
among the various research paradigms for the study of teaching was referred to by Shulman
(1986) and his colleagues as the “missing paradigm” problem. Shulman (1986) submitted that
for effective teaching and learning to be achieved, teachers must reflect an understanding that
both content and process are needed by teaching professionals, and within the content, we
must include knowledge of the structures of one’s subject, pedagogical knowledge of the
general and specific topics of the domain, and specialised curricular knowledge.
Shulman’s submission was reflected in the South Africa policy statement, the National
Curriculum Assessment. The South African National Curriculum Statement Grade R- 9
(Department of Education, 2002) for the learning area Mathematics stresses the importance
of problem-solving, reasoning, communication and critical thinking. The National Education
Policy Act (DoE,1996) requires a learning facilitator to play seven different roles, that is,
learning mediator, Interpreter and designer of learning programs and materials, Leader,
Administrator and Manager; Scholar, Researcher and lifelong learner; Community,
citizenship and pastoral role; Assessor; and Learning area specialists (DoE, 2003). Some of
these roles directly imply meta-cognition. As a facilitator of learning, assessor and subject
specialist, according to Van der Walt & Maree (2007), should have a thorough knowledge of
his/her subject, teaching principles, strategies, methods, skills and education media as
applicable to South African conditions. Facilitators should also be able to monitor and fairly
evaluate learners’ progress, their knowledge, insight and views on teaching strategies and
42
learning so that these factors can be utilised during the design and implementation of learning
curricular.
Shulman (1987) outlined the categories of knowledge that underlie the teacher understanding
needed to promote comprehension among students: content knowledge, general pedagogical
knowledge; curriculum knowledge; pedagogical content knowledge; knowledge of learners
and their characteristics; knowledge of educational contexts; and knowledge of educational
ends, purposes, and values. Shulman (1987) pioneered the call for focusing the reform shift to
the pedagogical content knowledge, when he remarked that:
Among the seven stated categories of the knowledge base, pedagogical
content knowledge is of special interest because it identifies the distinctive
bodies of knowledge for teaching. It represents the blending of content and
pedagogy into an understanding of how particular topics, problems, or
issues are organised, represented and adapted to the diverse interests and
abilities of learners, and presented for instruction. Pedagogical content is
the category most likely to distinguish the understanding of the content
specialist from that of the pedagogue (p.8)
This was corroborated by Principles and Standards of NCTM (2000) and An, Kulm, & Wu
(2004). According to them, pedagogical content knowledge has three components:
knowledge of content, knowledge of curriculum, and knowledge of teaching. They
acknowledged knowledge of teaching and accepted it as the core component of pedagogical
content. Grouws & Schultz (1996) stated that pedagogical content knowledge includes, but is
not limited to, useful representations, unifying ideas, clarifying examples and counter
examples, helpful analogies, important relationships, and connections among ideas. The
different views as expressed by researchers in mathematics education and related discipline
seem to centre on the three categories of content knowledge analysed by Shulman (1986).
Shulman (1986) categorised content knowledge into three: subject content knowledge,
pedagogical content knowledge, and curricular knowledge and submitted that the three are
inseparable. The holistic approach to teacher effectiveness in the classroom is the possession
of the three categories stated by Shulman. The current study asserted that successful use of
PBL was somehow espoused by the three categories of knowledge.
43
2.7.3 Submissions of Ball and Associates on Teachers’ Knowledge
Comparing the studies of (Ball, Bass, Sleep, & Thames in Kotsopolous & Lavigne, 2008) to
Shulman (1986), knowledge of students and contents were not clearly stated by Shulman,
perhaps was assumed to have been embedded in pedagogical content knowledge, but was
explicitly addressed by Ball et al. KSC is of high significance in a PBL classroom. It
conforms with the NCTM’s (2000) principles and standards that adopted Problem-based
learning as an alternative method of teaching to the ineffective traditional method of teaching.
Ball (1989) found that teachers’ with advanced degrees in Mathematics or to use Ball et al
(2005) domains, high SCK, may alternate student interest for content integrity in making
choices about subject matter which might not result into effective teaching of Mathematics
and Further Mathematics. Ball (1989) further claimed that teachers without sufficient SCK
(or other domains) are able to learn both pedagogy and content and become effective teachers
of Mathematics, hence supporting the Mathematics for teaching movement.
The researcher is in agreement with Ball’s (1989) submission that possession of only higher
degrees in mathematics or any related field will not necessarily result in effective teaching of
mathematics and Further Mathematics. The researcher also agrees with Ball’s (2000)
submission that there exists little empirical evidence to link teachers’ content knowledge to
their students’ learning and that what is being measured as “content knowledge” (often
teachers’ course attainment) is a poor proxy for subject matter understanding. Fatade (1998)
found that teachers with low SCK and no PCK, and Mathematics graduate teachers with
either third class or ordinary pass at the honours degree level had difficulties teaching
difficult concepts in Further Mathematics. Teachers’ in this category often omit such difficult
topics like conic sections, dynamics and vectors. This in essence correlates with the Chief
Examiners’ Report of West African Examinations Council (WAEC, 2007) from marks and
attendance sheets that some questions at the West African Senior School Certificate
Examination (WASSCE) are no-go areas for students, an indication that the topics from
which the questions were set were either not taught or sparingly taught by teachers. The
above scenario reveals a classroom where modern methods of teaching like PBL is non-
existent and could probably be responsible for student poor performances at both internal and
external examinations. This study relied on Shulman’s (1986) submissions that teachers’
possession of high subject content, pedagogical content and curricula knowledge determined
44
who an effective teacher is. A PBL teacher is expected to possess all these components of an
effective teacher. It is on this premise that the researcher investigated the effectiveness of
PBL in Further Mathematics classrooms.
2.7.4 Contentions on Teachers’ Knowledge
According to Turnuklu & Yesildere’s (2007) findings’, having a deep understanding of
mathematical knowledge was necessary but not sufficient to teach Mathematics. The findings
pointed out that the degree of association between knowledge of Mathematics and knowledge
of Mathematics teaching was low. Shulman (1986) could be said to be right with the
teachers’ possession of adequate subject content knowledge, pedagogical content knowledge
and curricular knowledge that will result in teachers’ effectiveness in the teaching of
Mathematics. The importance of pedagogical content knowledge (PCK) for Mathematics
teachers has been well documented (Ball, 2000; Langrall, Thornton, Jones, & Malone in
Turnuklu & Yesildere, 2007). Lampert (1990) and Marks (1990) also documented the
importance of enacting PCK for pre-service Mathematics teachers’ teaching practice. PCK
significance notwithstanding cannot be solely associated with effective teaching without the
contributions of SCK and curricular knowledge.
Apart from the different domains and categories of knowledge base which teachers exhibit
some other attributes, bring about either effectiveness or ineffectiveness in the teaching and
learning of Mathematics. Hestenes & Swackhamer (1995) concluded the findings of their
study with the remark that the effectiveness of physics instruction depends heavily on the
pedagogical expertise of the teacher. Opdenakker & Damme (2006) found that good class
management skills seemed to have a positive effect on the quality of the relationship between
teacher and class, and because of this, also (a small effect) on the learning climate in the
class. They also found that the lower the job satisfaction of the teacher is, the stronger the
relationship between the cognitive level of the class and the amount of instructional support a
class receives. Teachers with a high level of job satisfaction (who have the feeling that they
can mean a lot to their students and that they can make a difference in the learning of
students) are willing to invest a lot of energy and effort (instructional support) into their
classes across the ability range contrary to teachers with a low job satisfaction. Research on
effective teaching within the teacher ‘artistry’ tradition, stresses the importance of a good and
45
vital relationship between teacher and students (Harris, 1998). Research on teaching and
teacher education (within the tradition of teacher thinking) and research on teacher change
emphasize the importance of instructional-support, beliefs, thoughts-judgments, knowledge
and attitudes and theories of teachers for teaching practice (Clark & Peterson, 1986; Pajares,
1992 & Shuell, 1996). Teachers’ that are creative and innovative with varying teaching skills
if well catered for will be very effective in the Further Mathematics classroom.
2.8 Theoretical framework on PBL
2.8.1. Polya’s Model
Polya’s (1957) Problem Solving Model consists of four phases; understanding the problem,
devising a plan, carrying out the plan and looking back. According to Polya (1957), the
problem solver must understand the problem first, then move ahead to devise a workable
plan, proceed to carry out the plan and look back, which implies checking the solution and
solution process. The model is illustrated by the following examples:
A rectangular plaque is being engraved on expensive gold metal. Because of
its cost, only 400cm2 of material can be used. A border of 2cm at the top, at
the bottom and on the left side is required. On the right-hand side the border
is to be 4cm to allow for appropriate designs. What dimensions should be
chosen for the piece of gold metal to allow for the maximum rectangular area
for the engraved message?
(Adapted from Haigh, 1986:598)
The steps taken to solve this problem are described by using Polya’s techniques.
1. Understanding the problem
The description of the problem allows the construction of a model or diagram for
problem clarification. Symbolic models such as ‘w’ to represent the width and l to
represent the length. The borders at the top and bottom are each 2cm, the length of the
printed matter is l - 4 and the width of the printed message would be w - 6.
46
2. Devising a plan
(i) Formulate appropriate equations as indicated, equation (1) wl = 400 for area
of the entire gold sheet and equation (2) A = wl which implies (l – 4) (w – 6)
for area of the printed message
(ii) Replacing l by 400/w from equation (1) and equation (2) could be changed to
express A as a function of the variable w alone giving A = (400/w – 4) (w – 6)
(iii) Differentiating A with respect to w → dA/dw = 2400w-2 – 4 (say equation 3)
and equating the derivative to zero enables stationary points to be obtained.
We recognise from the discussion that w must be greater than 6 and l must be
greater than 4. From the relation, l = 400/w, we determine that when l = 4, w =
100, hence the value of w must be between 6 and 100. Substituting values of
the stationary points ‘w’, which is ±10√6 in equation (1) gives the values of l.
The positive value of w, which is equal to 10√6, is taken because the width
cannot be negative. The second derivative of equation (3) i.e. d2A/dw2 = -
4800/w3 but the sign of the second derivative at w = 10√6 is negative which is
the condition for maximum area. Hence, w = 10√6 maximises the area.
3. Carrying out the plan
(i) The different values of w could be used to compute the area.
A BASIC program that evaluates the area could be written for values of w
K-Knowledge, C- Comprehension, AP- Application, A- Analysis, S- Synthesis and E- Evaluation Along the cognitive levels of Bloom’s taxonomy
The descriptions of K, C, AP, A, S and E below follow from Simkin and Kuechler (2005).
Questions 5, 8, 9, and 10 fall into the Knowledge category - This deals with rote memory;
recognition without (necessarily having) the ability to apply learned knowledge, because
action verb ‘‘find’’ was used.
Questions 6 and 4 fall into the Comprehension category – This connotes information that
has been assimilated into students’ frame of reference, because action verb ‘‘express’’ was
used.
Questions 2 and 7 fall into the Application category – This deals with abstracts from learned
material to solve new (analogous) situations, because action verbs ‘‘solve and calculate’’
were used.
72
Question 3 falls into the Analysis category – This deals with decomposing learned material
into components and understanding the relationships between them, because action verb
‘‘simplify’’ was used.
Question 1 falls into the Evaluation category – This deals with making judgments about the
value or worth of learned information, because action verb ‘‘evaluate’’ was used. While the
items on the TMT as contained in the Table 3.2 were used in the piloting, significant changes
were effected in the arrangement of these items following the test construction theory that
emphasises the hierarchical nature of the Bloom cognitive taxonomy (Simkin & Kuechler,
2005) during the main study. Details about the re-organisation of the test items used for the
main study can be gleaned from the last paragraph of this section.
The request made by the researcher to the participating teachers to set questions for the TMT
is not new. Researchers (Notar, Zeulke, Wilson, & Yunker, 2004; Kadivar, Nejad, &
Emamzade, 2005) have used TMT in assessing students’ achievements and grade point
average (GPA). In general, teacher-made, or teacher-chosen, content-specific tests are
templates for awarding course grades resulting in the computation of GPA which is often
considered a standard of accountability (Notar, Zeulke, Wilson, & Yunker, 2004). Apart from
the fact that these teachers have been teaching and setting questions internally for students
taking FM, which made them knowledgeable in setting questions, both the State and Federal
Ministries of Education in Nigeria rely on experienced and practicing teachers in setting
examination questions for students in various school subjects including FM.
More so, external examination bodies like WAEC and National Examination Council
(NECO) at all times invite experienced and practicing graduate teachers to set questions on
all subjects, including FM, into their question banks. It is from such question banks that the
final selection of items for any particular examination is taken. In this study, the 60 items for
TMT went through various stages of validation (Kimberlin & Winterstein, 2008). Thus, the
harmonisation of the final items on the TMT resulted from a combination of experts’ advice
and recommendations as explained in (cf.3.5.2). The TMT was considered suitable for data
collection in the study because it addressed one of the aims of the study, which centred on
determining the effectiveness of PBL approach on students’ achievement in Further
Mathematics along the cognitive lower-level (Knowledge, Comprehension & Application) of
73
Bloom’s taxonomy. Apart from ease of construction by the teachers, the TMT was
considered advantageous in terms of efficiency thereby enabling the teachers to ask many
questions in a short period.
The TMT also allowed speedy assessment of what might be called foundational knowledge
as against the higher-order skills enacted in the RDT. The foundational knowledge refers to
the basic information and cognitive skills (comprehension and application) that students need
in order to do such high-level tasks as solved problems and create products (Stiggins, 1994).
One disadvantage of the TMT was that it reflected the lowest level of Bloom’s cognitive
taxonomy (verbatim knowledge) as a result, students focused on verbatim memorization
rather than on meaningful learning championed in the RDT. Another disadvantage of the
TMT was that one only got some indication of what students knew, the test exposed nothing
about what students could do with the knowledge. This shortcoming was among other factors
that led to the development of the RDT.
The suitability and relevancy of the RDT and TMT were checked in the piloting using two
public co-educational senior secondary schools in the local government area of the study. The
schools used in the piloting were distantly located from each other and also distantly located
from the main study schools in order to prevent any possible interaction between the students
of the pilot and main studies. In general, the purpose of piloting is to provide enough data to
support recommendations for change and inform on-going developments or next phases of
the work. Specifically in this study, the piloting was informed by the need to further validate
the instruments used for the main study, and more importantly to serve as try-out sessions for
the PBL. It was also carried out to test run the whole study with the consciousness of
identifying problem areas in the design to enable the researcher make necessary amendments
before the commencement of the main study. Results of the piloting showed that (i) there was
a significant difference in the post-test achievement score of the experimental and control
classes with respect to RDT and TMT in favour of the experimental class. The latter
suggested the efficacy of the PBL in improving students’ achievements in FM.
During the piloting, no attempt was made to reorganise the test items on the RDT and TMT
when administered as post-tests. This might have introduced a hallo-effect in the students’
scores on the post-tests (Pike, 1999). Reducing this effect and coupled with the hierarchical
74
nature of the Bloom’s cognitive taxonomy (Simkin & Kuechler, 2005) necessitated the
reorganisation of the test items on RDT and TMT when used in the main study. Thus, Tables
3.1 and 3.2 were not sacrosanct. For instance, in TMT, changes were effected in the
numbering of items 1, 2 and 3 to mean items 10, 8 and 9 respectively. While items 6 and 7
maintained their positions in Table 3.2 and items 4, 5, 8, 9 and 10 were renamed as items 5,
4, 3, 2 and 1 respectively. In the case of the RDT, items 1 and 4 maintained their positions
whereas items 2 and 3 were swapped.
3.5.3 Students’ Beliefs about Further Mathematics Questionnaire (SBFMQ)
The Students’ Beliefs about Further Mathematics Questionnaire consisted of 28 Likert-type
items, anchored on Strongly Agree, Agree, Disagree or Strongly Disagree, to which the
students were asked to respond (See Appendix 4). The SBFMQ was purposely used in this
study as pre- and post- test in both the experimental and control classes. It was developed by
modifying the 18-items on beliefs about mathematics survey developed by Perry, Vistro-Yu,
Howard, Wong, & Fong (2002); and then adding ten other beliefs items constructed by the
researcher to make 28 items. The survey items by Perry et al. (2002) were modified by
replacing Mathematics with Further Mathematics and constructing 10 other beliefs items in
relation to the nature of Further Mathematics, its teaching and the theoretical underpinning of
the Further Mathematics curriculum (Harbour-Peters, 1990, 1991). The suitability of the
newly developed SBFMQ rested on the fact that it enabled the researcher to examine the
impact of PBL approach on students’ beliefs about Further Mathematics. This was one of the
aims of the study. One advantage of the SBFMQ was that it provided an overview of
commonly espoused students’ beliefs since it was based on statements summarizing modern
approaches to Further Mathematics learning and teaching.
As done with the RDT and TMT, the SBFMQ was administered before and after the
intervention in the experimental and control classes in a piloting with the purpose earlier
identified for RDT and TMT (see section 3.5.1 & 3.5.2). Results showed that there was a
significant difference in the SBFMQ score after the intervention between the experimental
and control classes. The SBFMQ together with other research instruments (RDT & TMT) in
the study were considered adequate based on piloting results, which showed no ambiguities.
75
3.6 Procedure for data collection
The collection of data for the study started on 16/10/2008 and ended on 12/01/2009 thus
covering a period of three months. The breakdown of the activities during the period is
presented in Table 3.2 and the procedures taken in the administration of the SBFMQ, TMT,
and RDT as pre-tests and post-tests before and after treatment conditions in both the
experimental and control classes and the differences in the treatments of experimental and
control groups are described below.
Table 3.3: Field Work Activities Week Activities 1 Selection of schools; categorization of schools into experimental and
control groups; selection and sensitization of participating teachers 2 Administration of pre-test (TMT & RDT) in that order on both
experimental and control groups. The SBFMQ was administered before the intervention at both experimental and control groups
3, 4, 5, 6, 7, 8, 9
Implementation of the instructional lesson plans on Further Mathematics contents selected for the study: instructional lesson plan using PBL in the experimental group and instructional lesson plan based on Traditional Method in the control group. The topics considered include Indices and Logarithms, Algebraic Equations, Series and Sequences.
10 Administration of post-test (TMT & RDT) in that order on both experimental and control groups. The SBFMQ was administered after the intervention at both experimental and control groups.
Prior to the commencement of teaching in the third week of the study (28/10/2008) in the
experimental and control classes, students were pre-tested on the TMT, and RDT in that order
in the second week (21/10/2008) of the study. The essence of the pre-test was to ascertain the
background knowledge of the participants in both the experimental and control classes before
entering into the experiment/instruction period. The attention of the regular mathematics
graduate teacher in the control school was sought after the management of the school had
given approval for the study to be conducted in the school. The details of the study were
neither made known to him nor fully discussed with the school management as the study was
presented to the duo as if the exercise was meant for the school alone. This was to prevent
any form of bias and influence on the part of the teacher in the course of his teaching.
76
The participating teacher in the control school unlike his counterparts at the experimental
school was not trained on the PBL approach but the researcher paid unscheduled visits to the
control school during the school hours and this afforded the researcher the opportunity to
observe the teacher while teaching. However, no attempt was made to discuss the classroom
interaction pattern that prevailed between the teacher and the students in the classroom. The
regular teacher in the control group taught the students with the traditional method following
the already prepared instructional plan within the context of the contents selected for the
study. The teacher covered the topics related to the Indices and Logarithms, Algebraic
Equations, and Series and Sequences. The instructional lesson plan in the control school
differed only from that of the experimental school in the area of presentation. The
presentation in the control school followed the routine traditional activities against the
flowchart of problem solving process enacted in the experimental school. The traditional
mathematics instruction involved lessons with lecture and questioning methods to teach the
concepts related to indices and logarithms, algebraic equations, and series and sequences. The
students studied the approved mathematics textbooks on their own before the class hour. The
teacher structured the entire class as a unit, wrote notes on the chalkboard about definitions of
concepts related to indices and logarithms, algebraic equations and sequences and series. The
teacher worked examples on the chalkboard about indices and logarithms, algebraic equations
and sequences and series, and, after his explanation, students discussed the concepts and
examples with teacher-directed questions. For the majority of instructional time in the control
school, students received instruction and engaged in discussions stemming from the teacher’s
explanations and questions. Thus, teaching in the control school was largely teacher-
dominated and learning confined to the classroom. The classroom instruction in the control
class was two periods of 40 minutes each per week in the afternoon on Tuesdays and
Thursdays. The afternoon periods on these two days were uniform across the schools offering
FM in the local government area of the study. The regular teacher ended teaching in the
control class on 08-01-2009 while the post tests (TMT & RDT) and the SBFMQ were
administered on the control class after the intervention on 12-01-2009.
The researcher sought the consent of the management of the experimental school and an
approval was given to conduct the study in the school. The nature and purpose of the
research were then explained to the four teachers who showed willingness and readiness to
participate in the study. The highlight of the weekly activities that would be carried out and
77
the extent of their involvement were discussed with them. The teachers were given
comprehensive orientation on the principle behind the PBL as an instructional strategy and
content areas for the study discussed. They were free to ask questions and offer suggestions
on how best this modern approach could successfully be implemented in the school. The
teachers were given comprehensive orientation on the principle of PBL in other to expose
them to the nitty-gritty of the PBL so that they could adopt the strategy on their own if found
effective after the exit of the researcher. Because the PBL was a novel approach for
participating teachers in the experimental group, the researcher taught students in the
experimental group in order to ensure fidelity of treatment. The researcher acted as both a
teacher and a researcher in the experimental class based on the following reasons: Although
many teachers are aware of problem solving, few teachers understand the difference between
a traditional approach and problem-based approach. For those teachers who understand what
problem-based approach entails, the majority are neither sure of how to implement this
approach in their classrooms nor are they interested in even to try it (due to their own valid
reasons).
Prior to the actual implementations of the PBL in the experimental classroom, the researcher
in collaboration with the four participating mathematics graduate teachers grouped the 42
Further Mathematics students heterogeneously based on their performances at the JSS year 3
final examinations. The class was referred to by the researcher as Learners’ Community
Group (LCG) that consisted of six groups of seven students each. The sitting arrangement
was re-constituted in a semi circular form that made it possible for the researcher to walk
across the groups. The groups were coded as LCG A, B, C, R, P, and Q. The students were
asked to construct nametags that were used as a form of identification. The students coded
numbers were LCGA 01-07, LCGB 01-07, LCGC 01-07, LCGR 01-07, LCGP 01-07 and
LCGQ 01-07. The coded number for the students was used for ‘blind’ assessment.
The seats were arranged for all students in the experimental class to face the chalkboard. Files
were provided with working sheets. Shipboard, cello tape, markers of different colours and
exercise books were given to the participating teachers to note their remarks and
observations. Two periods of forty minutes each were allocated to the teaching of Further
Mathematics in a week. The periods were usually in the afternoon on Tuesdays and
Thursdays as dictated by the Zonal Ministry of Education in Ijebu Ode Local Government
78
Area. Thus, the researcher had no control on the placement of FM in the afternoon on the
school timetable. The rigidity of the timetable did not allow the researcher to create more
instructional time in the teaching of the contents in the experimental class and more
importantly, the school authority in compliance with the State Government’s directives did
not allow any extension of classroom activities beyond the closing time. This precluded any
intruder in the PBL classroom from creating an unusual atmosphere.
Four mathematics graduate teachers at the experimental school watched the researcher
leading discussions in the Further Mathematics classroom using PBL in a scaffolding manner
to suit the already prepared instructional lesson plan. The instructional plan consisted of
Introduction, Objectives, Content, Presentation, Evaluation and Conclusion. In the
experimental class, the PBL group process adopted consisted of five phases namely (i)
identify the problem (ii) make assumptions (iii) formulate a model (iv) use the model and (v)
evaluate the model. In the first contact period of the third week (28-10-2008) in the PBL
class, students were given orientation on the PBL and its associated problem-solving
processes. This was followed by a diagnostic test (a feature of PBL) on indices in which
students were to investigate the correctness of the given equations: (i) 22 x 33 = 66? (ii) (23)4 =
27; 64; 212; 163? (Pick the correct answers). Students were left to ruminate on the given tasks
individually and in groups following the identified problem-solving processes while the
teacher acted as a facilitator. One member each from the first three groups (LCG A, B & C)
was selected by the teacher to make presentations on the chalkboard while other members of
the learners’ community group critiqued the presentations and this triggered off dialogue in
the classroom. Thus, mixed feelings ensued among members of the learners’ community
group as some were in favour that the equality holds for the first equation, some were against
this stand and obtained 65 as the solution while others were indifferent. In reaching consensus
among the three opposing groups, the rsearcher interjected by calling the students attention to
simplify the value on the right hand side of the equation and see whether it corresponded to
the simplified value on the left hand side. This made the three opposing groups to retract
from their decisions and agreed that the equality did not hold and stemming from the
researcher’s questions, a member of the class stated that the law of indices could not be
applied to the given equation because the given numbers were not of the same base.
79
The entire class was in agreement with the final submission while another member of the
class gave a brisk overview of the laws of indices. In the second given equation, students
engaged in individual and group investigations of the task following the identified problem-
solving processes and the same procedure as described above took place in arriving at final
answers while the researcher acted as a facilitator. A similar procedure was adopted in
teaching topics related to the logarithms in the fourth week, algebraic equations in the fifth
and sixth weeks and sequences and series in the seventh, eighth and ninth weeks of the study.
In each of the topics taught students were given ill-structured tasks as homework that
demanded their visiting the libraries, and surfing the net in preparation for presentation in the
next contact period. An example of ill-structured task in algebraic equation is given:
The fish population in a certain lake rises and falls according to the formula: F=1000(30+17t
-t2). F is the number of fish at time t, where t is measured in years since Jan 1, 2002, when the
fish population was first estimated.
(a) On what day will the fish population again be the same as on Jan 1, 2002?
(b) By what date will all the fish in the lake have died?
(Stewart, Redllin, & Watson, 2006)
Another example of an ill-structured task on sequences and series is also given:
On graduation day, 1000 seniors line up outside the school. As they enter the school, they
pass the school lockers, aptly numbered 1 to 1000. The first student opens all of the lockers.
The second student closes every other locker beginning with the second locker. The third
student changes the status of every third locker beginning with every third one (if opened, the
student closes it, if closed, the student opens it). The fourth student changes the status of
every fourth locker, and so on. Which lockers remain open after all 1000 students entered the
school? (Dossey et al., 2002)
After each day’s work, the researcher met with the participating teachers and allowed them to
share their experiences. Their notebooks used for comments during the intervention periods
were collected and fully discussed with them. The treatment in the experimental class ended
on 08-01-2009 while the posttests (TMT, RDT) and the SBFMQ were administered on the
80
experimental class after the intervention on 12-01-2009. The post-tests were the modified
form of the pre-tests administered in the experimental class prior to the treatments in both the
control and experimental classes. The modification was carried out in the area of test-items
re-organisation in order to prevent hallo-effect that could result from familiarity of pre-and
post-test instruments.
3.7 Validity and reliability of research instruments
Validity is often defined as the extent to which an instrument measures what it purports to
measure. Validity requires that an instrument is reliable, but an instrument can be reliable
without being valid (Kimberlin & Winterstein, 2008). Validity is about relationships between
changes and differences in the seen and unseen. Reliability is about the consistency of that
relationship across situations when there has been little or no change (McKnight, C., Magid,
Murphy, & McKnight, M., 2000). Determination of the reliability of measures of SBFMQ,
TMT, and RDT was important because it allowed for generalization of the results obtained by
the measure, and without reliability, validity cannot be established (Nunnally & Bernstein,
Validity can vary depending on the purpose of a test, therefore various forms of validity exist
(Kimberlin & Winterstein, 2008). In this study, content validity was looked into as it was
found to be most appropriate for the RDT and TMT whereas, construct validity was found
suitable for the SBFMQ (Mulder, 1989). Content validity relates to how well the test
succeeds in covering the field with which the test is concerned (Kimberlin & Winterstein,
2008). Construct validity is a judgment based on the accumulation of evidence from
numerous studies using a specific measuring instrument (Kimberlin & Winterstein, 2008).
The content validity of the RDT and TMT and construct validity of the SBFMQ are
explained in the next section.
3.7.1 Content validity of the RDT and TMT
Two Mathematics educators in the tertiary institution subjected the questions to face and
content validity in terms of (i) language clarity to the target audience, (ii) relevance to the
aims of the study, and (iii) coverage of the topics chosen for the study. Consequently, the
initial 10 questions on the RDT were reduced to four (questions 2, 5, 6, 7, 8 & 10 were
81
eliminated). The four questions (1, 3, 4 & 9) were further subjected to scrutiny by the Joint
Promoter who made some amendments to question three and finally the four questions
constituting the RDT were approved by the Promoter.
Three Further Mathematics teachers at the two schools selected for the study were asked to
prepare 20 essay questions (in Further Mathematics) each based on the course content for the
study. The set of questions were then given to Mathematics graduate teachers in other schools
different from the sampled schools for their critique. Based on their advice seventeen of the
questions, which featured in the selection of one or more of the graduate teachers, were taken.
These were then given to two Mathematics educators in the tertiary institution following the
procedure described for RDT above. Their recommendations led to further pruning of the
questions to ten (questions 1, 2, 3, 6, 7, 9, 11, 14, 15, & 16) The 10 questions formed the
TMT. Combining two different tests (RDT and TMT) not only provides for crosschecks and
increased validity but also provides a way to methodologically triangulate (Taylor-Powell &
Steele, 1996). One way to increase the validity, strength, and interpretative potential of a
study, decrease investigator biases, and provide multiple perspectives is to use methods
involving triangulation (Denzin, 1970).
In particular, six investigators (One teacher in the control school, four teachers in the
experimental school and the researcher) handled the study, so that meant the use of
investigator triangulation. However, the study adopted the methodologic triangulation in the
area of students’ achievement in Further Mathematics. Two different tests (RDT and TMT)
were used to source data on achievement and these allowed the researcher to weigh the two
tests in an attempt to decrease the deficiencies and biases that could stem from any single
test. The presence of theoretical triangulation could be seen in the area of multiple research
questions set for the study and addressing the same phenomenon. In essence, research
questions i & iii, ii & iv were related and addressed the impact of PBL on students’
achievement in Further Mathematics. The benefits inherent in data sources triangulation with
particular attention to time triangulation were maximized in the study. Specifically, data were
collected on students’ achievements in FM and beliefs about FM before and after treatments.
The collection of data at different times was to determine if similar findings occurred
(Kimchi, Polivka, & Stevenson, 1991). The study also relied on data –analysis triangulation
in the area of selection of data for the validation of instruments. In particular, different
82
statistical techniques (Cronbach alpha, Factor analysis using Principal Components Analysis,
Discrimination Power and Difficulty Index) were used in validating data collected in the pilot
testing of instruments as well as in the study.
3.7.2 Construct validity of SBFMQ
The SBFMQ was used as a questionnaire and considered appropriate for this study because of
its ‘‘versatility, efficiency and generalisabilty’’ (McMillan, 2004). The versatility of a
questionnaire lies in its ability to address a wide range of problems or questions, especially
when the purpose is to describe the beliefs, attitudes and perspectives of the respondents. Its
limitation, according to Mertler & Charles (2005), is that it does not allow the researcher to
probe further as would be possible in an interview. In this study, the 18-item beliefs survey
developed by Perry et al (2002) was adapted. This survey had been widely used in previous
research in Australia (Perry, Way, Southwell, White, & Pattison, 2005; Perry, Howard, &
Tracey, 1999; Perry, Howard, & Conroy, 1996). Two mathematics educators in the tertiary
institution checked the adequacy, appropriateness and suitability of the survey items to the
Nigerian sample. The survey items were considered appropriate and suitable but inadequate.
This led to the construction of 10 other beliefs items in relation to the nature of Further
Mathematics, its teaching and the theoretical underpinning of the Further Mathematics
curriculum (Harbour-Peters, 1990, 1991). These items were also scrutinised by the two
mathematics educators and minor amendments were effected. Thereafter, the 28-item
constituting the SBFMQ was given to the Joint Promoter for comments who found the items
acceptable. Finally, the SBFMQ was approved by the Promoter with no amendment.
3.7.3 Reliability of RDT, TMT and SBFMQ
Reliability refers in general to the extent to which independent administration of the same
instrument (or highly similar instruments) consistently yields the same (or similar) results
under comparable conditions (De Vos, 2002). The RDT, TMT and SBFMQ were pilot tested
in a school different from the study schools but whose sample shared similar characteristics
(age, class level and exposure to the same curriculum) with the study schools. The results of
the students were used for item analysis. Both discrimination index and item difficulty were
calculated purposely for (i) evaluating the quality of the items and of the test as a whole and
(ii) revising and improving both items and the test as a whole (Gronlund & Linn, 1990;
83
Matlock-Hetzel, 1997; Pedhazur & Schemlkin, 1991). The discrimination index, D, is the
number of students in the upper group who answered the item correctly minus the number of
students in the lower group who answered the item correctly, divided by the total number of
students in the two groups. The higher the discrimination index, the better the item because
such a value indicates that the item discriminates in favour of the upper group, which should
get more items correct. As a rule of thumb, in terms of discrimination index, 0.40 and greater
are very good items, 0.30 to 0.39 are reasonably good but possibly subject to improvement,
0.20 to 0.29 are marginal items and need some revision, below 0.19 are considered poor
items and need major revision or should be eliminated (Ebel & Frisbie, 1986).
Item difficulty is simply the percentage of students taking the test who answered the item
correctly. The larger the percentage getting an item right, the easier the item. The higher the
difficulty index, the easier the item is understood to be. The lower the difficulty index, the
more difficult the item is understood to be. To compute the item difficulty, divide the number
of students answering the item correctly by the total number of students answering the item.
The proportion for the item is usually denoted as p and is called item difficulty (Crocker &
Algina, 1986). The implication of a p value is that the difficulty is a characteristic of both the
item and the sample taking the test. One motivation for item and test analysis in this study is
that an item's difficulty and index assisted the researcher in determining what was wrong with
individual items. Item and test analysis provided empirical data about how individual items
and whole tests performed in real test situations.
Each of the four questions in the RDT showed a discrimination index of more than 0.40 and
item difficulty of 0.40 – 0.60. This supports the views of Ebel (1979) about the
appropriateness of values. Cronbach alpha computed to determine the internal consistency
and reliability of the test was 0.87. Thus, the four questions constituting the RDT were
considered reliable and of moderate difficulty level. Each item on the RDT instrument
attracted a score of 25marks. This gave a total of 100marks. Hence, a maximum score that
could be obtained was 100marks.
The students’ pre-test scores on the RDT in the experimental school were further used for
item analysis. Cronbach alpha computed to determine the internal consistency and reliability
of the test was 0.85. Appendix 5 shows the difficulty and discrimination index for each item
84
on the RDT. In Appendix 5, the mean of item difficulty (0.54) agreed with the submission of
Brown (1996) and the ranges of item difficulty (from 0.25 to 0.86) and the discrimination
index (from 0.42 to 0.64) also concurred with Ebel (1979), for those 4 items as a whole
satisfied the criteria to serve as a complete set of a RDT.
For the TMT, each of the ten questions showed discrimination index of more than 0.40 and
item difficulty of 0.40-0.60 thus, similar to suggestions as noted by Ebel (1979). Cronbach
alpha was computed (using SPSS version 15) to determine the internal consistency and
reliability of the test and a value of 0.88 was obtained. The ten questions then constituted the
TMT. Each item on the TMT instrument attracted a score of 10 marks. This gave 100 marks.
Hence, a maximum score that could be obtained was 100marks. Items on the TMT, when
classified based on Bloom’s cognitive taxonomy covered five out of the six cognitive levels
namely knowledge, comprehension, application, analysis, and evaluation. As indicated in
Table 3.2, the items were more for the lower-order cognitive domain based on random
selection of items that eventually constituted the TMT. However, the scores of 40 students
on the TMT when administered as pre-test in the experimental school were further used for
item analysis. Cronbach alpha computed to determine the internal consistency and reliability
of the test was 0.86. Appendix 6 shows the item difficulty and discrimination index for the
TMT. Appendix 6 shows the mean of item difficulty as 0.61 and the ranges of item difficulty
from 0.25 to 0.88 and discrimination index from 0.44 to 0.67 which agreed with the views of
Ebel (1979), for those 10 items as a whole satisfied the criteria to serve as a complete set of a
TMT.
For the SBFMQ, Cronbach alpha computed showed a reliability coefficient of 0.86. In
addition, the SBFMQ before intervention scores of 40 students in the control school were
subjected to factor analysis using Principal Components Analysis with the factor loadings
shown in Appendix 5 based on an Oblimin three factor resolution. In running the factor
analysis, the researcher observed the following criteria for determining the number of factors.
First, consideration was given to the option of retaining those factors whose meaning was
comprehensible. Second, the Kaiser rule (Kaiser, 1960), which suggests five factors and
ascertains that all components with eigenvalues under 1.0 be dropped was observed. The
method is not recommended when used as the sole cut-off criterion for estimating the number
of factors as it tends to over extract factors (Gorsuch, 1983).
85
Third, the variance explained criterion was observed. This involves keeping enough factors to
account for 90% (sometimes 80%) of variation, and where the goal of parsimony is
emphasised the criterion could be as low as 50% (Ebel, 1979). Fourth, the Scree test, which
suggests two factors, was plotted. The Cattel Scree test plots the components as the X-axis
and the corresponding eigenvalues as the Y-axis. As one moves to the right, toward later
components, the eigenvalues drop (Cattel, 1966). When the drop ceases and the curve makes
an elbow toward less steep decline, Cattel's Scree test says to drop all further components
after the one starting the elbow (Gorsuch, 1983). This has been criticized for being amenable
to researcher-controlled fudging. That is, picking the elbow can be subjective (Kaiser, 1960).
In this study, a five- factor solution was initially obtained. This was considered not good
enough as one of the components had just two items. A four-factor solution was thus
computed but this was also jettisoned because one of the factors with only three items had
low internal consistency reliability (0.23). However, an examination of the Scree plot of
eigenvalues gave an indication suggestive of three-factor solution. The three-factor solution
was thus computed and this was found not only meaningful but had non-overlapping
interpretable structures. That is, items did not load on more than one structure.
There are two rotation methods in factor analysis namely orthogonal and oblique
(Bartholomew, Steele, Galbraith, & Moustaki, 2008). Varimax rotation is an orthogonal
rotation of the factor axes to maximize the variance of the squared loadings of a factor
(column) on all the variables (rows) in a factor matrix, which has the effect of differentiating
the original variables by extracted factor. A varimax solution yields results that make it easy
to identify each variable with a single factor and it is the most common rotation option. The
direct oblimin rotation is the standard method when one wishes a non-orthogonal (oblique
solution) - that is, one in which the factors are allowed to be correlated (Bartholomew, Steele,
Galbraith, & Moustaki, 2008). This resulted in higher eigenvalues but diminished
interpretability of the factors. However, the researcher wished a non-orthogonal solution and
so, adopted the direct oblimin rotation.
In Appendix 4, Factor 1 is composed of 15 items (5, 6, 7, 8, 12, 13, 15, 16, 18, 21, 22, 23, 24,
25, and 26) reflecting students’ cognitive beliefs about the teaching and learning of Further
Mathematics. Factor 2 contained seven items (1, 2, 4, 10, 17, 20 and 27) and reflected
students’ beliefs about the nature and importance of Further Mathematics. Factor 3 was made
86
up of six items (3, 9, 11, 14, 19 and 28) and showed students’ beliefs about aesthetic value
and teachers’ behaviour in Further Mathematics. The three interpretable factors accounted for
42% of the item variance. The three identified factors were clearly different and non-
overlapping. This indicated that it was possible for a student to hold both beliefs
simultaneously. Cronbach alpha computed to determine the internal consistency and
reliability of the SBFMQ was 0.7.
3.8 Data analysis and interpretation
The quantitative data collected using the TMT, RDT and SBFMQ were analysed using the
means and standard deviations, which are important precursor to conducting inferential
statistical analysis of the t-test. This study tested differences in students’ achievements in
TMT, RDT and students’ responses in SBFMQ before and after treatment conditions in both
the experimental and control classes and no attempt was made to test relationships. Thus, this
foreclosed the adoption of correlation statistic. The t-test statistic was adopted in the study
partly because two groups were involved and more importantly, the statistic is considered
more robust when comparing differences of two means. Analysis of variance (ANOVA) was
also considered appropriate in this study to test the null hypotheses and since it generalizes
the t-test value. Thus, a one-way ANOVA was adopted to corroborate results obtained using
the t-test and also to prove the relation F = t2.
Independent Samples t-test was used to analyse the pre-test and post- test performances of the
control and experimental groups for SBFMQ, TMT and RDT. An alpha level of 0.05 was
used for all statistical tests. Hill & Lewicki (2007) stated that the following assumptions
could be used when independent samples t-test is adopted:
• Each of the two samples being compared should follow a normal distribution which
can be tested using a normality test, such as the Shapiro-Wilk or Kolmogorov–
Smirnov test, or it can be assessed graphically using a normal quantile plot.
• If using student original definition of the t-test, the two populations being compared
should have the same variance (testable using F test, Levene's test, Bartlett's test, or
the Brown–Forsythe test; or assessable graphically using a Q-Q plot).
• The data used to carry out the test should be sampled independently from the two
populations being compared.
87
By the central limit theorem, means of samples from a population with finite variance
approach a normal distribution regardless of the distribution of the population (Hill &
Lewicki, 2007). Rules of thumb say that the sample means are normally distributed as long as
the sample size is at least 20 or 30 and for a t-test to be valid on a sample of smaller size, the
population distribution would have to be approximately normal (Hill & Lewicki, 2007). This
was a necessary condition in this study.
However, the analysis of the study data using Shapiro-Wilk test often considered more
efficient than the Kolmogorov-Smirnov test revealed that the quantitative data collected in
respect of the RDT, TMT and SBFMQ separately significantly deviated from a normal
distribution. This is because the significant value of the Shapiro-Wilk test for each of RDT,
TMT and SBFMQ was below 0.05. Moreover, literature suggests that the t-test is invalid for
small samples from non-normal distributions, but it is valid for large samples (N>30) from
non-normal distributions (Hill & Lewicki, 2007). Based on the latter, the study sample was
96 hence, the justification for the adoption of the t-test statistic.
3.9 Limitations of the study
The limitations in this study are as stated below:
• This study relied on the purposive sampling technique in choosing schools that
participated in the study. This was due to the few numbers of students taking
Further Mathematics consequent upon paucity of qualified graduate
mathematics teachers in the study area and generally in Nigeria. This non-
probability sampling is often criticised for being subjective to researcher’s
manipulation, thus making generalisation of findings impractical (Hill &
Lewicki, 2007). This is seen as a potential weakness of this study.
• The ability to address a wide range of problems or questions, especially when
the purpose is to describe the beliefs, attitudes and perspectives of the
respondents is one of the strengths of a questionnaire. It does not however,
allow the researcher to probe further as would have been possible in an
interview (Mertler & Charles, 2005).
88
CHAPTER FOUR
PRESENTATION OF RESULTS
4.1. Introduction
This chapter presents results obtained in the main study in order to answer the research
questions that guided this study. The raw data from the field for pre- and post- tests in both
the experimental and control classes were analysed and summarised using descriptive
statistics. Other relevant descriptive statistical tools such as the mean and standard deviation
obtained in the tests (TMT and RDT) and questionnaire (SBFMQ) were used in the study.
The latter statistical tools especially the mean was used because it is the best-known and most
commonly used measure of central location and its precise meaning is easily explained. More
so, the mean is in fact the centre of gravity of the observations. The observations in this study
were the raw scores associated with the TMT, RDT, and SBFMQ. The standard deviation
reflects the distances of all the individual student’s scores in TMT, RDT, and SBFMQ from
the mean. The greater the standard deviation is, the further on average, the scores lie from the
mean and vice-versa. The statistical tools assisted in comparing the performance of the
experimental (PBL) and control (TM) classes with the intention of deciding whether or not
the intervention improved students’ achievements in Further Mathematics. Samples of
students’ self-written work in both the experimental and control classes were used to support
claims made from means and standard deviations.
The analysis of students’ responses to the questionnaire enabled the researcher to deduce how
the intervention influenced students’ beliefs about Further Mathematics in general. An
independent t-test was used to determine whether the mean scores obtained by the two classes
were statistically significant thus confirming or rejecting the stated research hypotheses. The
adoption of both the independent samples t-test and Analysis of variance (ANOVA) were
hinged on verifying the consistency of conclusions made from any of the statistics. The t-test
statistic was adopted in this study partly because two groups were involved and more
importantly, the statistic is considered more robust when comparing differences of two means
(Hill & Lewicki, 2007). ANOVA was also considered appropriate in this study because it
provides a statistical test of whether or not the means of several groups are all equal, and
89
therefore generalizes the t-test to more than two groups (Hill & Lewicki, 2007). One-way
ANOVA was used to test the null hypotheses and test for differences in learning outcomes
(achievement in Further Mathematics and beliefs about Further Mathematics) between the
experimental and control classes. Since there were only two group means to compare, the t-
test and the ANOVA F-test must be equivalent; the relation between ANOVA and the t-test is
given by F = t2. An attempt was made to prove this relationship in the study with attention
given to the interpretations of p values generated from the statistical tests. The p value is a
probability, with a value ranging from zero to one, and all statistical tests in the study were
carried out using two-tailed p values. However, the summary of the results concludes the
chapter.
4.2. Results of Students in the TMT, RDT and SBFMQ before the Intervention
The pre-test was an instrument to measure the background knowledge of the participants
before the intervention. In the present study the pre-test was manipulated at two levels: TMT
and RDT. The essence of the pre-tests was to ascertain the prior or background knowledge of
the students in the Further Mathematics topics selected for the study (cf. 3.5.1 & 3.5.2) in
both the control and experimental classes before the intervention. A pre-treatment
questionnaire, SBFMQ (cf. 3.5.3) gave a preview of students’ already acquired beliefs about
Further Mathematics. In this section attempt is made to discuss the TMT pre-test, RDT pre-
test, and SBFMQ pre-treatment questionnaire results of students in the control and
experimental groups.
4.2.1. Results of Students in the TMT before the Intervention
The TMT pre-test consisted of 10 constructed-response items (See Appendix 3a). Each of
the 10 items attracted a maximum score of 10 (since the items were of moderate difficulty cf.
3.9.3) and a total score obtainable by any of the students was 100%. The TMT pre-test raw
scores for the control and experimental classes were analysed, summarised, and interpreted
using the means and standard deviations.
Table 4.1 below shows the results of statistical analysis of theTMT pre-test scores in both the
experimental and control classes with no attempt to compare the means since the
participating schools were of comparable characteristics. The mean of the pre-test
achievement on the TMT for the experimental class was M=30.90 while that of the control
90
class was M=33.50. However, the standard deviation of the pre-test achievement on the TMT
for the experimental class was S.D =14.07 while the standard deviation of the control class
was S.D=9.59
Table 4.1 Results of statistical analysis of the pre-test scores on TMT Experimental class Control class Total score 100 100 Mean (M) 30.90 33.50
Standard deviation (SD) 14.07 9.59 Number of students 42 54
Samples of students’ self-written work in the TMT pre-test in both the experimental and
control classes were used to support claims made from means and standard deviations.
4.2.1.1 Analysis of students’ detailed workings on the TMT pre-test
The results from the analyses of marks were corroborated with the students’ written
responses in order to assess the knowledge and skills that students had before learning the
concepts of the topic (cf.3.5.2) covered in the study. Typical examples of students’
performance in TMT pre-test in both the control and experimental classes using the students’
written work are presented below for question one.
Question one required students to evaluate 3.375-1⅓
48 and 32 students in the control and experimental classes respectively were challenged by
the question. They could not answer the question correctly simply due to inability to correctly
apply the required solution strategies in the solving of problems that bothered on the law of
indices and logarithms. These students failed to express correctly the given decimal number
as a fraction and knowledge of factors and multiples were missing thereby committing
procedural errors as shown in a student written script below (Figure 4.1a). 10 students from
the experimental class were able to make sense of the question displaying correct solution
strategies in solving problems relating to the laws of indices and logarithms. Excerpts of the
students’ self-written responses are given below:
91
Figure 4.1a. Script of control group student for question one on pre-test TMT
This script shows a student could evaluate a given power that has a decimal as a base and a
negative fraction as an exponent.The student attempted to convert a decimal into an ordinary
fraction by dividing by 1000 then went back to the original form. Surprisingly, the student
put two-thirds as the answer without showing any workings. The student might have gotten
the correct answer using scientific calculator or spied the answer from another student. A
close juxtaposition of the original question with the one written on the script (as in Fig 4.1a)
revealed that the student miscopied the question and thus committed an error of omission (the
index -⅓ was written instead of -1⅓).
Figure 4.1b. Script of experimental group student for question one on pre-test TMT
The experimental student copied the question correctly but failed in line two in the attempt to
transform the mixed fraction index (-1⅓) to an improper fraction index (-4/3). Instead of -
4/3, the student wrote 4/3 as seen in Figure 4.1b above. This set the stage for the application
92
of the laws of indices, which the student correctly carried out in line 3 (the student thus
recovered the missing sign in line 2). In the final stage, the student jumped into an incorrect
answer. However, it could be deduced from the students’ sampled scripts regarding the
topics on Indices and Logarithms is that there were students in both the experimental and
control classes who struggled with the evaluation of powers that have a decimal as a base and
a negative fraction as an index/exponent and hence they committed procedural errors in the
TMT pre-test. Overall, the students’ performance in both the experimental and control classes
in the remaining topics selected for the study was not encouraging due to their inability to
implement correct solution strategies in answering questions relating to algebraic equations,
series and sequences.
Having done with the qualitative analysis of students’ written scripts, the stage was set for
quantitative analysis of the TMT pre-test achievement scores of students in both the
experimental and control classes leaning on the results of the means and standard deviations.
The means and standard deviations are measures of central tendency and in fact important
precursors to conducting inferential statistical analysis of the t-test, which is the most robust
statistic when dealing with significance difference of two group means. In the sequel, the t-
test was used to determine whether or not there was a significant difference between the TMT
pre-test mean scores of students exposed to the PBL and those exposed to the TM.
Table 4.2a. Means, standard deviations, and t-test value for Experimental and Control classes on pre-test TMT N M SD t p Experimental 42 30.90 14.07 1.07 .286 Control 54 33.50 9.59
Based on the means and standard deviations from Section 4.2.1, which were reproduced
above in Table 4.2a, one notices that the mean of the experimental class was lower while its
standard deviation was higher than that of the control class. The mean difference of 2.60
between the control and experimental classes in the pre-test TMT was however not
significant (t=1.07, p=.286) as indicated by the t-test results in Table 4.2a. As observed in the
table above, the two-tail p value was 0.286 meaning that random sampling from identical
populations would lead to a difference smaller than was observed in 71.4% of experiments
and larger than was observed in 28.6% of experiments. Thus, based on the t-test analysis,
93
there was no statistically significant difference in the pre-test TMT achievement scores of
students in the experimental and control classes. This implies that the two classes were
comparable in terms of their existing knowledge of indices, logarithms, algebraic equations,
series and sequences which formed the topics for the study.
Furthermore, ANOVA was used to assess whether testing the significance difference in the
TMT pre-test between the experimental and control classes along the variance could give the
same outcome as obtained in the t-test thus, assessing the consistency and validity of the
testing. The analysis of pre-test TMT achievement scores of students in both the
experimental and control classes using one-way ANOVA as contained in Table 4.2b below
showed that differences in means between the two classes was not significant (F(1,95) = 1.151;
p = .286).
Table 4.2b. One-way ANOVA on pre-test TMT achievement scores of students in the Experimental and Control classes Sumof
squares Df Mean
Square F Sig.
Between groups
159.121 1 159.121 1.151 .286
Within groups
12995.119 94 138.246
Total 13154.240 95
Since the ANOVA generalises the t-test to more than two groups, it is apparent that the
relation F = t2 (cf.4.1) must hold when t = 1.07. However, the p value of 0.286 recorded on
the ANOVA table above tallied with the p value obtained in the t-test. Thus, there was no
statistically significant difference in the pre-test TMT achievement scores between students
exposed to the PBL and those exposed to the TM. As revealed by the relation F = t2 when t =
1.07, it is concluded that using the two inferential statistic of the t-test and one-way ANOVA
yielded the same result thus verifying the consistency and validity of using any of the
statistic.
4.2.2. Results of Students in the RDT before the Intervention
The RDT consisted of four constructed response items (See Appendix 3a). Maximum score
of each question was 2½ thus giving a total score of 10. The RDT raw scores for both the
94
control and experimental classes were analysed, summarised, and interpreted using the means
and standard deviations. Table 4.3 below shows the results of the statistical analysis of the
RDT scores in both the experimental and control classes. The mean of the pre-test
achievement on the RDT for the experimental class was M=1.05 with S.D = 0.75 while that
of the control class was M=1.06 with S.D=0.72 and this meant qualitatively that the
performance of students in both classes were almost at par. The lean difference in mean
scores between the experimental and control classes in the pre-test achievement on the RDT
reinforced our initial position on the comparability of the two classes. Thus, both classes
possessed equal prior knowledge on the Further Mathematics topics earmarked for the study.
Table 4.3 Results of statistical analysis of the pre-test scores on the RDT Experimental class Control class Total score 10 10 Mean (M) 1.05 1.06
Standard deviation (SD) 0.75 0.72 Number of students 42 54
Nevertheless, an attempt was made to analyse samples of the students’ self-written work in
the pre-test on the RDT in both the experimental and control classes.
4.2.2.1. Analysis of students’ detailed workings on the pre-test RDT
The students’ written responses were analysed in order to assess the knowledge and skills that
students had before learning the concepts of the topics (cf. 3.5.2) covered in this study.
Typical examples of the students’ performance in the pre-test RDT in both the control and
experimental classes using the students’ written work are displayed below for question three.
Question three stated that Some Biologists model the number of species ‘S’ in a fixed area
A (such as an island) by the Species-Area relationship: log S = logC + klogA, where c and k
are positive constants that depend on the type of species and habitat.
(a) Simplify the equation for S
(b) Use part (a) to show that if k =3, then doubling the area increases the number of
species eightfold.
95
This question proved difficult to students in the control and experimental classes. In the
control class, 46 students failed to translate the problem statement into algebraic structure
thereby committing a procedural error and the eight students that were able to perform this
feat could not solve the question to a logical conclusion as indicated in a sample of student
written script below (Figure 4.2a). In this script (Figure 4.2a), the student correctly wrote the
question and successfully applied the third law of logarithms in the second line. The student
went further in the third and fourth lines to apply the first law of logarithms and successfully
removed the logarithm from both sides of the equation. While success was recorded in part
(a) of the question, the student showed some level of precision in the interpretation of part
(b) using part (a) result but could not successfully prove the relationship due to inability to
simplify (2A)3 thus, committed a conceptual error.
Figure 4.2a. Script of control group student for question three on pre-test RDT
In the experimental class, 38 students like their counterparts in the control class could not
solve the question to a logical conclusion because they failed in their attempt to interpret the
problem structure and thus inhibited them from translating the word problem context into an
algebraic structure. This is a sign of deficiency in tackling open-ended problems. However,
four students that were able to translate the problem statement into an algebraic structure
committed conceptual errors in terms of inability to apply the principle of index notation as
depicted in a typical student written script below (Figure 4.2b). Although the details in the
working that led to the relationship: S = CAK in the first part of the question was suppressed,
the student could not successfully interprete the second part of the question.
96
Figure 4.2b. Script of experimental group student for question three on pre-test RDT
However, it could be deduced from the students’ scripts that, the student in the control class
displayed deficiency in the knowledge of the concept of indices and logarithms. Thus, none
of these students was able to completely answer question three on the pre-test RDT (see
Appendix 2a).
More so, students in both the experimental and control classes showed deficiency in their
knowledge of the concept of series and sequences and algebraic equations as depicted in
questions two and three respectively (see Appendix 2a). The qualitative analysis of the
students’ written scripts, thus set the stage for quantitative analysis of the pre-test RDT
achievement scores of students in both the experimental and control classes.
The independent samples t-test was used to determine whether or not there was a significant
difference between the pre-test RDT mean scores of students in the PBL and TM classes
before the intervention. In line with the means and standard deviations from section 4.2.2,
which are reproduced below in Table 4.4a, one notices that the mean of the experimental
class was slightly lower while its standard deviation was slightly higher than that of the
control class. The mean difference of 0.01 between the control and experimental classes pre-
test RDT was however not significant (t=0.05, p=.958) as indicated by the independent
samples t-test results in Table 4.4a below. As indicated in the table below, the two-tailed p
97
value was 0.958 meaning that random sampling from identical populations would lead to a
difference smaller than was observed in 4.2% of experiments and larger than was observed in
95.8% of experiments. Thus, there was no significant difference in the pre-test RDT
achievement scores of students in the experimental and control classes. This implies that the
students in the two classes not only had comparable existing knowledge of evaluation of
logarithms but also seemed to display equivalent prior knowledge of algebraic equations,
series and sequences.
Table 4.4a. Means, standard deviations, and t-test value for Experimental and Control classes on pre-test RDT Group N M SD t p Experimental 42 1.05 0.75 .05
.958
Control 54 1.06 0.72
Further analysis of the pre-test (RDT) achievement scores of students in both the
experimental and control classes using one-way ANOVA as contained in Table 4.4b below
showed that the difference in the means between the two classes was not significant (F(1,95) =
0.003; p = .958).
Table 4.4b. One-way ANOVA on pre-test RDT achievement scores of students in the Experimental and Control classes Source Sum of
squares Df Mean
Square F Sig.
Between groups
.001 1 .001 .003 .958
Within groups
50.238 94 .534
Total 50.240 95
Since the ANOVA generalises the t-test to more than two groups, it is apparent that the
relation F = t2 (cf.4.1) must hold when t = 0.05. However, the p value of 0.958 recorded on
the ANOVA table above tallied with the p value obtained in the t-test. This is an indication
that there was no significant difference between the pre-test RDT achievement scores of
students in the PBL and TM classes before the intervention. With reference to the relation F =
t2 when t = 0.05, it is concluded that the two statistical tests employed produced consistent
results thus affirming the validity of the result traceable to any of the statistics.
98
4.2.3. Pre-treatment Questionnaire
The pre-treatment questionnaire on beliefs tagged SBFMQ consisted of 28 statements
anchored on a four-point Likert scale of strongly agree, agree, disagree, and strongly disagree
to which students were asked to respond (See Appendix 4 and cf. 3.5.3). The SBFMQ
defined in Chapter two (cf. 2.3) of this study gave a three-factor solution determined from
factor analysis using principal components analysis with an oblique rotation. The choice of
the four-point Likert scale as against to the five-point was hinged on the fact that having a
neutral point (in this case undecided) attracts respondents who actually slightly lean toward a
favourable or unfavourable response. Bearing in mind that the reason for neutral is not to
coerce respondents on the available choices for those who don’t want any of strongly agree,
agree, disagree, and strongly disagree will choose undecided, nevertheless, three reasons
could be adduced for not using a neutral point in this study. First, analyses on questionnaire
(SBFMQ) are averaged or summed across items. Having four response options or five will
not matter when one takes the average. Second, responses on the SBFMQ are not terribly
valuable by themselves. One needs to compare the scores to something meaningful. Third, in
general the effects of usable or unusable applications tend to outweigh the much smaller
effects of scale points, labels, scale directions, neutral responses and poorly written
questions.
The SBFMQ has no zero point and maximum score obtainable in the Likert scale was four
while the least score that could be obtained by a student on any one item of the questionnaire
was one. The SBFMQ scores for both the control and experimental classes were analysed,
summarised, and interpreted using the means and standard deviations. Table 4.5 below shows
the results of statistical analysis of SBFMQ pre-treatment scores according to themes
determined from factor analysis using principal components analysis based on an oblimin
three-factor resolution (cf. 3.9.3) in both the experimental and control classes. In theme one
that centred on cognitive beliefs about the teaching and learning of Further Mathematics, the
control class students recorded a higher mean score (M = 3.13) but lower standard deviation
(S.D = 0.95) when compared with the experimental class students’ mean score (M = 2.85)
and standard deviation (S.D = 0.98). Similarly, in theme two which summarised the beliefs
about the nature and importance of Further Mathematics, students in the control class
recorded a higher mean score (M = 2.20) and standard deviation (S.D = 1.11) than the
students’ mean score (M =1.98) and standard deviation (S.D = 1.01) in the experimental
class. This trend was also recorded with theme three that centred on beliefs about aesthetic
value and teachers’ behaviour in Further Mathematics. The mean score (M = 2.84) and
standard deviation (S.D =1.06) of the control class were higher than the mean score (M =
2.49) and standard deviation (S.D = 1.04) of the experimental class. The grand-overall mean
of the pre-treatment score on the SBFMQ for the experimental class (M=2.56) was lower
than the mean of the control class (M=2.83). However, the two classes were almost holding
similar beliefs about Further Mathematics prior to the intervention but this needed further
investigation. The high standard deviation (S.D =.45) recorded by students in the
experimental class showed that students’ scores in the experimental class were spread away
from the mean while the low standard deviation (S.D=.37) recorded by the control class
students on the SBFMQ showed that their scores clustered around the mean.
Table 4.5 Mean, Standard Deviation and Rank of the pre-treatment SBFMQ scores Control class (n = 54) Experimental class
(n = 42) Beliefs Statements Mean
( ) SD Rank Mean
( ) SD Rank
Theme 1: cognitive beliefs about the teaching and learning of Further Mathematics 5: Right answers are much more important in Further Mathematics than the ways in which you get them
3.72 .71 3 2.95 1.17 8
6: Further Mathematics knowledge is the result of the learner interpreting and organizing the information gained from experiences
2.67 1.10 13 3.57 .77 2
7: Being able to build on other students’ ideas makes extensions of FM real
1.70 1.04 15 2.00 .94 13.5
8: Students are rational decision makers capable of determining for themselves what is right and wrong
2.96 1.10 10 2.90 1.08 10
12: Students should be allowed to use any method known to them in solving FM problems
2.98 1.12 9 2.93 1.05 9
13: Young students are capable of much higher levels of mathematical thought than has been suggested traditionally
3.04 1.08 8 2.62 1.08 11
15: Being able to memorize facts is critical in Further Mathematics learning
2.80 1.23 12 2.00 1.33 13.5
16: Further Mathematics learning is enhanced by activities which build upon
2.94 1.11 11 2.50 1.13 12
100
and respect students’ experiences 18: Teachers should provide instructional activities which result in problematic situations for learners
2.41 .96 14 1.71 .97 15
21: The role of the Further Mathematics teacher is to transmit mathematical knowledge and to verify that learners have received this knowledge
3.48 .89 6 3.02 1.09 7
22: Teachers should recognize that what seem like errors and confusions from an adult point of view are students’ expressions of their current understanding
3.57 .88 5 3.14 .84 5.5
23: Teachers should negotiate social norms with the students in order to develop a cooperative learning environment in which students can construct their knowledge
3.63 .81 4 3.14 .81 5.5
24: Further Mathematics concepts enable students to interpret and solve applied problems
3.74 .76 2 3.31 .90 3
25: Further Mathematics is a product of the invention of human mind
3.83 .61 1 3.74 .63 1
26: Further Mathematics is abstract 3.41 .88 7 3.24 .88 4 Sub-overall 3.13 .95 2.85 .98 Theme 2: Beliefs about the nature and importance of Further Mathematics 1: Further Mathematics is computation 1.44 .98 7 1.67 .98 6 2: Further Mathematics problems given to students should be quickly solvable in a few steps
1.87 1.26 5 2.07 1.11 3
4: Further Mathematics is a beautiful, creative and useful human endeavour that is both a way of knowing and a way of thinking
2.04 1.05 4 1.71 .89 5
10: Periods of uncertainty, conflict, confusion, surprise are a significant part of the Further Mathematics learning process
1.76 1.05 6 1.62 .85 7
17: Further Mathematics learning is enhanced by challenges within a supportive environment
2.13 1.28 3 1.88 1.04 4
20: Teachers or the textbook – not the student – are authorities for what is right or wrong
3.35 .91 1 2.64 1.12 1
27: Further Mathematics is the bedrock of Science and Technology
2.83 1.23 2 2.29 1.11 2
Sub-overall 2.20 1.11 1.98 1.01
101
Theme 3: Beliefs about aesthetic value and teachers’ behaviour in Further Mathematics 3: Further Mathematics is the dynamic searching for order and pattern in the learner’s environment
1.89 1.09 6 1.67 .87 6
9: Further Mathematics learning is being able to get the right answers quickly
3.50 .93 1 2.74 1.17 3
11: Further Mathematics teachers make learning more meaningful to students when problems are taken from real-life context
3.09 .94 2 3.10 .85 1
14: Teachers’ should not rebuke students’ for not answering questions correctly
2.67 1.06 5 2.88 1.09 2
19: Teachers should encourage students to ask why they have to learn some FM topics
3.02 1.28 3 2.45 1.04 4
28: Teachers’ should encourage students to formulate solution procedures by themselves in trying to solve real-world problems
Further analysis to determining whether or not there was a significant difference between the
pre-treatment SBFMQ mean scores of students in the PBL and TM classes, led to the
adoption of independent samples t-test. The mean difference of 0.17 between the control and
experimental classes in the pre-treatment questionnaire was significant (t=2.13, p=.036) as
indicated by the independent samples t-test results in Table 4.6a below
Table 4.6a. Means, standard deviations, and t-test value for Experimental and Control classes on pre-treatment SBFMQ scores Group N M SD t p Experimental 42 2.57 .45 2.13* .036 Control 54 2.74 0.37 *significant at p<.05 level
In corroborating the result of the t-test and making conclusion transparent, one-way ANOVA
was used. Further analysis of pre-treatment SBFMQ scores of the students in both the
experimental and control classes using one-way ANOVA as contained in Table 4.6b below
revealed that the difference in means between the two classes was significant (F(1,95) = 4.55; p
= .036).
102
Table 4.6b. One-way ANOVA on pre-treatment SBFMQ scores of students in the Experimental and Control classes Source Sum of
squares Df Mean
Square F Sig.
Between groups
.752 1 .752 4.55 .036
Within groups
15.541 94 .165
Total 16.293 95
Since the ANOVA generalises the t-test to more than two groups, it is apparent that the
relation F = t2 (cf.4.1) must hold when t = 2.13. However, the p value of 0.036 recorded on
the ANOVA table above tallied with the p value obtained in the t-test. Hence, there was a
statistically significant difference between the pre-treatment SBFMQ scores of students in the
PBL and TM classes. Based on the consistent result given by the two statistical tests
employed, it is affirmed that there was a significant difference between the pre-treatment
SBFMQ scores of students in the PBL and TM classes. This goes to show that students came
to class with different beliefs.
4.3. Results of Students in the TMT, RDT and SBFMQ after the Intervention
The post-test was an instrument used to ascertain the knowledge level of the participants after
the intervention and was manipulated at two levels: TMT and RDT. The TMT and RDT used
in this section were not different from the ones used as pre-test but that the items of the TMT
and RDT were re-arranged in order to prevent halo-effect which could result from
familiarisation of the tests (cf.3.5.1 & 3.5.2). The post-test was considered useful in the
present study as it served as an instrument for gauging the performance of students in both
the control and experimental classes in the selected Further Mathematics topics after the
intervention. A post-treatment questionnaire, SBFMQ (cf.3.5.3) gave an overview of
students’ acquired beliefs about Further Mathematics after the intervention. In particular,
administering the SBFMQ after the intervention served to assess whether the students’ beliefs
in both the control and experimental classes changed after the course of instruction in the
study. In this section an attempt was made to discuss the post-test at its two levels: TMT,
103
RDT and the post-treatment questionnaire, SBFMQ of students in the control and
experimental classes and their associated research questions.
4.3.1. Results of Students in the TMT after the Intervention
The TMT post-test like the TMT pre-test consisted of 10 constructed response items (See
Appendix 3b). The maximum score for each question on the post-test TMT was 10 thus
giving a total score of 100. The TMT post-test scores from the field for both the control and
experimental classes were analysed, summarised, and interpreted using the means and
standard deviations. Table 4.7 below shows the results of the statistical analysis of post-test
TMT scores in both the experimental and control classes. The mean of the post-test
achievement on the TMT for the experimental class (M=43.79) was higher than the mean of
the control class (M=34.96). This connotes that students in the experimental class exposed to
the PBL recorded better performance on the post-test TMT than did the students in the
control class taught using the traditional method. This is in line with the submission that the
PBL might have improved the performance of the experimental students. The standard
deviation of the post-test achievement on the TMT for the experimental class (S.D =14.46)
was higher than the standard deviation of the control class (S.D=9.62). This is an indication
that students scores in the experimental class did not cluster around the mean even though
their overall performance has improved better than their counterparts in the control group
(also see section 4.3.1.1).
Table 4.7 Results of statistical analysis of post-test scores on TMT Experimental class Control class Total score 100 100 Mean (M) 43.79 34.96
Standard deviation (SD) 14.46 9.62 Number of students 42 54
The mean marks obtained by the students in the post-test TMT in the experimental and
control classes, showed that the marks obtained by the students in the experimental class
were better than the marks obtained by students in the control class. Evidently, the mean gain
(12.89) in the experimental class on the post-test TMT was far above the mean gain (1.46)
recorded in the control class. Nevertheless, an attempt was made to analyse samples of the
104
students’ self-written work in the post-test on the TMT in both the experimental and control
classes.
4.3.1.1. Analysis of students’ detailed workings on the post-test TMT
The students’ written responses were analysed in order to assess the knowledge and skills that
students gained after learning the concepts of the topics covered in this study with either the
PBL or TM. Typical examples of students’ performance in the post-test TMT in both the
control and experimental classes using students’ written work are displayed below for
question four.
Question four required students to Express y in terms of x if ½log2(y+3) = 2x
In the control class, 45 students failed to apply the relevant laws of logarithms and change of
base in solving the question as depicted in a typical student written script Figure 4.3a below.
This showed that the control students learnt little even after they had been exposed to the
traditional instruction in Further Mathematics by their regular teacher. More so, 40 students
of the control group found it difficult to transform the logarithm problem into indicial
equation and finally making y the subject of the formula (literal equation). As shown in the
script below, the student showed low understanding of the concepts of the number, base, and
the power. Instead of raising (y+3) to the power of ½, the student raised base 2 to power ½
thus, committed a procedural error.
Figure 4.3a. Script of control group student for question four on post-test TMT
In the experimental class, 10 students were able to solve the given problem (question four) as
indicated in the specimen of a student’s written script shown in Figure 4.3b below. Others
found it very difficult to tackle the given problem like their counterparts in the control class
after they had been exposed to the PBL. As shown in the sampled script below, the student
105
displayed a high level of mastery of the concepts of indices, indicial equations and logarithms
after being exposed to instruction in the PBL, in that the student got the maximum marks
without committing any error either procedural or conceptual. The demonstration of prowess
in solving questions on indices, logarithms, algebraic equations, series and sequences by 10
students in the experimental class was not surprising in that the PBL as a learner-centred,
minds-on, problem-centred strategy has been linked to sharpening students’ problem-solving
abilities, as well as their abilities to reason, communicate, connect ideas, and shift among
representations of mathematical concepts and ideas (Van der Walle, 2007). In general, the
students’ performance in the PBL class after intervention was better in comparison with the
performance of the students in the control class.
Figure 4.3b. Script of experimental group student for question four on post-test TMT
4.3.2. Results of Students in the RDT after the Intervention
The post-test RDT like the pre-test RDT consisted of four constructed response items (See
Appendix 3b). The maximum score for each question on the post-test RDT was 2½ thus
giving a total score of 10. The post-test RDT scores for both the control and experimental
classes were analysed, summarised, and interpreted using the means and standard deviations.
Table 4.8 below shows the results of the statistical analysis of post-test RDT scores in both
the experimental and control classes. The post-test RDT achievement mean score for the
experimental class (M=2.43) was higher than the mean score of the control class (M=1.34).
This is an indication that students in the experimental class when compared with their
counterparts in the control class performed better after the intervention in the post-test RDT.
106
The standard deviation of the post-test RDT achievement for the experimental class (S.D
=1.07) was also higher than the standard deviation of the control class (S.D=0.72).
In the post-experimental class only eight students obtained raw scores well above the mean
marks of 2.43 while the remaining 34 students obtained raw scores below the mean marks.
In the post-control class, 35 students obtained raw scores well above the mean marks of 1.34
while the remaining 19 students obtained raw scores well below the mean marks. Hence, less
than 20% of the students in the experimental class obtained raw scores well above their class
mean mark while more than 60% of the students in the control class recorded raw scores well
above their class mean mark.
Table 4.8 Results of statistical analysis of post-test scores on RDT Experimental class Control class Total score 10 10 Mean (M) 2.43 1.34
Standard deviation (SD) 1.07 0.72 Number of students 42 54
A comparison of the mean marks obtained by the students in the post-test RDT in the
experimental and control classes, showed that the marks obtained by the students in the
experimental class were higher than the marks obtained by students in the control class but
this needs further investigation. The mean gain (1.38) in the experimental class was above the
mean gain (0.28) recorded in the control class. The performance of the experimental students
in both the pre- and post-RDT showed that less than 40% and 20% of the students
respectively recorded raw scores above the mean marks in the pre- and post-tests. Similarly,
less than 40% and more than 60% of the control students obtained raw scores above the
mean marks in both the pre- and post-RDT respectively. Yet, an attempt was made to analyse
samples of the students’ self-written work in the post-test on the RDT in both the
experimental and control classes.
4.3.2.1. Analysis of students’ detailed workings on the post-test RDT
Results from the analyses of marks were supported with the students’ written responses in
order to assess the knowledge and skills that students gained after learning the concepts of the
topics covered in this study with either the PBL or TM. Typical examples of the students’
107
performance in the post-test RDT in both the control and experimental classes using the
students’ written work are displayed below for question one.
Question one stated that: Some Biologists model the number of species ‘S’ in a fixed area
A (such as an island) by the Species-Area relationship: log S = logC + klogA, where c and k
are positive constants that depend on the type of species and habitat.
(a) Simplify the equation for S
(b) Use part (a) to show that if k =3, then doubling the area increases the number of
species eightfold.
The total score for this question was 2½ in each of the control and experimental classes. In
the control class, 35 (65 %) of the students were able to transform the word problem context
in the given question to a mathematical representation as shown in the first part of the typical
specimen of a student’s written script in Figure 4.4a below. Although these students
demonstrated prowess in transforming the word problem context into a mathematical
representation coupled with correct application of laws of logarithms after being taught with
the traditional method, however, none of the students earned the maximum marks earmarked
for this question simply because they failed in their attempt to substitute correctly the given
values as seen in a student written script below (Fig. 4.4a).
Figure 4.4a. Script of control group student for question one on post-test RDT
In the experimental class, eight students got the maximum marks allocated to this question as
illustrated by a specimen of a student’s written script in Figure 4.4b below. This is not too
encouraging but judging by the advantages inherent in the use of PBL in classrooms. In PBL,
108
learning Further Mathematics is woven around problems in either teacher-led whole-group
activities or small-group work to sharpening students’ problem-solving skills as against the
tradition that views learning Further Mathematics as a solitary activity. However, 34 students
in the PBL class were unable to solve the question completely due to errors committed in the
area of substitution in the latter part of the question.
Figure 4.4b. Script of experimental group student for question one on post-test RDT
One major observable comparison discerned from the students’ scripts in Figure 4.4a and
Figure 4.4b above was that the student in the experimental class was able to not only
transform the word problem context into a mathematical representation but was able to avoid
errors in the area of substitution in the latter part of question one in the post-test RDT after
being treated with the PBL and thus got the maximum mark. This is against the student in the
control class who though transformed the word problem context into a mathematical
representation was unable to substitute correctly in the latter part of the question after being
exposed to the traditional method hence could not get the maximum possible mark of 2½.
4.3.3. Post-treatment questionnaire
The post-treatment questionnaire of SBFMQ like the pre-treatment questionnaire consisted of
28 statements anchored on a four-point Likert scale of strongly agree, agree, disagree, and
strongly disagree to which students were asked to respond (see Appendix 4 and cf. 3.5.3).
The post-treatment SBFMQ scores for both the control and experimental classes were
analysed, summarised, and interpreted using the means and standard deviations. Table 4.9
109
below shows the results of statistical analysis of post-treatment scores on the SBFMQ
according to the themes determined from factor analysis using principal components analysis
based on an oblimin three-factor resolution (cf. 3.9.3) in both the experimental and control
classes. In theme one, the experimental class pooled a higher mean score (M = 3.64) and a
lower standard deviation (S.D = 0.58) than the mean score (M = 3.46) and standard deviation
(S.D = 0.82) recorded by the control class, a trend visible also in theme two. The mean score
(M = 3.40) recorded by the experimental class in theme two was higher than the mean score
(M = 2.00) obtained by the control class. Similarly, the standard deviation (S.D = 0.80)
recorded by the experimental class in theme two was lower than the standard deviation (S.D
= 1.18) recorded by the control class.
With respect to theme three, the control class obtained a mean score (M = 2.87) lower than
the mean score (M = 3.38) recorded by the experimental class. In addition, the standard
deviation (S.D = 0.82) obtained in theme three by the experimental class was lower than the
standard deviation (S.D = 1.15) recorded by the control class. Concisely, the lower standard
deviation recorded in each of the three themes by the experimental class showed that the
scores obtained by the students in each theme clustered around the mean. The higher
standard deviation obtained in each of the three themes by the control class was an indication
that students in this class obtained scores in each theme that were spread away from the
mean. Overall, the post-treatment SBFMQ mean score for the experimental class (M=3.44)
was higher than the mean score of the control class (M=2.89), an indication that the
experimental students had stronger beliefs about Further Mathematics when compared with
their counterparts in the control class after intervention. The standard deviation of the post-
treatment SBFMQ scores for the experimental class (S.D =.36) was lower than the standard
deviation of the control class (S.D=.48), an attestation that scores obtained by students in the
experimental class clustered around the mean while scores obtained by the control class were
spread away from the mean.
Table 4.9 Results of statistical analysis of post-treatment scores on SBFMQ Control class (n = 54) Experimental class
(n = 42)
110
Beliefs Statements Mean ( )
SD Rank Mean ( )
SD Rank
Theme 1: Cognitive beliefs about the teaching and learning of Further Mathematics 5: Right answers are much more important in Further Mathematics than the ways in which you get them
3.80 .63 2 3.45 .74 9.5
6: Further Mathematics knowledge is the result of the learner interpreting and organizing the information gained from experiences
2.85 1.17 13 3.48 .83 8
7: Being able to build on other students’ ideas make extensions of FM real
1.83 1.04 15 2.90 .98 15
8: Students are rational decision makers capable of determining for themselves what is right and wrong
3.17 1.11 8 3.76 .43 2.5
12: Students should be allowed to use any method known to them in solving FM problems
3.07 1.06 10.5 3.52 .83 7
13: Young students are capable of much higher levels of mathematical thought than has been suggested traditionally
3.07 1.08 10.5 3.45 .80 9.5
15: Being able to memorize facts is critical in Further Mathematics learning
2.96 1.24 12 3.26 1.04 13
16: Further Mathematics learning is enhanced by activities which build upon and respect students’ experiences
3.15 1.05 9 3.40 .77 11
18: Teachers should provide instructional activities which result in problematic situations for learners
2.22 1.16 14 3.29 .77 12
21: The role of the Further Mathematics teacher is to transmit mathematical knowledge and to verify that learners have received this knowledge
3.48 .93 6 3.12 .97 14
22: Teachers should recognize that what seem like errors and confusions from an adult point of view are students’ expressions of their current understanding
3.56 .97 5 3.76 .58 2.5
23: Teachers should negotiate social norms with the students in order to develop a cooperative learning environment in which students can construct their knowledge
3.57 .92 4 3.74 .50 4
24: Further Mathematics concepts enable students to interpret and solve applied problems
3.59 .92 3 3.71 .51 5
25: Further Mathematics is a product of 3.89 .46 1 3.81 .46 1
111
the invention of human mind 26: Further Mathematics is abstract 3.46 .82 7 3.64 .58 6 Sub-overall 3.18 .97 3.49 .72 Theme 2: Beliefs about the nature and importance of Further Mathematics 1: Further Mathematics is computation 1.85 1.25 7 3.55 .83 2 2: Further Mathematics problems given to students should be quickly solvable in a few steps
2.33 1.30 4 3.67 .65 1
4: Further Mathematics is a beautiful, creative and useful human endeavour that is both a way of knowing and a way of thinking
2.43 1.28 3 3.43 .74 5
10: Periods of uncertainty, conflict, confusion, surprise are a significant part of the Further Mathematics learning process
2.13 1.20 6 3.50 .80 3.5
17: Further Mathematics learning is enhanced by challenge within a supportive environment
2.28 1.17 5 2.95 .91 7
20: Teachers or the textbook – not the student – are authorities for what is right or wrong
3.41 .98 1 3.19 .92 6
27: Further Mathematics is the bedrock of Science and Technology
2.89 1.09 2 3.50 .77 3.5
Sub-overall 2.00 1.18 3.40 .80 Theme 3: Beliefs about aesthetic value and teachers’ behaviour in Further Mathematics 3: Further Mathematics is the dynamic searching for order and pattern in the learner’s environment
2.30 1.30 6 3.36 .66 5
9: Further Mathematics learning is being able to get the right answers quickly
3.43 .94 1 3.38 .96 4
11: Further Mathematics teachers make learning more meaningful to students when problems are taken from real-life context
2.98 1.11 3 3.55 .74 2.5
14: Teachers’ should not rebuke students’ for not answering questions correctly
2.70 1.16 5 3.67 .79 1
19: Teachers should encourage students to ask why they have to learn some FM topics
3.06 1.14 2 2.79 1.05 6
28: Teachers’ should encourage students to formulate solution procedures by themselves in trying to solve real-world problems
The mean gain (.88) in the experimental class was above the mean gain (.06) recorded in the
control class. Further analysis to determining whether or not there was a significant
difference between the post-treatment SBFMQ mean scores of students exposed to the PBL
and those exposed to the TM, led to the adoption of an independent t-test statistic in the
study. In corroborating the result of the t-test and making conclusion transparent, one-way
ANOVA was used. However, the impact of the intervention analysed using the statistical
tools of t-test and one-way ANOVA on achievements in and beliefs about Further
Mathematics follow.
4.4 Impact of the intervention on achievements in and beliefs about Further
Mathematics
As earlier indicated in chapters one and three, the study investigated the impact of one
independent variable (instructional strategy) manipulated at two levels (PBL & TM) on the
dependent variables of achievements in Further Mathematics (measured by a post-test
manipulated at two levels: TMT & RDT) and beliefs about Further Mathematics (measured
by a post-treatment questionnaire of SBFMQ). In this section, attempts were made to assess
the veracity of the statements occasioned by the analysis of the post-test scores on TMT and
RDT and post-treatment score on SBFMQ of the students in both the experimental and
control classes. The descriptive statistics of mean and standard deviation as contained in the
preceding section of 4.3 on the post-test and post-treatment questionnaire were utilised. The
three important statements that emerged had connection with the three vital research
questions set for the study. Thus, a one-to-one mapping between the three statements and the
three research questions exists.
Statement One: The marks obtained in the post-test TMT by students in the experimental
class were higher than the marks obtained by students in the control class. This claim could
be justified by the higher mean mark 43.79 (cf. Table 4.7) recorded by the students in the
experimental class after being taught using the PBL. This statement linked the research
question one and research hypothesis one stated below in the study.
113
4.4.1a Research question one
Will there be any statistically significant difference between the post-test achievement on
TMT scores of students exposed to the PBL and those exposed to the TM?
The mean difference of 8.83 between the experimental and control classes after the
intervention was significant (t=-3.58, p=.001) as indicated by the independent samples t-test
results in Table 4.10a below. The significant result at a level of p<0.05 meant that there was a
less than 5% chance that the result was just due to randomness. The flip side of this was that
there was a 95% chance that the difference in post-test TMT scores between the experimental
and control classes was a real difference and not just due to chance. As observed in Table
4.10a below, the two-taiedl p value was 0.01 meaning that random sampling from identical
populations would lead to a difference smaller than was observed in 99% of experiments and
larger than what was observed in 1% of experiments. Thus, there was a significant difference
in the post-test achievement scores on TMT of students between the experimental and control
classes.
Table 4.10a. Means, standard deviations, and t-test value on post-test achievement score on TMT for Experimental and Control classes Group N M SD t p Experimental 42 43.79 14.46 -3.58* .001 Control 54 34.96 9.62 *significant at p<.05 level
4.4.1b Research hypothesis one
There is no statistically significant difference between the post-test achievement on TMT
scores of students exposed to the PBL and those exposed to the TM.
Further analysis of the post-test achievement scores on the TMT of students in both the
experimental and control classes using one-way ANOVA as contained in Table 4.10b below
showed that the difference in means between the two classes was significant (F(1,95) = 12.82;
p = .001).
Table 4.10b. One-way ANOVA on post-test achievement scores on TMT for Experimental and Control classes Source Sum of
squares Df Mean
Square F Sig.
114
Between groups
1838.992 1 1838.92 12.82 .001
Within groups
13482.997 94 143.436
Total 15321.990 95
Since the ANOVA generalises the t-test to more than two groups, it is apparent that the
relation F = t2 (cf.4.1) must hold when t = -3.58. However, the p value of 0.001 recorded on
the ANOVA table above tallied with the p value obtained in the t-test. Thus, research
hypothesis one was rejected. Hence, there was a statistically significant difference between
the post-test achievement scores on TMT of students exposed to the PBL and those exposed
to the TM.
Statement Two: The marks obtained in the post-test RDT by students in the experimental
class were better than the marks obtained by students in the control class. This claim could be
justified by the higher mean mark 2.43 (cf. Table 4.8) recorded by the students in the
experimental class after being taught using the PBL. This statement linked the research
question two and research hypothesis two stated below in the study.
4.4.2a. Research question two
Will there be any statistically significant difference between the post-test achievement scores
on RDT of students exposed to the PBL and those exposed to the TM?
The mean scores of 2.43 and 1.34 between the experimental and control classes after
treatment was significant (t=-5.92, p=0.000) as indicated by the independent samples t-test
results in Table 4.2. The significant result at a level of p<0.05 meant that there was a less
than 5% chance that the result was just due to randomness. The flip side of this was that there
was a 95% chance that the difference in post-test RDT scores between the experimental and
control classes was a real difference and not just due to chance. As observed in the table
below, the two-tailed p value was 0.000 meaning that random sampling from identical
populations would lead to a difference smaller than was observed in 100% of experiments
and larger than was observed in 0% of experiments. Thus, there was a significant difference
115
in the post-test achievement scores on RDT of students between the experimental and control
classes.
Table 4.11a. Means, standard deviations, and t-test value on post-test achievement score on RDT for Experimental and Control classes
Group N M SD t p Experimental 42 2.43 1.07 -5.92* .000 Control 54 1.34 0.72 *significant at p<.05 level
4.4.2b. Research hypothesis two
There is no statistically significant difference between the post-test achievement scores on
RDT of students exposed to the PBL and those exposed to the TM
Further analysis of post-test achievement scores on RDT of students in both the experimental
and control classes using one-way ANOVA as contained in Table 4.11b below showed that
difference in means between the two classes was significant (F(1,95) = 35.06; p = .000).
Table 4.11b. One-way ANOVA on post-test achievement scores on RDT for Experimental and Control classes Source Sum of
squares Df Mean
Square F Sig.
Between groups
27.862 1 27.862 35.062 .000
Within groups
74.698 94 .795
Total 102.560 95
Since the ANOVA generalises the t-test to more than two groups, it is apparent that the
relation F = t2 (cf.4.1) must hold when t = -5.92. However, the p value of 0.000 recorded on
the ANOVA table above tallied with the p value obtained in the t-test. Thus, research
hypothesis two was rejected. Hence, there was a statistically significant difference between
the post-test achievement scores on RDT of students exposed to the PBL and those exposed
to the TM.
116
Statement Three: The marks obtained in the post-treatment questionnaire of SBFMQ by
students in the experimental class were better than the scores obtained by the students in the
control class. This claim was justified by the higher mean score 3.44 (cf. Table 4.9) recorded
by the students in the experimental class after being taught using the PBL. This statement
linked the research question three and research hypothesis three stated below in this study.
4.4.3a. Research question three
Will there be any statistically significant difference between the post-treatment scores on
SBFMQ of students exposed to the PBL and those exposed to the TM?
The mean difference of 0.55 between the experimental and control classes after treatment was
significant (t=-6.22, p=.000) as indicated by the independent samples t-test results in Table
4.12a below. The significant result at a level of p<0.05 meant that there was a less than 5%
chance that the result was just due to randomness. The flip side of this was that there was a
95% chance that the difference in post-treatment score on SBFMQ between the experimental
and control classes was a real difference and not just due to chance. As observed in Table
4.12a below, the two-tailed p value was 0.000 meaning that random sampling from identical
populations would lead to a difference smaller than was observed in 100% of experiments
and larger than was observed in 0% of experiments. Thus, there was a significant difference
in the post-treatment scores on the SBFMQ of students between the experimental and control
classes.
Table 4.12a. Means, standard deviations, and t-test value on post-treatment score on SBFMQ for Experimental and Control classes N M SD t p Experimental 42 96.38 10.02 -6.22* .000 Control 54 80.89 13.50 *significant at p<.05 level
4.4.3b. Research hypothesis three
There is no statistically significant difference between the post-treatment scores on SBFMQ
of students exposed to the PBL and those exposed to the TM.
117
Further analysis of post-treatment scores on SBFMQ of students in both the experimental and
control classes using one-way ANOVA as contained in Table 4.12b below showed that
difference in means between the two classes was significant (F(1,95) = 38.49; p = .000).
Table 4.12b. One-way ANOVA on post-treatment score on SBFMQ for Experimental and Control classes Sum of
squares Df Mean
Square F Sig.
Between groups
7.204 1 7.204 38.49 .000
Within groups
17.595 94 .187
Total 24.800 95
Since the ANOVA generalises the t-test to more than two groups, it is apparent that the
relation F = t2 (cf.4.1) must hold when t = -6.20. However, the p value of 0.000 recorded on
the ANOVA table above tallied with the p value obtained in the t-test. Thus, research
hypothesis three was rejected. Hence, there was a statistically significant difference between
the post-treatment scores on SBFMQ of students exposed to the PBL and those exposed to
the TM.
4.5. Analysis of post-test TMT scores (Segregated into the Lower-order Cognitive
Domain of Bloom taxonomy)
The post-test TMT scores of students’ in both the experimental and control classes were
segregated into the lower-order cognitive domain of knowledge, comprehension, and
application of Bloom’ taxonomy. There were four items on the post-test TMT that measured
knowledge and two items each measured comprehension and application respectively. The
maximum score of each question was 10 thus giving a total score of 40 for knowledge, 20 for
comprehension, and 20 for application. In particular, the post-test TMT segregated into the
lower-order cognitive domain of Bloom’s taxonomy enabled the researcher to gauge the
performance of students in both the control and experimental classes after intervention in
each of the lower-order cognitive domain. The TMT post-test scores segregated into the
lower-order cognitive domain of knowledge, comprehension, and application for both the
control and experimental classes were analysed, summarised, and interpreted using the means
118
and standard deviations. In effect, attempts were made to discuss the analysis of each of the
three levels of lower-order cognitive domain one after the other.
4.5.1. TMT post-test scores in the knowledge domain of Bloom’s Taxonomy
Below are the results of the statistical analysis of the post-test TMT scores on the knowledge
domain in both the experimental and control classes as contained in Table 4.13. The post-test
TMT mean score for the experimental class in the knowledge domain (M=21.29) was higher
than the mean score of the control class (M=0.74), an indication that students in the
experimental class performed better on the post-test TMT items that bordered on knowledge.
Also, the standard deviation of the post-test TMT scores in the knowledge domain for the
experimental class (S.D =5.97) was higher than the standard deviation of the control class
(S.D=1.79). This seems to imply that even though the students’ performance improved after
being taught through the PBL as compared to their counterparts taught through the traditional
approach, their performance seemed to differ widely. In the post-experimental class 24
(57.1%) of the students obtained raw scores well above the mean mark of 21.29 in the
knowledge domain while the remaining 18 (42.9%) students obtained raw scores below the
mean mark in the knowledge domain. In the post-control class, only eight (14.8%) of the
students obtained raw scores well above the mean mark of 0.74 in the knowledge domain
while the remaining 46 (85.2%) students obtained raw scores well below the mean mark in
the knowledge domain. Hence, more than 50% of the students in the experimental class and
less than 20% of the students in the control class obtained raw scores well above their
respective mean marks.
Table 4.13 Results of statistical analysis on post-test scores on knowledge domain of TMT Experimental class Control class Total score 40 40 Mean (M) 21.29 0.74
Standard deviation (SD) 5.97 1.79 Number of students 42 54
Looking closely at the mean marks obtained by students in the post-test TMT knowledge
domain it seemed that the marks obtained by students in the experimental class were better
than the marks obtained by students in the control class.
119
4.5.2. TMT Post-test scores in the comprehension domain of Bloom’s Taxonomy
Below are the results of the statistical analysis of post-test scores on the TMT in the
comprehension domain in both the experimental and control classes as contained in Table
4.14. The post-test TMT mean score for the experimental class in the comprehension domain
(M=10.71) was slightly higher than the mean score of the control class (M=10.09). This
shows that the performance of students in both the experimental and control classes were
almost at par. Also, the standard deviation of the post-test TMT scores in the comprehension
domain for the experimental class (S.D =4.74) was lower (an indication that students’ marks
clustered around the mean mark) than the standard deviation of the control class (S.D=6.90)
(an attestation that students’ scores were dispersed away from the mean mark).
Table 4.14 Results of statistical analysis of post-test achievement scores on TMT in the comprehension domain Experimental class Control class Total score 20 20 Mean (M) 10.71 10.09
Standard deviation (SD) 5.97 6.90 Number of students 42 54
A close look at the mean marks obtained by the students in the post-test TMT comprehension
domain in both the experimental and control classes revealed that the marks obtained by
students in the control class were at par with the marks obtained by students in the
experimental class. In the post-experimental class 30 (71.4%) students obtained raw scores
well above the mean mark of 10.71 in the comprehension domain while the remaining 12
(28.2%) students obtained raw scores below the mean mark in the comprehension domain.
In the post-control class, 14 (25.9%) students obtained raw scores well above the mean mark
of 10.09 in the comprehension domain while the remaining 40 (74.1%) students obtained raw
scores well below the mean mark in the comprehension domain. Hence, more than 70% of
the students in the experimental class and less than 30% of the students in the control class
obtained raw scores well above their respective group mean marks.
120
4.5.3. TMT post-test scores in the application domain of Bloom’s Taxonomy
Below are the results of the statistical analysis of the post-test scores on the TMT in the
application domain of Bloom taxonomy in both the experimental and control classes as
contained in Table 4.15. The post-test TMT mean score for the experimental class in the
application domain (M=17.29) was higher than the mean score of the control class (M=7.13),
an indication that students in the experimental class did better on the application domain
items when compared with the students in the control class. Also, the standard deviation of
the post-test TMT scores in the application domain for the experimental class (S.D =4.07)
was lower than the standard deviation of the control class (S.D=4.51). This indicates that
students’ marks in the experimental class clustered around the mean mark as against the
marks obtained by the control students, which were dispersed from the mean mark.
Table 4.15 Results of statistical analysis of post-test scores on TMT in the application domain
Experimental class Control class
Total score 20 20 Mean (M) 17.29 7.13
Standard deviation (SD) 4.07 4.51 Number of students 42 54
As earlier indicated, the mean marks obtained by the students in the post-test TMT
application domain was required to correctly gauge the performance of a student in either the
experimental or control class in the application domain. However, it seemed that the marks
obtained by students in the experimental class were better than the marks obtained by
students in the control class. In the post-experimental class 24 (57.1%) of the students
obtained raw scores well above the mean mark of 17.29 in the application domain while the
remaining 18 (42.9%) students obtained raw scores below the mean mark in the application
domain. In the post-control class, 26 (48.1%) students obtained raw scores well above the
mean mark of 7.13 in the application domain while the remaining 28 (51.9%) of the students
obtained raw scores well below the mean mark in the application domain. Hence, more than
55% of the students in the experimental class and less than 50% of the students in the control
class obtained raw scores well above the respective mean marks.
121
4.6 Impact of the intervention on the lower-order cognitive domain of Bloom’s
Taxonomy in the TMT post-test
One of the aims of the present study and as already stated in chapter one was to investigate
the impact of one independent variable (instructional strategy) manipulated at two levels
(PBL & TM) on the dependent variable of achievement in Further Mathematics (measured by
post-test TMT) segregated into the three levels of Bloom’s lower-order cognitive domain
(knowledge, comprehension, and application). In this section, attempts were made to confirm
the veracity of the statements occasioned by the analysis of post-test TMT scores of students
segregated into knowledge, comprehension, and application domains in both the experimental
and control classes. The descriptive statistics of the mean and standard deviation as contained
in the preceding section of 4.5 on the post-test TMT segregated into the lower-order cognitive
domain were used. The three important statements that emerged and couched into a new
statement four had connection with the remaining one vital research question set for the
study.
Statement Four: The mark obtained in the post-test TMT segregated into knowledge,
comprehension, and application by students in the experimental class was better than the
mark obtained by students in the control class. This claim was justified by the higher mean
marks in the post-test TMT knowledge domain (cf. Table 4.13), post-test TMT
4.15) recorded by the students in the experimental class after being taught using the PBL.
This statement linked the research question four and research hypothesis four stated below in
this study.
4.6.1a Research question four
Will there be any statistically significant difference between the students’ achievement scores
in post-test TMT disaggregated into knowledge, comprehension and application levels of
cognition after being exposed to the PBL and the TM?
The mean difference of 20.55 in the knowledge domain between the experimental and control
classes after treatment was significant (t= -23.97, p=.000) as indicated by the independent
samples t-test results in Table 4.16a below. The significant result at a level of p<0.05 meant
that there was a less than 5% chance that the result was just due to randomness. The flip side
122
of this was that there was a 95% chance that the difference in the post-test TMT knowledge
domain score between the experimental and control classes was a real difference and not just
due to chance. As observed in Table 4.16a below, the two-tailed p value was 0.000 meaning
that random sampling from identical populations would lead to a difference smaller than was
observed in 100% of experiments and larger than was observed in 0% of experiments. Thus,
there was a significant difference in the post-test TMT score in the knowledge domain
between the experimental and control classes. The independent samples t-test statistic was
considered more appropriate based on its robustness in detecting significant differences
between the two group means as fully discussed in Chapter three.
Table 4.16a. Means, standard deviations, and t-test values for Experimental and Control groups on post-test TMT scores at the knowledge, comprehension and application levels of Bloom’ domain cognitive taxonomy Level of Cognition
There is no statistically significant difference between the students’ achievement scores in the
post-test TMT disaggregated into knowledge, comprehension and application levels of
cognition after being exposed to the PBL and the TM.
Further analysis of the post-test TMT scores of students segregated into knowledge,
comprehension, and application domains in both the experimental and control classes was
carried out using one-way ANOVA as contained in Table 4.16b below which showed that the
difference in means between the two classes in the knowledge domain was significant (F(1,95)
= 574.74; p = .000).
123
Table 4.16b. One-way ANOVA on post-test achievement scores on TMT of students in the Experimental and Control classes at the knowledge, comprehension and application levels of Bloom’s domain cognitive taxonomy Level of cognition
Sum of squares
Df Mean Square
F Sig.
Knowledge Between groups Within groups Total
9972.017 1630.942 11602.958
1 94 95
9972.017 17.350
574.74* .000
Comprehension Between groups Within groups Total
9.131 3445.108 3454.240
1 94 95
9.131 36.650
.250 .619
Application Between groups Within groups Total
2436.826 1760.664 4197.490
1 94 95
2436.826 18.730
130.10* .000
*significant at p<.05 level
Since the ANOVA generalises the t-test to more than two groups, it is apparent that the
relationship F = t2 (cf.4.1) must hold when t = -23.97. However, the p value of 0.000 recorded
on the ANOVA table above tallied with the p value obtained in the t-test. Hence, there was a
statistically significant difference between the post-test TMT achievement scores in the
knowledge domain of students exposed to the PBL and those exposed to the TM.
The mean score 10.71 and 10.09 in the comprehension domain between the experimental and
control classes after treatment was however not significant (t= -0.5, p=.619) as indicated by
the independent samples t-test results in Table 4.16a above. Further analysis of the post-test
TMT scores of students in the comprehension domain in both the experimental and control
classes was carried out using one-way ANOVA as contained in Table 4.16b above which
showed that differences in means between the two classes in the comprehension domain was
not significant (F(1,95) = .250; p = .619). Since the ANOVA generalises the t-test to more than
two groups, it is apparent that the relationship F = t2 (cf.4.1) must hold when t = -.50.
However, the p value of 0.619 recorded on the ANOVA table above tallied with the p value
obtained in the t-test. Hence, there was no statistically significant difference between the
post-test TMT achievement scores in the comprehension domain of students exposed to the
PBL and those exposed to the TM.
The mean difference of 10.16 in the application domain between the experimental and control
classes after treatment was significant (t= -11.41, p=.000) as indicated by the independent
samples t-test results in Table 4.16a above. The significant result at a level of p<0.05 meant
that there was a less than 5% chance that the result was just due to randomness. The flip side
of this was that there was a 95% chance that the difference in the post-test TMT application
124
domain score between the experimental and control classes was a real difference and not just
due to chance. As observed in Table 4.16b above, the two-tailed p value was 0.000 meaning
that random sampling from identical populations would lead to a difference smaller than was
observed in 100% of experiments and larger than was observed in 0% of experiments. Thus,
there was a significant difference in the post-test TMT application domain scores of students
between the experimental and control classes.
Further analysis of the post-test TMT scores of students in the application domain in both the
experimental and control classes was carried out using one-way ANOVA as contained in
Table 4.16b above which showed that the difference in means between the two classes in the
application domain was significant (F(1,95) = 130.10; p = .000). Since the ANOVA generalises
the t-test to more than two groups, it is apparent that the relationship F = t2 (cf.4.1) must hold
when t = -11.41. However, the p value of 0.000 recorded on the ANOVA table above tallied
with the p value obtained in the t-test. Hence, there was a statistically significant difference in
the post-test achievement scores on theTMT in the application domain between students
exposed to the PBL and those exposed to the TM.
4.7. Summary of the chapter
In this chapter, the data collected from the field were analysed using both the descriptive
(means and standard deviations) and inferential (independent samples t-tests and one-way
ANOVA) statistics. The results of the study were logically presented starting from the results
of students in the TMT and RDT before and after the intervention, pre- and post-treatment of
SBFMQ questionnaire to the impact of the treatment on students’ achievements in and beliefs
about Further Mathematics. In essence, the highlights of the results are stated below:
• There was a significant difference in the post-test achievement scores on the TMT
between students exposed to the PBL and those exposed to the TM.
• There was a significant difference in the post-test achievement scores on the RDT
between students exposed to the PBL and those exposed to the TM.
• There was a significant difference in the post-treatment scores on the SBFMQ
between students exposed to the PBL and those exposed to the TM.
125
• There was a significant difference in the post-test achievement scores on the TMT at
knowledge and application but not at comprehension levels of cognition of Bloom’
taxonomy between students exposed to the PBL and the TM.
126
CHAPTER FIVE
SUMMARY OF THE STUDY, DISCUSSION, CONCLUSION AND
RECOMMENDATIONS
5.1 Introduction
The summary of major findings of the study is given in this Chapter. Based on this,
suggestions and recommendations are made. The chapter concludes with suggestions for
future research in problem-based learning.
5.2 Summary of the study
This study was set out to investigate the influence of the PBL approach on students’ (i)
achievements in Further Mathematics, (ii) beliefs about Further Mathematics, and (iii)
achievement in Further Mathematics along the lower-order cognitive level of Bloom’s
taxonomy (cf. 1.5). In particular the study investigated the effectiveness of PBL in the
Further Mathematics classrooms in Nigeria within the blueprint of pre-test-post-test non-
equivalent control group quasi-experimental design. The target population consisted of all
Further Mathematics students in the Senior Secondary School year one in Ijebu division of
Ogun State, Nigeria. Using purposive and simple random sampling techniques, two schools
were selected from eight schools that were taking Further Mathematics. One school was
randomly assigned as the experimental while the other as the control school. Intact classes
were used and in all, 96 students participated in the study (42 in the experimental group
taught by the researcher with the PBL and 54 in the control group taught by the regular
further mathematics teacher using the Traditional Method (TM)).
Four research questions and four research hypotheses were raised, answered and tested in the
study. Four research instruments namely pre-test manipulated at two levels: Researcher-
Designed Test (RDT) (r = 0.87) and Teacher- Made Test (TMT) (r = 0.88); post-test
manipulated at two levels: RDT and TMT; pre-treatment survey of Students Beliefs about
Further Mathematics Questionnaire (SBFMQ) (r = 0.86); and post-treatment survey of
SBFMQ were developed for the study. The study lasted thirteen weeks (three weeks for pilot
127
study and ten weeks for the main study) and data collected were analysed using Mean,
Standard deviation, Independent Samples t-test statistic, and Analysis of Variance.
Results showed that there were statistically significant differences in the mean post-test
achievement scores on the TMT (t=-3.58, p<0.05), mean post-test achievement scores on
RDT (t=-5.92, p<0.05) and mean post-treatment scores on SBFMQ (t=-6.22, p<0.05)
between students exposed to the PBL and those exposed to the TM. Results also revealed
that there was statistically significant difference in the post-test achievement scores on the
TMT at knowledge (t= -23.97, p<0.05) and application (t= -11.41, p<0.05) but not at
comprehension (t= -0.50, p>0.05, ns) levels of Bloom’s taxonomy cognition domain between
students exposed to the PBL and the TM.
5.3 Discussion of results
Results pertaining to the four research questions were fully discussed and previous
results/findings used to corroborate the present study results.
5.3.1a Research question one
Will there be any statistically significant difference in the post-test achievement on the TMT
scores between students exposed to the PBL and those exposed to the TM?
5.3.1b Research hypothesis one
There is no statistically significant difference in the post-test achievement on TMT scores
between students exposed to the PBL and those exposed to the TM.
At the outset, consideration was given to the selection of two schools with comparable
characteristics in terms of achievement in FM, age, language, etc. so that the two groups that
emerged from these schools would enter the instruction/experiment on relatively comparable
strength. This was to ensure that if any observable significant difference was seen in the mean
post-test scores of the two groups on the TMT then such difference would not be attributed to
chance but the effect of the intervention. This set the stage for the discussion of results in
respect of the above research question one and research hypothesis one analysed in Chapter
four of the present study.
128
It was found that the mean post-test scores on the TMT of the students in the experimental
(PBL) group was statistically significantly different at p< 0.05 from that of the students in the
control (TM) group in favour of the PBL group. This finding showed that students who were
exposed to the PBL performed better in Further Mathematics thereby corroborating the views
of PBL proponents that the strategy is effective in enhancing students’ achievement and self-
Van den Heuvel-Panhuizen, M. (2000). Mathematics education in the Netherlands: A guided
tour. Freudenthal Institute Cd-rom for ICME9. Utrecht: Utrecht University.
Vernon, D. T. A., & Blake, R. L. (1993). Does problem-based learning work? A meta-
analysis of evaluative research. Academic Medicine, 68(7), 550-563.
162
Von Glasersfeld, E. (1990). An exposition of constructivism: Why some like it radical, in
R.B. Davis, C. A., Maher and N. Noddings (Eds), Constructivism views on teaching
and learning Mathematics 19-29, National Council of Teachers of Mathematics:
Reston, V A.
Vygotsky, L. S. (1978). Mind in society. Cambridge, MA: Harvard University Press.
WAEC (2008-20012). The West African Examination Council: Regulations and Syllabuses
for WASSCE, 234-247 WAEC Press, Lagos..
W.A.E.C. (2007). Chief Examiners Report (2007) Senior School Certificate Examination.
Lagos.
Ward, G (2007). Constructing an effective mathematics environment for ESL students
METSMac-1, 34-52 Third Annual Conference for Middle East Teachers of Science,
Mathematics and Computing March 17- 19, 2007, Abu-Dhabi.
West Africa Examination Council (WAEC) (2011). Result Analysis, Test Development
Department, Lagos.
West, S. A. (1992). Problem-based learning – A viable addition for secondary school science.
School Science Review, 73, 47-55.
Wheijen, C. (2005). Impact of Constructivist Teaching on Student Believes About Teaching
and Learning in Introductory Physics. Canadian Journal of Science, Mathematics and
Technology Education, 5(1) 95 – 109.
Whitcomb, J.; Borko, H. & Liston, D.( 2008) Why Teach?, Journal of Teacher Education
59:1, 3-9
Wigley. A. 1992 Models for teaching mathematics. Mathematics Teaching 141: 4–7
Williams, D., Pedersen, S. & Liu, M. 1998 An evaluation of the use of PBL software by
Middle School students. Journal for Universal Computer Science (Special Issue),
4(4), 466-483.
163
Wimmer, R. D. & Dominic, J. (2000) Mass media Research: An introduction. 6th Edition
Wadsworth Publishing Company.
Wood, T., Cobb, P., & Yackel, E. (1990). The contextual nature of teaching: Mathematics
and reading instruction in one second grade classroom. The Elementary School
Journal, 90(5), 495-513
Wood, T. Cobb, P.; Yackel, E. (1995). Reflections on learning and teaching mathematics in
elementary school. In: Steffe, L.P.; Gale, J. (eds) Constructivism in education 401-
422 Hillsdale, NJ, Lawrence Erlbaum Associates.
164
APPENDICES Appendix 1
Demographic section of the Questionnaire
Name of School…………………………. Class……………………… Code…………………………… ITEMS AGE GENDER LANGUAGE PARENTAL’S
INCOME 11-14 years 15-18years 19-22years Male Female Yoruba Igbo Hausa N11,130 Minimum wage
N11,130- N50,000 Above N50,000
Appendix 2a
Researcher Designed Test (RDT)- Pre-test
1 Some Biologists model the number of species ‘S’ in a fixed area A (such as an island)
by the Species-Area relationship log S = logC + klogA, where c and k are positive
constants that depend on the type of species and habitat.
(c) Simplify the equation for S
(d) Use part (a) to show that if k =3, then doubling the area increases the number of
species eightfold.
2 Suppose you are offered a job that lasts one month, and you are to be very well paid.
Explain the method of payment that will be more profitable for you based on :
(a) One million dollars at the end of the month
165
(b) Two cents on the first day of the month, 4 cents on the second day, 8 cents on
the third and, in general, 2n cents on the nth day.
3 A large pond is stocked with fish. The fish population P is modeled by the formula, P
= 3t + 10√t + 140, where t is the number of days since the fish were first introduced
into the pond. Evaluate the number of days it will take the fish population to reach
500.
4 Make up several pairs of polynomials, and then calculate the sum and product of each
pair. Based on your experiments and observations, answer the following questions:
(a) Evaluate why the degree of the product is related to the degrees of the original
polynomials?
(b) Justify why the degree of the sum is related to the degrees of the original
polynomials?
Appendix 2b
Researcher Designed Test (RDT) -Post-Test
1 Some Biologists model the number of species ‘S’ in a fixed area A (such as an island)
by the Species-Area relationship log S = logC + klogA, where c and k are positive
constants that depend on the type of species and habitat.
(a) Simplify the equation for S
(b) Use part (a) to show that if k =3, then doubling the area increases the number of
species eightfold.
2 A large pond is stocked with fish. The fish population P is modeled by the formula,
P = 3t + 10√t + 140, where t is the number of days since the fish were first introduced
into the pond. Evaluate the number of days it will take the fish population to reach
500.
3 Suppose you are offered a job that lasts one month, and you are to be very well paid.
166
Explain the method of payment that will be more profitable for you based on :
(a) One million dollars at the end of the month
(b) Two cents on the first day of the month, 4 cents on the second day, 8 cents on
the third and, in general, 2n cents on the nth day.
4 Make up several pairs of polynomials, and then calculate the sum and product of each
pair. Based on your experiments and observations, answer the following questions:
(a) Evaluate why the degree of the product is related to the degrees of the original
polynomials?
(b) Justify why the degree of the sum is related to the degrees of the original
polynomials?
Appendix 3a
Teacher Made Test (TMT)- Pre-Test
1. Evaluate 3.375-1⅓
2. Solve for x if (i) 125(3x-2) = 1, (ii) 52x+1 – 26(5x) + 5 = 0
3. Simplify ½log48 + log432 – log42
4. Express y in terms of x if ½log2(y+3) = 2x
5. If log102 = 0.3010, log103 = 0.4771, log105 = 0.6990, find (i) log 72 (ii) log 0.6
6. Express √32 + 6/√2 as a single surd
7. Calculate the number of terms in the A.P.:¼, ½,……,7½
8. Find (i) the common difference and (ii) the sum of the first 20 terms of the A.P.: log a,
log a2, log a3,……
9. If k+1, 2k-1, 3k+1 are three consecutive terms of a G.P., find the possible values of
the common ratio.
10. The third term and the seventh term of a G.P. are 18 and 35/9 respectively; find the
sum of the first 7 terms.
167
Appendix 3b
Teacher Made Test (TMT)- Post-Test
1. The third term and the seventh term of a G.P. are 18 and 35/9 respectively; find the
sum of the first 7 terms.
2. If k+1, 2k-1, 3k+1 are three consecutive terms of a G.P., find the possible values of
the common ratio.
3. Find (i) the common difference and (ii) the sum of the first 20 terms of the A.P.: log a,
log a2, log a3,……
4. If log102 = 0.3010, log103 = 0.4771, log105 = 0.6990, find (i) log 72 (ii) log 0.6
5. Express y in terms of x if ½log2(y+3) = 2x
6. Express √32 + 6/√2 as a single surd
7. Calculate the number of terms in the A.P.:¼, ½,……,7½
8. Solve for x if (i) 125(3x-2) = 1, (ii) 52x+1 – 26(5x) + 5 = 0
9. Simplify ½log48 + log432 – log42
10. Evaluate 3.375-1⅓
168
Appendix 4
Students’ Beliefs about Further Mathematics Questionnaire (SBFMQ) Item No
Beliefs Statements SD D A SA
1 Further Mathematics is computation 2 Further Mathematics problems given to students should be
quickly solvable in a few steps
3 Further Mathematics is the dynamic searching for order and pattern in the learner’s environment
4 Further Mathematics is a beautiful, creative and useful human endeavour that is both a way of knowing and a way of thinking
5 Right answers are much more important in Further Mathematics than the ways in which you get them
6 Further Mathematics knowledge is the result of the learner interpreting and organizing the information gained from experiences
7 Being able to build on other students’ ideas make extensions of FM real
8 Students are rational decision makers capable of determining for themselves what is right and wrong
9 Further Mathematics learning is being able to get the right answers quickly
10 Periods of uncertainty, conflict, confusion, surprise are a significant part of the Further Mathematics learning process
11 Further Mathematics teachers make learning more meaningful to students when problems are taken from real-life context
12 Students should be allowed to use any method known to them in solving FM problems
13 Young students are capable of much higher levels of mathematical thought than has been suggested traditionally
14 Teachers’ should not rebuke students’ for not answering questions correctly
15 Being able to memorize facts is critical in Further Mathematics learning
16 Further Mathematics learning is enhanced by activities which build upon and respect students’ experiences
17 Further Mathematics learning is enhanced by challenge within a supportive environment
18 Teachers should provide instructional activities which result in problematic situations for learners
19 Teachers should encourage students to ask why they have to learn some FM topics
20 Teachers or the textbook – not the student – are authorities for what is right or wrong
169
21 The role of the Further Mathematics teacher is to transmit mathematical knowledge and to verify that learners have received this knowledge
22 Teachers should recognize that what seem like errors and confusions from an adult point of view are students’ expressions of their current understanding
23 Teachers should negotiate social norms with the students in order to develop a cooperative learning environment in which students can construct their knowledge
24 Further Mathematics concepts enable students to interpret and solve applied problems
25 Further Mathematics is a product of the invention of human mind
26 Further Mathematics is abstract 27 Further Mathematics is the bedrock of Science and
Technology
28 Teachers’ should encourage students to formulate solution procedures by themselves in trying to solve real-world problems
Appendix 5
Item Difficulty and Discrimination Index of RDT
Appendix 6
Item Difficulty and Discrimination Index for TMT in the study
Item No. Item Difficulty Discrimination
Index
1 0.72 .64
2 0.86 .42
3 0.25 .46
4 0.34 .50
Item No. Item Difficulty Discrimination
Index
170
1 0.75 .67
2 0.88 .44
3 0.25 .46
4 0.34 .50
5 0.63 .48
6 0.75 .67
7 0.63 .48
8 0.38 .47
9 0.88 .44
10 0.63 .48
171
Appendix 7
Teaching specific topics in Senior Secondary year one further mathematics class
Topics such as Indices, Indicial equations, Logarithms, Algebraic equations Sequences and
Series are included in the Nigeria Further Mathematics National Curriculum for Senior
Secondary School One. The way these topics are taught by teachers in Nigeria using the
traditional method is demonstrated in this section. The researcher also explained how the
same topics could be taught using PBL approach.
Teaching of Indices and Logarithms using Traditional Method
Objectives: At the end of the lesson students will be able to (i) Use the laws of indices in
calculations and simplifications (ii) Use the relationship between Indices and Logarithms to
solve problems (iii) Change bases in logarithms
Content: Indices as a shorthand notation, Laws of indices, Meaning of a0, a-n, a1/n Elementary
theory of Indices, log(a – b), log(a/b) log an , log(a)1/n Elementary theory of logarithms, Base
10 logarithm tables and antilogarithm tables, Calculations involving multiplication, division,
powers and nth roots.
Previous Knowledge: Students have learnt how to express numbers in index and standard
forms.
Procedure:
Step 1: State the laws of Indices
Step 2: Give examples to show how each of the laws is applied
Step 3: Repeat steps 1&2 for Logarithms
Step 4: Explain the relationship between Indices and Logarithms by setting y = 10x
Step 5: Use the above steps to solve some problems for the students
Question 1: Evaluate 41/2 x 41/3
172
Solution: 41/2 x 41/3 = 41/2 + 1/3 = 45/6 (Application of 1st law)