31 Transportation Research Record: Journal of the Transportation Research Board, No. 2322, Transportation Research Board of the National Academies, Washington, D.C., 2012, pp. 31–41. DOI: 10.3141/2322-04 Institute for Planning and Transport Systems (IVT), Swiss Federal Institute of Technology (ETH Zürich), Zürich CH-8093, Switzerland. Corresponding author: N. Rieser-Schüssler, [email protected]. modal reliability (3), expectations and social norms (4), or lifestyles and environmentalism (5, 6) are investigated. Recently, some methodological progress in the area of discrete choice modeling has led to a new and more sophisticated way to inte- grate attitudes and perceptions into choice models. Because attitudes and perceptions cannot be observed directly, they must be modeled as latent variables for which the psychometric indicators serve as manifestations. Ben-Akiva et al. presented a behavioral framework and associated mathematical formulations for modeling such latent variables (7 ). Their framework consisted of two components: a mea- surement model describing the relationship between indicators and psychological factors and a structural model that explains psychologi- cal factors with the help of person characteristics, thus allowing the analyst to distinguish between the influence of person characteristics on a latent variable and their effects on other aspects of the decision. Walker and Ben-Akiva extended this framework not only by includ- ing latent variables in the utility of alternatives, but also by using them to create latent classes (8). For each latent class, separate utility func- tions or even choice sets can be specified (9). A latent class model comprises two components: a class membership model and class- specific choice models. Analogous to the latent variable model, the class membership model of a latent class model contains a structural model and a measurement model. Because of the theoretical and practical advantages of these two modeling frameworks, several applications of latent variable and latent class models were published recently. A major focus was placed on the influence of environmentalism on mode choice, for which latent vari- able (10, 11) and latent class models (12, 13) were developed. Other areas of interest include the role of habits in mode choice (14), the influ- ence of the willingness to take risks (15), or the tendency to be a car lover (16) on car-route choice, and the relationship between lifestyle, residential location choice, and the propensity to travel (17, 18). This paper continues the line of research on latent variable mode choice models, but adds a new aspect to it. In addition to the influence of environmentalism, the effect of variety seeking on mode choice is investigated. With respect to variety seeking, it is assumed that people who search for variety in their lives are more eager to experiment and therefore have bigger choice sets. Variety seeking was chosen because habits and the willingness to deviate from habits have a large influence on mode choice, as for example shown by Tudela et al. (14). People who like to explore new routes or modes are more likely to have bigger choice sets and adapt more quickly to changes in the transport system, such as a new public transport line. Thus, they are the people who may be best targeted with policies that aim to change behavior. How- ever, no study so far has investigated whether variety seekers are more inclined to use public transport or cars. On the one hand, using a car is Investigating the Influence of Environmentalism and Variety Seeking on Mode Choice Nadine Rieser-Schüssler and Kay W. Axhausen In the transport modeling community, there is a growing consensus that socioeconomic attributes alone will not suffice to characterize travelers and make forecasts about their travel behavior. Therefore, an increasing number of recent studies have integrated latent variables representing attitudes, perceptions, and preferences into choice models. Because it is impossible to measure latent variables directly, psycho- metric scales are used as indicators. For the study presented in this paper, psychometric scales for environmentalism and variety seeking were developed and tested in a mail-back survey that included a 1-day travel diary and a questionnaire about socioeconomic characteristics. A factor analysis was carried out to establish predominant attitudinal fac- tors, which were then used as latent variables in a mode choice model. The results of the estimated choice models show that the three latent variables investigated—awareness of environmental problems, denial of environmental issues, and desire for variety in one’s daily routine— influenced the mode choices of the study participants in different ways that may be attributable to other socioeconomic characteristics of the participants. This finding indicates that the scales developed for this study are suitable for capturing attitudes that are relevant to transport behavior research. In the transport modeling community, there is a growing consensus that socioeconomic attributes alone will not suffice to characterize travelers and make forecasts about their travel behavior. Attitudes and perceptions have a major influence on travel behavior, and inte- grating them into models of transport behavior can help to explain why two people may make completely different decisions when fac- ing an objectively equivalent situation. Although social psychology is still investigating interactions between attitudes, beliefs, values, social norms, and behavior and the applicability of different behav- ioral models such as the theory of planned behavior (1) or the value- belief-norm (2), transport researchers have concentrated more on how to include attitudes and perceptions in transport models. The traditional way of accounting for attitudes and perceptions in transport models is to measure them by means of psychometric scales, reduce them through factor analysis, and use the factor score in a regression or discrete choice model. Typical applications of this approach are mode choice models in which the effects of perceived
Transcript
31
Transportation Research Record: Journal of the Transportation Research Board, No. 2322, Transportation Research Board of the National Academies, Washington, D.C., 2012, pp. 31–41.DOI: 10.3141/2322-04
Institute for Planning and Transport Systems (IVT), Swiss Federal Institute of Technology (ETH Zürich), Zürich CH-8093, Switzerland. Corresponding author: N. Rieser-Schüssler, [email protected].
modal reliability (3), expectations and social norms (4), or lifestyles and environmentalism (5, 6) are investigated.
Recently, some methodological progress in the area of discrete choice modeling has led to a new and more sophisticated way to inte-grate attitudes and perceptions into choice models. Because attitudes and perceptions cannot be observed directly, they must be modeled as latent variables for which the psychometric indicators serve as manifestations. Ben-Akiva et al. presented a behavioral framework and associated mathematical formulations for modeling such latent variables (7 ). Their framework consisted of two components: a mea-surement model describing the relationship between indicators and psychological factors and a structural model that explains psychologi-cal factors with the help of person characteristics, thus allowing the analyst to distinguish between the influence of person characteristics on a latent variable and their effects on other aspects of the decision.
Walker and Ben-Akiva extended this framework not only by includ-ing latent variables in the utility of alternatives, but also by using them to create latent classes (8). For each latent class, separate utility func-tions or even choice sets can be specified (9). A latent class model comprises two components: a class membership model and class-specific choice models. Analogous to the latent variable model, the class membership model of a latent class model contains a structural model and a measurement model.
Because of the theoretical and practical advantages of these two modeling frameworks, several applications of latent variable and latent class models were published recently. A major focus was placed on the influence of environmentalism on mode choice, for which latent vari-able (10, 11) and latent class models (12, 13) were developed. Other areas of interest include the role of habits in mode choice (14), the influ-ence of the willingness to take risks (15), or the tendency to be a car lover (16) on car-route choice, and the relationship between lifestyle, residential location choice, and the propensity to travel (17, 18).
This paper continues the line of research on latent variable mode choice models, but adds a new aspect to it. In addition to the influence of environmentalism, the effect of variety seeking on mode choice is investigated.
With respect to variety seeking, it is assumed that people who search for variety in their lives are more eager to experiment and therefore have bigger choice sets. Variety seeking was chosen because habits and the willingness to deviate from habits have a large influence on mode choice, as for example shown by Tudela et al. (14). People who like to explore new routes or modes are more likely to have bigger choice sets and adapt more quickly to changes in the transport system, such as a new public transport line. Thus, they are the people who may be best targeted with policies that aim to change behavior. How-ever, no study so far has investigated whether variety seekers are more inclined to use public transport or cars. On the one hand, using a car is
Investigating the Influence of Environmentalism and Variety Seeking on Mode Choice
Nadine Rieser-Schüssler and Kay W. Axhausen
In the transport modeling community, there is a growing consensus that socioeconomic attributes alone will not suffice to characterize travelers and make forecasts about their travel behavior. Therefore, an increasing number of recent studies have integrated latent variables representing attitudes, perceptions, and preferences into choice models. Because it is impossible to measure latent variables directly, psycho-metric scales are used as indicators. For the study presented in this paper, psychometric scales for environmentalism and variety seeking were developed and tested in a mail-back survey that included a 1-day travel diary and a questionnaire about socioeconomic characteristics. A factor analysis was carried out to establish predominant attitudinal fac-tors, which were then used as latent variables in a mode choice model. The results of the estimated choice models show that the three latent variables investigated—awareness of environmental problems, denial of environmental issues, and desire for variety in one’s daily routine—influenced the mode choices of the study participants in different ways that may be attributable to other socioeconomic characteristics of the participants. This finding indicates that the scales developed for this study are suitable for capturing attitudes that are relevant to transport behavior research.
In the transport modeling community, there is a growing consensus that socioeconomic attributes alone will not suffice to characterize travelers and make forecasts about their travel behavior. Attitudes and perceptions have a major influence on travel behavior, and inte-grating them into models of transport behavior can help to explain why two people may make completely different decisions when fac-ing an objectively equivalent situation. Although social psychology is still investigating interactions between attitudes, beliefs, values, social norms, and behavior and the applicability of different behav-ioral models such as the theory of planned behavior (1) or the value-belief-norm (2), transport researchers have concentrated more on how to include attitudes and perceptions in transport models.
The traditional way of accounting for attitudes and perceptions in transport models is to measure them by means of psychometric scales, reduce them through factor analysis, and use the factor score in a regression or discrete choice model. Typical applications of this approach are mode choice models in which the effects of perceived
32 Transportation Research Record 2322
the more flexible mode, but on the other hand, car drivers also tend to be captive to their mode. The goal of this paper is to determine which effect is stronger in a mode choice context.
To achieve that goal, psychometric scales for environmentalism and variety seeking were developed and tested in a small paper-and-pen mail-back survey that also included a 1-day travel diary and a questionnaire about the respondents’ socioeconomic characteristics. This paper reports on the results of that survey and the interest-ing findings resulting from latent variable models that incorporated latent variables for awareness of environmental problems, denial of environmental issues, and desire for variety in one’s daily routine.
The rest of this paper is structured as follows: First, the survey design and the characteristics of the respondents will be introduced. Second, a descriptive analysis of the reported travel diaries will be given. Third, the process of establishing the most suitable factors by means of a factor analysis will be described, including first insights into the relationship between those factors and the socioeconomic characteristics of the respondents that were gained by analyzing the socioeconomic profiles of each factor. Fourth, the modeling approach and the results of the latent variable mode choice models will be presented. Finally, conclusions will be drawn and an outlook on further work will be given.
Survey DeSign anD reSponSe
The data used in this study originated from a paper-and-pen mail-back survey that is described in more detail in Rieser-Schüssler and Axhausen (19). The survey was made up of three components:
• Questionnaire asking for person and household characteristics,• 1-day trip diary, and• Three psychometric scales covering the topics of risk propensity,
variety seeking, and environmentalism.
The person and household questionnaire and the trip diary were slightly adapted versions of those used by Weis et al. (20). The ques-tionnaire asked about a large variety of socioeconomic variables, and the trip diary included questions concerning the number of accompa-nying persons and the planning horizon of the trip in addition to the standard set of trip and activity characteristics. The major part of the survey, however, was made up of the three psychometric scales. They were designed following an extensive literature review, which will briefly be summarized in the next paragraphs. Because the scale for risk propensity was not used in the model estimation, it has been left out of the following discussion, and the reader is referred to other discussions by Rieser-Schüssler and Axhausen (19).
Measuring environmentalism
Because of increasing public awareness of environmental issues, a lot of work on the measurement of environmentalism has been pub-lished, of which only a fraction can be mentioned here. One of the best-known scales for measuring environmentalism is the new envi-ronmental paradigm developed by Dunlap and van Liere (21), which evaluates respondents’ concept of the relationship between humanity and nature and their overall appraisal of growth prospects in regard to population and the economy. Kitamura et al. integrated questions on respondents’ attitude toward the environment into a large-scale land use and transport behavior study (5). Schultz argued that envi-
ronmental concern has to be broken down into concern for oneself, for other people, and for the biosphere, because different values and degrees of awareness of harmful consequences are attached to each (22). Gatersleben et al. investigated the relationship between environmental attitudes and beliefs, socioeconomics, social science indicators of proenvironmental behavior, and measurements of direct and indirect energy consumption (23). They found that self-reported pro environmental behavior was indeed related to environmental attitudes, but only marginally to household energy consumption, which was more strongly linked to household size and income. They concluded that environmental attitudes are especially relevant when behavioral changes do not cost too much effort or change in com-fort, but that as soon as people have the financial means, they are tempted to consume more energy. Following the theory of planned behavior (1), Anable (24) developed a 105-item, five-point response scale questionnaire to examine the influence of habits, moral norms, environmental attitudes, felt efficacy, and perception of others’ behavior on mode choice and showed that the mode choice behavior of different attitudinal population segments does indeed vary.
After the scales of these and other authors were reviewed, the scales used by Gatersleben et al. (23) and Kitamura et al. (5) were deemed the most appropriate for the study at hand. Together, the two scales cover many domains of environmentalism that recent lit-erature has identified as important, including the awareness of con-sequences for oneself, others, and the biosphere; the evaluation of measures for environmental protection; and a general concern for the environment. Moreover, the scale items are easily comprehensible and answerable for all population segments. The combined scale contains 25 items and uses a five-point response scale.
Measuring variety Seeking
Compared with the abundance of studies using measures for environ-mentalism, relatively little research has so far been directed toward the quantification of variety seeking and its incorporation into models for daily transport behavior. The few studies aiming in this direc-tion investigate the phenomenon of travel for its own sake, that is, undirected travel or travel with unnecessary detours [e.g., Mokhtar-ian and Salomon (25)]. A wider recognition of the influence of vari-ety seeking on travel behavior can be found in the tourism literature. Examples are the studies by Bello and Etzel (26) and Niininen et al. (27), who investigated the role of variety seeking and consumer loy-alty in holiday destination choice. Bello and Etzel derived their own 50-item, five-point response scale and asked respondents to evaluate their most recent trip of more than two nights with respect to the novelty of the experience, among other aspects (26). They concluded that novelty seekers felt their trip to be more deserved, gave more importance to the pleasure aspect of the holiday, and spent more time and money on it. Niininen et al. (27), who used the Arousal Seeking Tendency scale developed by Mehrabian and Russell (28), found that there is a link between the need for variety and patterns of holiday destination choice, but that this link is only minor.
Because the scale developed by Bello and Etzel (26) focused on holiday behavior and not on daily life and because the Arousal Seek-ing Tendency scale was not available for mail-back surveys, a scale that included some of the questions given by Niininen et al. (27 ) and Mokhtarian and Salomon (25) was constructed for the present study. This variety-seeking scale contains 28 questions measuring the wish for variety in the daily routine in general and specifically in shopping, eating, recreational activities, and transport behavior.
Rieser-Schüssler and Axhausen 33
Survey execution and respondent Characteristics
In total, 2,000 questionnaires were sent out to candidates living in the canton of Zürich, Switzerland, in two waves during the summer and fall of 2010. After the first wave, a problem with the age distri-bution of respondents living at addresses bought from an address vendor was discovered: about 45% were 65 years or older. Thus, the second wave was restricted to persons younger than 65 years of age. For the diary, the candidates were assigned a survey day that was a Tuesday, Wednesday, or Thursday to capture only ordinary weekdays. The response rates were relatively low, with 274 returned questionnaires, of which 222 were usable for later analysis. Although all of these 222 questionnaires were used in the diary and psychometric scale analysis presented in the next two sections, not all of those respondents conducted trips suitable for the mode choice model. Thus, the sample had to be further reduced for the model estimation. Because the aim was to obtain a repre-sentative sample for the study area, Table 1 compares the socio-economic characteristics of all study participants and the model estimation sample with the weighted persons and households from the study area contained in Microcensus 2005 (the Swiss national travel survey).
As expected, the total study sample shows an underrepresenta-tion of young study participants and small households and an over-representation of persons with high education, high income, and part- or full-time employment, as well as households with four or more members. Moreover, there is a considerably higher share of driver’s license and public transport subscription holders and a lower share of persons who always have a car available. This finding implies that our respondents are probably more mobile and more public transport–oriented than the average population of the canton of Zürich. Some of these characteristics are even more pronounced in the modeling sample—such as the underrepresenta-tion of small households or the overrepresentation of persons with a driver’s license or a high income—whereas others are slightly evened out, including the age distribution and car availability. The modeling sample contains more working-age respondents and more respondents with a high rate of car availability than in the total study sample.
Diary analySiS
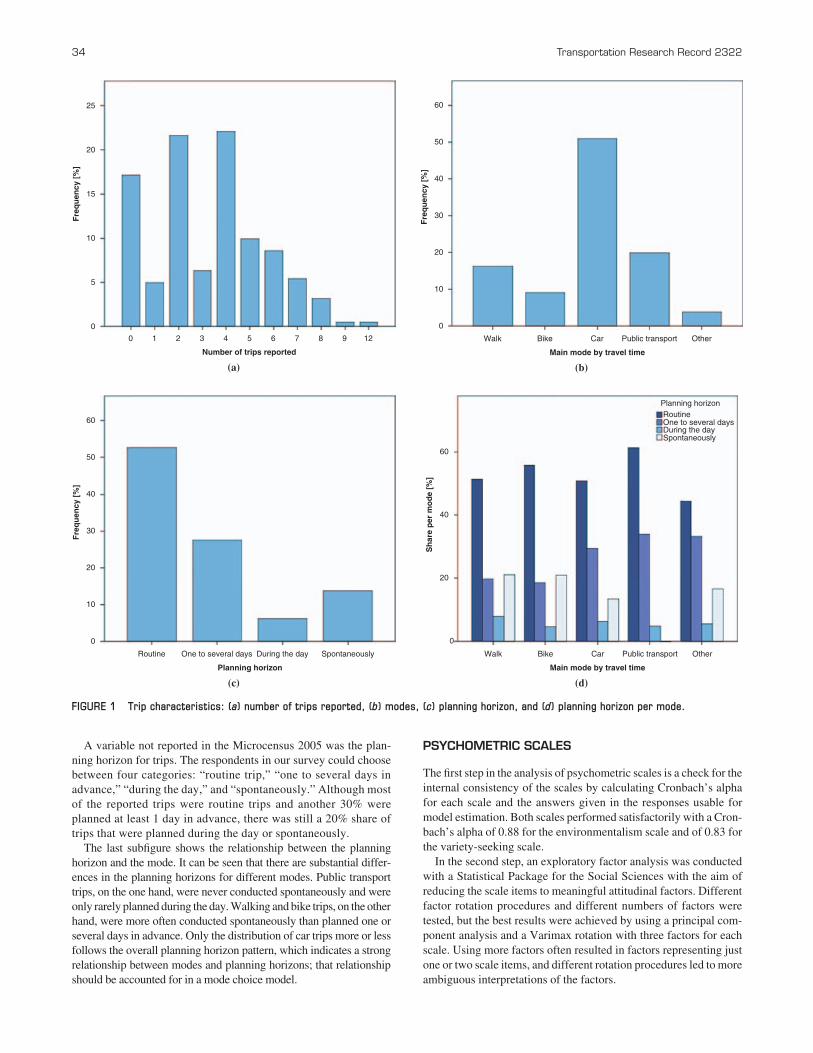
To give an overview of the trips reported in the 1-day paper diary, Figure 1 illustrates the distributions of the number of reported trips, modes, trip purposes, and planning horizons. The distribution of the number of trips shows the expected peaks at two and four trips, but also that a substantial share of the respondents did not perform any trips on the survey date. The main reason for this, especially in the first wave of the survey, was that vacation time had just started and people who were not traveling abroad stayed at home or in their gardens. Other frequent reasons given were housework and sickness. However, there were also several respondents who per-formed five or more trips, so the average trip rate of 3.29 was only slightly lower than the 3.65 trips per day reported in the yearlong Microcensus 2005.
Compared with the mode shares reported in the Microcensus 2005 (28% walk, 9% bike, 50% car, 12% public transport), car and public transport trips are overrepresented in the diaries and walking trips are underrepresented. The reason might be that this survey was a
mail-back-only survey, whereas the Microcensus 2005 was a com-puter assisted telephone interviewing survey in which an interviewer helped respondents to recall even short walking trips, which are often otherwise forgotten. However, because the current interest here is only in the choice between car use and public transport, the underrepresentation of walking trips is not a concern in this study.
TABLE 1 Socioeconomic Attributes of Respondents Compared with Microcensus 2005
A variable not reported in the Microcensus 2005 was the plan-ning horizon for trips. The respondents in our survey could choose between four categories: “routine trip,” “one to several days in advance,” “during the day,” and “spontaneously.” Although most of the reported trips were routine trips and another 30% were planned at least 1 day in advance, there was still a 20% share of trips that were planned during the day or spontaneously.
The last subfigure shows the relationship between the planning horizon and the mode. It can be seen that there are substantial differ-ences in the planning horizons for different modes. Public transport trips, on the one hand, were never conducted spontaneously and were only rarely planned during the day. Walking and bike trips, on the other hand, were more often conducted spontaneously than planned one or several days in advance. Only the distribution of car trips more or less follows the overall planning horizon pattern, which indicates a strong relationship between modes and planning horizons; that relationship should be accounted for in a mode choice model.
pSyChoMetriC SCaleS
The first step in the analysis of psychometric scales is a check for the internal consistency of the scales by calculating Cronbach’s alpha for each scale and the answers given in the responses usable for model estimation. Both scales performed satisfactorily with a Cron-bach’s alpha of 0.88 for the environmentalism scale and of 0.83 for the variety-seeking scale.
In the second step, an exploratory factor analysis was conducted with a Statistical Package for the Social Sciences with the aim of reducing the scale items to meaningful attitudinal factors. Different factor rotation procedures and different numbers of factors were tested, but the best results were achieved by using a principal com-ponent analysis and a Varimax rotation with three factors for each scale. Using more factors often resulted in factors representing just one or two scale items, and different rotation procedures led to more ambiguous interpretations of the factors.
Number of trips reported
0
0
5
10
Fre
qu
ency
[%
]
15
20
25
1 2 3 4 5 6 7 8 9 12
(a)
0
20
10
Fre
qu
ency
[%
]
30
40
50
60
Main mode by travel time
Walk Bike Car Public transport Other
(b)
0
20
Sh
are
per
mo
de
[%]
40
60
Main mode by travel time
Walk Bike Car Public transport Other
Planning horizon Routine One to several days During the day Spontaneously
(d) (c)
0
20
10
Fre
qu
ency
[%
]
30
40
50
60
Planning horizon
Routine One to several days During the day Spontaneously
FIGURE 1 Trip characteristics: (a) number of trips reported, (b) modes, (c) planning horizon, and (d) planning horizon per mode.
Rieser-Schüssler and Axhausen 35
The results of the factor analyses are shown in Tables 2 and 3. The questions are translated from the German and have sometimes been shortened because of space constraints. Moreover, only factor load-ings equal to or higher than 0.4 and only questions with a minimum factor loading of 0.4 for at least one factor are shown. The full set of questions and their complete formulations can be found in Rieser-
Schüssler and Axhausen (19). The coding scheme was also inherited from that paper to keep the two papers consistent.
The three main factors for environmentalism explain about 43% of the variance in the data. The first factor describes respondents’ awareness of the negative consequences of environmental pollution, especially with respect to health issues, and their own responsibility
TABLE 2 Results of Factor Analysis for Environmentalism
Analysis Results
Question Description Factor 1 Factor 2 Factor 3
E2 Too much attention is paid to environmental problems. — 0.765 —
E3 Environmental problems are exaggerated. — 0.718 —
E4 Attention to the greenhouse effect is exaggerated. — 0.695 —
E6 Environmental pollution affects my health. 0.648 — —
E7 Environmental problems have consequences for my life. 0.517 — —
E9 Environmental problems are a risk for the future of my children. 0.440 — —
E10 Saving threatened species is an unnecessary luxury. — — −0.403
E11 We should care for our environment because we depend on it. 0.499 — —
E12 Vehicle emissions increase the need for health care. 0.536 — —
E13 A better environment starts with myself. 0.483 — —
E16 Behavioral change requires a right example by the government. — — 0.428
E18 Environmental protection costs too much. — 0.464 —
E19 Environmental protection is good for the economy. 0.418 — —
E20 Jobs are more important than the environment. −0.425 — —
E21 Stricter vehicle smog control should be enforced. 0.543 — —
E22 The price of gas should be raised to reduce pollution. 0.506 — —
E24 There should be incentives for using electric vehicles. — — 0.536
E25 Those who cause environmental damage should pay to repair it. 0.513 — —
Note: — = not applicable.
TABLE 3 Results of Factor Analysis for Variety Seeking
Analysis Results
Question Description Factor 1 Factor 2 Factor 3
V1 I like to experience novelty and change in my daily life. — — 0.443
V2 I sometimes look for ways to change my daily routine. — 0.647 —
V3 I like to have lots of activity around me. 0.406 — —
V4 I prefer a clearly structured, repetitive daily schedule. — −0.490 —
V5 Rituals give me a feeling of control and security. — −0.442 —
V6 I love surprises. — — 0.628
V8 Shops with exotic herbs and fragrances fascinate me. 0.660 — —
V9 When eating out I like to try the most unusual items. 0.411 — —
V15 I like to explore unknown towns or parts of my town. 0.665 — —
V19 Cultures completely different from my own fascinate me. 0.527 — —
V21 I always keep an open door for surprise visitors. — — 0.406
V23 I like to explore new places. 0.725 — —
V24 I like to try new routes to familiar destinations. — 0.624 —
V25 I sometimes take a longer route to see something new. — 0.481 —
V26 I like to drive around just for the fun of it. — 0.493 —
V27 When commuting I always take the same route. — −0.460 —
V28 I like to meet new people while traveling by train. — — 0.408
Note: — = not applicable.
36 Transportation Research Record 2322
to restrict behavior that is harmful to the environment. This is called concern about environmental consequences (envConcern) in this paper. The second factor for environmentalism is called denial of environmental problems (envDeny) and characterizes the attitude that environmental problems are exaggerated and too much attention is paid to them. The third factor summarizes a positive attitude toward environmental protection measures.
For variety seeking, only 33% of the variance is explained by the three main factors found in the factor analysis, but in their interpre-tation they are more diverse than the factors for environmentalism. The first factor describes a desire for new experiences by trying new food, visiting new places, and getting in contact with cultures differ-ent from those of the respondents. The second factor characterizes a completely different type of variety seeking. Persons who scored high on that factor search for (small) variations from their daily routine. Therefore, this factor is called interest in varying one’s daily routine (routine). Finally, the third factor captures a liking for surprises and unexpected changes.
Of these six factors, concern about environmental consequences (envConcern), denial of environmental problems (envDeny), and interest in varying one’s daily routine (routine) were included as latent variables in the mode choice models. Environmental concern and denial of environmental problems were chosen because they explain most of the variance in the answers to the environmentalism scale. Moreover, they represent to a certain extent opposing atti-tudes toward the environment, and it is interesting to see which one is more closely related to actual behavior. With respect to variety seeking, the interest in varying the daily routine was chosen over the desire for new experiences because the mode choice situations reported by the respondents were mainly routine situations.
SoCioeConoMiC profileS of latent variableS
To understand the relationship between the latent variables and the socioeconomic characteristics of the respondents, the next step was to establish socioeconomic profiles for each latent variable. Figure 2 shows the distribution of factor scores for different population seg-ments and the latent variables that were used in the model estimation. The population segments were chosen on the basis of the stron-gest correlation between the factor scores and the socioeconomic characteristics.
In regard to the awareness of environmental problems, the most distinct relationship between factor score distribution and socio-economic variables can be seen for the number of cars in the house-hold and for bike ownership. The higher the number of cars in the household, the lower the factor score tends to be, whereas persons with at least one bike available in the household tend to achieve a higher factor score. These scores are in line with the expecta-tion that environmentally aware households use more environ-mentally friendly modes and are correspondingly equipped with mobility tools.
There is also a strong correlation between the number of cars in the household and the denial of environmental problems, whereby a high number of cars is associated with high denial factor scores. More interesting, however, is the influence of education on the denial factor. High factor scores for this variable are found only for less-educated respondents. This finding might indicate that less-educated persons are not well reached by educational programs addressing environmental problems and protection.
The interest in varying one’s daily routine correlated both to the number of cars in the household and to gender, with higher factor scores obtained by women and persons living in households with fewer cars. Another strong correlation can be found between the number of household members and the interest in variations of the daily routine, as there are smaller factor scores for bigger house-holds. However, the household size was not significant in subsequent model estimation trials and was thus left out of Figure 2.
MoDel SpeCifiCation
The final step for investigating the influence of environmentalism and variety seeking on mode choice was the estimation of latent variable mode choice models. Because the focus here was on the choice between car and public transport, only trips made by one of these modes with a car network distance of more than 1 km and with a destination different from the origin were considered. This consideration resulted in 423 valid observations for the model estimation.
The choice set generation entailed three steps. First, the reported origin and destination addresses were geocoded. Second, the car alternatives were generated by calculating least-cost path routes in a loaded dynamic travel time network using MATSim and the Switzerland model documented in Balmer et al. (29). Third, the public transport alternatives were derived by using a Web robot on the Swiss Federal railways web page and a selection procedure that accounted for access and egress times and the difference between reported and found departure and arrival times, travel times, and number of transfers.
Modeling framework
The modeling framework is made up of two parts that were estimated simultaneously: a basic choice model component and the latent vari-able model component. The basic choice model is a standard multi-nomial logit (MNL) model in which the utility of each alternative i is a function of the observable characteristics Xin of the alternative, the choice situation and decision maker n, a set of parameters β to be estimated, and εin, a Gumbel distributed error term:
U V f Xin in in in in= + = ( ) +ε β ε, ( )1
where Vin is the standard.The choice probability for each alternative is defined as
P i X U U j Cin in jn n; ; , ( )β θε( ) = ≥ ∀ ∈ Prob 2
where θε is the standard deviation of the error term and Cn is the choice set available to person n.
Because latent variables are inherently not observable, they are modeled in a latent variable model component, which again consists of two parts: a structural model and a measurement model. The structural model explains the latent variable—here the attitude Attn of person n—as a function of socioeconomic or other characteristics Xn of person n, a set of parameters λ to be estimated, and an error term ωn with standard deviation θω:
Attn n nh X= ( ) +, ( )λ ω 3
(a) (b)
(c) (d)
(e) (f)
FIGURE 2 Relationships between socioeconomic and latent variables: between environmental concern and (a) number of cars and (b) bike ownership; between environmental denial and (c) number of cars and (d) level of education; and between liking route changes and (e) number of cars and (f) gender.
38 Transportation Research Record 2322
The measurement model defines the relationship between indica-tor Ij—here measured by psychometric scale item j—and the latent variable taking into account a set of parameters α to be estimated and an error term υn with standard deviation θυ:
I gj n n= ( ) +Att , ( )α υ 4
The integration of the latent variable model component and the basic choice model is done via the utility function of the alterna-tives. The utility function of at least one alternative—as defined in Equation 5—is extended by the attitude Attn and a parameter, βAttn, that has to be estimated and quantifies the influence of the latent variable on the utility of the corresponding alternative:
U f Xin in n inn= ( ) + +β β ε, ( )Att Att 5
The estimation of the integrated model is done by using a maxi-mum likelihood estimator with a complex multidimensional inte-gration of the likelihood function that contains one term each for the choice model, the measurement equations, and the structural equation. For more details, see Ben-Akiva et al. (7).
base Model
To establish the MNL base model, a range of level of service (LOS) attributes of the alternatives, situation attributes, and socioeconomic characteristics of the respondents were tested. The LOS attributes are travel time by car, ttCar; access and egress travel time to and from pub-lic transport stops, accttPT; travel time in the public transport system, including waiting time, systttPT; and the number of transfers, transfPT. Moreover, the model includes an alternative specific constant for car travel, ASCcar.
The choice situation variable that provided the best results is the planning horizon, planHor. It was included because the diary analy-sis determined a strong relationship between planning horizons and modes and the relationship was also found to be significant in most of the models. The planning horizon variable is coded as an ordinal variable with increasing values for shorter planning horizons.
With regard to socioeconomic variables, several models, both with and without latent variables, were tested. Many socioeconomic vari-ables (e.g., age, bike ownership, gender) were not significant in any model specification or were barely significant in only a few models, for example, car availability or low education. Positive indicators for car use include income, number of cars in the household, and number of trips reported on the survey day, whereas the ownership of a pub-lic transport season ticket correlates to a higher likelihood of public transport use. However, if income was paired with any other socio-economic variable, it became insignificant. Although this finding is not transferable to many other study areas, it was expected for the Zürich area, where public transport use is very common and is a viable option for all population segments.
The extent of improvement to model fit through the inclusion of socioeconomic variables varies substantially; when latent variables are added, most socioeconomic variables do not provide any addi-tional model fit improvement. The only socioeconomic character-istic with consistent fit improvement for all models is season ticket ownership. Therefore, the variable of season ticket ownership is added to the utility function of the public transport alternative in the form of the dummy variable STicketPT. βSTPT is its beta parameter.
Equations 6 and 7 summarize the systematic parts of the utilities for the alternatives of car and public transport use, respectively:
Three different latent models are presented here, each integrating one of the three latent variables: envConcern, envDeny, and routine established in the previous section. Models including two latent vari-ables were also tested, but they did not converge, probably because of the small number of available observations and the large number of parameters to be estimated.
As explained above, the measurement model of the latent vari-able component describes the relationship between the latent vari-able and the psychometric indicators. The model comprises one equation for each indicator of the following form:
I aj j j j= + +α υi Att ( )8
where Ij is the scale item value assigned by the respondent, Att is the latent attitude, aj and αj are the parameters to be estimated, and υj is an error term with standard deviation θυj. Note that in each model, aj is fixed to 0 and αj is fixed to 1 for one of the indicators for normalization purposes.
As already indicated by the socioeconomic profiles of the latent variables in the previous section, each variable relates to a different socioeconomic attribute. Therefore, the structural models for the latent variables differ somewhat. For the variable envConcern, the following structural equation is used:
envConcern envConcern ownsBikeownsBike= +
+
λ
λ
i
nnofCars nofCarsi + ω ( )9
where
envConcern = estimated mean value for envConcern, ownsBike = dummy variable that is true if there is at least one
bike in the participant’s household, and nofCars = number of cars owned by the household.
For the latent variable envDeny, the number of cars and a dummy for low education, lowEdu, yielded the best model fit. Thus, the structural equation for this latent variable is
Finally, because the latent variable routine is strongly influenced by the number of cars and the respondents’ gender, the structural equation for this model takes the form of
routine routine nofCars fnofCars female= + +λ λi i eemale + ω ( )11
where female is a dummy that equals one if the person is female.
Rieser-Schüssler and Axhausen 39
In the choice modeling component of the latent variable model, the latent variable for environmental concern is added to the utility function of the public transport alternative. The others are added to the utility function of the car alternative following the assumption that environmental awareness increases the probability of choosing public transport, whereas the other variables increase the probability of choosing the car.
MoDeling reSultS
All models were estimated by using the extended version of BIOGEME (30), which is described to some extent in Bierlaire and Fetiarson (31). The results of the four best-performing models are presented in Tables 4 and 5. Table 4 contains the parameters of the choice model components and the structural models, and Table 5 contains those of the measurement models.
The parameters for the LOS attributes in the MNL model show the expected signs, even though the parameter for travel time in the public transport system is not significant at the 90% level. However, no other formulation of public transport travel time performed better. The alternative specific constant is positive, indicating a general pref-erence for using the car if all other factors are equal. The parameter for the planning horizon is positive, thus confirming the hypothesis that a shorter planning horizon increases the probability of choosing the car. By contrast, ownership of a public transport season ticket increases the probability of using public transport, as shown by the positive and strongly significant season ticket parameter.
In the latent variable model for environmental concern, the β-parameter for the latent variable has the expected sign, indicat-ing that people with a higher level of environmental awareness are more likely to choose public transport. Bike ownership is positively correlated with environmental concern, and an increasing number of cars in the household are linked to less environmental concern.
A few shifts can be observed in the travel time parameters. Access time to public transport is punished more; travel time in the public transport system is less relative to car travel time.
As anticipated, denial of environmental issues is related to a higher probability of choosing the car alternative. Moreover, a high number of cars in the household and a low level of education are linked to higher degrees of denial. In regard to the valuation of the travel time parameters, the ratio between the travel time in the public transport system and the car travel time remains the same as in the base model, and the shift in valuation of the access time is even more pronounced than with the latent variable for environmental concern.
Against expectation, the negative βroutineCar parameter indicates that a greater desire for variation in the daily routine is associated with a higher probability of choosing public transport over using a car. At the same time, the parameter for the planning horizon remains significant and positive, indicating that the planning horizon of a specific trip and the general disposition for variety seeking are different phenomena that should be modeled separately. A model without the variable for public transport season ticket ownership was used in Table 4. Includ-ing the season ticket variable slightly improves the model fit, but the parameter for interest in varying one’s daily routine becomes insig-nificant. Apparently, there is some correlation between the two vari-ables, but models including season ticket ownership in the structural model so far did not converge. More experiments will be required to investigate this relationship further.
Table 5 presents the parameter of the measurement model. One a parameter and one α parameter were fixed to 0 and 1, respectively, for identification purposes. The α parameters that indicate the association between the response to the scale item and the psychometric scale show all the expected signs. Respondents with a stronger concern about environmental consequences provided higher than average values for the scale items E6 (“environmental pollution affects my health”), E7 (“environmental problems have consequences for my life”), E12 (“vehicle emissions increase the need for health care”),
TABLE 4 Modeling Results: Choice Model and Structural Model
E21 (“stricter vehicle smog control should be enforced”), and E22 (“the price of gas should be raised to reduce pollution”). Respon-dents who denied environmental issues indicated higher than aver-age agreement with E2 (“too much attention is paid to environmental problems”), E3 (“environmental problems are exaggerated”), and E4 (“attention to the greenhouse effect is exaggerated”). A higher interest in varying the daily routine is reflected in lower than average scores for V4 (“I prefer a clearly structured, repetitive daily schedule”), V5 (“rituals give me a feeling of control and security”), and V27 (“when commuting I always take the same route”) and higher than average scores for V24 (“I like to try new routes to familiar destinations”) and V25 (“I sometimes take a longer route to see something new”).
ConCluSion anD outlook
The aim of this paper is to investigate how travelers’ attitudes toward the environment and variety seeking affect mode choice. Therefore, attitudes were measured by using psychometric scales and incor-
porated into simultaneously estimated latent variable mode choice models. For three latent variables—concern about environmental problems, denial of environmental issues, and interest in varying one’s daily routine—a significant influence on mode choice was found.
The effect of environmental attitudes follow the expected patterns: high awareness of environmental problems is related to an increased probability for choosing public transport, whereas a high degree of denial of environmental issues is associated with a higher likelihood of choosing to use a car.
Findings concerning the attitude toward variety seeking are new; this aspect of travel behavior has so far largely been neglected. The results of this study indicate that using a car is preferred by people with a high preference for repetitive daily schedules, whereas variety seek-ers are more likely to choose public transport. The interaction with the planning horizon is particularly interesting because shorter planning horizons are related to lower probabilities for public transport, leading to the conclusion that the planning horizon of a trip and the desire for variety in the daily schedule are different phenomena that should be modeled separately, even though at first sight they appear to be linked.
Note: — = not applicable to variable in this model.ana = not applicable because of fixed parameters.
Rieser-Schüssler and Axhausen 41
In future work, a more in-depth analysis of this relationship should be conducted. This analysis will, however, require a richer data set with more observations and additional attributes. A survey for such a data set is currently under way at the Institute for Transport Planning and Systems (IVT). The measurement of attitudes toward the environ-ment, variety seeking, and risk is being combined with a person-based, 1-week GPS diary. Because of its richness and the higher sample sizes, this data set will not only allow researchers to estimate combinations of different latent variables and to test those models with regard to their forecasting capabilities, but it will also provide the opportunity to compare the desire for variety seeking with actual variations in daily patterns. Moreover, the latent variables will be used not only in mode choice models but also in public transport connection choice models and in models for the number of trips per day.
aCknowleDgMentS
The authors thank the Swiss State Secretariat for Education and Research for funding this research, which is part of the research project Route Choice in Urban Public Transport Systems within the European Cooperation in Science and Technology (COST) Action project Buses with High Levels of Service. Special thanks go to Eveline Beutler for her support with the field work and the data entry, Claude Weis for generating the choice sets, and Aurélie Glerum for her help in setting up the models in the new BIOGEME.
referenCeS
1. Ajzen, I. The Theory of Planned Behavior. Organizational Behavior and Human Decision Processes, Vol. 50, No. 2, 1991, pp. 179–211.
2. Stern, P. C., T. Dietz, T. Abel, G. A. Guagnano, and L. Kalof. A Value-Belief-Norm Theory of Support for Social Movements: The Case of Environmental Concern. Human Ecology Review, Vol. 6, No. 2, 1999, pp. 81–97.
3. Prashker, J. N. Scaling Perceptions of Reliability of Urban Travel Modes Using Indscal and Factor Analysis Methods. Transportation Research Part A: Policy and Practice, Vol. 13, No. 3, 1979, pp. 203–212.
4. Galdames, C., A. Tudela, and J.-A. Carrasco. Exploring the Role of Psychological Factors on Mode Choice Models by a Latent Variables Approach. In Transportation Research Record: Journal of the Trans-portation Research Board, No. 2230, Transportation Research Board of the National Academies, Washington, D.C., 2011, pp. 68–74.
5. Kitamura, R., P. L. Mokhtarian, and L. Laidet. A Micro-Analysis of Land Use and Travel in Five Neighbourhoods in the San Francisco Bay Area. Transportation, Vol. No. 2, 1997, pp. 125–158.
6. Schwanen, T., and P. L. Mokhtarian. What Affects Commute Mode Choice: Neighborhood Physical Structure or Preferences Toward Neighborhoods? Journal of Transport Geography, Vol. 13, No. 1, 2005, pp. 83–99.
7. Ben-Akiva, M. E., J. L. Walker, A. T. Bernardino, D. Gopinath, T. Morikawa, and A. Polydoropoulou. Integration of Choice and Latent Variable Models. In Perpetual Motion: Travel Behavior Research Opportunities and Application Challenges (H. S. Mahmassani, ed.), Elsevier, Oxford, United Kingdom, 2002, pp. 431–470.
8. Walker, J. L., and M. E. Ben-Akiva. Generalized Random Utility Model. Mathematical Social Sciences, Vol. 43, No. 3, 2002, pp. 303–343.
9. Ben-Akiva, M. E., and B. Boccara. Discrete Choice Models with Latent Choice Sets. International Journal of Research in Marketing, Vol. 12, No. 1, 1995, pp. 9–24.
10. Atasoy, B., A. Glerum, R. Hurtubia, and M. Bierlaire. Demand for Pub-lic Transport Services: Integrating Qualitative and Quantitative Meth-ods. Presented at 10th Swiss Transport Research Conference, Ascona, Switzerland, Sept. 2010.
11. Johansson, M. V., T. Heldt, and P. Johansson. The Effects of Attitudes and Personality Traits on Mode Choice. Transportation Research Part A: Policy and Practice, Vol. 40, No. 6, 2006, pp. 507–525.
12. Atasoy, B., A. Glerum, and M. Bierlaire. Mode Choice with Attitudi-nal Latent Class: A Swiss Case-Study. Presented at 2nd International Choice Modelling Conference, Leeds, United Kingdom, July 2011.
13. Vij, A., A. Carrel, and J. L. Walker. Capturing Modality Styles Using Behavioral Mixture Models and Longitudinal Data. Presented at 2nd International Choice Modelling Conference, Leeds, United Kingdom, July 2011.
14. Tudela, A., K. M. N. Habib, J. A. Carrasco, and A. O. Osman. Incorpo-rating the Explicit Role of Psychological Factors on Mode Choice: A Hybrid Mode Choice Model by Using Data from an Innovative Psycho-metric Survey. Presented at 2nd International Choice Modelling Confer-ence, Leeds, United Kingdom, July 2011.
15. Tsirimpa, A., A. Polydoropoulou, and C. Antoniou. Development of a Latent Variable Model to Capture the Impact of Risk Aversion on Trav-elers’ Switching Behavior. Journal of Choice Modelling, Vol. 3, No. 1, 2010, pp. 127–148.
16. Abou Zeid, M., M. E. Ben-Akiva, M. Bierlaire, C. F. Choudhury, and S. Hess. Attitudes and Value of Time Heterogeneity. Presented at 90th Annual Meeting of the Transportation Research Board, Washington, D.C., 2011.
17. Walker, J. L., and J. Li. Latent Lifestyle Preferences and Household Location Decisions. Journal of Geographical Systems, Vol. 9, No. 1, 2007, pp. 77–101.
18. La Paix, L., M. Bierlaire, E. Cherchi, and A. Monzón. How Urban Envi-ronment Affects Travel Behavior? Integrated Choice and Latent Vari-able Model for Travel Schedules. Presented at 2nd International Choice Modelling Conference, Leeds, United Kingdom, July 2011.
19. Rieser-Schüssler, N., and K. W. Axhausen. Combining GPS Travel Dia-ries with Psychometric Scales. Presented at 9th International Conference on Survey Methods in Transport, Termas de Puyehue, Chile, Nov. 2011.
20. Weis, C., C. Dobler, and K. W. Axhausen. Stated Adaptation Survey of Activity Scheduling Reactions to Changing Travel Conditions: Field Work and Preliminary Results. Presented at 12th World Conference on Transportation Research, Lisbon, Portugal, July 2010.
21. Dunlap, R. E., and K. D. van Liere. The “New Environmental Paradigm”: A Proposed Measuring Instrument and Preliminary Results. Journal of Environmental Education, Vol. 9, 1978, pp. 10–19.
22. Schultz, P. W. The Structure of Environmental Concern: Concern for Self, Other People, and the Biosphere. Journal of Environmental Psy-chology, Vol. 21, No. 4, 2001, pp. 327–339.
23. Gatersleben, B., L. Steg, and C. Vlek. Measurement and Determinants of Environmentally Significant Consumer Behavior. Environment and Behavior, Vol. 34, No. 3, 2002, pp. 335–362.
24. Anable, J. “Complacent Car Addicts” or “Aspiring Environmentalists”? Identifying Travel Behavior Segments Using Attitude Theory. Trans-port Policy, Vol. 12, No. 1, 2005, pp. 65–78.
25. Mokhtarian, P. L., and I. Salomon. How Derived Is the Demand for Travel? Some Conceptual and Measurement Considerations. Trans-portation Research Part A: Policy and Practice, Vol. 3, No. 8, 2001, pp. 695–719.
26. Bello, D. C., and M. J. Etzel. The Role of Novelty in the Pleasure Travel Experience. Journal of Travel Research, Vol. 24, No. 1, 1985, pp. 20–26.
27. Niininen, O., E. Szivas, and M. Riley. Destination Loyalty and Repeat Behavior: An Application of Optimum Stimulation Measurement. Inter-national Journal of Tourism Research, Vol. 6, No. 6, 2004, pp. 439–447.
28. Mehrabian, A., and J. A. Russell. A Measure of Arousal Seeking Ten-dency. Environment and Behavior, Vol. 5, No. 3, 1973, pp. 315–333.
29. Balmer, M., K. Meister, R. A. Waraich, A. Horni, F. Ciari, and K. W. Axhausen. Agenten-basierte Simulation für location based services. Final report. F&E Förderung: Science to Market, KTI 8443.1 ESPP-ES, Datapuls AG, IVT, ETH Zürich (Swiss Federal Institute of Technology Zurich), Zürich, Switzerland, Feb. 2010.
30. Bierlaire, M. BIOGEME: A Free Package for the Estimation of Discrete Choice Models. Presented at 3rd Swiss Transport Research Conference, Ascona, Switzerland, March 2003.
31. Bierlaire, M., and M. Fetiarson. Estimation of Discrete Choice Models: Extending BIOGEME. Presented at 9th Swiss Transport Research Conference, Ascona, Switzerland, Sept. 2009.
The Traveler Behavior and Values Committee peer-reviewed this paper.