19
Investigating the Relationship Between Ethnicity and Degree Attainment Jaki Lilly, Mark Warnes, & Berenice Rivera Macías INSPIRE
| Date post: | 02-Jan-2016 |
| Category: |
Documents |
| Upload: | katrina-cobb |
| View: | 216 times |
| Download: | 0 times |
Investigating the Relationship Between Ethnicity and Degree Attainment
Jaki Lilly, Mark Warnes, & Berenice Rivera Macías
INSPIRE

Introduction
HEA/ECU 2008 Report – Ethnicity, Gender and Degree Attainment
Whilst the report does not locate clear causes for difference in degree attainment that can be directly linked to ethnicity and gender, it describes concerns from higher education institutions (HEIs) staff and students that ethnic minority groups are marginalised. The report recommends that HEIs develop their own research projects in this area as well as taking steps to address any issues of marginalisation.
Our student population
• 20.2% ‘non-white’
• 69.0% Female (future work – how gender interacts with ethnicity)
Aims of this Workshop
• To share our work-in-progress
• To get feedback on our Model
Existing Model
HESA Classification of Ethnicity
• Based on UK Census 2001
Degree Attainment
• Used as sole measure of student achievement
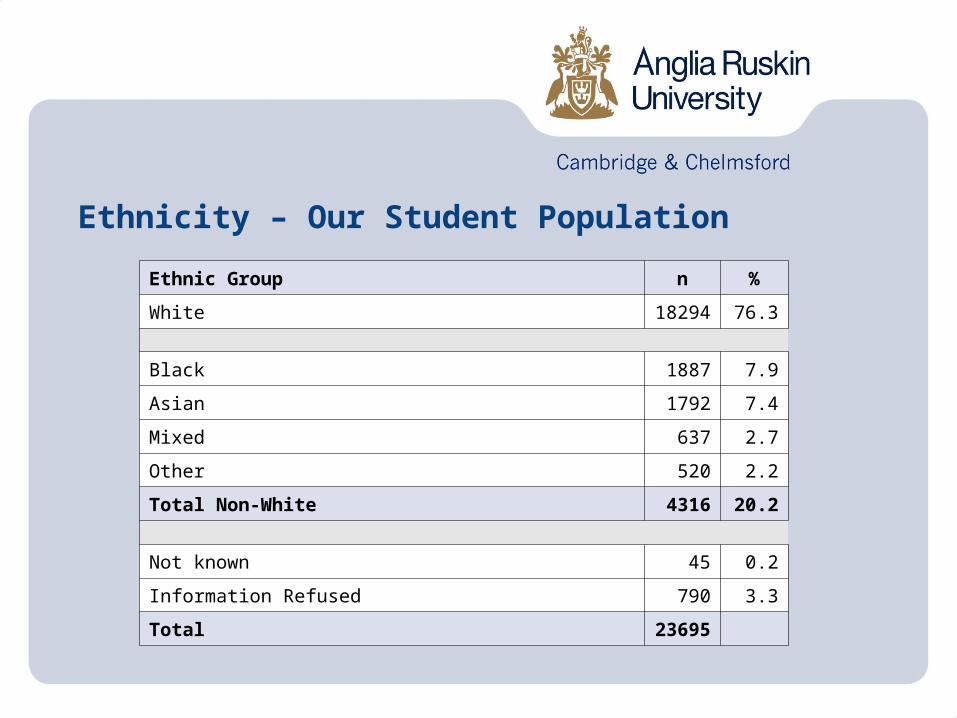
Ethnicity – Our Student Population
Ethnic Group n %
White 18294 76.3
Black 1887 7.9
Asian 1792 7.4
Mixed 637 2.7
Other 520 2.2
Total Non-White 4316 20.2
Not known 45 0.2
Information Refused 790 3.3
Total 23695
Activity 1
In groups, please look at the handout
• What does this data mean?
• What further information do we need (and how can we get it)?
• What actions should we take?
Existing Model – Our Criticisms
HESA Classification of Ethnicity
• Census classifications not fit for purpose in HE sector
• Anglo-centric and based on skin colour
• Conflates disparate groups
Student Achievement
• Only concentrates on one outcome rather than the full range of student outcomes
Ethnicity
Broad Ethnicities (Modood et al, 1997)
• Do not fully inform us about the ethnic identity of our students
• Self-description, religion, language, visits to country of origin, marriage, and choice of schools, clothes and identification with Britishness are just some of the components of ethnic identity
Ethnicity (cont.)
Anglia Ruskin Student profile
• 23,970 Students
• 5 Faculties
• 2 UK Campuses
• 11 Regional Partners
• International partner colleges in Europe, Trinidad & Malaysia
Our Model
New Classifications of Ethnicity
• Ethnicity cross-tabulated with Nationality
• Ethnicity with other dimensions…
Student Achievement
• Full range of student outcomes
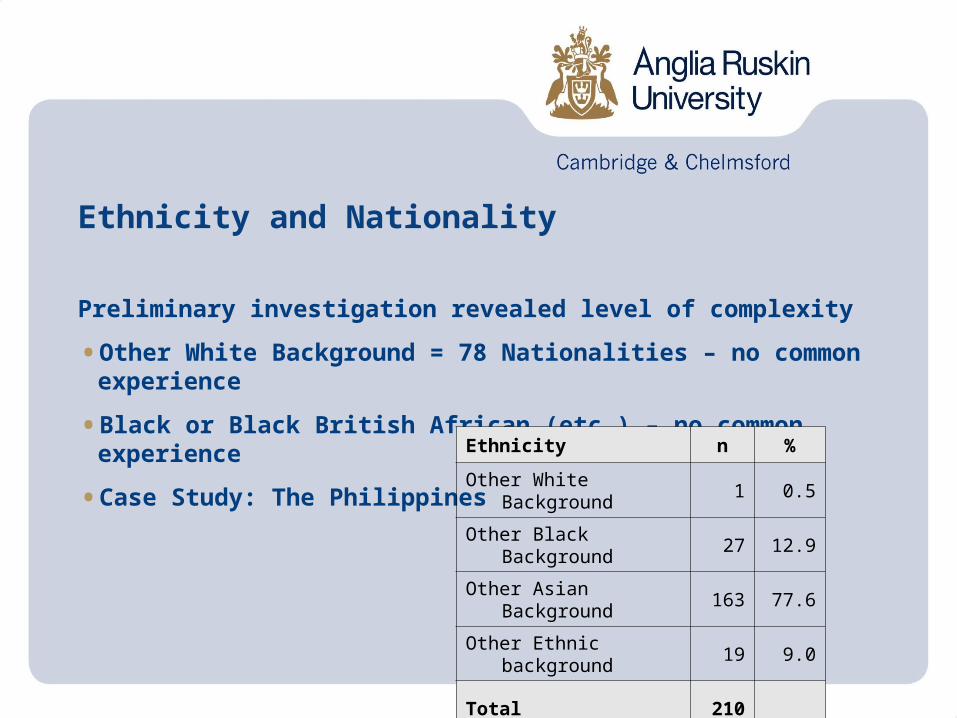
Ethnicity and Nationality
Preliminary investigation revealed level of complexity
• Other White Background = 78 Nationalities – no common experience
• Black or Black British African (etc.) – no common experience
• Case Study: The Philippines Ethnicity n %
Other White Background 1 0.5
Other Black Background 27 12.9
Other Asian Background 163 77.6
Other Ethnic background 19 9.0
Total 210
Ethnicity and Other Dimensions
We have cross-tabulated broad ethnicities with other dimensions
• Domicile
• Campus
Refining the picture
• UK-based UK Nationals by Faculty
•Numbers of students concerned become very small
2011 Census – Classification of Ethnicity
Office for National Statistics (2008) propose a suite of questions (EILR)
• Ethnicity
• (National) Identity
• Language
• Religion
• Moving in the right lines but still not convinced that this is fit-for-purpose in the HE context
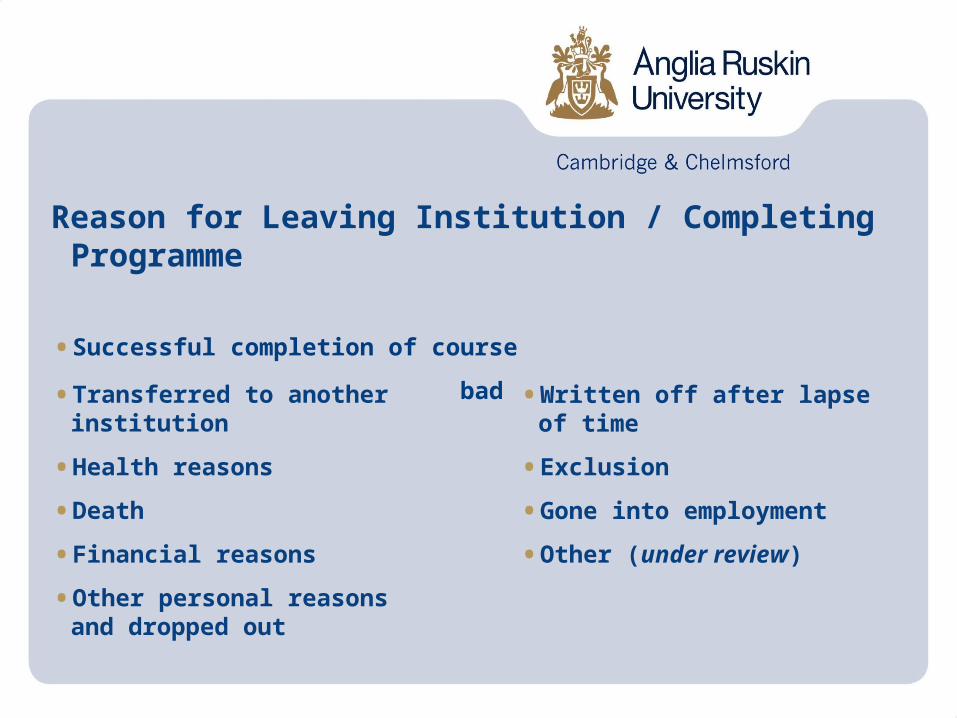
Reason for Leaving Institution / Completing Programme
• Successful completion of course
• Academic failure / left in bad standing / not permitted to progress
• Transferred to another institution
• Health reasons
• Death
• Financial reasons
• Other personal reasons and dropped out
• Written off after lapse of time
• Exclusion
• Gone into employment
• Other (under review)
Phase 2 – Qualitative Research
Not everything that can be counted counts, and not everything that counts can be counted (Einstein)
• Focus Groups
• Interviews
• Case Studies
Activity 2
Brainstorming Exercise
• Using the flip chart paper
• Suggest ways in which we can qualitatively explore ethnicity and degree attainment

Any questions?
Thank you!
References
Higher Education Academy / Equality Challenge Unit, (2008), Ethnicity, Gender and Degree Attainment Project – Final Report, available at: http://www.heacademy.ac.uk/ assets/York/documents/ourwork/research/Ethnicity_Gender_Degree_Attainment_Jan08.pdf [accessed June 09, 2008]
Modood T, Berthoud R, Berthoud R, Lakey J, Nazroo J, Smith P, Virdee S, & Beishon S, (1997), Ethnic Minorities in Britain: Diversity and Disadvantage, London: Policy Studies Institute
Office for National Statistics, (2008), Recommended questions for the 2009 Census Rehearsal and 2011 Census: Ethnic Group, London: Office for National Statistics


