81
0 INVESTIGATION INTO POSSIBLE DEMARCATION OF MORE METROPOLITAN AUTHORITIES AND THE EXTENSION OF THE MUNICIPAL AREAS OF EXISTING METROPOLITAN AREAS Municipal Demarcation Board 7 May 2008

0
INVESTIGATION INTO POSSIBLE DEMARCATION OF MORE METROPOLITAN
AUTHORITIES AND THE EXTENSION OF THE MUNICIPAL AREAS OF EXISTING
METROPOLITAN AREAS
Municipal Demarcation Board
7 May 2008

1
TABLE OF CONTENTS Summary pg 2 Understanding of the Brief: Project 1 pg 3 Methodology pg 5 Constitutional Framework pg 5 White Paper on Local Government pg 6 The Creation of Category A Municipalities pg 7 Section 24 and 25 of the Local Government: Municipal Demarcation pg 7 Act, 1998 Metropolitan Government Reorganisation 1999/2000 pg 9 District Municipalities pg 11 District-Local Tension pg 12 Municipal Demarcation Investigation 2002/3 pg 13 MCA Planners Investigation 2005 pg 17 Abolition of RSC levies pg 18 Msunduzi, Mangaung and Buffalo City Category A investigation pg 19 Metsweding District Investigation pg 56 Bibliography pg 74 Summary of Submissions pg 77 Maps pg 80

2
SUMMARY
The main recommendations of this study are as follows:
The Re-determination of Msunduzi Category B into a category A (metropolitan) municipality on the basis of its existing boundaries;
The Re-determination of Mangaung Category B into a category A (metropolitan) municipality on the basis of its existing boundaries;
The Re-determination of Buffalo City Category B into a category A (metropolitan) municipality on the basis of its existing boundaries;
Great Kei Category B should continue as an existing Category B municipality;
If Mangaung becomes a Category A municipality the remainder of Motheo district should be amalgamated with Xhariep district municipality. More detailed research is needed around this proposal;
Amatole and Umgungundlovu should continue to exist as separate district municipalities;
Kungwini Municipality should be disestablished and included in the Tshwane metropolitan municipality;
Sterkfontein, Witkoppies and Doornkloof farms in Kungwini should be disestablished and included in the Ekurhuleni metropolitan municipality;
Nokeng tsa Taemane should be disestablished and included in the Tshwane metropolitan municipality;
Metsweding District Municipality should be disestablished and included in the Tshwane metropolitan municipality.
Tables of selected indicators have been compiled to illustrate the rankings of the biggest metropolitan/urban areas in the country (table 1). The rankings indicate that the 5 big metros are still considerably bigger than Nelson Mandela, which is in turn slightly bigger than Buffalo City, Msunduzi and Mangaung. These category B municipalities are bigger than the other category B municipalities, which confirm that the Board’s decision to investigate these three municipalities for possible Category A status was the correct one.

3
Table 1. Metropolitan/Urban Areas: Rankings
Municipality Population (2007)
Population density
(persons/square km)
Opex Budget 2006/07
Capex Budget 2006/07
Number of staff 2007
Overall
Johannesburg 1 1 1 1 2 1.2
Cape Town
2 3 2 3 1 2.2 Ethekwini 3 2 3 2 3 2.6
Ekurhuleni
4 4 4 5 4 4.2 Tshwane 5 5 5 4 5 4.8
Nelson Mandela 6 7 6 6 6 6.5
Buffalo City
8 10 7 10 8 8.6
Msunduzi 9 6 8 12 9 8.8
Mangaung
7 14 9 8 7 9
Umhlathuze
13 8 12 7 11 10.2 Polokwane
10 11 11 9 15 11.2
Mbombela
11 12 14 11 14 12.4 Rustenburg
12 15 10 13 13 12.6
Mogale City
14 9 13 15 12 12.6
Sol Plaatjie
15 13 15 14 10 13.4
UNDERSTANDING OF BRIEF: PROJECT 1 It is the intention of the Municipal Demarcation Board to consider the demarcation of more metropolitan municipalities, and the extension of the municipal areas of existing metropolitan areas, where necessary. The Board had identified the following for consideration:

4
1. Re-determination of Msunduzi Category B (KZN225) into a category A (metropolitan) municipality.
2. Re-determination of Mangaung Category B (FS172) into a category A (metropolitan) municipality.
3. Re-determination of Buffalo City Category B (EC125) into a category A (metropolitan) municipality, or, alternatively, amalgamating Buffalo City and Great Kei Category B (EC123) into a metropolitan area. 4 Re-determination of the boundaries of Tshwane, Ekurhuleni, Metsweding,
Kungwini and Nokeng tsa Teamane by dividing the Metsweding district area between Tshwane and Ekurhuleni, or, alternatively, including certain farms in Kungwini/Metsweding into Tshwane and others into Ekurhuleni without the need to disestablish Metsweding, Kungwini and Nokeng tsa Taemane.
In addition the following municipalities, with, or without, the inclusion of some adjacent areas, must also be addressed in the report: 1. Rustenburg (North West) 2. Polokwane (Limpopo) 3. Sol Plaatjie (Northern Cape) 4. Mogale City (Gauteng) 5. Umhlathuze (KZN) 6. Mbombela (Mpumalanga) 7. Any other major district or Category B that may qualify to become a metropolitan municipality. The report must: 1. identify the district and/or local municipalities that may qualify to become
metropolitan municipalities, with or without the extension of their current boundaries;
2. identify the areas that can be included into the current 6 metropolitan municipalities;
3. contain specific recommendations; 4. contain details and motivation for the recommendations, which should
include, amongst others:
a description of the area to become the metropolitan area;
details to proof that each area is a conurbation featuring- a) areas of high population density; b) an intense movement of people, goods, and services; c) extensive development; and d) multiple business districts and industrial areas; e) a centre of economic activity with a complex and diverse
economy; f) a single area for which integrated development planning is
desirable; and g) having strong interdependent social and economic linkages
between its constituent units.

5
The motivation and recommendations must also be based on Sections 24 and 25 of the Municipal Demarcation Act, 1998. METHODOLOGY The Methodology used was primarily desktop analysis. An analysis was undertaken of a number of databases including that of the Municipal Demarcation Board, Statistics SA and South African Cities Network. This was supplemented by information obtained from the websites of individual municipalities. CONSTITUTIONAL FRAMEWORK Prior to 1994, no form of metropolitan government existed in South Africa. The Interim Constitution of 1993 made provision for three discrete categories of local government - metropolitan, urban and rural, with differentiated powers, functions and structures. For the interim phase, two-tier metropolitan governments were created in the three urbanised provinces, Western Cape, Gauteng and KwaZulu-Natal. In the Western Cape the Cape Metropolitan Council was established. Gauteng had four metropolitan councils namely Greater Johannesburg, Greater Pretoria, Khayalami and Lekoa Vaal. Greater Durban metro was created in KwaZulu-Natal. Metropolitan governments did break down apartheid settlement patterns to a certain extent. The demarcation of metropolitan boundaries was, however, characterised by inconsistencies between and within provinces. Most of the metros consisted of the urban core along with suburbs and black townships. Most rural areas and, in some cases, fringe towns were not included in metropolitan areas There were also a number of court cases contesting the boundary of metropolitan areas (Cameron, 1999). Unlike the interim Constitution, the final Constitution did not make provision for separate categories of metropolitan, urban and rural local government. Section 155(1) of the final Constitution makes provision for category A, B and C municipalities. The definitions are:
(a) Category A: A municipality that has exclusive municipal, executive and legislative authority in its area.
(b) Category B: A municipality that shares municipal, executive and
legislative authority, in its area, with a Category C municipality within whose area it falls.
6
(c) Category C: A municipality that has municipal, executive and
Legislative authority in an area that includes more than one municipality. WHITE PAPER ON LOCAL GOVERNMENT The White Paper gave three compelling reasons for the establishment of a metropolitan government.
To create a basis for equitable and socially just metropolitan government Metropolitan government was seen as a way of redressing the inequalities of the apartheid city whereby the urban poor were pushed to the periphery of the city. It argued that numerous studies had shown that the overall economic prosperity of metropolitan cities is greater where there is less inequality between its constituent parts.
To promote strategic land use planning, and co-ordinated public investment in physical and social infrastructure
The mismatch between municipal boundaries and the scale of economic and social activity, in the metropolitan area, often resulted in irrational land-use planning decisions and negative spillovers and externalities. A citywide metropolitan government is better able to respond to and influence metropolitan-wide spatial, social and economic trends.
To develop a citywide framework for economic and social development, and so enhance the economic competitiveness and well being of the city.
In the absence of metropolitan government, fragmented municipalities may compete for investment in an uncoordinated way. Metropolitan government is able to market the city as a whole (Provincial Affairs and Constitutional Development, 1998:14–15). The White Paper also argued that many boundaries had irrationally divided settlements, and that there was a need to create municipal institutions that recognised the linkages between urban and rural settlements. (Provincial Affairs and Constitutional Development, 1998:14–15, 96–98). The White Paper also showed a clear preference for a single-tier system of metropolitan government.

7
THE CREATION OF CATEGORY A METROPOLITAN MUNICIPALITIES The goals of the White Paper were embodied in legislation in the form of the Local Government: Municipal Structures Act, which was passed in December 1998 (RSA, 1998A). The most important change was the replacement of the two-tier metropolitan system with Category A authorities. Section 2 of the Act stated that areas, which must have single category, A municipalities are areas that can reasonably be regarded as:
(a) a conurbation featuring :- (i) areas of high population density: (ii) an intensive movement of people, goods, and services; (iii) extensive development; and (iv) multiple business districts and industrial areas;
(b) a centre of economic activity with a complex and diverse economy;
(c) a single area for which integrated development is desirable; and
(d) having strong interdependent social and economic linkages between its constituent units.
This definition is a description of metropolitan areas, which means that category A municipalities would be introduced in such areas only. SECTION 24 AND 25 OF THE LOCAL GOVERNMENT: MUNICIPAL DEMARCATION ACT, 1998
Representation and views for proposed boundary changes must be based on the criteria provided in Sections 24 and 25 of the Municipal Demarcation Act of 1998 (RSA, 1998B).
Section 24 of the Municipal Demarcation Act deals with demarcation objectives.
When the Board determines a municipal boundary, its objective must be to establish an area that would:
(a) enable the municipality, for that area, to fulfil its constitutional obligations, including —
(i) the provision of democratic and accountable government for the local communities;

8
(ii) the provision of services to the communities in an equitable and sustainable manner;
(iii) the promotion of social and economic development; and
(iv) the promotion of a safe and healthy environment;
(b) enable effective local governance;
(c) enable integrated development; and
(d) have a tax base as inclusive as possible of users of municipal services in the municipality.
Section 25 lists the factors that have to be taken into account when determining municipal boundaries. They are:
(a) the interdependence of people, communities and economics as indicated by —
(i) existing and expected patterns of human settlement and migration;
(ii) employment;
(iii) commuting and dominant transport movements;
(iv) spending;
(v) the use of amenities, recreational facilities and infrastructure; and
(vi) commercial and industrial linkages;
(b) the need for cohesive, integrated and unfragmented areas, including metropolitan areas;
(c) the financial viability and administrative capacity of the municipality to perform municipal functions efficiently and effectively;
(d) the need to share and redistribute financial and administrative resources;
(e) provincial and municipal boundaries;
(f) areas of traditional rural communities;
(g) existing and proposed functional boundaries, including magisterial districts, health, transport, police and census enumerator boundaries.
(h) existing and expected land use, social, economic and transport planning;
(i) the need for co-ordinated municipal, provincial and national programmes and services, including the needs for the administration of justice and health care;
(j) topographical, environmental and physical characteristics of the area;
(k) the administrative consequences of its boundary demarcation on —
(i) municipal creditworthiness;

9
(ii) existing municipalities, their council members and staff; and
(iii) any other relevant matter; and
(l) the need to rationalise the total number of municipalities within different categories, and of different types, to achieve the objectives of effective and sustainable service delivery, financial viability and macro-economic stability.
There was no weighting of the criteria and the Board had discretion on how to interpret them. These criteria do, to some extent, overlap and, where necessary, they will be grouped together in the section on the interpretation of the criteria. METROPOLITAN GOVERNMENT REORGANISATION 1999/ 2000 The Municipal Demarcation Board undertook a study of metropolitan areas and large Transitional Local Councils (TLCS-Municipal Demarcation Board, 1999A) in 1999 with the aim of evaluating them against the criteria for determining metropolitan areas in legislation. The urban conurbations working group was set up by the Board to examine possible metropolitan options. This committee examined SA Statistics data, most notably the 1996 census and household surveys, and also considered submissions from stakeholders. Based on its research, the Board classified possible metropolitan nodal points into four distinct groups (Municipal Demarcation Board, 1999B: 11)
Nodal points which should definitely be considered as metropolitan areas.
The big three metros, namely Johannesburg, Cape Town and Durban, fulfilled all the requirements of being classified as category A municipalities and should definitely be declared as such by the Minister.
Nodal points which should probably be considered as metropolitan areas.
It was felt that the Greater East Rand and Pretoria fulfilled, in large measure, many of the requirements of being classified as category A municipalities and should probably be declared as such.

10
Nodal points which could possibly be considered as a metropolitan area.
It was found that Greater Port Elizabeth fulfilled, in large measure, many of the requirements of being classified as category A municipalities, but not as much as the ‘probable’ category.
Nodal points which should simply be regarded as aspirant metropolitan areas.
The analysis indicated that Greater Vereeniging (Lekoa Vaal), Bloemfontein, East London, Pietermaritzburg and Richards Bay did not fulfil the criteria of being a category A municipality and should not be considered as metropolitan areas.
Originally, the aspirant metros were classified as nodal points, which should not be considered as metros. However, in order to soften the blow, they were termed ‘aspirants’. The Board handed over these recommendations to the Minister. The Constitutional Court then ruled that the determination of metropolitan areas should become the responsibility of the Board. The Board used the same set of data but abandoned the notion of nodal points and set about determining boundaries directly. The Board created 6 single-tier metropolitan authorities in the country: Greater Johannesburg Greater Durban Greater Cape Town Greater Pretoria East Rand Port Elizabeth-Uitenhage-Despatch The Board also made certain decisions around the three category B municipalities being investigated in this report. Bloemfontein-Botshabelo The Board felt that there was sufficient interdependence between Bloemfontein and Botshabelo to warrant including them in a single authority. However, its research found that the area did not conform to the criteria of a Category A municipality. In particular, it felt there was not high population density; there was more than one business district and industrial area but it cannot be classified as

11
multiple and there was a diverse economy but it was not complex, nor a centre for economic activity. The Board concluded that the area was too small in terms of size and economic activity. Pietermaritzburg-Howick The Board’s research found that, when compared with existing metropolitan areas, there was a slightly higher than average density. There was economic diversity on a smaller scale. The Board concluded that the Pietermaritzburg area was not sufficiently large or complex enough to qualify as a metropolitan area and should be a category B municipality. East London The Board found that there was development in the East London area but it was not intensive. It concluded that it was too small to be a metro in terms of size and economic activity. It felt that the Category B municipality is a best option to service existing urban areas. DISTRICT MUNICIPALITIES The White Paper on Local Government had argued that many boundaries had divided settlements irrationally, and that there was a need to create municipal institutions that recognised the linkages between urban and rural settlements. In particular, concern was raised that the service needs of farm workers, and those forcibly removed to Bantustans during apartheid, were not catered for under the existing system of rural local government. (Provincial Affairs and Constitutional Development, 1998:14–15, 96–98). The Local Government Municipal Structures Act (RSA, 1998A) embodied the spirit of the White Paper recommendations and made provision for a more hierarchical two-tier local government system in non-metropolitan areas. District councils were now called district municipalities and became the upper-tier (category C) authority. One fundamental change has been in functions, with district municipalities now assuming many responsibilities. In the past, districts had no jurisdiction in large urban towns.
At the lower-tier level, there were category B structures. Provision was made for only one form of B local government structure, namely local municipalities. The Municipal Structures Act did not distinguish between urban and rural local government. This legislation both strengthened the role of districts and proposed one integrated form of non-metropolitan local government. This two-tier system was hotly contested and district-local relationships have turned out to be one of the central issues in post-2000 non-metropolitan local government.
12
The White Paper on Local Government identified 4 roles that district municipalities should perform. Firstly, it was intended to perform district integrated development as a statutory mandate of all district governments. Secondly, they were there to serve as infrastructural development agents, which entailed the planning and development of bulk infrastructure in non-metropolitan areas. They were intended to assume the role of a district provider of regional services. Thirdly, it entailed the provision of technical services to local municipalities. Finally, it could provide services in DMAs (Community Law Centre, 2007A). These goals were captured in the Municipal Structures Act. DISTRICT-LOCAL TENSION This two-tier system was hotly contested and district-local relationships have turned out to be one of the central issues in post-2000 non-metropolitan local government. The government is strongly committed to decentralisation of powers to local government. It is however not clear whether the district or local should be the tier of local government that is the primary beneficiary of this policy. This has led to conflict between local and district municipalities about powers and functions (Cameron, 2003). This is compounded by the fact that different government departments have dissimilar views in this regard. For example, the Department of Water Affairs (DWAF) favoured strong districts while the Treasury preferred strong locals (Atkinson, 2003: 24-25). The Constitution introduced the principle of ‘shared authority’ in a district area that entailed the division of powers and functions between Category B and C municipalities. However, it became apparent that it would not be logistically possible to transfer all these functions and powers before the December 2000 elections, and the Municipal Structures Act was amended making provision for temporary authorisations of functions and powers between the district and local municipalities (RSA, 1998,2000). The Municipal Structures Amendment Act made provision for districts to provide large-scale services but in most cases the district did not perform this function (Community Law Centre, 2007A) There was also a lack of clarity about these powers and functions from 2000 until mid-2003 with the permanent location of key functions such as water and health (primary and environmental) being unclear (Cameron, 2006, Atkinson, 2003, Portfolio Committee, 2003). These temporary authorisations meant that there was great uncertainty about whether key functions would remain local functions or be transferred to be the districts. This manifested itself in uncertainty about future functions and powers, and a complex set of transitional service arrangements. A number of municipal managers argued that it was difficult to promote development under such circumstances, saying that it is difficult to plan service-delivery under such complex service-agreement arrangements. This lack of

13
clarity also contributed to the conflict between B and C municipalities (Cameron, 2006). Many category B municipalities were concerned about the stronger role given to districts in the post-2000 system. In particular they were concerned that districts would assume traditional functions of municipalities such as water, electricity and health along with sources of revenue for the first two functions. There were turf battles between B and C municipalities with B municipalities often feeling that under capacitated district municipalities were trying to dominate them. There were questions about the value of district with questions asked about the few functions performed by district municipalities. Category B municipalities, particular the bigger secondary cities, argued that there was no need for a district and that they could do all the required local government functions (Cameron, 2002). There was a general lobby of these bigger municipalities to become category A municipalities. One argument used was that if the Board classified secondary cities as aspirant metropolitan authorities, should such bodies not be reclassified as category A municipalities sooner rather than later? Within 2 years some of these aspirant metros were already clamouring for A category status (Atkinson, 2003, Cameron 2002). MUNICIPAL DEMARCATION INVESTIGATION 2002/3 It was pointed out that the Board in its original demarcation had deemed around 5 Category B municipalities as aspirant metropolitan municipalities, including Msunduzi, Mangaung and Buffalo City. While these aspirant areas were classified as having some of the characteristics of metropolitan areas, and some had significant budgets and capacity, they clearly did not meet the requirements to be classified as a category A municipality. (Municipal Demarcation Board, 2001:39). As a result of the lobbying by some B municipalities the Board embarked on a further categorisation process in 2002 and 2003(Municipal Demarcation Board, 2003). The Board did not attempt to just reclassify B and C municipalities into metropolitan areas. Rather, it released a discussion document in which it analysed existing metropolitan and large category B areas. The Board report assessed the criteria for metropolitan areas. The conclusions, which are of relevance to this study, will be discussed below. The analysis was based on 2002 data. Density/Size Key population Trends

14
The 6 metros, Cape Town, Ethekwini, Johannesburg, Ekurhuleni, Tshwane and Nelson Mandela had the largest populations, ranging between 1 and 3 million people;
The Buffalo City, Emfuleni, Mangaung, Polokwane, Msunduzi, Matjihabeng and Mbombela cities had populations ranging between 1 and 3 million people.
Key Density Trends
All the metropolitan areas, except Nelson Mandela, had the highest densities of 1000 persons per square kilometre or more;
Areas with densities between 250 and 1000 persons per square kilometres included Msunduzi, Emfuleni, Nelson Mandela, Umhlathuze, Buffalo City.
Mangaung had a density of 104 km kilometres2. Extensive Development Including Urban Centres Areas with high urban population
Cape Town (99%),
Newcastle (78%
Buffalo City (77%) Urban Areas Areas with a small (50% or less) urban area
Msunduzi (50%)
Ekurhuleni (41%
eThekwini (24%)
Mafikeng (23%)
Nelson Mandela (16%)
Mogale City (12%)
Polokwane (5%).

15
Areas with largest urban areas
Sol Plaatjie (98%)
Emfuleni (97%)
Matjhabeng (93%)
Mangaung (91%) Urban Cores/Nodes Biggest Centres Johannesburg (11) eThekwini (9) Ekurhuleni (9) Msunduzi (8) Cape Town(7) Matjhabeng (7) Tshwane (6) Nelson Mandela (6) Polokwane (6) uMhathuze (6) Sol Plaatjie (6) Mogale City (5) Buffalo City (4) Emfuleni (4) Mangaung (4) Mbombela (4) King Sabata (4) Klerksdorp (4) Newcastle (4) Complex and Diverse Economy The 6 metros along with Mbombela and Buffalo City were characterised as Diverse. Mangaung, Msunduzi, Sol Plaatjie were characterized as borderline diverse. Government Capacity Capital Budgets
Metros with the exception of Nelson Mandela had largest capital budgets.
All category B municipality’s capital budgets except Buffalo City were less than R 200 million per annum.

16
Operating Budgets
Metros have the largest operating budget.
All category B municipalities (that were examined in the study) had operating budgets that were examined were exare less than R 1 billion per annum.
Rates Base
Metros have the largest rates base.
All category B municipality’s rates income are less than R 200 million per annum.
Number of Municipal Staff
Metros have the largest amount of staff all with over 7,500 employees.
All category B municipalities have less than 5,000 staff. Based on this the information the Board classified urban municipalities into 4 different categories. While supporting the notion that category B municipalities should grow into metropolitan areas, the Board was of the view that none of the category B municipalities appear to be ready to be classified into metro areas. For example, statistics revealed that none of these B categories had populations over 1 million, the densities of these areas were somewhat lower than metros and these areas did not have a complex and diverse economy. All the municipalities with the potential to be metro areas happen to be provincial capitals, which were not yet metros. They were Buffalo City (formerly East London) in the Eastern Cape, Mbombela (formerly Nelspruit) in Mpumalanga, Mangaung (formerly Bloemfontein) in Free State, Msunduzi (formerly Pietermaritzburg) in Kea-Zulu Natal, Sol Plaatjie (formerly Kimberley) in the Northern Cape and Polokwane (formerly Pietersburg) in Limpopo. The only provincial capital which did not fall into this potential metro category was Mafikeng in the North West province. It recommended that there should be an individual assessment of the abovementioned category B category municipalities to see whether they should be reclassified as metropolitan municipalities.. As an alternative option it was suggested that some kind of intermediate status could be considered for these provincial capitals in which their revenue sources, along with their powers and functions, were not split and their status is elevated to just below a metro but higher than a Category B municipality.

17
Importantly, the Board suggested that if more metros were created, it would not involve a return to the ‘brick and mortar’ approach to metros, which would entail the expunging of rural areas from metros. The experience of the Nelson Mandela metro which saw the resources for rural development in the Western Services District Council vanish overnight was still too fresh. Rather, it was suggested that if metros were to be created, it should consist of their entire jurisdictions, urban and rural. MCA PLANNERS INVESTIGATION, 2005. The MDB appointed MCA Planners in 2005 to conduct a study to assist it in developing a coherent and clear policy position on the demarcation and establishment of metropolitan municipalities. The study was to have four components:
One: An assessment of the performance of the existing metropolitan areas, as well as an overview of their ability to come to grips and ably respond to the challenges facing them and a “profiling” of the existing metros vis-à-vis these aspirant metros;
Two: An overview of experiences of relevant international examples of metropolitan governments, with a focus on lessons to be incorporated in the evaluation of the existing practices regarding the demarcation and establishment of metropolitan municipalities in South Africa;
Three: An assessment of the need and desirability for the further demarcation and establishment of metropolitan municipalities in South Africa in the light of the local and international experiences covered in the report; and
Four: Recommendations on the establishment and demarcation of metropolitan municipalities and the retention or amendment of the existing set of criteria for the demarcation and establishment of such municipalities.
A number of recommendations were made and the most important will be briefly discussed below. 1/ Before embarking on the process of demarcating and establishing a metropolitan municipality a thorough audit of the reasons for the request should be made and ways sought of addressing the concerns/issues raised within the existing dispensation in the form of improved intergovernmental coordination, integration and alignment. Likewise, a careful analysis of what the perceived gains of the requested metro demarcation, and the likelihood of their realisation, needs to be undertaken. 2/ The initial ideals of sharing, pooling and redistributing resources between municipalities need to be re-emphasised. Once this has been done the inward focus in some aspirant metropolitan municipalities may be lessened and the desire to “go it alone”, be reduced. Furthermore, before a metropolitan option is

18
considered, alternatives such as “tax-base sharing”, “Special purpose districts” and “Voluntary cooperation” should first be considered. 3/ Should a new metropolitan municipality be established, the process of transformation would need to be carefully planned and the implementation monitored by provincial government to ensure as smooth a changeover as possible. Simple solutions need to be avoided by giving careful consideration to different models. It may just be that a two-tier model in which, for instance, resource sharing and coordinated infrastructure, land use and transport planning takes place at the centre, but with substructures providing for meaningful community participation and, where more locally-focused attention is possible, could in some cases be a more suitable option than the single-tier model. 4/ In the absence of clarity on the future of the RSC levies and how their income streams will be replaced, no further demarcation processes should be embarked upon until the issue is resolved.
On the basis of this report the Board decided not to establish any more metropolitan authorities. THE ABOLITION OF RSC LEVIES RSC levies were introduced in the mid-1980s as an extra source of income for local government. Even during apartheid days, RSC levies were criticised for being inefficient taxes. Already, in 2002, a research project into the two-tier governmental system had found that many of the B municipalities’ arguments in favour of a category A structure was simply about retaining RSC levies within the core town and not about spreading them to needier poorer areas in other rural parts of the district municipalities (in many districts most of the RSCs levies are generated in the core town’s commercial and industrial areas). RSC levies are the lifeblood of district municipalities and if secondary cities, with narrowly drawn boundaries, become category A municipalities, district municipalities, the traditional service providers in rural areas, would lose a substantial portion of its income. It was argued that the future of RSC levies had to be sorted out before there was any change in structure (Cameron, 2002) RSC levies were abolished on 30 June 2006 and replaced by a government grant for 3 years until new revenue sources were introduced. This cleared the way for the Board to launch a new investigation into potential Category A municipalities.

19
MSUNDUZI, MANGAUNG AND BUFFALO CITY CATEGORY A INVESTIGATION BACKGROUND TO INVESTIGATION The Municipal Demarcation Board issued a Section 26 notice calling for the proposed determination of Msunduzi, Mangaung and Buffalo City to be category A municipalities. The Board then identified the following for consideration: 1. Re-determination of Msunduzi Category B (KZN225) into a category A
(metropolitan) municipality. 2. Re-determination of Mangaung Category B (FS172) into a category A
(metropolitan) municipality. 3. Re-determination of Buffalo City Category B (EC125) into a category A
(metropolitan) municipality, or, alternatively, amalgamating Buffalo City and Great Kei Category B (EC123) into a metropolitan area.
In addition the following municipalities, with, or without, the inclusion of some adjacent areas, must also be addressed in the report: 8. Rustenburg (North West) 9. Polokwane (Limpopo) 10. Kimberley (Northern Cape) 11. Mogale City (Gauteng) 12. Umhlathuze (KZN) 13. Mbombela (Mpumalanga) Any other major district, or local, municipality that may qualify to become a metropolitan municipality. The brief of this report was to compare these three category B municipalities with existing metropolitan governments as well as with other category B municipalities in order to ascertain the former municipalities’ potential status. The analysis of the metro status of these municipalities will accordingly be done concurrently. RELEVANT LEGISLATION Application of Category A Criteria in the Municipal Structures Act The Section 2 criteria of the Municipal Structures Act which lays down the criteria for areas to be considered as category A municipalities has already been described earlier in the report.

20
These features will now be applied: (b) a conurbation featuring :-
a. areas of high population density:
Table 2. Age Group Figures
Source. Statistics SA, Community Survey, 2007.
The updated 2007 population figures in Table 2 indicate that the big 5 metros have populations ranging from 2,3 million in Tshwane to 3,8 million in Johannesburg. The smaller metro, Nelson Mandela has a population of 1,05 million. The populations of the three Category B municipalities under investigation are Buffalo City, 724 312, Mangaung 713 199 and Msunduzi 616 733 which are higher than any of the other category B municipalities listed above. When it comes to age it can be seen that the B category municipalities generally have a higher percentage of young persons (0-19 years) category than in the metros. Buffalo City, Mangaung and Msunduzi all have a higher percentage than the metros.
Municipality Age groups
0-19 20-64 65 and older Total
Number % Number % Number %
Ethekwini 1 281 535 36.95 2 033 560 58.64 152 992 4.41 3 468 087 Ekurhuleni Metro 919 894 33.77 1 692 740 62.14 111 593 4.1 2 724 227 Nelson Mandela 369 353 35.15 623 452 59.32 176 678 16.81 1 050 934
Tshwane 780 002 33.25 1 462 310 62.33 103 597 4.42 2 345 909
Cape Town 1 220 975 34.91 2 083 049 59.57 193 077 5.52 3 497 101
Johannesburg 1 257 696 32.35 2 441 043 62.78 189 443 4.87 3 888 182
Buffalo City 269433 37 413937 57 40938 6 724308
Mangaung 285640 40.05 427559 59.95 39707 5.57 713199
Msunduzi 241 391 39.14 345 103 55.96 30 239 4.9 616 733
Mbombela 229 806 43.59 274 553 52.08 22 839 4.33 527 198
Polokwane 262 071 46.65 270 420 48.14 29 292 5.21 561 783
Rustenburg 139 277 30.97 294 001 65.37 16 493 3.67 449 771
Mogale City 108 247 33.87 196 604 61.51 14 782 4.62 319 633
Umhlathuze 144 313 43.45 177 481 53.43 10 360 3.12 332 154
Sol Plaatjie 89 024 36.63 137 399 56.54 16 592 6.83 243 015

21
The metros generally have a higher percentage in the 20 to 64-age bracket. Buffalo City (57%) and Msunduzi (55,96%) have a lower percentage than all the metros. Mangaung (59,95%) has a higher percentage than Cape Town, Nelson Mandela and eThekwini. Table 3. Urban/Rural Households Municipality No. of rural
households Percentage of rural
households No. of urban households
Percentage of urban households
Ethekwini 363866 11.78 2726257 88.22 Ekurhuleni 28887 1.17 2449241 98.83
Nelson Mandela 28821 2.87 976957 97.13 Tshwane 203313 10.23 1783844 89.77
Cape Town 20399 0.71 2871844 99.29 Johannesburg 32698 1.01 3193114 98.99
Buffalo City 41 413 21.68 149 631 78.32
Mangaung 8 844 4.78 176 175 95.22
Msunduzi 27467 21.06 102930 78.94
Polokwane 79574 63.67 45406 36.33
Rustenburg 62299 53.44 54278 46.56
Mbombela 78240 69.97 33586 30.03
Mogale City 9304 12.28 66465 87.72
Umhlathuze 42109 62.73 25020 37.27
Sol Plaatjie 1422 2.83 48828 97.17
Source. Municipal Demarcation Board, 2008. Statistics SA, 2001 Census
In the 2007 community survey there is data available on households, It does not however not give the breakdown between rural and urban households. The information above on rural and urban is from the 2001 census data which distinguished between urban and rural households. The percentage of urban households is crucial for the purpose of determining whether an area should be a metro or not. The percentage urban households is high in the Mangaung (95,22%), Msunduzi (78,94%) and Buffalo City (78,32%). The urban levels of Mangaung are higher than any other category B being investigated except for Sol Plaatjie (97,17%). The urban levels of Buffalo City and Mzunduzi are higher than the other category A municipalities being investigated except for Sol Plaatjie and Mogale City (87,22%).

22
The percentage rural households is low in the three B municipalities under investigation. The totals are 21,68% in Buffalo City, 21,06% in Msunduzi and 4,78% in Mangaung. The fact that these 3 municipalities are over 70% urbanised is an argument in favour of creating metropolitan governments in these municipalities. Table 4. Population Density Municipality Population
2007 Geographical Area (square km)
Population density (persons/square km)
Ethekwini 3468086 2291.9 1513
Ekurhuleni Metro
2724229 1924.4 1416
Nelson Mandela
1050930 1958.9 536
Tshwane 2345908 2174.6 1079
Cape Town 3497097 2454.7 1425
Johannesburg 3888180 1645.0 2364
Buffalo City 724 312 2527.8 287
Mangaung 752 906 6284.0 120
Msunduzi 616730 633.8 973
Mbombela 561772 3411.8 165
Polokwane 449776 3766.0 119
Rustenburg 527203 3423.2 154
Mogale City 319641 1099.3 291
Umhlathuze 332156 793.2 419
Sol Plaatjie 243018 1877.1 129
Source. Statistics SA, Community Survey, 2007, Municipal Demarcation Board, 2008.
The geographical area of the municipalities is unrelated to the metropolitan status of municipalities. For example Mangaung, a category B municipality has the largest size of all of the municipalities with. 6284 km2. Conversely, another category B municipality, Msunduzi, has the smallest size with 633, 8 km2. The population density is a clearer indicator of metropolitan status. The big 5 metros have a density of more than 1000 km2. The smaller metro’s density, Nelson Mandela, is 536 km2. This is smaller than Msunduzi with 973 km2 . Buffalo City has density of 287 km2, which is lower than Mogale City and Umhlathuze.

23
Because of its large geographical size, Mangaung has the lowest density of all the municipalities with 120 km2.
Table 5. Type of Dwelling
Source: Statistics SA, Community Survey 2007.
As far as housing is concerned, one of the key characteristics is the far greater percentage of households staying in higher density dwellings in metros than in the Category B municipalities. All the metros, except Ekurhuleni and Tshwane, have more than 10% density levels. There are exceptions to this. Msunduzi (12,64%) and Umhlathuze (11,04) have far greater levels of density than Nelson Mandela (10,3), Ekurhuleni (8,9) and Tshwane (8,02%) Buffalo City’s density (7,8%) is marginally less than Ekurhuleni and Tshwane while that of Mangaung is 5,33%. The percentage traditional dwellings is generally higher in Category B municipalities. Msunduzi has 19,92% traditional dwellings and Umhlathuze 15,52%. All the metros except Ethekwini (6,43%) have less than 1% traditional dwellings. Buffalo City has 4,5% traditional dwellings while that of Mangaung is 3,16%.
Municipality House or brick structure on a
separate stand or yard
Traditional dwelling/hut/
structure made of traditional materials Flat in block of flats
Town/cluster/semi- detached house
Higher density
total
N % N % N % N % %
Ethekwini 438 563 52.59 53 587 6.43 86 565 10.38 39 754 4.77 15.15
Ekurhuleni Metro
466 210 54.89 1 035 0.12 44 128 5.2 31 434 3.7 8.9
Nelson Mandela
204 049 73.7 1 882 0.68 17 099 6.18 11 399 4.12 10.3
Tshwane 369 347 53.79 3 480 0.51 55 080 8.02 33 994 4.95 8.02
Cape Town 594 429 65.88 3 511 0.39 82 519 9.15 57 501 6.37 15.52
Johannesburg 611588 52.49 4 158 0.36 109 071 9.36 73 583 6.31 15.67
Buffalo City 122563 58.81 9363 4.5 12715 6.1 3511 1.7 7.8
Mangaung 139 022 68.56 6 412 3.16 6 322 3.12 4 483 2.21 5.33
Msunduzi 81 746 60.83 26 775 19.92 13 960 10.39 3 030 2.25 12.64
Mbombela 108 942 79.32 4 757 3.46 5 370 3.91 1 505 1.1 5.01
Polokwane 97 043 74.44 3 292 2.53 4 735 3.63 1 358 1.04 4.67
Rustenburg 61 478 41.95 1 382 0.94 2 919 1.99 874 0.6 2.6
Mogale City 54 115 57.39 0 0 2 055 2.18 3 853 4.09 6.27
Nokeng tsa Taemane
7 821 52.72 232 1.56 291 1.96 844 5.69 7.65
Kungwini 18 877 59.61 1 067 3.37 636 2.01 170 0.54 2.55
Umhlathuze 53 749 66.35 12 319 15.21 7 398 9.13 1 547 1.91 11.04
Sol Plaatjie 43 660 83.77 77 0.15 557 1.06 1 513 2.9 3.96

24
(ii)an intensive movement of people, goods, and services; (iii)extensive development; and (iv)multiple business districts and industrial areas
Table 6. Urban Centres/ Nodes
Municipality Total Centres
1 Big Centres 2 Smaller Centres
Number Names Number Names
Ethekwini 9 2 Durban
Pinetown 7
Umkomaas Amanzimtoti
Isipingo/ Prospecton
Tongaat Verulam Westville Hillcrest
Ekurhuleni 9 4
Alberton Benoni
Germiston Kempton Park
Boksburg Brakpan
Edenvale/ Modderfontein
Nigel Springs
Nelson Mandela
6 1 Port Elizabeth 5
Uitenhage Despatch
Blue Horizon Seaview
Motherwell
Tshwane 6 2 Pretoria
Centurion 4
Rosslyn Soshanguve
Hammanskraal Winterveldt
Cape Town 7 3 Cape Town
Belville Claremont
4
Tygerburg Hout Bay
Lansdowne Milnerton
Johannesburg 11 2 Johannesburg
Midrand 9
Roodepoort Randburg Diepsloot Sandton
Rosebank Killarney
Melrose Arch Sunninghill
Soweto
Buffalo City 4 2 East London King Williams
Town 2
Bisho Mdantsane

25
Mangaung 4 1 Bloemfontein 3 Thaba Nchu Mangaung Botshabelo
Msunduzi 8 2 Pietermaritzburg Ashburton
6
Claridge Elandskop Kanzakane
Sweet Waters Taylors Halt Thornville (Howick) (Hilton)
Mbombela 4 1 Nelspruit 3 Rocky's Drift White River Hazyview
Polokwane 6 1 Pietersburg 5
Mankweng Moletji/Matlala
Dikgale/ Soekmekaar Haenesburg
Maraba/ Mashashane/Maj
a
Rustenburg 2 1 Rustenburg 1 Marikana
Mogale City 5 1 Krugersdorp 4
Kasigo Munsieville Muldersdfrit Azaadville
Umhlathuze 6 2 Empangeni
Richards Bay 4
Nseleni eSikhawini
Ngwelezane Vulindlela
Sol Plaatjie 6 1 Kimberley 5
Ritchie Modderfontein
Spytfontein Ronalds Vlei
Riverton
Source Municipal Demarcation Board, 2003.
Urban/nodes centres are an indication of commercial and industrial areas. They are also a reflection of development. The metros generally have higher numbers of urban nodes/centres than the non-metros. This ranges from 6 in Tshwane and Nelson Mandela to 11 in Johannesburg. This however, is not a consistent pattern. Msunduzi has 8 centres while Umhlathuze and Sol Plaatjie have 6 nodes/centres each. If one looks at big centres only, there is a similar pattern of higher numbers of urban nodes/centres in metros. However, there are also exceptions. Metro Nelson Mandela has 1 node/centre while non-metro Buffalo City and Msunduzi have 2 big centres. Mangaung has 1 big centre.
26
Table 7: Relative Importance of Sectors of Employment
Municipality Agricultu
re, hunting, forestry
and fishing
%
Mining and
quarrying %
Manufacturing %
Electricity, gas
and water
supply %
Construction %
Wholesale and retail trade
%
Transport, storage and
communication %
Financial, insurance
real estate
and business services
%
Community, social and personal
services %
Other and not adequat
ely defined
%
Unspecified %
Not applicable
%
Ethekwini 0.40 0.12 7.78 0.37 2.77 6.56 2.12 5.68 6.13 4.01 6.11 57.96
Ekurhuleni Metro
0.34 0.75 11.42 0.47 2.83 7.35 3.01 6.54 5.92 4.38 6.66 50.31
Nelson Mandela
0.36 0.15 8.28 0.25 2.64 5.24 1.48 4.17 5.52 3.22 5.45 63.25
Tshwane 0.22 0.21 6.97 0.42 3.64 7.06 2.14 7.84 8.23 5.38 9.93 47.97
Cape Town 0.50 0.12 7.70 0.43 3.38 7.58 2.00 6.66 6.64 3.66 13.06 48.27
Johannesburg 0.27 0.48 7.24 0.47 2.86 7.98 2.47 9.28 6.77 4.75 8.99 48.46
Mogale 1.33 0.71 8.66 0.58 3.30 7.84 2.14 7.02 6.77 6.01 7.13 48.52
Buffalo City 0.41 0.08 4.63 0.20 2.23 4.64 1.26 3.54 6.39 3.33 9.27 64.03
Mangaung 0.48 0.16 5.72 0.39 3.22 6.19 1.95 4.35 8.02 4.06 8.66 56.78
Msunduzi 0.26 0.37 6.01 0.34 1.84 4.47 1.60 3.95 7.58 3.00 8.60 61.97
Mbombela 1.83 0.56 6.18 0.40 3.84 6.74 1.67 6.00 7.01 7.25 7.51 51.03
Polokwane 0.51 0.19 4.45 0.45 2.08 5.15 1.22 3.99 7.19 4.08 5.46 65.22
Rustenburg 0.78 19.59 2.52 0.15 1.84 4.15 1.76 2.81 4.36 3.00 7.89 51.15
Umhlathuze 1.63 0.92 6.03 0.35 2.57 5.40 2.00 4.31 7.02 2.91 5.95 60.91
Sol Plaatjie 0.10 1.03 3.43 0.16 1.81 4.88 1.59 4.01 8.16 3.65 8.78 62.39
Source: Statistics SA, Community Survey, 2007.
The most common sectors of employment in the metros are:
Manufacturing (ranging from 6,97 in Tshwane to 11,42 in Ekurhuleni)
Wholesale and retail trade (ranging from 5,24% in Nelson Mandela to 7,98% in Johannesburg)
Financial, insurance, real estate and business services (ranging from 4,17% to Nelson Mandela to 9,28% in Johannesburg).
Community, social and personal services (ranging from 4,01% in Ethekwini to 4,75% in Johannesburg).
The most common employment sectors in the three Category B municipalities under investigation are:
Manufacturing: Buffalo City 4,63% Mangaung 5,72%

27
Msunduzi 6,01%
Wholesale and retail trade Buffalo City 4,64% Mangaung 6,19% Msunduzi 4,47%
Financial, insurance, real estate and business services Buffalo City 7,02%
Mangaung 4,35% Msunduzi 3,95%
Community, social and personal services Buffalo City 6,39 %
Mangaung 8,02% Msunduzi 7,58%
It can be seen that manufacturing has a lesser percentage share of employment in the three category B municipalities compared to the metros. When it comes to wholesale and retail trade, non-metro Mangaung has a higher percentage than metro Nelson Mandela. Buffalo City’s and Mangaung’s share is just slightly smaller than Nelson Mandela’s. An analysis of financial, insurance, real estate and business services indicated that the metros have a higher share than the three category B municipalities although all threes’ shares are just slightly lower than Nelson Mandela. Finally, there is little difference when it comes to community, social and personal services.
There is also a specific report dealing with the Pietermaritzburg economy. It points out that the economy of the area has more than doubled, in terms of turnover, in the last three years. There has been extensive development in the Msunduzi region (University of KwaZulu-Natal 2008).
What this evidence indicates is that these category B municipalities substantively fulfil the criteria of being a centre of economic activity with a complex and diverse economy.
Another indication of development and economic activity is urban areas contribution to the national economy.

28
Table 8. Urban Areas Contribution to National Economy Municipality GVA total Percentage
of National GVA
Ethekwini 122116536,40 10,00
Ekurhuleni 86392597,19 7,08
Nelson Mandela 35920783,70 2,94
Tshwane 112293408,88 9,20
Cape Town 137148900,43 11,23
Johannesburg 221376293,10 18,13
Buffalo City 14730296,29 1,21
Mangaung 26168496,21 2,14
Msunduzi 9023335,53 0,74
Mbombela 6317488,75 0,52
Rustenburg 8448529,30 0,69
Mogale City 6747314,96 0,55
Umhlathuze 6045538,32 0,50
Kimberley/Sol Plaatjie 4713530,19 0,39
Source. South African Cities Network, 2006
The big metros contribute most of the GVA Geographical Value Added (GVA) total. Johannesburg contributes 18,13%, Cape Town, 11,23%, eThekwini 10%, Tshwane 9,2% and Ekurhuleni 7,08%. Nelson Mandela contributes 2,94%, which is marginally above the non-metro Mangaung with 2,14%. Buffalo City with 1,21% and Msunduzi with 0,74% are some way back. The next biggest contribution is Rustenburg with 0,69%.
(c) a single area for which integrated development is desirable;
If a metropolitan government is created, it would facilitate integrated development within its jurisdiction. By the same token, integrated development is also a function of district municipalities (Community Law Centre, 2007B:11)
What tilts the argument in favour of creating a Category A of government is the division of functions and powers between B and C municipalities which has led to overlap and duplication between local and district municipalities. This is particularly pronounced in bigger B municipalities.
For example Mangaung in its Integrated Development Plan (2007: 19) points out that there is currently concern that it would lose powers and functions to C municipalities. It stated that the reclassification of the municipality into Category
29
A municipalities would remove some of this uncertainty. This would reduce administrative problems.
(d) having strong interdependent social and economic linkages
between its constituent units. It is argued that there are strong social and economic linkages between the constituent units. This will be discussed more comprehensively in Section 25 (a) of the Demarcation Act, interdependence of people, communities and economies. Application of Section 24 and 25 of the Municipal Demarcation Act
Section 24 deals with the objectives of the Municipal Demarcation Act and Section 25 lists the factors that need to be taken into account when determining municipal boundaries.
These objectives/factors were described at the beginning of the report and will not be repeated here. They will not be analysed individually. Rather they will be grouped into categories for the sake of convenience.
Section 24 states that when the Board determines a municipal boundary, its objective must be to establish an area that would:
(a) enable the municipality for that area to fulfil its constitutional
obligations, including —
(i) the provision of democratic and accountable government for the local communities;
(b) enable effective local government

30
Table 9. Number of councillors and wards. Municipality Number
of wards Number of councillors
Ethekwini 100 200
Ekurhuleni 88 175
Nelson Mandela 60 120
Tshwane 76 152
Cape Town 105 210
Johannesburg 109 217
Buffalo City 45 89
Mangaung 45 89
Msunduzi 37 73
Mbombela 37 71
Polokwane 36 73
Rustenburg 36 72
Mogale City 24 64
Umhlathuze 30 60
Kimberley/Sol Plaatjie 28 55
Source Municipal Demarcation Board, 2008, Independent Electoral Commission, 2008.
The number of councillors are set by the Minister of Provincial and Local Government based on registered voters although the Provincial Ministers of Local Government have a 10% variation that they could utilise. It can be seen that the metropolitan municipalities have substantially more councillors than B municipalities although there are distinctions between them. Johannesburg, Cape Town and Ethekwini have 200 councillors or more. Ekurhuleni has 175 councillors, Tshwane 152 and Nelson Mandela 120. Buffalo City and Mangaung have 89 councillors each while Msunduzi has 73 councillors which is the same number as Polokwane. The large number of councillors in these three municipalities suggests that democratic local government is being promoted. However measuring the number of councillors is in some way a blunt instrument. It is the quality rather than the quantity of public participation that counts. The three Category B municipalities have well developed systems of public participation in their integrated development plans. All have functioning ward committee systems. Evidence received has suggested that the two-tier system has led to duplication of structures, shared powers and functions and blurred accountability in these

31
Category B municipalities. There are conflicting integrated development plans and local economic development plans. Having one set of councillors promoting a single set of policies in a unified Category B municipality will promote more democratic and accountable local government.
(ii) the provision of services to the communities in an equitable and sustainable manner;
Table 10. Access to Services
Municipality
Water Sanitation Electricity Refuse Removal
RDP Water
service levels
(actual)
RDP Water backlog (%)
within municipality
RDP Water
backlog as % of district
RDP Sanitation
service levels
(actual)
RDP Sanitation backlog
(%)
RDP Sanitation backlog as % of district
RDP Electricity
service levels
(actual)
RDP Electricity backlog
(%)
RDP Electricity backlog as % of district
RDP Refuse
Removal service levels
(actual)
RDP Refuse
Removal backlog
(%)
RDP Refuse
Removal backlog as % of district
Buffalo City 182356 6.23 9.35 129564 33.38 24.39 122966 36.77 37.25 141265 27.36 21.62
Mangaung 180908 4.22 91.3 94140 50.16 88.27 160369 15.09 84.51 117455 37.81 90.51
Msunduzi 127090 6.09 23.4 76646 43.36 47.21 116113 14.2 31.25 82213 39.25 41.49
Mbombela 106366 13.14 27.73 31547 74.24 32.95 87294 28.72 31.62 32044 73.83 32.94
Polokwane 112279 17.22 35.57 47370 65.08 39.6 87662 35.37 41.25 47659 64.86 38.99
Rustenburg 97205 16.68 37.5 48575 58.36 27.64 83344 28.56 38.92 51799 55.6 26.34
Mogale City 87600 2.32 51.53 69165 22.88 45.71 71359 20.43 40.13 65383 27.1 51.54
Umhlathuze 65506 10.63 9.94 35199 51.98 28.14 63549 13.3 11.47 33658 54.08 27.98
Sol Plaatjie 50774 0.64 13.3 43275 15.31 32.44 42164 17.49 47.27 46819 8.38 20.17
Source Municipal Demarcation Board, 2008
The water backlogs are relatively low in the three category B municipalities under investigation. In Buffalo City it is 6,23%, in Mangaung 4,22% and Msunduzi 6,09%. The sanitation backlogs are 33,38% in Buffalo City, 50,16% in Mangaung and 43,36% in Msunduzi. The electricity backlogs are 36,77% in Buffalo City, 15,09% in Mangaung and 14,2% in Msunduzi. The refuse collection backlog is 27,36% in Buffalo City, 37,81% in Mangaung and 39,25% in Msunduzi.
Will the creation of metropolitan municipalities in these 3 Category B municipalities enhance their ability to deal with these service backlogs? In the short term it will perhaps make little material difference. In the medium to long term it could be argued that creating metropolitan governments will increase the status of these municipalities. It would make it more attractive to skilled staff and would even facilitate investment in the area. Increased

32
human and financial capacity would improve these Category B municipalities ability to deal with backlogs.
(iii) the promotion of social and economic development; and
(iv) the promotion of a safe and healthy environment
(c) enable integrated development. It has already been pointed out that if a metropolitan government is created, it would facilitate integrated development within its jurisdiction. More specific information about the three category B municipalities is listed below. Mangaung
The Mangaung IDP pointed out that very little economic activity has been generated in Bloemfontein, the economic hub of the municipality in recent years. There has been the general relocation of services to the suburbs and manufacturing is declining in the city (Mangaung, 2007:20).
Mangaung’s Spatial Development Framework is aimed at addressing apartheid’s inequalities and creating a more sustainable spatial environment (2007:56). However, there are concerns about the growth patterns in the city. There is growth in the Southeast of the city in the traditional township in Mangaung and the white suburbs in the Northwest with new retail, commercial and industrial areas developing in this area. This is leading to sprawl and creating a backlog in the provision of services, land and facilities in these developing areas, while the CBD which has many of the facilities needed, is underutilised (2007:64).
Buffalo City
There are three identifiable land-use patterns in Buffalo City. Firstly, there is the economic urban axis of East London-Mdantsane-King Williams Town-Dimbaza-which dominates the industrial and service sector regions. This region attracts people from throughout the greater Amathole region in search of work opportunities and better access to urban services and facilities.
The second is the area comprising the fringe peri-urban and rural settlement areas, which while remaining under the influence of the urban axis, is distinct in character and land use patterns. This includes the former Ciskei Bantustan settlements.
The third is the commercial farming areas situated predominately in the northeastern and southwestern coastal areas of the Municipality. These areas are characterised by extensive land uses, with certain areas making use of intensive, irrigation-based farming (Buffalo City, 2007: 9).

33
Msunduzi
Msunduzi has identified Greater Edenvale as a priority area for social and economic development It is an attempt to overcome apartheid style planning (Msunduzi, 2007:228). Msunduzi still has to put together a post-apartheid, spatial development framework for the entire Greater Pietermaritzburg area. There are still glaring spatial, social and economic inequalities, The highly urbanised and developed areas, the former partly urbanised townships and the semi-rural tribal areas still form a patchwork, which urgently needs to be integrated into a more efficient and equitable metropolitan urban system. It is argued that will be best achieved by the development of a single plan by a single metropolitan municipality (Mzunduzi, 2008).
(d) have a tax base as inclusive as possible of users municipal services in the municipality.
This criterion was applied in the 1999/2000 demarcation when the Board redemarcated municipalities from 843 to 284. It looked at economic, social and other trends to demarcate the boundary. It attempted to link economic boundaries with administrative boundaries. Buffalo City, Mangaung and Msunduzi largely have a tax base of the users of services. The principle of fiscal equivalence has been promoted, namely the people who use services should be the same people who pay for them.
The one issue is whether developments across boundaries have led to jurisdictions no longer reflecting the users of services. This will be taken up in the Great Kei investigation.
Section 25 lists the factors that have to be taken into account when determining municipal boundaries. Section 25 (a) states that the factors are:
(a) the interdependence of people, communities and economics as indicated by —
(i) existing and expected patterns of human settlement and migration;
(ii) employment;
(iii) commuting and dominant transport movements;
(iv) spending;
(v) the use of amenities, recreational facilities and infrastructure; and
(vi) commercial and industrial linkages;

34
Patterns of human settlement and migration
The population figures have already been discussed in the definition of metropolitan areas.
There is added data available on migration.
Table 11. Migrancy
Municipality Pop. 1996
Pop. 2001
Pop. 2007
Pop Growth 1996 -2001
Pop Growth 2001 - 2007
Total Growth 1996- 2007
Ethekwini 2751193 3090121 3468086 12.32 12.23 24.55 Ekurhuleni 2026807 2480277 2724229 22.37 9.84 32.21 Nelson Mandela
969771 1005778 1050930 3.71 4.49 8.2
Tshwane 1682701 1983983 2345908 17.9 18.24 36.14 Cape Town 2563612 2893246 3497097 12.86 20.87 33.73
Johannesburg 2639110 3225812 3888180 22.23 20.53 42.76
Buffalo City 682287 701980 724 312 2.89 3.18 6.07 Mangaung 603704 645441 752 906 6.91 15.05 23.45
Msunduzi 521805 552835 616730 5.95 11.56 17.51 Polokwane 424976 508277 561772 19.6 10.52 30.12
Rustenburg 311326 395540 449776 27.05 13.71 40.76 Mbombela 425663 474806 527203 11.55 11.04 22.59
Mogale City 223657 289724 319641 29.54 10.33 39.87
Umhlathuze 196183 289190 332156 47.41 14.86 62.27
Sol Plaatjie 204263 201464 243018 -1.37 20.63 19.26
Source: Statistics SA, 2001, 2007, South African Cities Network, 2004.
It can be seen that there has been extensive growth in most urban areas between both 1996 and 2001 and between 2001 and 2007. The population growth and in-migrancy in metros has been high with the exemption of Nelson Mandela. The biggest growth in the category B municipalities between 2001 and 2007 has been in Sol Plaatjie (20,63%), Mangaung (15,05%) followed by Umhlathuze (14,86). The growth rate in Msunduzi was 11,56% while the growth in Buffalo City has been low at 3,18%. Employment

35
Table 12. Employment Levels
Municipality
Employed Unemployed Not economically active
N % N % N %
Ethekwini 1 010 599 43.21 506 112 21.64 822 289 35.16
Ekurhuleni Metro 950 345 50.88 420 600 22.52 496 824 26.60
Nelson Mandela 270 296 38.13 179 920 25.38 258 599 36.48
City of Tshwane 865 420 54.72 284 639 18.00 431 364 27.28
City of Cape Town 1 250 731 53.60 405 377 17.37 677 389 29.03
City of Johannesburg 1 417 464 53.68 596 420 22.59 626 770 23.74
Buffalo City 177 033 37.27 112 294 23.64 185 671 39.09
Mangaung 221 232 44.69 94 313 19.05 179 529 36.26
Msunduzi 156 564 40.74 97 816 25.46 129 887 33.80
Mbombela 165 594 50.19 52 292 15.85 112 072 33.97
Polokwane 117 804 36.75 69 684 21.74 133 076 41.51
Rustenburg 161 753 53.85 63 536 21.15 75 101 25.00
Mogale City 115 822 54.63 40 025 18.88 56 172 26.49
Umhlathuze
84 386 40.63 46 231 22.26 77 082 37.11
Kimberley/Sol Plaatjie 62 150 39.07 30 163 18.96 66 780 41.98
Source Statistics SA, Community Survey, 2007.
There does not appear to be any discernible differences between the employment levels of metros and Category B municipalities. The employment levels of Cape Town, Tshwane and Johannesburg are over 50% as are those of Rustenburg, Mogale City and Mbombela. The employment level of Category B municipality, Buffalo City is 37% while that of metro, Nelson Mandela is 38%. Mangaung has an employment level of 45% while that of Msunduzi is 41%.
There also does not appear to be any discernible differences between the unemployment levels of metros and Category B municipalities.

36
Table 13. Occupational Profile
Source: Statistics SA, Community Survey, 2007.
The metros generally have a greater proportion of persons employed in the following categories: Legislators, senior officials and managers; Professionals; and Clerks. The Category B municipalities generally have a greater proportion of persons employed in the following categories: Skilled agricultural and fishery workers; Elementary occupations; Plant and machine operators and assemblers; and Craft and related trades workers. If one looks at Buffalo City, Mangaung and Msunduzi specifically, the situation is not that clear-cut. They have only a smaller percentage of legislators, senior officials and managers than Nelson Mandela. These three B municipalities have approximately the same percentage professionals as Nelson Mandela and Ethekwini. Mangaung has the same level of clerks as the metros.
Municipality Legislators;
senior officials and
managers %
Professionals %
Technicians and associate professionals
%
Clerks %
Service workers; shop and
market sales
workers %
Skilled agricultural and fishery
workers %
Craft and
related trades
workers %
Plant and machine
operators and
assemblers %
Elementary occupations
%
Occupations unspecified
and not elsewhere classified
%
Not applicable (not
economically active)
%
Ethekwini 4.11 4.88 3.02 3.73 4.35 0.47 5.63 3.53 7.16 5.15 57.96
Ekurhuleni Metro
5.80 5.48 3.85 4.55 4.55 0.64 6.11 4.99 7.63 6.09 50.31
Nelson Mandela
3.91 4.18 2.72 3.16 3.34 0.58 4.20 4.18 5.56 4.93 63.23
Tshwane 5.85 7.12 3.94 4.79 5.28 0.75 5.31 2.54 8.10 8.35 47.97
Cape Town 5.29 5.93 3.49 4.56 4.67 0.64 5.45 3.00 7.00 11.71 48.27
Johannesburg 6.26 6.84 3.83 4.20 5.17 0.60 5.00 3.20 7.88 8.57 48.46
Mogale 5.88 5.39 4.12 4.34 4.53 1.97 7.03 3.81 7.97 6.44 48.52
Buffalo City 2.99 4.07 2.14 2.90 2.95 0.58 3.39 2.45 7.02 7.50 64.03
Mangaung 3.37 4.46 2.85 4.08 4.94 1.95 4.99 2.85 7.89 5.88 56.78
Msunduzi 2.77 4.94 2.34 3.70 4.26 0.70 4.00 3.31 5.37 6.65 61.97
Mbombela 4.42 4.71 3.16 3.60 4.80 2.71 6.74 3.39 9.41 6.04 51.03
Polokwane 3.07 5.00 1.77 2.88 4.42 1.07 3.46 2.03 7.06 4.02 65.22
Rustenburg 2.53 2.94 1.83 3.12 4.43 0.83 7.81 10.66 6.63 8.07 51.15
Umhlathuze 2.93 4.64 2.17 2.77 4.65 0.82 5.34 4.96 6.27 4.54 60.91
Sol Plaatjie 3.70 4.50 2.89 4.39 4.92 1.06 3.78 1.46 4.67 6.24 62.39

37
Commuting and Transport There is no data available on commuting although there is some data on transport. Table 14. Mode of Transport Municipality On
Foot %
Bicycle %
Motorcycle %
Car as a driver
%
Car passenger
%
Minibus/ taxi %
Bus %
Train %
Other %
Not Applicable
%
Ethekwini 19.27 0.23 0.26 6.95 6.70 8.37 6.37 1.72 0.40 49.74
Ekurhuleni 17.13 0.67 0.32 10.11 6.97 12.88 1.57 3.05 0.37 46.93
Nelson Mandela
22.68 0.35 0.22 7.22 5.75 8.14 4.27 0.32 0.26 50.79
Tshwane 14.18 0.50 0.24 8.59 5.04 5.61 5.00 30.18 0.27 30.38
Cape Town 19.02 0.50 0.28 10.84 8.36 6.39 4.09 6.78 0.54 43.20
Johannesburg 20.95 0.39 0.35 12.70 8.35 15.44 2.97 3.27 0.45 56.09
Buffalo City 28.82 0.30 0.22 4.73 5.19 9.31 1.26 1.13 0.23 48.82
Mangaung 29.04 0.72 0.23 5.52 4.17 9.44 4.42 0.15 0.17 46.13
Msunduzi 23.83 0.27 0.28 6.08 6.16 11.31 2.03 0.21 0.26 49.58
Mbombela 35.64 0.19 0.17 3.55 3.06 3.93 8.66 0.15 0.33 44.32
Polokwane 37.48 0.31 0.18 4.15 4.03 5.43 3.65 0.17 0.20 44.40
Rustenburg 23.00 0.50 0.17 5.95 4.90 11.49 6.84 0.10 0.20 46.83
Mogale City 22.10 0.52 0.25 8.60 6.97 11.51 1.55 1.21 0.28 47.01
Umhlathuze 26.47 0.39 0.41 5.51 6.52 4.65 8.18 0.15 0.70 47.00
Sol Plaatjie 24.57 1.45 0.16 6.74 6.16 8.20 1.59 0.12 0.39 50.62
Source: Statistics SA, Community Survey, 2007
In the metros, there is a greater percentage of people driving cars as a mode of transport compared to non-metros with the exception of Mogale City, which has a percentage approximating those of metros. In the non-metros, there is a greater percentage of people using foot as a mode of transport than the metros. This data indicates that there are more advanced modes of transport in metropolitan areas.
38
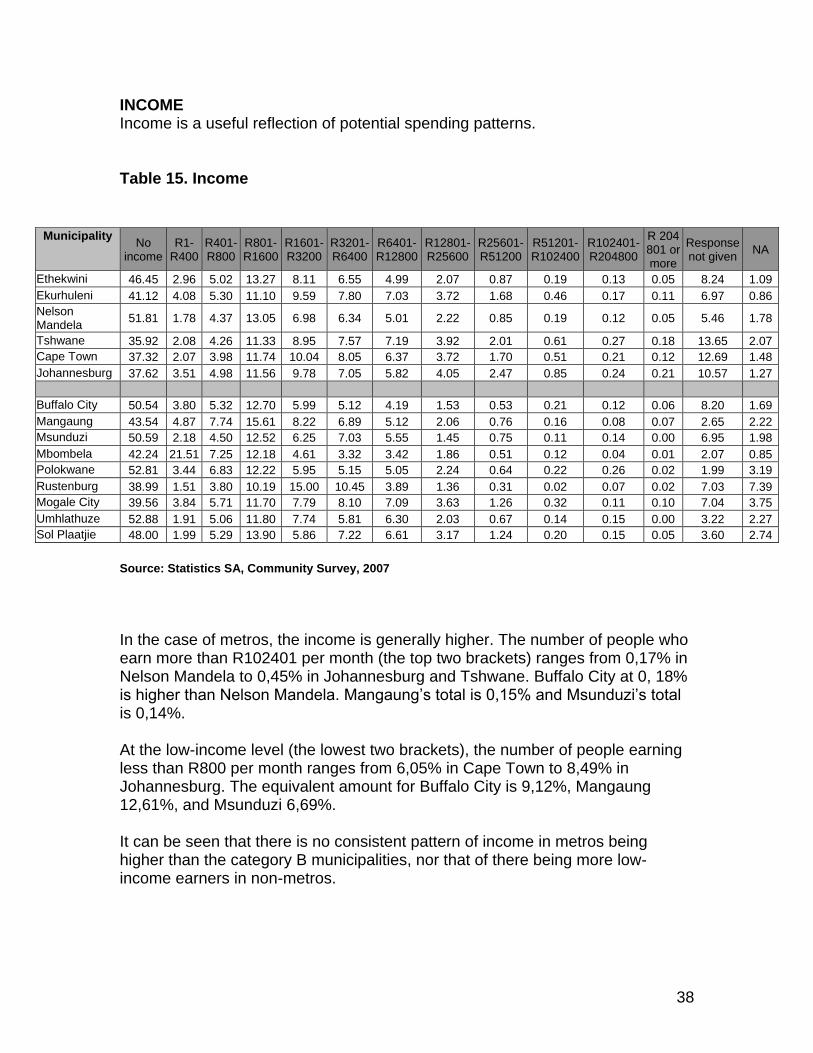
INCOME Income is a useful reflection of potential spending patterns. Table 15. Income
Source: Statistics SA, Community Survey, 2007
In the case of metros, the income is generally higher. The number of people who earn more than R102401 per month (the top two brackets) ranges from 0,17% in Nelson Mandela to 0,45% in Johannesburg and Tshwane. Buffalo City at 0, 18% is higher than Nelson Mandela. Mangaung’s total is 0,15% and Msunduzi’s total is 0,14%. At the low-income level (the lowest two brackets), the number of people earning less than R800 per month ranges from 6,05% in Cape Town to 8,49% in Johannesburg. The equivalent amount for Buffalo City is 9,12%, Mangaung 12,61%, and Msunduzi 6,69%. It can be seen that there is no consistent pattern of income in metros being higher than the category B municipalities, nor that of there being more low-income earners in non-metros.
Municipality No
income R1-
R400 R401-R800
R801-R1600
R1601-R3200
R3201-R6400
R6401-R12800
R12801-R25600
R25601-R51200
R51201-R102400
R102401-R204800
R 204 801 or more
Response not given
NA
Ethekwini 46.45 2.96 5.02 13.27 8.11 6.55 4.99 2.07 0.87 0.19 0.13 0.05 8.24 1.09
Ekurhuleni 41.12 4.08 5.30 11.10 9.59 7.80 7.03 3.72 1.68 0.46 0.17 0.11 6.97 0.86
Nelson Mandela
51.81 1.78 4.37 13.05 6.98 6.34 5.01 2.22 0.85 0.19 0.12 0.05 5.46 1.78
Tshwane 35.92 2.08 4.26 11.33 8.95 7.57 7.19 3.92 2.01 0.61 0.27 0.18 13.65 2.07
Cape Town 37.32 2.07 3.98 11.74 10.04 8.05 6.37 3.72 1.70 0.51 0.21 0.12 12.69 1.48
Johannesburg 37.62 3.51 4.98 11.56 9.78 7.05 5.82 4.05 2.47 0.85 0.24 0.21 10.57 1.27
Buffalo City 50.54 3.80 5.32 12.70 5.99 5.12 4.19 1.53 0.53 0.21 0.12 0.06 8.20 1.69
Mangaung 43.54 4.87 7.74 15.61 8.22 6.89 5.12 2.06 0.76 0.16 0.08 0.07 2.65 2.22
Msunduzi 50.59 2.18 4.50 12.52 6.25 7.03 5.55 1.45 0.75 0.11 0.14 0.00 6.95 1.98
Mbombela 42.24 21.51 7.25 12.18 4.61 3.32 3.42 1.86 0.51 0.12 0.04 0.01 2.07 0.85
Polokwane 52.81 3.44 6.83 12.22 5.95 5.15 5.05 2.24 0.64 0.22 0.26 0.02 1.99 3.19
Rustenburg 38.99 1.51 3.80 10.19 15.00 10.45 3.89 1.36 0.31 0.02 0.07 0.02 7.03 7.39
Mogale City 39.56 3.84 5.71 11.70 7.79 8.10 7.09 3.63 1.26 0.32 0.11 0.10 7.04 3.75
Umhlathuze 52.88 1.91 5.06 11.80 7.74 5.81 6.30 2.03 0.67 0.14 0.15 0.00 3.22 2.27
Sol Plaatjie 48.00 1.99 5.29 13.90 5.86 7.22 6.61 3.17 1.24 0.20 0.15 0.05 3.60 2.74

39
(c) the need for cohesive, integrated and unfragmented areas, including metropolitan areas
As pointed out, the division of functions and powers between B and C municipalities has led to overlapping and duplication between local and district municipalities. This is particularly pronounced in bigger B municipalities.
On the balance of evidence it can be concluded that the creation of single-tier metropolitan municipalities in Mangaung, Msunduzi and Buffalo City will lead to cohesive, integrated and unfragmented areas. All original municipal, legislative and executive powers are vested in Category A municipalities.
(d) the financial viability and administrative capacity of the municipality to perform municipal functions efficiently and effectively
Table 16: Operating and Capital Budget. 2006/7
Municipality Population (2007) Opex 2006/07 Opex Budget
Per capita Capex 2006/07 Capex Budget
Per capita
Ethekwini 3468086 11372716000 3279 3035508500 875
Ekurhuleni 2724229 9944245905 3650 1207706435 443
Nelson Mandela 1050930 4777810297 4546 975344000 928
Tshwane 2345908 8587559000 3661 1586651000 676
Cape Town 3497097 13755519000 3933 1953422000 559
Johannesburg 3888180 14509753000 3732 3193219000 821
Buffalo City 724312 2135142224 2948 258835777 357
Mangaung 752906 1604381249 2131 352737048 469
Msunduzi 616730 1608861322 2609 125339658 203
Polokwane 561772 846112000 1506 340282514 606
Rustenburg 449776 1045720012 2325 123656630 275
Mbombela 527203 586575219 1113 144254465 274
Mogale City 319641 666562000 2085 38695000 121
Umhlathuze 332156 712572985 2145 447496000 1347
Sol Plaatjie 243018 503705000 2073 55876678 230
Source. Municipal Demarcation Board, 2008, Gauteng Department of Local Government, 2008, South African Cities Network, 2006.
The operating budgets of the big 5 metros are substantially higher than the Category B municipalities. They range from R8.5 billion in Tshwane to R14.5 billion in Johannesburg. Nelson Mandela is lower than the other metros with a

40
budget of R4.77 billion. The next biggest operating budgets are the three B municipalities being investigated for A status, namely Buffalo City with R2.13 billion and Mangaung and Msunduzi with R1.6 billion each. This is followed by Rustenburg with R1.04 billion. The per capita operating expenditure in the metros is also substantially higher than the B category municipalities. It ranges from R3279 in Ethekwini to R4546 in Nelson Mandela. The per capita budgets of the non-metros of Buffalo City, Mangaung and Msunduzi are R2948, R2131 and R2609 respectively. The same trend is evident for capital expenditure where the big 5 metros have substantively higher expenditure than the category B municipalities. The budgets of the metros have capital expenditure in excess of R1.2 billion. The capital budget of the smallest metro Nelson Mandela is R975 million. The capital budget of Buffalo City is R258 million; Mangaung is R352 million, and Msunduzi R125 million. The capital budgets of Umhlathuze are higher than the three municipalities being investigated for Category A status (due to external loans it took out). The capital budget of Polokwane is higher than that of Buffalo City and Mzunduzi and that of Mbombela is higher than Mzunduzi. The per capita capital expenditure is generally higher amongst the metros ranging from R443 in Ekurhuleni to R928 in Nelson Mandela. The highest per capita expenditure is in Umhlathuze with R1347. The per capita budgets of Buffalo City, Mangaung and Msunduzi are R357, R469, and R203, respectively. Table 17. Rates Base
Municipality Rates base R'000 (2007)
Ethekwini 3152500
Ekurhuleni 1969970
Nelson Mandela 607433
Tshwane 2007541
Cape Town 3446600
Johannesburg 3408318
Buffalo City 320 829
Mangaung 247343
Msunduzi 437184
Polokwane 138051
Rustenburg 90425
Mbombela 143157
Mogale City 129522
Umhlathuze 101542
Sol Plaatjie 99503

41
Source: Municipal Demarcation Board, 2008, Websites of Metropolitan Municipalities
The rates base of municipalities is a good indicator of the financial viability of municipalities as it reflects the amount of revenue raised locally. The big 5 metros have rates bases ranging from R1 969 970 000 in Ekurhuleni to R 3 446 600 000 in Cape Town. The other metro, Nelson Mandela, has a budget of R607 433 000. The three category B municipalities under investigation have the highest rate base of all the local municipalities. Msunduzi has a rates base of R437 184 000, Buffalo City R320 829 000 and Mangaung R247 343 000. Table 18. Staffing Levels 2006/7 Municipality Number
of staff Staff
budget Staff per
capita ratio
Ethekwini 18500 2928004000 187
Ekurhuleni 14964 2389202000 182
Nelson Mandela
7523 945164000 140
Tshwane 12357 2383044000 190
Cape Town 27000 3004417000 130
Johannesburg 25996 3541051000 150
Buffalo City 3922 2135142224 185
Mangaung 3992 1604381249 189
Msunduzi 3004 1608861322 205
Mbombela 1406 5844299000 400
Polokwane 1369 846112000 329
Rustenburg 1549 1045720012 340
Mogale City 1658 6665620000 193
Umhlathuze 1698 894008400 196
Sol Plaatjie 1700 12041661 143
Source: Municipal Demarcation Board, 2008.
The five big metros all have staff in excess of 12 000 ranging from 12 357 in Tshwane to 27 000 in Cape Town. The smaller metro, Nelson Mandela has 7523 staff. This is followed by the three category B municipalities under investigation, namely, Mangaung (3992), Buffalo City (3922), and Msunduzi (3004). The staff per capita ratios are generally better in the metros than the B municipalities. The per capita ratios range from 130 in Cape Town to 190 in Tshwane. Buffalo City has a ratio of 185, Mangaung 189, and Msunduzi 205. Other low ratios are Mogale City with a ratio of 193 and Umhlathuze with 196.

42
(e) the need to share and redistribute financial and administrative resources;
Currently redistributive policies at the local government level are carried out by both local B and district C municipalities within their areas of jurisdiction. If the three category B municipalities - Msunduzi, Buffalo City, and Mangaung - became Category A municipalities it would lead to the concentration of all resources (financial, human resources, infrastructural, planning, and capacity) in the metropolitan authorities. This should facilitate the redistribution of financial and administrative resources across these metros’ areas of jurisdiction.
(f) provincial and municipal boundaries;
No provincial boundaries would be affected by demarcation and given that the recommendations are that the existing boundaries be used as the basis of metropolitan government, no municipal boundaries would be affected either.
It is recommended that the existing Category B municipality boundaries be used as the basis for the metropolitan municipality boundaries. Research has shown that large scale restructuring in municipalities since 1994 has detracted from service delivery (Cameron, 2005). If new metropolitan municipalities are created administrative disruption must be minimised. Incorporating existing municipalities will lead to time-consuming organisational restructuring which would include dealing with assets and liabilities.
Creating metropolitan municipalities on existing boundaries will also facilitate the transfer of the equitable share to these municipalities. Splitting jurisdictions will complicate the process.
(g) areas of traditional rural communities;
No areas of traditional rural communities will be affected.
(h) existing and proposed functional boundaries, including magisterial districts, health, transport, police, and census enumerator boundaries;
The major boundaries that stand to be affected are health boundaries, which correspond to district boundaries. The three category B municipalities under investigation will become separate health authorities. Amatole and Umgungundlovu will remain separate health districts. If Motheo and Xhariep districts are combined they will become a single health district.
Education boundaries are in the process of being aligned with district boundaries. The implications for education would be the same as health. Buffalo City, Mangaung and Mzunduzi would become separate education districts. Amatole and Umgungundlovu would be separate education districts. If the Motheo and Xhariep districts are combined they would become a separate education district.

43
Police boundaries do not correspond to municipality boundaries as indicated on the attached map.
Census enumerator boundaries are the building blocks of wards which are contained within existing local government boundaries.
Magisterial districts are in the process of being reviewed and should therefore not be taken into consideration for this demarcation exercise.
(i) existing and expected land use, social, economic and transport planning;
Expected land use was discussed in Section 24 (iii) the promotion of social and economic development.
(j) the need for co-ordinated municipal, provincial and national programmes and services, including the needs for the administration of justice and health care;
One argument raised is that the creation of metropolitan municipalities will delink these municipalities from national, provincial and district planning agendas. For example, one potential problem with removing locals from districts would be the loss of district-wide planning. However these arguments presume that there are no other intergovernmental fora through which coordination can occur. As pointed out by the Community Law Centre (2007B:17) co-ordination does not require an overarching district municipality. It could be done through the Premier’s intergovernmental forum or inter-municipal forums.
(k) topographical, environmental, and physical characteristics of the area;
There are no topographical environment and physical constraints, which would be affected by the demarcation.
(l) the administrative consequences of its boundary demarcation on —
(i) municipal creditworthiness;
(ii) existing municipalities, their council members and staff; and
(iii) any other relevant matter;

44
The creation of metropolitan governments in Mangaung, Buffalo City, and Msunduzi should not have any significant effect on any of the metros’ municipal creditworthiness. The municipality would have precisely the same tax base.
Currently the district municipalities are health authorities for the entire jurisdiction. If these 3 municipalities become Category A municipalities they would become health authorities for their areas only. The rest of the district would continue to be separate health authorities.
Currently category B municipalities IDP’s have to conform to the district IDPs. If they become Category A municipalities this will no longer be the case. Their IDP’s will be ‘stand-alone’ documents although they would still have to conform to national and provincial policies. The same argument applies for local economic development strategies.
If Category A municipalities are established in these three municipalities, they will be in a better position to manage urbanisation. It was shown in Table 11 that the growth rate in the category B municipalities between 2001 and 2007 has been reasonably high in Mangaung (15,05%) and Msunduzi (11,56%) although the growth in Buffalo City has been low at 3,18%. The management of urbanisation is not a district function and is best done by unitary metropolitan municipalities.
The number of number of councillors or wards of local municipalities will not change for municipalities until the next elections when the Minister will redetermine the boundaries.
These boundary changes do have certain implications for representation on districts.

45
Table 19a Buffalo City population as a percentage of Amatole District population
Municipality Population as % of District
Amatole 100.00
Mbhashe 15.32
Mnquma 17.20
Great Kei 2.67
Amahlati 8.33
Buffalo City 42.19
Ngqushwa 5.06
Nkonkobe 7.73
Nxuba 1.49
Source: Municipal Demarcation Board, 2008.
Table 19b Mangaung population as percentage of Motheo District population
Municipality Population as % of District
Motheo 100.00
Naledi 3.77
Mangaung 88.63
Mantsopa 7.60
Source: Municipal Demarcation Board, 2008.

46
Table 19c Msunduzi population as percentage of Umgungundlovu District
Municipality Population as % of District
Umgungundlovu 100.00
uMshwathi 11.69
uMngeni 7.96
Mooi Mpofana 3.97
Impendle 3.62
Msunduzi 59.58
Mkhambathini 6.37
Richmond 6.81
Source: Municipal Demarcation Board, 2008.
Table 19 looks at population of the 3 Category B municipalities as a percentage of district population.The number of registered voters per municipality was not available and population was used as a yardstick to determine the voting strength of these big Category B municipalities. This is in order to determine the important of the respective Category B municipality within the district. Mzunduzi is 59, 58% of Umgungundlovu population, Buffalo City contains 42,19% of the population of the Amatole district population while Mangaung contains 86,83% of Motheo district’s population. This means that there will be a substantial reduction in the number of district councillors in Umgungundlovu and Buffalo City. In the case of Motheo there will no longer be sufficient councillors to constitute a viable municipality and amalgamation with Xhariep district is recommended.

47
Table 20. Category B’s budget as a percentage of overall district budget
Municipality Operating
Overall % of district Budget
Capital Overall % of
district budget Total
Overall % of district budget
Mangaung 1604381249 87.35 352737048 84.52 1957118297 86.83
Municipality Operating
Overall % of district budget
Capex Overall % of
district budget Total
Overall % of district budget
Msunduzi 1608861322 44.59 125339658 33.56 1734200980 43.56
Municipality Operating
Overall % of district budget
Capital Overall % of
district budget Total
Overall % of district budget
Buffalo City 2 135142224 76.57 258835777 50.00 2 393978001 72.41 Source: Municipal Demarcation Board, 2008
Table 20 looks at the Category’s B municipality’s budget as a percentage of the District municipality’s budget. Mangaung Mangaung has 88.63% of the district’s population and 89.67% of the district’s households. Its budget is 87.35% of the district’s operating expenditure and 84.52% of the district’s capital budget. Mangaung performed 52.63% of its functions while the Motheo district performed 5.2% of its functions (Municipal Demarcation Board, 2008). It can be seen that the district hardly performs any of its functions and has minimal impact upon the city. If Mangaung became a metropolitan authority, there would only be two municipalities left in this district. It can be asked whether the goals of district government will be fulfilled by having a district consisting of two local municipalities only. Furthermore, the statistics above indicate the centrality of Mangaung to the district. It is recommended that if Mangaung becomes a metropolitan authority that the remainder of the Motheo district be amalgamated with neighbouring districts. A further investigation would be necessary to determine the precise configurations of the boundaries.
48
Buffalo City Buffalo City has 45.78% of the district’s population and 12.86% of the district’s households. It has 76.7% of the district’s operating expenditure and 50% of the district’s capital budget. Buffalo City performed 82.41% of its functions in 2007 while Amatole district performed 28.95% of its functions (Municipal Demarcation Board, 2008). It can be seen that the district hardly performs any of its functions and has minimal impact upon the city. If Buffalo City does become a metropolitan authority, there would still be seven municipalities in the district, which would be the basis for a viable district municipality. Msunduzi Msunduzi has 59.58% of the district’s population and 57.64% of the district’s households. It has 44.59% of the district’s operating expenditure and 33.56% of the district’s capital budget. Msunduzi performed 52.63% of its functions in 2007. However, the Umgungundlovu district only performed 7.89% of its functions (Municipal Demarcation Board, 2008). It can be seen that the district hardly performs any of its functions and has minimal impact upon the city. If Msunduzi does become a metropolitan authority, there would still be six municipalities in the district, which would be the basis for a viable district municipality.
It also needs to be noted that districts have hardly any presence in secondary cities where most of the district functions in urban areas are performed by secondary cities themselves (Community Law Centre, 2007B). This should minimize administrative disruption.
(m) the need to rationalise the total number of municipalities within different categories and of different types to achieve the objectives of effective and sustainable service deliver financial viability and macro-economic stability.
It could be argued that this criterion largely applied to the 1999/2000 local government elections where there was the expectation that the Municipal Demarcation Board would rationalise municipalities in order to break down apartheid settlement patterns in order to create non-racial, sustainable

49
municipalities. Large-scale rationalisation occurred with the reduction of the number of municipalities from 843 to 284 (subsequently 283). Boundary demarcation is not, however, a static process. The reason why there is a permanent Demarcation Board is precisely to review boundaries constantly in the light of changing developments. The issue at stake here is not about the rationalisation of boundaries. Rather, it is the consideration of whether Category B municipalities have become sufficiently urbanised to qualify for a metropolitan authority. Possible amalgamation of Great Kei Municipality (EC123) into Buffalo City Part of the brief involved looking at the possible investigation of Great Kei Municipality with Buffalo City. The relevant data is listed below. Table 21a. Great Kei
Municipality Opex 2006/07
Capex 2006/07
Total Budget
Number of Staff 2007
Great Kei 55936585 12805786 68742371 94
Table 21b. Great Kei Municipality Number of
wards Number of councillors
Great Kei 6 12
Table 21c Great Kei
Municipality
Water Sanitation Electricity Refuse Removal
RDP Water
service levels
(actual)
RDP Water backlog (%)
within municipality
RDP Water
backlog as % of district
RDP Sanitation
service levels
(actual)
RDP Sanitation backlog
(%)
RDP Sanitation backlog as % of district
RDP Electricity
service levels
(actual)
RDP Electricity backlog
(%)
RDP Electricity backlog as % of district
RDP Refuse
Removal service levels
(actual)
RDP Refuse
Removal backlog
(%)
RDP Refuse
Removal backlog as % of district
Great Kei 9663 16.05 1.42 2225 80.67 3.49 8230 28.5 1.71 2549 77.85 3.64
Table 21d. Great Kei Municipality Population Rural
Households % Rural Households
Urban Households
% Urban Households
Geographical Density
Greater Kei 33386 7897 35.19 14544 64.81 1735.96 19.23

50
Table 21e Great Kei
Municipality Employed % Unemployed %
Not Economically
active
Not Applicable
Greater Kei 36 20 41 4
Table 21f. Great Kei
Municipality Rates base (2007)
Great Kei 9532116
Source: Statistics SA 2007 community survey, Municipal Demarcation Board, 2008
This data shows that Great Kei municipality is very small. There is a population of 33386 in total. There are six wards and 12 councillors. The size is 1735.96 km2.
while the density is 19,23. The operating budget is R55.9 million and the capital budget is R12.8 million. The municipality has 94 staff. The rates base is R9,5 million. There is a backlog of 16.05% for water, 80.67% for sanitation, 28.5% for electricity and 77.85% for refuse removal. There is an employment level of 36% and an unemployment rate of 20%. Great Kei is very small and questions can be asked about its long-term viability. While Great Kei has some links with Buffalo City, it is premature to consider amalgamating the two municipalities. There would not be nearly the same degree of time-consuming financial, human resources and institutional consolidation required if the B categories become metropolitan governments within the existing boundaries. It would only require the consolidation of certain functions currently performed by the metro. Research has shown that constant administrative re-organisation is disruptive and has impacted negatively on municipalities’ abilities to deliver services (Cameron, 2005). It would not be desirable for Buffalo City to create a metro and extend its boundaries simultaneously. It is recommended that in the short-term Buffalo City should focus on the creation of a single-tier metropolitan authority. Once the metro has been consolidated, a further investigation into the possible incorporation of Great Kei into Buffalo City should occur. Findings While the three Category B municipalities do not necessarily conform to all the individual metropolitan and demarcation factors in legislation, it is argued that

51
they substantially conform. The fact that districts largely do not perform their statutory functions also needs to be taken into account. The Demarcation Board conducted investigations into whether Buffalo City, Mangaung and Msunduzi should be classified as Category A municipalities in both 1999/2000, and 2003. In 1999/2000 it came to the conclusion that these areas did not qualify to become Category A metropolitan municipalities. Its 2003 categorisation report found that these urban areas were growing but they did not yet fulfil the criteria of being classified as Category A metropolitan councils. It did however suggest that there should be an individual assessment of the Category B municipalities to see whether they should be reclassified as metros. Five years on there has been a further categorisation of metros. The question can be asked as to what has changed since 2003. Firstly, the abolition of RSC levies has changed the landscape of the debate. There can now be an informed debate about the metropolitan status of Category B municipalities without the issue of RSC levies obfuscating the issue. There is of course new data to consider, most notably updated Demarcation Board capacity assessments, the Statistics SA community survey, and two State of the Cities reports (2004 and 2006). The data shows that there have in fact been considerable changes in Buffalo City, Mangaung, and Msunduzi, which warrants re-categorising them as metros. In 2003 there was not one Category B municipality, which had an operating budget over R1 billion. There are now four such municipalities, including the three mentioned above. There are similar trends when it comes to capital expenditure. In 2003 Buffalo City was the only B municipality with a capital budget of more than R200 million. Now five category B municipalities have a capital budget of more than R200 million including the three municipalities under investigation. In 2003 not one category B municipality had a rates base over R200 million. Buffalo City, Mangaung and Msunduzi now have rates bases over R200 million. While the three Category B municipalities do not necessarily conform to all the individual metropolitan and demarcation factors in legislation, it is argued that they substantially conform. In some areas such as economic diversity, urban nodes and employment there does not appear to be any discernible difference between Nelson Mandela and these 3 category B municipalities. The fact that districts do not largely perform their statutory functions in these towns was also taken into account coming to this conclusion.

52
To minimise administrative disruption it is recommended that only existing areas of jurisdiction be included. Once the metros have been consolidated, then consideration can be given to any future boundary incorporation request. Tables of selected indicators have been compiled to illustrate the rankings of the biggest metropolitan/urban areas in the country (tables 21-23). The selected indicators are population, density, operating budget, capital budget and the number of staff. The rankings indicate that the five big metros are still considerably bigger than Nelson Mandela, which in turn are slightly bigger than Buffalo City, Msunduzi and Mangaung. These Category B municipalities are bigger than the other Category B municipalities, which confirms that the Board’s decision to investigate these three municipalities for possible Category A status was the correct one.

53
Table 22: Ranking of Metropolitan/Urban Areas: Figures
Municipality Population (2007)
Population density
(persons/square km)
Opex Budget 2006/07 Capex Budget 2006/07
Number of staff 2007
Johannesburg 3888180 2364 14509753000 3193219000 25996
Cape Town 3497097 1425 13755519000 1953422000 27000
Ethekwini 3468086 1513 11372716000 3035508500 18500
Ekurhuleni 2724229 1416 9944245905 1207706435 14964
Tshwane 2724229 1079 8587559000 1586651000 12357
Nelson Mandela 1050930 536 4777810297 975344000 7523
Buffalo City 724 312 287 2135142224 258835777 3922
Msunduzi 616730 973 1608861322 125339658 3004
Mangaung 752 906 120 1604381249 352737048 3992
Umhlathuze 332156 419 712572985 447496000 1698
Polokwane 561772 165 846112000 340282514 1406
Mbombela 527203 154 586575219 144254465 1406
Rustenburg 449776 119 1045720012 123656630 1549
Mogale City 319641 291 666562000 38695000 1658
Kimberley/Sol Plaatjie 243018 129 503705000 55876678 1700

54
Table 23. Metropolitan/Urban Areas: Rankings
Municipality Population (2007)
Population density
(persons/square km)
Opex Budget 2006/07
Capex Budget 2006/07
Number of staff 2007
Overall
Johannesburg 1 1 1 1 2 1.2
Cape Town
2 3 2 3 1 2.2 Ethekwini 3 2 3 2 3 2.6
Ekurhuleni
4 4 4 5 4 4.2 Tshwane 5 5 5 4 5 4.8
Nelson Mandela 6 7 6 6 6 6.2
Buffalo City
8 10 7 10 8 8.6
Msunduzi 9 6 8 12 9 8.8
Mangaung
7 14 9 8 7 9
Umhlathuze
13 8 12 7 11 10.2 Polokwane
10 11 11 9 15 11.2
Mbombela
11 12 14 11 14 12.4 Rustenburg
12 15 10 13 13 12.6
Mogale City
14 9 13 15 12 12.6
Sol Plaatjie
15 13 15 14 10 13.4

55
Chart 1. Metropolitan/ Urban Rankings
0
2
4
6
8
10
12
14
16
Joha
nnes
burg
Cap
e Tow
n
Ethek
wini
Ekurh
ulen
i
Tshwan
e
Nelso
n M
ande
la
Buffa
lo C
ity
Msu
nduz
i
Man
gaun
g
Um
hlat
huze
Polok
wan
e
Mbo
mbe
la
Rus
tenb
urg
Mog
ale
City
Sol P
laat
jie
Population (2007)
Population density (persons/square km)
Opex Budget 2006/07
Capex Budget 2006/07
Number of staff 2007
Overall
Recommendations
The recommendations are as follows:
The Re-determination of Msunduzi Category B into a Category A (metropolitan) municipality on the basis of its existing boundaries;
The Re-determination of Mangaung Category B into a Category A (metropolitan) municipality on the basis of its existing boundaries;
The Re-determination of Buffalo City Category B into a Category A (metropolitan) municipality on the basis of its existing boundaries;
Great Kei Category B should continue as an existing Category B municipality; and
If Mangaung becomes a metropolitan municipality, the remainder of Motheo district should be amalgamated with Xhariep district. More detailed research is needed around this proposal;
Amatole and Umgungundlovu should continue to exist as separate district municipalities.

56
METWSWEDING DISTRICT INVESTIGATION The Metsweding District Municipality is located in the North Eastern portion of Gauteng. It contains the following local municipalities within its area of jurisdiction. Nokeng tsa Taemane Category B (GT461) Major towns: Cullinan Rayton Kungwini Category B (GT462). Major towns: Bronkhorstspruit Ekangala The Metsweding municipality was originally a cross boundary municipality. The Nokeng tsa Taemane Category B (GT02b1) is located wholly in the Gauteng province while the Kungwini Category B (CBLC2) was originally a cross boundary area between Mpumalanga and Gauteng. The entire Kungwini municipality was included into Gauteng in 2005. BACKGROUND TO INVESTIGATION The Municipal Demarcation Board issued a Section 26 notice calling for the proposed re-determination of municipal boundaries by excluding several farms east of the Tshwane, including the farms Zwartkoppies, Tweefontein, Bashewa, Tigertpoort; Rietfontein, Grootfontein, Zwavelpoort, Mooiplaats, a portion of Donkerhoek, Witkoppies, Sterkfontein, a portion of Rensburg, and portions of Doornkloof farms to the east of the Tshwane from Kungwini / Metsweding, and by including them into the Tshwane Metropolitan municipality.
On the basis of submissions received, the Board resolved that there should be a re-determination of the boundaries of Tshwane, Ekurhuleni, Metsweding, Kungwini and Nokeng tsa Taemane by dividing the Metsweding district area between Tshwane and Ekurhuleni. The motivation behind this is to include both Kungwini and Nokeng with Tshwane except for a few Kungwini farms on the Ekurhuleni border. The brief of this investigation was to examine the viability of this particular option.

57
Application of Category A Criteria in the Municipal Structures Act It is held that the application of Category A criteria is not of relevance in the analysis of the Kungwini and Nokeng municipalities. Tshwane and Ekurhuleni clearly meet the criteria for being a metro. The question is whether these two local municipalities are sufficiently integrated with the metros rather than whether they qualify to be a metro themselves. Application of Section 24 and 25 of the Municipal Demarcation Act
Section 24 deals with the objectives of the Municipal Demarcation Act and Section 25 lists the factors that need to be taken into account when determining municipal boundaries.
These objectives/factors will not be examined individually. Rather they will be grouped into categories for the sake of convenience.
Section 24 states that when the Board determines a municipal boundary, its objective must be to establish an area that would:
(a) enable the municipality for that area to fulfil its constitutional obligations, including —
(i) the provision of democratic and accountable government for the local communities;
(b) enable effective local government
Table 24. Number of Wards and Councillors
Municipality Number of wards
Number of councillors
Ekurhuleni 88 175
Tshwane 76 152
Johannesburg 109 217
Metsweding District Municipality
n/a 6
Nokeng tsa Taemane
6 12
Kungwini 14 27 Source: Municipal Demarcation Board, 2008

58
The number of councillors is set by the Minister of Department and Provincial Local Government based on registered voters, although the Provincial Ministers of Local Government have a 10% variation that they could utilise. Kungwini has 14 wards and Nokeng has 6 wards. It is likely that the number of Nokeng and Kungwini wards will be reduced if these areas are included in Tshwane. It could be argued that this will lead to a ‘democratic deficit’ in that it will lead to a reduction in the number of councillors. However if a municipality is too small to provide decent services, having a large number of councillors does not matter. For example evidence received from ratepayers associations suggests that Kungwini provide minimal services in their areas.
(a) enable the municipality for that area to fulfil its constitutional obligations, including
(iii) the promotion of social and economic development; and
(iv) the promotion of a safe and healthy environment
(c) enable integrated development; and
There is sufficient evidence including satellite images indicating that large scale development is occurring in Kungwini on the Eastern boundary of the Tshwane metro. The urban growth between the two areas has improved to such an extent that urban developments between the two areas are virtually contiguous. In the interests of functional integration it would make sense to integrate into a single municipality (Gauteng, 2008: p80). There was also evidence from Ekurhuleni that its R21 development corridor ran through Kungwini and that the extension of its North-East boundary is a natural extension of this corridor (Ekurhuleni, 2008). These developments suggest that the promotion of integrated development in this area will be facilitated by boundary changes. The Gauteng Department of Local Government report did issue a cautionary note about the proposed boundary modification. It stated that the Tshwane metro is already having problems in reversing the current apartheid city form, which is reflected by the continued construction of low-income housing on the periphery of the city. If this skewed development is not contained, the proposed boundary changes could exacerbate this urban sprawl (Gauteng, 2008).
(i) the provision of services to the communities in an equitable and sustainable manner;

59
Evidence received indicated that many services in Kungwini are already provided by Tshwane and that in the Western part of the municipality there are in fact very few service provided by Kungwini.
Table 25. Table Service Level Backlogs
Municipality Water Sanitation Electricity Refuse Removal
RDP Water
service levels
(actual)
RDP Water backlog (%)
within municipality
RDP Water
backlog as % of district
RDP Sanitation
service levels
(actual)
RDP Sanitation backlog
(%)
RDP Sanitation backlog as % of district
RDP Electricity
service levels
(actual)
RDP Electricity backlog
(%)
RDP Electricity backlog as % of district
RDP Refuse
Removal service levels
(actual)
RDP Refuse
Removal backlog
(%)
RDP Refuse
Removal backlog as % of district
Metsweding District Municipality
47368 6.07 100 31179 38.17 100 35431 29.74 100 23986 52.44 100
Nokeng tsa Taemane
15978 5.07 27.87 11058 34.3 29.99 11238 33.23 37.29 7416 55.94 35.60
Kungwini 31390 6.57 72.13 20121 40.11 70.01 24193 27.99 62.71 16570 50.68 64.40
Source: Municipal Demarcation Board, 2008
The water backlog in Nokeng is 5.07% and in Kungwini it is 6.57%. There are similarly high sanitation backlogs in the metros for sanitation. The sanitation backlog for Nokeng is 34.3% and that of Kungwini is 40.11%. There are also high electricity backlogs in the metros. The electricity backlog in Nokeng is 33.23 % and that of Kungwini is 27,99%. The refuse collection backlog is 55.94% in Nokeng and 50.68% in Kungwini.
Service level backlog for metropolitan areas is not available. Given the small population and backlogs in these local municipalities, Tshwane municipality should be able to comfortably deal with the backlogs.

60
Table 26. Type of Dwelling
Municipality
House or brick structure on a
separate stand or yard
Traditional dwelling/hut/
structure made of traditional materials Flat in block of flats
Town/cluster/semi- detached house
Higher density
total
N % N % N % N % %
Ekurhuleni 466 210 54.89 1 035 0.12 44 128 5.2 31 434 3.7 8.9
Tshwane 369 347 53.79 3 480 0.51 55 080 8.02 33 994 4.95 8.02
Johannesburg
611588 52.49 4 158 36 109 071 9.36 73 583 63.15 72.51
Metsweding District Municipality
26 699 57.42 1 299 2.8 927 1.99 1 014 2.18 4.17
Nokeng tsa Taemane
7 821 52.72 232 1.56 291 1.96 844 5.69 7.65
Kungwini 18 877 59.61 1 067 3.37 636 2.01 170 0.54 2.55
Source: Statistics SA, Community Survey 2007.
This table has shown that the density levels for type of dwelling in Nokeng are 7.65%. This is slightly lower than Tshwane, which has a density level of 8.02%. The density levels in dwellings in Kungwini is 2,55%.
(c) have a tax base as inclusive as possible of users of municipal services in the municipality.
The Municipal Demarcation Board boundary demarcations of 1999/2000 largely encapsulated this aim of having a tax base as inclusive as possible of users of municipal services in the municipality. It promoted the principle of fiscal equivalence, namely that people who use services should be the same people who pay for them. The implementation of this boundary criterion was particularly pronounced in Pretoria where the Garankuwa/Mabopane area, which was an apartheid dumping ground, which served as a dormitory town for Pretoria, was included in the city in the 1999/2000.

61
Since the 1999/2000 demarcation there has been extensive development in Kungwini. Evidence suggests that a number of services in Kungwini are provided by Tshwane and that there is a great deal of interdependence between the areas. This indicates that Tshwane does not have a clear-cut tax base as inclusive as possible of users of municipal services in the municipality and that boundary changes could be considered.
Section 25 lists the factors that have to be taken into account when determining municipal boundaries. Section 25 (a) states that the factors are:
(b) the interdependence of people, communities and economics as indicated by —
(i) existing and expected patterns of human settlement and migration;
(ii) employment;
(iii) commuting and dominant transport movements;
(iv) spending;
(v) the use of amenities, recreational facilities and infrastructure; and
(vi) commercial and industrial linkages;
Table 27. Population Figures
Municipality Population (2007)
Ekurhuleni
2724229
Tshwane
2345908
Johannesburg
3888180
Metsweding District Municipality
153539
Kungwini
104149
Nokeng tsa Taemane 49389
Source: Statistics SA, 2007, Community Survey 2007, Municipal Demarcation Board, 2008.
These figures indicated that the Metsweding district is sparsely populated when compared with the Gauteng metropolitan governments. Kungwini has a

62
population of 104 149 and Nokeng’s population is 49 389. The population of the metropolitan governments are all over 2 million.
Table 28. Urban/Rural Households
Municipality No. of rural households
Percentage of rural households
No. of urban households
Percentage of urban
households
Ekurhuleni 28887 1.17 2449241 98.83
Tshwane 203313 10.23 1783844 89.77
Johannesburg 32698 1.01 3193114 98.99
Metsweding District Municipality
11930 27.48 31480 75.52
Kungwini 7523 29.13 18307 70.87
Nokeng tsa Taemane
6152 43.23 8078 56.77
Source: Municipal Demarcation Board, 2008
Both Kungwini and Nokeng are largely urbanised. Kungwini is 70.87% urbanised and Nokeng is 56.77% urbanised. This can be compared with the 89.77% urbanisation rate in Tshwane and 98.83% in Ekurhuleni.
Table 29. Population Density
Municipality Population
2007
Area (square km)
Population density
(persons/square km)
Ekurhuleni 2724229 1924.4 1416
Tshwane 2345908 2174.6 1079
Johannesburg 3888180 1645.0 2364
Metsweding District Municipality
153539 4062.9
38
Nokeng tsa Taemane 49389 1967.6 25
Kungwini 104149 2202.2 47
Source: Statistics SA, Community Survey, 2007, Municipal Demarcation Board, 2008

63
It can be seen that the population densities are appreciably higher in the metros than the Category B areas. The population densities of metros range from 1079 in Tshwane to 2364 in Johannesburg. The population density in Kungwini is 47 while that of Nokeng tsa Taemane Category B is 25. A combined Tshwane/Metsweding municipality would have a geographical area of 6237.5 km2. This would be considerably larger than the other metros in the country. The next biggest metro is Cape Town at 2454 km2. The national average of metros is 2078 km2. The landmass of the combined Tshwane municipality would increase by around 184%. It does however need to be noted that the size of the proposed Mangaung metropolitan municipality is 6284 km2.
The national average of metros is 1199 persons per km2. A combined Tshwane/Metsweding municipality will have a density of 981 persons per km2, which would be lower than the national norm (Gauteng, 2008: 139).
Table 30. Migrancy
Municipality Net in-migration
Population in 2006
Immigration percentage of
total population in 2006
Ethekwini 27277 2978811 0,92
Ekurhuleni 140252 2384020 5,88
Nelson Mandela 6715 1073114 0,63
Tshwane 137685 1926214 7,15
Cape Town 129400 2952385 4,38
Johannesburg 120330 2993716 4,02
Metsweding 18560 183304 10,13
Source: South African Cities Network, 2006.
The percentage net migrancy in Metsweding district is higher than the six metros and is an indication of the growing urbanisation in the area.
This growing urbanisation is a factor in favour of incorporation with a metropolitan council.
Interdependence of Areas
The growing development in Kungwini and its interdependence with Tshwane has already been mentioned and will be discussed further. The Gauteng megacity investigation indicated that there is development occurring in the Western parts of Kungwini and Nokeng (Gauteng, 2008: 19)
64
Tshwane’s Metropolitan Spatial Development Framework also includes the Kungwini area to the east of the municipality indicating the degree of integration between the two areas (Tshwane, 2008).
There are also linkages with Ekurhuleni. The Ekurhuleni Metropolitan Municipality (EMM) pointed out that the portions of land along the Albertina Sisulu (R21) Corridor currently falling in Kungwini would be better serviced from Ekurhuleni. Currently the land to the north of Ekurhuleni belongs to the same developer (M&T Development) and therefore straddles the two local municipalities. Thus, it makes sense to incorporate the land into one local government area. To its North West it shares the boundary with Tshwane Metropolitan area and Kungwini to the North East. This Corridor has been earmarked as a priority development area for EMM where considerable development and investments are envisaged. The Corridor is intended to link and support development generated by O.R Tambo International Airport in the South and Olifantsfontein / Clayville industrial area to the North. The study had identified the need to engage Kungwini as possible re-alignment of EMM’s boundary to include Sterkfontein, Witkoppies, and Doornkloof farms as an integral part of EMM. The reason for the re-alignment of the boundary is the location of the Olifantsfontein/Clayville that abuts with Kungwini, which has an informal settlement whose inhabitation mark in this industrial area. In fact the Corridor through Kungwini is a natural extension of development proposals in Ekurhuleni (Ekurhuleni, 2008). Furthermore, the Spatial Development Framework for the area has identified Olifantsfontein/Clayville Industrial Township as a major employment centre whose growth is supported in order to provide increased job opportunities to the surrounding area of Tembisa, Clayville and Winnie Mandela. Clayville residential area is currently being developed to accommodate in excess of 20 000 households. Some of the people to be accommodated reside within Kungwini as they have historically relied on services provided by EMM.

65
Commuting and Transport There is no data available on commuting although there is some data on transport. Table 31 Transport
Municipality On Foot
%
Bicycle %
Motorcycle %
Car as a
driver %
Car passenger
%
Minibus/ taxi %
Bus %
Train %
Other %
Not Applicable
%
Ekurhuleni 17.13 0.67 0.32 10.11 6.97 12.88 1.57 3.05 0.37 46.93
Tshwane 14.18 0.50 0.24 8.59 5.04 5.61 5.00 30.18 0.27 30.38
Johannesburg 20.95 0.39 0.35 12.70 8.35 15.44 2.97 3.27 0.45 56.09
Metsweding District Municipality
27.75 0.71 0.31 7.23 6.56 6.52 5.24 0.18 0.27 45.22
Nokeng tsa Taemane
24.83 0.77 0.42 8.21 7.62 4.12 4.87 0.16 0.15 48.79
Kungwini 29.20 0.69 0.25 6.75 6.03 7.71 5.41 0.19 0.33 43.41
Source: Statistics SA, Community Survey 2007.
This data indicates that a higher percentage of people in the two B municipalities use foot as a mode of transport compared to the metropolitan councils. More people in the metros drive cars although there is not much difference between the metro Tshwane (8.59%) and the non-metros Nokeng (8,21%) and Kungwini (6,75%).
(a) the interdependence of people, communities and economics as indicated by —
(ii) employment;

66
Table 32 Employment Levels
Municipality
Employed Unemployed Not economically active
N % N % N %
Ekurhuleni Metro 950 345 50.88 420 600 22.52 496 824 26.60
City of Tshwane 865 420 54.72 284 639 18.00 431 364 27.28
City of Johannesburg 1 417 464 53.68 596 420 22.59 626 770 23.74
Metsweding District Municipality 55 099 58.06 12 647 13.33 27 151 28.61
Mangaung 221 232 44.69 94 313 19.05 179 529 36.26
Nokeng tsa Taemane 17 582 63.71 2 894 10.49 7 120 25.80
Kungwini 37 516 55.74 9 753 14.49 20 033 29.77 Source: Statistics SA, Community Survey, 2007.
The employment levels are slightly higher in Nokeng (64%) and Kungwini (56%) than the metros. The unemployment rate is also lower in Nokeng (10%) and Kungwini (14%). The amalgamation of Kungwini and Metsweding will marginally increase the employment levels in Tshwane.
(b) the need for cohesive, integrated and unfragmented areas, including metropolitan areas
One critical issue for this investigation is that Bronkhorstspruit is approximately 50 kilometres from Pretoria. Will its inclusion into the metropolitan area lead to a cohesive and integrated area? There has been a healthy debate for some years about the relationship between city size and performance. There has been conflicting evidence about whether larger or smaller municipalities are more efficient (Cameron, 1999). A recent study by the World Bank, however, suggests that the size of the city population does have an impact on some services. The evidence suggests that in more populous cities it is more difficult to get access to services such as sewerage, water, and electricity (Leautier, 2006).
While the Western parts of Metsweding are geographically close to Tshwane, the vast rural tracts of land in the district are some distance from the metro and concern must be expressed as to whether the inclusion of such rural land will lead to cohesive, integrated, and unfragmented areas.

67
(c) the financial viability and administrative capacity of the municipality to perform municipal functions efficiently and effectively;
Table 33: Operating and Capital Budget
Municipality Population (2007) Opex 2006/07 (in Rand million)
Opex Budget Per capita
Capex 2006/07 (in Rand million)
Capex Budget Per capita
Ekurhuleni 2724229 9944245905 3650 1207706435 443
Tshwane 2345908 8587559000 3661 1586651000 676
Johannesburg 3888180 14509753 000 3732 3193219000 821
Metsweding District Municipality
153 539 41519452 270 1302000 8
Kungwini 104149 83284750 800 16782000 161
Nokeng tsa Taemane 49389 225530910 457 31409500 636
Sources: Municipal Demarcation Board, 2008, Gauteng Department of Local Government, 2008.
Operating Expenditure In the 2006/2007 year, the operating budgets of the three metros were all in excess of R8.5 billion. The budget of Kungwini was R225 million while that of Nokeng tsa Taemane is R83 million. Metsweding district had a budget of R41 million. The three Gauteng metros had a per capita expenditure of more than R3600 per annum while that of Kungwini is R800 and that of Nokeng tsa Taemane is R457. Based on the operating budgets for 2006/2007, the proposed amalgamated municipality would have a budget of around R8.6 billion. Capital Expenditure The capital expenditure of Tshwane is R 1 586 651 000 and that of Ekurhuleni is R 1 207 706 000. The capital budget of Kungwini is R 31 409 000 while that of Nokeng tsa Taemane is R16 782 000. The capital budget of Metsweding is R1.3 million. The per capita capital expenditure of Tshwane is R676 while that of Ekurhuleni is R443. The per capita budget of Nokeng is R636 and that of Kungwini’s is R161.

68
Based on the capital budgets for 2006/2007, the proposed amalgamated municipality would have a budget of around R1.635 billion. There would be marginal increases in Tshwane’s capital budget, which the metro should be able to spend comfortably. Table 34. Rates Base
Municipality Rates base R'000 (2007)
Ekurhuleni 1639318
Tshwane 1654578
Johannesburg 3 168 904
Metsweding District Municipality
n/a
Nokeng tsa Taemane
29786
Kungwini 86026
Source Municipal Demarcation Board, 2008, websites of metropolitan governments
The rates base of Nokeng is R2 9786 000 and that of Kungwini is R8 6026 000. These are dwarfed by Tshwane, which has a R1,63 billion rates base, as well as Ekurhuleni with R1.65 billion rates base. The inclusion of Nokeng and Kungwini into Tshwane will make little difference to the rates base of the metropolitan authority.
69
Table 35. Staffing Levels
Municipality Number of staff
Staff budget
Staff per capita ratio
Ekurhuleni 14964 2389202000 182
Tshwane 12357 2383044000 190
Johannesburg 25996 3541051000 150
Metsweding District Municipality 32 34303204
4798
Nokeng tsa Taemane 243 8736360
429
Kungwini 917 217558461 54
Sources. South African Cities Network, 2006, Gauteng Department of Local Government, 2008, Municipal Demarcation Board, 2008.
The staffing levels are high in the metros with Tshwane having 12 357 staff and Ekurhuleni 14 964. Kungwini has 917 staff and Nokeng tsa Taemane has 243 staff. The staff per capita ratio ranges from 190 in Tshwane to 150 in Johannesburg for the metros. The figures for Nokeng and Kungwini are 429 and 54, respectively. The staffing levels of Tshwane would increase from 12 357 to 13 549 if the Metsweding district jurisdiction is amalgamated with it. One of the issues that needs to be considered is whether Tshwane municipality would have the capacity to deal with a 184% increase in size. It needs be reiterated that this size is not unprecedented. Mangaung has a size of 6284 km2. Tshwane seems to have both the financial resources and capacity to service Metsweding. although one study suggests that the possibility exists that the amalgamation would stretch the Human Resource capacity of the metro. (Gauteng, Department of Local Government, 2008:142) It also needs to be noted that this area is generally sparsely populated and would perhaps not require extensive service provision. Such service provision can occur on a decentralised basis. Existing municipality offices in Metsweding can continue to be used as sites of service delivery. This could ensure accountability to residents of this area.

70
(d) the need to share and redistribute financial and administrative resources;
When the Demarcation Board put the current boundaries together in 1999/2000, it was a careful mix of richer and poorer municipalities. One of its principles was that of resource sharing. Wherever possible, existing municipalities should be combined with a view to realising fiscally sustainable units, with weaker areas being paired with stronger areas to achieve a sharing of existing or potential resources (Municipal Demarcation Board, 2001).
There are not substantial service backlogs in the Metsweding district’s jurisdiction. The need to redistribute resources does not then seem to be a major factor that needs to be taken into account in this investigation.
(e) provincial and municipal boundaries;
Kungwini was a cross-boundary municipality until 2005. It was subsequently included in Gauteng province. This means that no provincial boundaries are affected. Provincial boundaries would not be affected by redemarcation.
Metsweding district municipality along with Nokeng tsa Taemane and Kungwini local municipalities will be disestablished. Most of Kungwini will be included in Tshwane although a small portion will be included in Ekurhuleni.
(f) areas of traditional rural communities;
No traditional rural areas would be affected by the proposed demarcation.
(g) existing and proposed functional boundaries, including magisterial districts, health, transport, police and census enumerator boundaries.
If Metsweding is combined with Tshwane municipality it will become part of the Tshwane health authority.
Education boundaries are in the process of being aligned with district boundaries. If Metsweding is combined with Tshwane municipality it will become part of the Tshwane education district.

71
Police boundaries do not correspond to municipality boundaries as indicated on the attached map.
Census enumerator boundaries are the building blocks of wards which are contained within existing local government boundaries.
Magisterial districts are in the process of being reviewed and should therefore not be taken into consideration for this demarcation exercise.
(h) existing and expected land use, social, economic and transport planning;
This factor was discussed in Section 25 (a).
(i) the need for co-ordinated municipal, provincial and national programmes and services, including the needs for the administration of justice and health care;
The demarcation proposals seem to be consistent with the National Spatial Development Framework and the Gauteng Provincial Spatial Development framework (Gauteng Department of Local Government, 2008).
(j) topographical, environmental and physical characteristics of the area;
There are no topographical environment and physical constraints, which prohibit the proposed amalgamation.
(k) the administrative consequences of its boundary demarcation on —
(i) municipal creditworthiness;
(ii) existing municipalities, their council members and staff; and
(iii) any other relevant matter;
The inclusion of Metsweding into Tshwane should not have any significant effect on the metro’s municipal creditworthiness. The municipality would still have a significant tax base along with substantial capital and operating expenditure.
There would be an effect on the number of councillors. There would have to be a re-determination of the number of councillors by the MEC for local government. The MEC has a 10% variation within the limit determined by the Minister of Local

72
Government although there is a limit of 270 councillors for metropolitan authorities. The number of councillors should fall comfortably within this range.
There would also have to be a re-determination of wards by the MDB. The wards in Nokeng and Kungwini would be far larger geographically than is currently the case and there would be less councillors. However this could be offset by improvements in service delivery given the evidence that was received about poor level of service provision.
The implementation of the MDB’s recommendations will entail the dissolution of Metsweding district municipality and the Kungwini and Nokeng municipalities. This would involve the transfer of the powers and functions of both the B and C municipalities to the Tshwane and Ekurhuleni metros. All the local government functions listed in Schedule 4B and 5B of the Constitution would be performed by Tshwane except for the few farms that would now fall under the jurisdiction of Ekurhuleni.
(m) the need to rationalise the total number of municipalities within different categories and of different types to achieve the objectives of effective and sustainable service deliver financial viability and macro-economic stability.
It could be argued that this criterion largely applied to the 1999/2000 local government elections where there was the expectation that the Municipal Demarcation Board would rationalise municipalities in order to break down apartheid settlement patterns in order to create non-racial, sustainable municipalities. Large-scale rationalisation occurred with the reduction of the number of municipalities from 843 to 284 (subsequently 283). Boundary demarcation is not, however, a static process. The reason why there is a permanent Demarcation Board is precisely to review boundaries constantly in the light of changing developments. Given the greater linkages between Tshwane and Kungwini the Board is justified in once more rationalising the total number of municipalities Findings There is sufficient integration between the urbanised parts of Kungwini to warrant recommending including them in Tshwane metro. The distance between Tshwane and Bronkhorstpruit is also only 50 km, which makes the area a manageability entity. It is also recommended that the farms in the Northeast of the R21 development corridor be included in Ekurhuleni.

73
One issue that needs to be considered is the size of the proposed Tshwane metro. It will be substantially bigger than any other metropolitan authority with the size is being 6237.5 km2. (the inclusion of the few farms into Ekurhuleni will only make a marginal difference to the size)
Will a metro of this size not be too unwieldy and unmanageable to promote effective service delivery? It needs to be noted that a municipality of this size is not unprecedented. Mangaung Category B has a density of 4284 km2.
Notwithstanding this it is recommended that consideration be given in the future to excising the rural parts of Kungwini from the municipality and including them in neighbouring districts in Mpumalanga. This would require changes to the provincial boundaries and this issue could possibly fall as part of the White Paper on Local Government process. Nokeng tsa Taemane will be the only remaining Category B in the Metsweding district area. The district will need to be disestablished as a one-on-one municipality. Besides the fact that this is probably unconstitutional, it will not lead to the fulfilment of the goals of district municipalities. It is recommended that this municipality be disestablished and be combined with Tshwane. It is also recommended that consideration be given to the rural parts of Nokeng and that they should be included in neighbouring districts in Mpumalanga. Summary of Recommendations
Kungwini municipality should be disestablished and included in the Tshwane metropolitan council.
Sterkfontein, Witkoppies and Doornkloof farms should be included in Ekurhuleni metropolitan council.
Nokeng tsa Taemane should be disestablished and included in the Tshwane metropolitan council.
Metsweding district municipality should be disestablished and included in the Tshwane metropolitan council.
Issues for Future Consideration
An investigation should be conducted in future to ascertain which rural areas of Kungwini and Nokeng tsa Taemane should be excised from the municipality and included in the neighbouring districts in Mpumalanga province. This could possibly be part of the White Paper for Provincial and Local Government process.

74
BIBLIOGRAPHY Atkinson, D. 2003. ‘A Passion to Govern’-third generation issues facing local government in South Africa, Centre for Development Enterprise, Johannesburg. Buffalo City 2007. Draft Annual Report 2006/7. Cameron, R. G. 1999. Democratisation of South African Local Government. A Tale of Three Cities, Pretoria: J L van Schaik. Cameron, R. G. 2002. Local Government Research report, unpublished paper, Cape Town. Cameron, R. G. 2005. Metropolitan Government Restructuring (and more restructuring) in South Africa’ Public Administration and Development. Cameron, R G 2006. Environmental Health in the West Coast. The Decentralisation Quandary in Journal of Public Administration 41 (2). Community Law Centre 2007A Redefining the Role and Application of District Municipalities,. Local Government Project. Community Law Centre. Community Law Centre, 2007B. Single-Tier Local Government for Major UrbanAreas. Local Government Project. Community Law Centre Statistics SA 2001. 2001 Census. Statistics SA 2007. Community Survey. Ekurhuleni, 2008. Redetermination of Municipal Boundaries: Land to the North of Ekurhuleni Municipality. 18 February 2008. Gauteng Department of Local Government, 2008. Feasibility Study on Moving Towards a Metro form of government in Gauteng Province. Leautier, F. A. 2006. Cities in a Globalizing World. Governance, Performance and Sustainability Washington, World Bank. Mangaung. 2007. IDP 2006/7 Bloemfontein. MCA Planners. 2005. Revisiting the demarcation and establishment of metropolitan Authorities in South Africa: An exploratory paper. Paper prepared for the Municipal Demarcation Board.

75
Municipal Demarcation Board, 1999A. Study of Metropolitan Areas and Large Urban Centres, Pretoria. Municipal Demarcation Board, 1999B. Nodal Points for Metropolitan and District Council Areas in South Africa, Pretoria. Municipal Demarcation Board, 2001. Annual Report 2000/2001, Pretoria. Municipal Demarcation Board, 2003. Categorisation of Municipalities.: Study on Metropolitan and Large Category B Areas, Pretoria. Municipal Demarcation Board, 2008. 2007/2008 Capacity Assessments. Msunduzi 2007. Integrated Development Planning 2006-2011.Pietermaritzburg. Msunduzi, 2008. Category A Status for the Category A Status for the Msunduzi Local Municipality. Pitermaritzburg. Portfolio Committee 2003. Portfolio Committee on Provincial and Local Government. National Assembly. Report on Study Tour of Municipalities. Cape Town. Provincial Affairs and Constitutional Development, 1998. The White Paper on Local Government, Pretoria: Government Printer. RSA (Republic of South Africa), 1998A. Local Government: Municipal Structures Act, Cape Town: Government Printer. RSA (Republic of South Africa), 1998B. Local Government: Municipal Demarcation Act, Cape Town: Government Printer. RSA (Republic of South Africa) 2000. Municipal Structures Amendment Act, Cape Town: Government Printer. South African Cities Network, 2004. State of the Cities Report 2004: Cape Town.
South African Cities Network, 2006. State of the Cities Report 2006. Cape Town. Tshwane, 2008. Draft Second Revised Tshwane IDP for 2008/09, Pretoria. University of KwaZulu-Natal, 2008. Economic and Business Report. Pietermaritzburg and Umgungdlovu District.School of Economics and Finance. Websites Independent Electoral Commission

76
Municipal Demarcation Board The websites of the individual municipalities were also perused

77
SUMMARY OF SUBMISSIONS The following is a summary of all the major arguments received in the submissions. These arguments were taken into account when drafting the report. Only arguments received that conformed to the relevant legislation, namely, Section 2 of the Local Government: Municipal Structures, Act, 1998 and Sections 24 and 25 of the Local Government: Municipal Demarcation Act, 1998 were considered. Mzunduzi Arguments in favour of Msunduzi becoming a Metropolitan Municipality
The municipality performs all the services in the area;
The district has very little capacity;
The district hardly performs any of its functions;
There is a duplication of political structures;
There are conflicting integrated development plans and local economic development plans;
The capital budget may increase if there is a Category A municipality in the area;
uMngeni district municipality has social and economic links with Mzunduzi;
Howick municipality has social and economic links with Mzunduzi;
The area has a number of business and industrial areas;
Extensive development characteristics the conurbation;
There is an intense movement of goods and services in the area
The Pietermaritzburg area economy has more than doubled, in terms of turnover, in the past three years;
The recent rapid economic growth in the area has resulted in considerable strain on Pietermaritzburg’s entire infrastructure;
Msunduzi is already a water authority and performs all the Category C functions.
Arguments against Mzunduzi becoming a metropolitan authority

78
No submissions were received opposing Msunduzi becoming a metropolitan authority.
Buffalo City Arguments in favour of Buffalo City becoming a metropolitan authority
There have been a number of developments since 2000. It now boasts its own industrial development zones with 3 shopping values, with a total investment of just under 2 million, under construction.
Arguments against Buffalo City becoming a metropolitan authority
No objective change has taken place in the socio-economic landscape of Buffalo City since 2000.
Buffalo City does not have a complex and diverse economy
Buffalo City could be delinked from national, provincial and district level development agendas
Great Kei Arguments in favour of combining Great Kei with Buffalo City
Linking Great Kei with Buffalo City will improve economic development in Great Kei;
Poor and non-existent service delivery in Great Kei;
Independence of people, economies and communities. Arguments against combining Great Kei with Buffalo City
Rural areas will suffer if included with Buffalo City which has a poor record of dealing with rural communities.
Mangaung

79
Arguments in favour of Mangaung becoming a metropolitan municipality.
Mangaung has been recognised in national development and provincial growth development strategies as fast growing and strategic to the development of the province;
Mangaung enjoys financial stability and has good financial viability;
Mangaung already provides a variety of district functions; Arguments against Mangaung becoming a metropolitan authority
No submissions were received opposing Mangaung becoming a metropolitan authority.
Metsweding Arguments in favour of Metsweding combining with Tshwane/Ekurhuleni
Farms in Kungwini for part of R21 development corridor of Ekurhuleni;
Economic linkages between Ekurhuleni and farms in Kungwini.
Poor service provision in Kungwini Arguments against Metsweding combining with Tshwane/Ekurhuleni
Opposed to the inclusion of 3 wards only into Tshwane as it would weaken the financial base of Kungwini
The interests of Metsweding would be swamped in a big metropole

80
MAPS


