Investigation of Antenna RCS into Structural and Antenna mode components M L Meena, Abhinav Bharat, B Choudhary, S Rankawat, H Sharma, S Sunil Kumar*, Anjali Bhatia Defence Laboratory, DRDO Jodhpur, India-342011 *[email protected]Abstract- RCS of a complex target, say aircraft, is contributed by various features on the assembly. The overall RCS of such complex targets can be obtained by vector summation of the individual scattering components. The Antenna is observed to be one of major RCS contributors, especially for low RCS targets. The Antenna RCS is a measure of reflected energy from Antenna under consideration. The Antenna RCS can be subdivided into two components: Structural mode and Antenna mode. While the Structural mode RCS is independent of Antenna operating frequency and solely depends on its effective cross-section at the desired look angle, the Antenna mode RCS is highly dependent on its operating frequency range and the discontinuities/terminations (load impedance) along the antenna waveguide structure. In this paper, we will investigate the Structural mode and Antenna mode RCS of an standard gain X-Band (8.2-12.4 GHz) Horn Antenna using both computational study and experimental demonstration. The polarization dependence of Antenna RCS levels will also be studied. Analysis of effect of various load impedances at Antenna termination will also be performed. Keywords- Radar Cross Section (RCS), Antenna mode RCS, Structural mode RCS, Reflection coefficent, Matched load. I. INTRODUCTION An Antenna, as test target, is a radar scatterer, which exhibits significant Radar Cross Section (RCS) in frontal sector. In many applications, Antennas are mounted on the surface of the complex targets such as aircraft, missiles and satellites. In that case, the RCS of antenna becomes part of the overall RCS of complex target. In such configurations when many Antennas are present, the overall RCS becomes large[1]. Therefore, while designing low-RCS targets, consideration of Antenna contribution become an important task. For Antenna designer, it is a great challenge to design a low RCS Antenna without affecting its radiation performance. In order to design a low RCS Antenna, the idea of various scatterings involved for active elements like Antenna becomes mandatory. The purpose of this study is to perform an analysis of the various scattering components involved in Antenna (a standard Horn antenna) by means of both measurement and computation studies. The fundamental theory relating to Antenna mode and Structural mode scattering has been referred from [2]. In essence, while the Structural mode scattering from Antenna is related to the reflections from the structure of antenna, the Antenna mode scattering is related to the reflections of coupled Electromagnetic waves that are caused due to imperfect termination/ port mismatch at the Antenna end. A standard gain X-Band Horn Antenna, that is available at the DLJ RCS measurement facility, has been used for analysis of various scattering phenomenon using both Computational and Measurement study. While most of the computations have been performed using MLFMM solver, the results have been verified further using FDTD and FEM solvers. Successively, measurement results have been presented for various load impedance conditions at antenna port and also, for both Horizontal and Vertical polarizations. II. HORN ANTENNA DESIGN AND CHARACTERIZATION A Pyramidal Horn Antenna, already available at the DLJ RCS measurement facility, has been emulated in CEM solver for its characterization. The various parameters that were supplied for the design are waveguide dimension (a: larger dimension of waveguide, b: smaller dimension of waveguide, length of waveguide), aperture dimension (A & B), port size, port position, etc (refer Figure 1). As can be inferred from the design shown, the aperture dimension A is smaller than B. The Antenna Flare angle is about 11.5 o . The Antenna model has been simulated over the frequency range of 9 to 11GHz. Figure 1 Demonstration of various parameters of Standard gain X-Band Horn Antenna Figure 2 shows the computed broadband (5 GHz-15 GHz) gain response of standard Horn antenna using MLFMM solver. It is observed that the Antenna cut-off frequency is close to 8 GHz, and the Antenna gain is increasing gradually after the cut-off frequency. Antenna Test & Measurement Society (ATMS India-16) 01-03 Feb, 2016 1 Goa, India
Transcript
Investigation of Antenna RCS into Structural and Antenna mode components M L Meena, Abhinav Bharat, B Choudhary, S Rankawat, H Sharma, S Sunil Kumar*, Anjali Bhatia
Abstract- RCS of a complex target, say aircraft, is contributed by various features on the assembly. The overall RCS of such complex targets can be obtained by vector summation of the individual scattering components. The Antenna is observed to be one of major RCS contributors, especially for low RCS targets.
The Antenna RCS is a measure of reflected energy from Antenna under consideration. The Antenna RCS can be subdivided into two components: Structural mode and Antenna mode. While the Structural mode RCS is independent of Antenna operating frequency and solely depends on its effective cross-section at the desired look angle, the Antenna mode RCS is highly dependent on its operating frequency range and the discontinuities/terminations (load impedance) along the antenna waveguide structure.
In this paper, we will investigate the Structural mode and Antenna mode RCS of an standard gain X-Band (8.2-12.4 GHz) Horn Antenna using both computational study and experimental demonstration. The polarization dependence of Antenna RCS levels will also be studied. Analysis of effect of various load impedances at Antenna termination will also be performed.
I. INTRODUCTION An Antenna, as test target, is a radar scatterer, which
exhibits significant Radar Cross Section (RCS) in frontal sector. In many applications, Antennas are mounted on the surface of the complex targets such as aircraft, missiles and satellites. In that case, the RCS of antenna becomes part of the overall RCS of complex target. In such configurations when many Antennas are present, the overall RCS becomes large[1]. Therefore, while designing low-RCS targets, consideration of Antenna contribution become an important task. For Antenna designer, it is a great challenge to design a low RCS Antenna without affecting its radiation performance. In order to design a low RCS Antenna, the idea of various scatterings involved for active elements like Antenna becomes mandatory.
The purpose of this study is to perform an analysis of the various scattering components involved in Antenna (a standard Horn antenna) by means of both measurement and computation studies. The fundamental theory relating to Antenna mode and Structural mode scattering has been
referred from [2]. In essence, while the Structural mode scattering from Antenna is related to the reflections from the structure of antenna, the Antenna mode scattering is related to the reflections of coupled Electromagnetic waves that are caused due to imperfect termination/ port mismatch at the Antenna end.
A standard gain X-Band Horn Antenna, that is available at the DLJ RCS measurement facility, has been used for analysis of various scattering phenomenon using both Computational and Measurement study. While most of the computations have been performed using MLFMM solver, the results have been verified further using FDTD and FEM solvers. Successively, measurement results have been presented for various load impedance conditions at antenna port and also, for both Horizontal and Vertical polarizations.
II. HORN ANTENNA DESIGN AND CHARACTERIZATION A Pyramidal Horn Antenna, already available at the
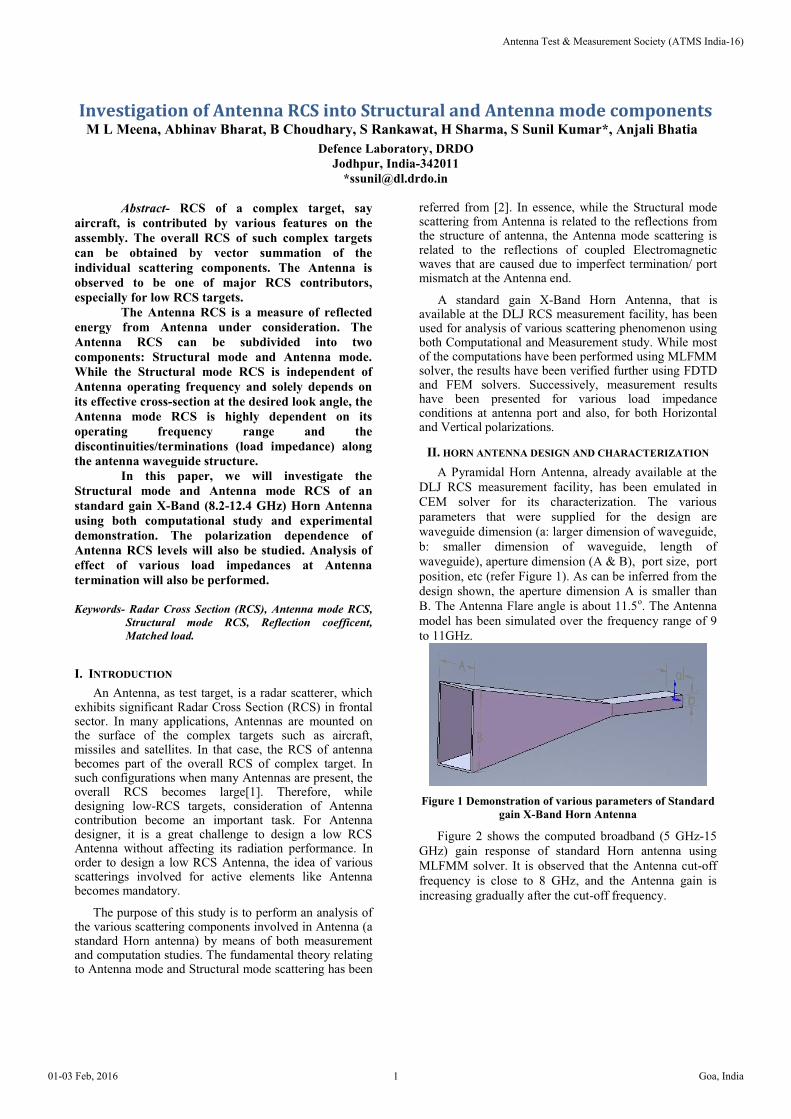
DLJ RCS measurement facility, has been emulated in CEM solver for its characterization. The various parameters that were supplied for the design are waveguide dimension (a: larger dimension of waveguide, b: smaller dimension of waveguide, length of waveguide), aperture dimension (A & B), port size, port position, etc (refer Figure 1). As can be inferred from the design shown, the aperture dimension A is smaller than B. The Antenna Flare angle is about 11.5o. The Antenna model has been simulated over the frequency range of 9 to 11GHz.
Figure 1 Demonstration of various parameters of Standard
gain X-Band Horn Antenna
Figure 2 shows the computed broadband (5 GHz-15 GHz) gain response of standard Horn antenna using MLFMM solver. It is observed that the Antenna cut-off frequency is close to 8 GHz, and the Antenna gain is increasing gradually after the cut-off frequency.
Antenna Test & Measurement Society (ATMS India-16)
01-03 Feb, 2016 1 Goa, India
Figure 2 Computed broadband (5 GHz-15 GHz) Gain
response of standard Horn antenna using MLFMM solver at normal incidence
Figure 3 shows the Cartesian plot of computed gain pattern of Antenna at 10 GHz using MLFMM, FDTD and FEM solvers. The gain of Antenna is observed as 15.5 dB using MLFMM solver, 16.3 dB using FDTD solver and 16.6 dB using FEM solver, respectively.
Figure 4 shows the visualization of 3-D pattern of Horn antenna at 10 GHz, computed using MLFMM solver. It is observed that the gain of main lobe is 15.5 dB (same as shown in Cartesian plot) with 35o beam width. It is also observed that side lobes are considerably reduced in magnitude, as compared to the main lobe.
Figure 3 Computed Gain pattern of standard Horn antenna using various CEM solvers at 10 GHz (red- MLFMM, blue-
FEM, green- FDTD solver)
Figure 4 3D Gain pattern of standard Horn antenna at
10GHz using MLFMM solver
Similarly, Figure 5 shows the computed gain pattern of Antenna at 9, 10 & 11 GHz frequencies. The gain and beam-width of Antenna is 14.3dB & 44.2o for 9 GHz frequency, 15.3dB & 38.6o at 10 GHz frequency and 15.3 dB & 36.5o at 11GHz frequency.
Figure 5 Computed Gain pattern of standard Horn antenna
using MLFMM solver for various frequencies (9 GHz, 10 GHz & 11 GHz)
III. ANTENNA SCATTERING THEORY AND ANALYSIS
When Electromagnetic field is incident on Antenna, the scattered energy can be divided into two components namely: Antenna mode (Ea) & Structural mode (Es). The equation for the total scattered field can be expressed as[4]:
��⃗ = ��⃗ � + ��⃗ � (1)
For Structural mode (Es) component, the scattered field is due to the current induced onto Antenna surface & surrounding structures, while Antenna port is terminated with matched load. For Antenna mode (Ea) component, the scattered field is due to the induced current delivered to the Antenna port and reflected back.
By definition, the RCS of a target is equivalent to the projected area of a metallic sphere which scatters the same power in the same direction as the target. Antenna RCS (σ) is the summation of both Structural mode RCS (σst) & Antenna mode RCS (σan). Total RCS is given as:
� = ��� + ���� ���
(2)
where, φ is the phase difference between the two components. The Structural mode RCS depends on the structural characteristics of the target antenna such as the metal surface, corners, edges, etc. While Antenna mode RCS is related to the radiation characteristics of the target Antenna. Power received by Antenna will be fully absorbed, if the port is terminated with matched load and will be fully reflected back if the Antenna port is
Antenna Test & Measurement Society (ATMS India-16)
01-03 Feb, 2016 2 Goa, India
terminated with open/short load. This reflected power re-radiates as a source of target Antenna back-scattering. The reflection coefficient is given as:-
à = ����������
(3)
where, �� is the impedance of feed transmission line and �� is the impedance of Antenna. If �� is well matched to ��, then reflection coefficient is equal to zero. All coupled power will be absorbed by Antenna with matched load, thus Antenna mode RCS will reduce to zero, and only Structural mode component will contribute to the RCS.
The Antenna mode RCS component is directly proportional to the gain of Antenna (G), for a given direction, and the reflection coefficient (г) determined by antenna impedance and the complex conjugate of the impedance seen at the Antenna feed point. The relation between the Antenna mode scattering and the radiation property of Antenna is given as[5]:
���� = ��� ��
�� (4)
Where ���� is the monostatic RCS related to the
Antenna mode scattering, G is the Antenna gain pattern, λ is the wavelength and Γ is the reflection coefficient.
Figure 6 shows the Antenna gain (G) at 10 GHz frequency for various loads (short, open and matched loads). It is observed that the Antenna gain remains same for both short and matched load conditions and slightly decreases for open load. The open load condition at port is simulated by applying 1M ohms at the port, short load by 0.1 ohm and matched load by 50 ohms, respectively.
Further, in Figure 7, the S-parameter response (S11 or reflection coefficient, г) of Horn Antenna at various load conditions (50 ohm, 1M ohm & 0.1ohm) is shown, which indicates that the reflection coefficient of Antenna at matched load (50 ohm) is greater than 10 dB within the operating frequency band (9-11 GHz) and, is nearly zero for open (1M ohm) and short (0.1ohm) load conditions. So, it can be inferred that the Antenna mode RCS is mainly dependent on the type of Antenna port termination for a particular frequency.
Figure 6 Computed Gain response for 10 GHz at various
loads (i.e., matched- blue color, open- green color & short-red color) using MLFMM solver
Figure 7 Computed S11 parameter response at various
loads (50ohm- red color, 1M ohm- green color & 0.1ohm- blue color) using MLFMM solver
Figure 8 shows the bistatic RCS of Horn Antenna placed in same polarization as that of source antenna (co-polarized orientation), for various load conditions, at normal incidence. It is observed that the RCS scattering is minimum for matched load condition and maximum for short load conditions[1]. This can also be validated through Equation 4.
Figure 8 Computed bistatic RCS response at 10 GHz for co-
polarized orientation at various loads (50 ohm -red color, 1M ohm- blue color, 0.1ohm -green color) using MLFMM
solver
Further, Figure 9 shows the computed bistatic RCS of Horn antenna placed in opposite polarization as that of source antenna (cross-polarized orientation), for various load conditions, at normal incidence. No effect of Antenna port termination using various load conditions is observed for cross-polarized placed test target. So, it can be inferred that, in this case, the RCS contribution is only due to the Structural mode RCS component.
Figure 9 Computed bistatic RCS response at 10 GHz for cross-polarized orientation at various loads (50ohm -red color, 1M ohm- blue color, 0.1ohm- green color) using
MLFMM solver
Antenna Test & Measurement Society (ATMS India-16)
01-03 Feb, 2016 3 Goa, India
IV.RCS MEASUREMENTS AND COMPUTATIONS: RESULTS AND ANALYSIS
(a) Analysis of computed and measured Monostatic RCS for Co-polarized placed Antenna case:
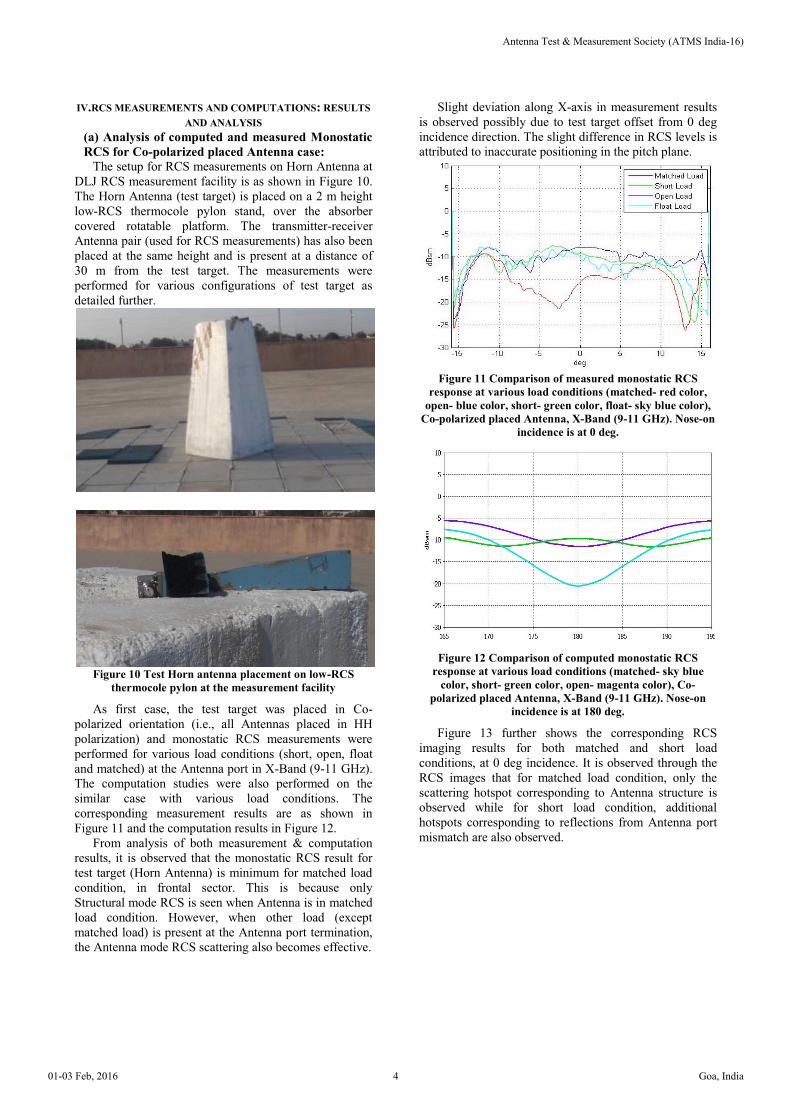
The setup for RCS measurements on Horn Antenna at DLJ RCS measurement facility is as shown in Figure 10. The Horn Antenna (test target) is placed on a 2 m height low-RCS thermocole pylon stand, over the absorber covered rotatable platform. The transmitter-receiver Antenna pair (used for RCS measurements) has also been placed at the same height and is present at a distance of 30 m from the test target. The measurements were performed for various configurations of test target as detailed further.
Figure 10 Test Horn antenna placement on low-RCS
thermocole pylon at the measurement facility
As first case, the test target was placed in Co-polarized orientation (i.e., all Antennas placed in HH polarization) and monostatic RCS measurements were performed for various load conditions (short, open, float and matched) at the Antenna port in X-Band (9-11 GHz). The computation studies were also performed on the similar case with various load conditions. The corresponding measurement results are as shown in Figure 11 and the computation results in Figure 12.
From analysis of both measurement & computation results, it is observed that the monostatic RCS result for test target (Horn Antenna) is minimum for matched load condition, in frontal sector. This is because only Structural mode RCS is seen when Antenna is in matched load condition. However, when other load (except matched load) is present at the Antenna port termination, the Antenna mode RCS scattering also becomes effective.
Slight deviation along X-axis in measurement results is observed possibly due to test target offset from 0 deg incidence direction. The slight difference in RCS levels is attributed to inaccurate positioning in the pitch plane.
Figure 11 Comparison of measured monostatic RCS
response at various load conditions (matched- red color, open- blue color, short- green color, float- sky blue color),
Co-polarized placed Antenna, X-Band (9-11 GHz). Nose-on incidence is at 0 deg.
Figure 12 Comparison of computed monostatic RCS
response at various load conditions (matched- sky blue color, short- green color, open- magenta color), Co-
polarized placed Antenna, X-Band (9-11 GHz). Nose-on incidence is at 180 deg.
Figure 13 further shows the corresponding RCS imaging results for both matched and short load conditions, at 0 deg incidence. It is observed through the RCS images that for matched load condition, only the scattering hotspot corresponding to Antenna structure is observed while for short load condition, additional hotspots corresponding to reflections from Antenna port mismatch are also observed.
Antenna Test & Measurement Society (ATMS India-16)
01-03 Feb, 2016 4 Goa, India
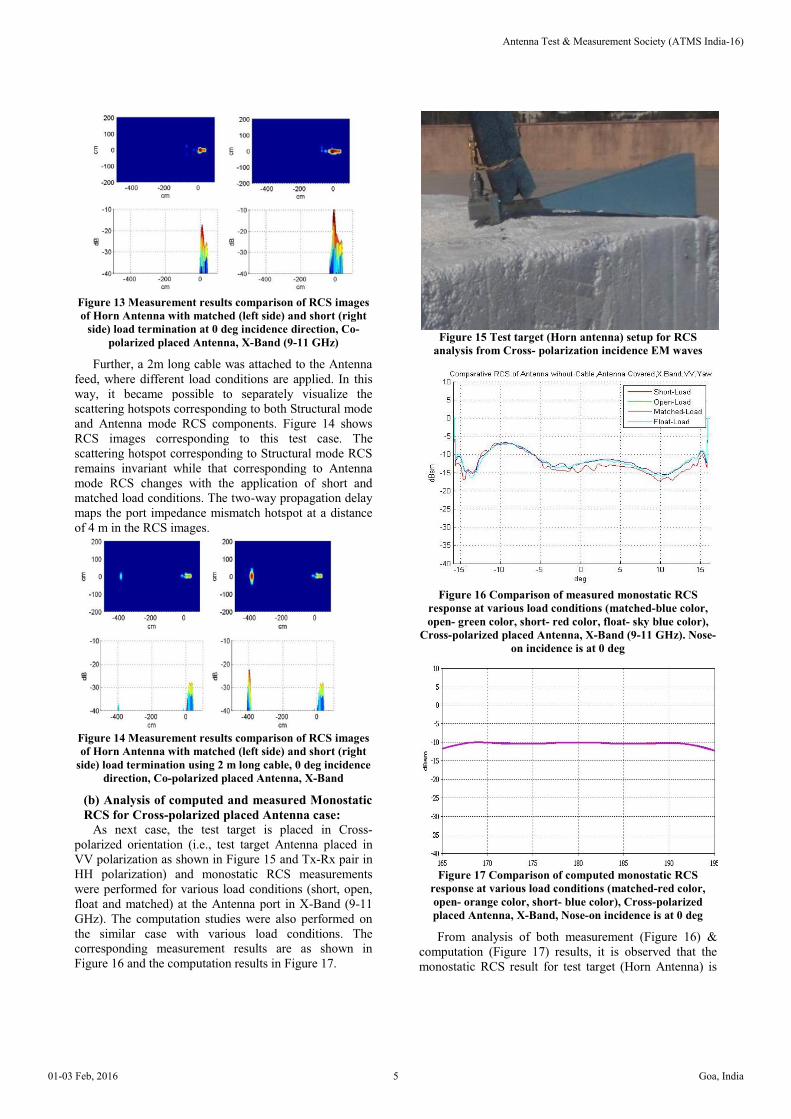
Figure 13 Measurement results comparison of RCS images of Horn Antenna with matched (left side) and short (right
Further, a 2m long cable was attached to the Antenna feed, where different load conditions are applied. In this way, it became possible to separately visualize the scattering hotspots corresponding to both Structural mode and Antenna mode RCS components. Figure 14 shows RCS images corresponding to this test case. The scattering hotspot corresponding to Structural mode RCS remains invariant while that corresponding to Antenna mode RCS changes with the application of short and matched load conditions. The two-way propagation delay maps the port impedance mismatch hotspot at a distance of 4 m in the RCS images.
Figure 14 Measurement results comparison of RCS images of Horn Antenna with matched (left side) and short (right
side) load termination using 2 m long cable, 0 deg incidence direction, Co-polarized placed Antenna, X-Band
(b) Analysis of computed and measured Monostatic RCS for Cross-polarized placed Antenna case:
As next case, the test target is placed in Cross-polarized orientation (i.e., test target Antenna placed in VV polarization as shown in Figure 15 and Tx-Rx pair in HH polarization) and monostatic RCS measurements were performed for various load conditions (short, open, float and matched) at the Antenna port in X-Band (9-11 GHz). The computation studies were also performed on the similar case with various load conditions. The corresponding measurement results are as shown in Figure 16 and the computation results in Figure 17.
Figure 15 Test target (Horn antenna) setup for RCS
analysis from Cross- polarization incidence EM waves
Figure 16 Comparison of measured monostatic RCS
response at various load conditions (matched-blue color, open- green color, short- red color, float- sky blue color),
Cross-polarized placed Antenna, X-Band (9-11 GHz). Nose-on incidence is at 0 deg
Figure 17 Comparison of computed monostatic RCS
response at various load conditions (matched-red color, open- orange color, short- blue color), Cross-polarized placed Antenna, X-Band, Nose-on incidence is at 0 deg
From analysis of both measurement (Figure 16) & computation (Figure 17) results, it is observed that the monostatic RCS result for test target (Horn Antenna) is
Antenna Test & Measurement Society (ATMS India-16)
01-03 Feb, 2016 5 Goa, India
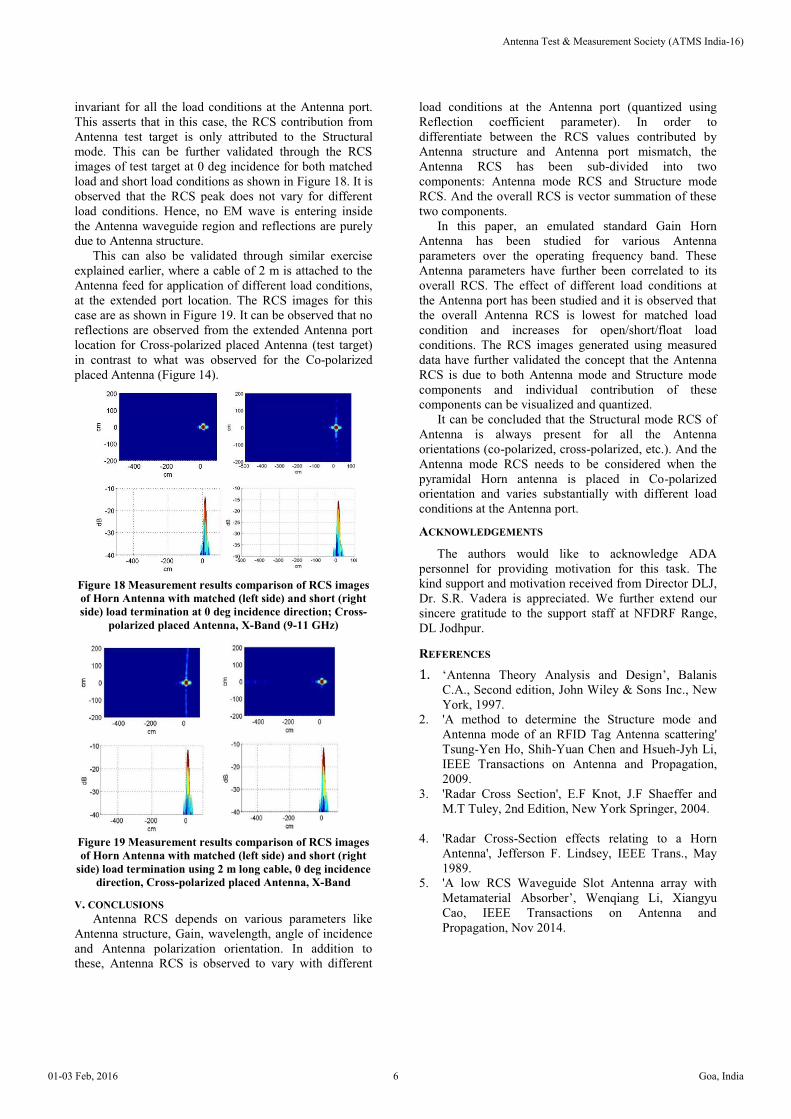
invariant for all the load conditions at the Antenna port. This asserts that in this case, the RCS contribution from Antenna test target is only attributed to the Structural mode. This can be further validated through the RCS images of test target at 0 deg incidence for both matched load and short load conditions as shown in Figure 18. It is observed that the RCS peak does not vary for different load conditions. Hence, no EM wave is entering inside the Antenna waveguide region and reflections are purely due to Antenna structure.
This can also be validated through similar exercise explained earlier, where a cable of 2 m is attached to the Antenna feed for application of different load conditions, at the extended port location. The RCS images for this case are as shown in Figure 19. It can be observed that no reflections are observed from the extended Antenna port location for Cross-polarized placed Antenna (test target) in contrast to what was observed for the Co-polarized placed Antenna (Figure 14).
Figure 18 Measurement results comparison of RCS images of Horn Antenna with matched (left side) and short (right side) load termination at 0 deg incidence direction; Cross-
polarized placed Antenna, X-Band (9-11 GHz)
Figure 19 Measurement results comparison of RCS images of Horn Antenna with matched (left side) and short (right
side) load termination using 2 m long cable, 0 deg incidence direction, Cross-polarized placed Antenna, X-Band
V. CONCLUSIONS Antenna RCS depends on various parameters like
Antenna structure, Gain, wavelength, angle of incidence and Antenna polarization orientation. In addition to these, Antenna RCS is observed to vary with different
load conditions at the Antenna port (quantized using Reflection coefficient parameter). In order to differentiate between the RCS values contributed by Antenna structure and Antenna port mismatch, the Antenna RCS has been sub-divided into two components: Antenna mode RCS and Structure mode RCS. And the overall RCS is vector summation of these two components.
In this paper, an emulated standard Gain Horn Antenna has been studied for various Antenna parameters over the operating frequency band. These Antenna parameters have further been correlated to its overall RCS. The effect of different load conditions at the Antenna port has been studied and it is observed that the overall Antenna RCS is lowest for matched load condition and increases for open/short/float load conditions. The RCS images generated using measured data have further validated the concept that the Antenna RCS is due to both Antenna mode and Structure mode components and individual contribution of these components can be visualized and quantized.
It can be concluded that the Structural mode RCS of Antenna is always present for all the Antenna orientations (co-polarized, cross-polarized, etc.). And the Antenna mode RCS needs to be considered when the pyramidal Horn antenna is placed in Co-polarized orientation and varies substantially with different load conditions at the Antenna port.
ACKNOWLEDGEMENTS
The authors would like to acknowledge ADA personnel for providing motivation for this task. The kind support and motivation received from Director DLJ, Dr. S.R. Vadera is appreciated. We further extend our sincere gratitude to the support staff at NFDRF Range, DL Jodhpur.
REFERENCES 1. ‘Antenna Theory Analysis and Design’, Balanis
C.A., Second edition, John Wiley & Sons Inc., New York, 1997.
2. 'A method to determine the Structure mode and Antenna mode of an RFID Tag Antenna scattering' Tsung-Yen Ho, Shih-Yuan Chen and Hsueh-Jyh Li, IEEE Transactions on Antenna and Propagation, 2009.
3. 'Radar Cross Section', E.F Knot, J.F Shaeffer and M.T Tuley, 2nd Edition, New York Springer, 2004.
4. 'Radar Cross-Section effects relating to a Horn Antenna', Jefferson F. Lindsey, IEEE Trans., May 1989.
5. 'A low RCS Waveguide Slot Antenna array with Metamaterial Absorber’, Wenqiang Li, Xiangyu Cao, IEEE Transactions on Antenna and Propagation, Nov 2014.
Antenna Test & Measurement Society (ATMS India-16)