Page 1
February 2012
“Babeş-Bolyai” University, Cluj-Napoca
Faculty of Physics
& Interdisciplinary Research Institute on Bio-Nano-Sciences
INVESTIGATION OF BIOLOGICALLY
ACTIVE COMPOUNDS
PhD Thesis
Summary
Mureşan-Pop Marieta
Scientific coordinator:
Prof. dr. Simon Simion
Page 3
Content
Abstract...........................................................................................................................1
1 Introduction and motivation..................................................................................... 3
1.1 Ambazone: Historic. Properties. ....................................................................... 3
1.2 Background information: Polymorphism. Salts. Cocrystals. ........................... 3
2 Solid forms. Methods of preparation and investigations ......................................... 5
2.1 Methods of preparation of new solid forms and growth of single crystals
Error! Bookmark not defined.
3 Experimental procedure ........................................................................................... 6
3.1 Ambazone monohydrate and anhydrous .......................................................... 6
3.1.1 DTA-TGA analysis ...................................................................................... 7
3.1.2 Powder X-Ray Diffraction (PXRD) ............................................................. 7
3.1.3 Variabile Temperature Powder X-Ray Diffraction (VTPXRD) .................. 8
3.1.4 Fourier Transformed Infrared Spectroscopy (FTIR).................................... 9
3.1.5 Solid state 13C NMR Spectroscopic analysis ............................................. 10
3.1.6 Scanning Electron Microscopy SEM ......................................................... 10
3.1.7 Crystal structure determination from X-ray Single-crystal diffraction ...... 10
3.2 Ambazone acetate........................................................................................... 13
3.2.1 Powder X-Ray Diffraction (PXRD) ........................................................... 13
3.2.2 DTA-TGA analysis .................................................................................... 14
3.2.3 Variabile temperature powder X-ray diffraction (VTPXRD) .................... 16
3.2.4 Fourier Transformed Infrared Spectroscopy (FTIR).................................. 16
3.2.5 Crystal structure determination from X-ray Single-crystal diffraction ...... 17
3.3 Ambazone hydrocloride ................................................................................. 18
3.3.1 DTA-TGA analysis .................................................................................... 18
3.3.2 Powder X-ray diffraction (PXRD) ............................................................. 19
3.3.3 Fourier Transformed Infrared Spectroscopy (FTIR).................................. 20
3.3.4 Solid state 13C and 15N NMR Spectroscopic analysis ................................ 20
3.4. Ambazone glutamate ...................................................................................... 21
3.4.2. Powder X-Ray Diffraction (PXRD) ........................................................... 22
3.4.3. Fourier Transformed Infrared Spectroscopy (FTIR).................................. 22
3.4.4. Solid state 13C RMN Spectroscopic analysis. ............................................ 23
3.5. Ambazone p-Aminobenzoate ......................................................................... 24
Page 4
3.5.1. DSC, DTA-TGA analysis .......................................................................... 24
3.5.2. Powder X-Ray Diffraction (PXRD) ........................................................... 25
3.5.3. Fourier Transformed Infrared Spectroscopy (FTIR).................................. 25
3.5.4. Solid-state 13C NMR Spectroscopic analysis ............................................. 26
3.6. Ambazone aspartate........................................................................................ 27
3.6.1. DTA-TGA analysis .................................................................................... 27
3.6.2. Powder X-Ray Difraction (PXRD) ............................................................ 28
3.6.3. Powder X-ray difraction with variabile temperatura (VTPXRD) .............. 28
3.6.4. Fourier Transformed Infrared Spectroscopy (FTIR).................................. 29
3.6.5. Solid state 13C NMR Spectroscopic analysis ............................................. 30
3.7. Ambazone nicotinate ...................................................................................... 31
3.7.1. DSC, DTA-TGA analysis .......................................................................... 32
3.7.2. Powder X-Ray Difraction (PXRD) ............................................................ 33
3.7.3. Fourier Transformed Infrared Spectroscopy (FTIR).................................. 33
3.8. Ambazone lactate ........................................................................................... 34
3.8.2. Powder X-Ray Difraction (PXRD) ............................................................ 35
3.8.3. Fourier Transformed Infrared Spectroscopy (FTIR).................................. 36
4. Conclusions, original contributions, results, perspectives ..................................... 37
Selected references: .................................................................................................. 39
Keywords: Ambazone, solid forms, monocrystals, solvent drop grinding, slurry, vapor
diffusion, vapor diggestion, liquid diffusion, X-Ray variabile temperature, X-Ray Single-
Crystal Diffraction, FTIR.
Page 5
1
ABSTRACT
The biologically active compound chosen for this study is an antimicrobial substance
named Ambazone. This compound belongs to the class of antimicrobial drugs, is the active
compound in Faringosept and is used frequently in local treatments of oral and pharyngeal
cavity. Ambazone was less characterized in terms of structural properties and of the
possibility of formation of new solid forms. It’s known that solid forms include polymorph,
solvates, salts, hydrates and co-crystals. Solid forms can greatly improve active compound in
terms of solubility, bioavailability and dissolution rate. This study is mainly aimed to obtain
as many Ambazone solid forms and their characterization in structural terms. The need to
obtain solid forms of Ambazone result from the fact that it is very slightly soluble in water
and solid forms of Ambazone can help to increase the solubility and thus to improve the
quality of this pharmaceutical compound.
The thesis is structured in three chapters, ending with general conclusions and
perspectives. The first chapter deals with the physical-chemical and pharmaceutical properties
of Ambazone. The second chapter contains a brief overview of methods for obtaining and
characterization of solid forms and single crystals growth. Also, in this section the
investigation methods for solid forms obtained from powders and single crystals are
presented: thermal methods (DSC, DTA-TGA), spectroscopic techniques (FT-IR, solid state
NMR) and diffraction methods (powder and X-ray single crystal diffraction). In Chapter 3 are
presented the results obtained for the Ambazone based compounds obtained in this study.
Strating from Ambazone monohydrate, we obtained the anhydrous form of Ambazone by
using different preparation methods. Also, for both monohydrate and anhydrous Ambazone,
we were able to obtain single crystals by Liquid Diffusion (LDif) preparation method, and
therefore, a complete characterisation of their crystal structure was possible by single X-ray
diffraction. Furthermore, there were established the conditions of conversion between the two
monohydrate and anhydrous forms of Ambazone.
Another approach was to apply different preparation methods to obtain new forms
from Ambazone mixed with acetic acid. We were able to achieve three different forms by
Solvent Drop Grinding (SDG), Slurry (SL) and Vapor Digestion (VDig), and single crystals
by Vapor Diffusion (VDif) method. All these compounds were characterized by the
techniques mentioned in Chapter 2. The solvent drop grinding merthod was further used in
Page 6
2
combination with different compounds (hydrochloric acid, glutamic acid, aspartic acid, p-
Aminobenzoic acid, nicotinic acid and lactic acid) and new Ambazone forms were obtained.
The structural investigation revealed that all the obtained compounds are salts.This
issue is of great importance for the farmaceutical industry, taking into account that salts have
higher solubility, higher dissolution rate and show an increase of bioavailability, compared
with the pure Ambazone. Hence, investigation of solubility, dissolution rate, stability and
bioavailability of all these salts can follow the present work, to evaluate the obtained
compounds as potential application in the pharmaceutical industry.
Page 7
3
CHAPTER 1
1 Introduction and motivation
1.1 Ambazone: Historic. Properties.
The biologically active compound chosen for this study is an antimicrobial substance
named ambazone. This is the active compound of Faringosept or drug, having the aspect of a
dark-brown microcrystalline powder; it is odorless and tasteless powder, used for local
treatment of bucofaringian cavity and antineoplastic cure, also. The latest studies on
ambazone had revealed the fact that it has an antibacterial spectrum similar to that of
sulphonamides [Löber et al 1989] [Löber et al 2007]. Investigations regarding ambazone in
1990 have described some antineoplastic properties and have shown that does not provide
mutagenic efects, unpleasant reactions as other oncostatic drugs drugs [Kuhnel et al 1988a,
Kuhnel et al 1988b, Baumgart et al 1988, Amlacher et al 1990, Gutsche et al 1990]. Although
descovered in 1950's by Domagk, it is less characterized from the point of view of its
structural properties and formation of new solid forms possibility.The requirement of
obtaining and characterizing of solid forms derives from the improvement they can bring to
the properties of drugs' active compound regarding the solubility, biodisponibility and
dissolving speed. For ambazone there were not reported new solid forms and its crystal and
molecular structure was determined only from powder diffraction data and reported in the
international conference Nanospec 2008 [Mocuta et al 2008]. The new solid forms of
ambazone, which is very slightly soluble in water, can help to increase its solubility and thus
to improve the quality of the pharmaceutical compound. The main purpose of this study was
to obtain new solid forms of ambazone, to characterize their structure by various techniques,
and single crystal molecular structure establishment of ambazone's and the new crystalline
forms.
1.2 Background information: Polymorphism. Salts. Cocrystals.
In scientific terms “polymorphism” means the ability of a material – with the same
chemical composition – to exist in different forms of crystalline structure, having different
physical and chemical features, being a la rge interest phenomenon in pharmaceutical industry
Page 8
4
[Bernstein 2002]. Worldwide, the researches of polymorphism and new solid forms are based
on synthetisation and physicochemical and structural characterization, in order to improve
drugs qualities and to reduce the side effects. Finding as much forms as poss ible has a major
impact in the scientific field because different crystalline forms can generate a wide range of
physical and chemical different properties which can affect the use of these materials. Solid
forms include: polymorph (the same compound with different cristalline structure), solutes (in
the compound's cristalline structure is included the solvent), hydrates (in the compound's
cristalline structure are included molecules of water), salts or cocrystals which include in the
cristalline structure two different compounds. The variety of solid forms which can be
obtained for a compound is represented in Figure 1.1. It is possible to obtain salt when the
difference between pKa for the starting compound and pKa of the compound that it combines
with, is two units bigger. In this case a proton it is transferred from acid to base. Co-crystals
or „multi-component molecular crystals” [Bond 2007] are molecular structure which don't
imply the establishment of some covalent bonds or proton transfer from the active compound.
Nevertheless, the physicochemical and pharmacological properties of cocrystals are
different from those of the starting compound. Co-crystals have generally hydrogen bonds.
For a long time, cocrystals were considered to be multicomponent crystals containing
molecular units different from chemical point of view in asymmetrical unit [Etter et al 1993].
Figure 1.1. Schematic representation of the structural relationship between
polymorphic (solvent, co-crystals, salts) and amorphous phases.
Page 9
5
CHAPTER 2
2 Solid forms. Methods of preparation and investigations
The most used methods to obtain new solid forms are: recrystallization from solution
(RC), "solvent drop" grinding (SDG), exposure to solvent vapor or vapor digestion (VDig)
and slurrying (SL) [Brittain 2009a].
Crystallization (RC): This is the most common methodology applied to derive new
forms and for crystal growth. It is prepared a saturated solution of the compound with a
solvent and allows evaporating the solvent.
Solvent drop grinding method (SDG): Solid samples were mixed manually in a mortar
of agate while the solvent was added until it was obtained a dry composition.
Slurrying procedure (SL): The solid material is suspended, usually for an extended
period, in a quantity of solvent that is insufficient to dissolve it completely. Slurrying
experiments are usually carried out over periods of 2–4 weeks, or even longer.
Vapor digestion (VDig): Exposing the physical mixture of reactants to vapours of a
solvent or mixtures of solvents for different periods of time.
In order to obtain single crystals of a substance, different methods were used such as:
crystallization by slow evaporation of the liquid or solvent mixtures (RC), solid substance
exposure at different humidity and temperature regimes, vapor diffusion (VDif ), liquid
diffusion or crystallization multilayer (LDif) [Stout et al 1989, Brittain 2009].
Vapor diffusion (VDif): Two vials are needeed where one can fit inside the other: in
the inner vial, the compound to be cristalized is dissolved in a small quantity of a moderately
non volatile solvent; in the second vial a volatile solvent in which the compound is insoluble
is added. The two solvents must be miscible.
Liquid-liquid difussion (Ldif): On this technique involves the use of two (or tree)
solvents, one in which the material is soluble and a second in wich is insoluble. The first
solvent is more volatile than the second.
Page 10
6
CHAPTER 3
3 Experimental results
3.1 Ambazone monohydrate and anhydrous
Ambazone monohydrate C8H11N7S·H2O ([4-(2-(Diaminomethylidene)hydrazinyl)
phenyl] iminothiourea) (AMB) is a compound with a relatively low solubility, has a
molecular weight of 255.3 g/mol and melting point around at 192 C and 194 °C,
accompanied by decomposition [Fichtner et Arnold 1983, Kuhnel et al 1988a]. Structural
formula is shown in Figure 3.1.1.
Figure 3.1.1. Structural formula of Ambazone
Ambazone anhydrous (AMBanh) was obtained by exposure of the ambazone
monohydrate to heat treatment for 30 minutes at 140 C, followed by slow cooling to 25 °C.
Applying the methods described in Chapter 2 various samples were prepared which were
subsequently investigated by analytical methods suitable for the study of solids, namely:
thermal analysis (DTA-TGA), Powder X-ray Diffraction (PXRD) and X-ray Single-crystal
diffraction, Fourier transformed infrared spectroscopy (FT-IR), Nuclear magnetic resonance
(NMR) spectroscopy and Scanning electron microscopy (SEM). Table 3.1.1 provides
information on sample preparation by different methods:
Table 3.1.1. Sample preparation
Precursors Metods
AMBanh : Acetone Recristalization (RC) 2 days, 25 ºC
AMB : H2O Solvent drop grinding (SDG) by manual grinding in
agate mortar; 5 minute
AMB : AMBanh : Dichloromethane (10 mg : 70 mg : 2 ml)
AMB : AMBanh : Dichl : H2O (10 mg : 70 mg : 2 ml : 0.04 ml)
AMBanh : Dichloromethane : H2O (90 mg : 2 ml : 0.04 ml)
Slurrying (SL) 5 days
Page 11
7
3.1.1 DTA-TGA analysis
Thermal measuremments for AMB and AMBanh were carried out starting from room
temperature up to 400 C with a 10 oC/min heating rate. DTA-TG analyses for AMB (Figure
3.1.2.a) showed two well-defined thermal events: an endotherm signal at 135 C associated
with a TGA weight loss of 6.5%, most likely corresponding to the water loss; an exotherm
event at 215 C associated with a TGA weight loss of 30.7% related to the thermal
decomposition process. Due to the strong decomposition event, the melting of AMB is not
clearly defined. In the case of AMBanh, only the exotherm decomposition is visible in the
DTA trace and there is no visible endotherm related to water loss.
100 200 300 400Temp [C]
60
70
80
90
100
%TGA
0
10
20
30
40
50
uVDTA
207.72x100C317.46x100C
190.55x100C
-6.496x100%
-17.926x100%
-3.685x100%
-3.560x100%
-9.119x100%
215
133
190
208 318
-6.5%
-9%
-18%
-3.7%
-3.5%
AMB
TG
DTA
a
100 200 300 400Temp [C]
60
80
100
%TGA
0
10
20
uVDTA
189.32x100C
198.77x100C
4.175x100% -20.061x100%
-13.136x100%
4.2% -20%
-13%
189
199
TG
DTA
AMBanh
b
Figure 3.1.2. DTA-TGA thermograms for: AMB (a) and AMBanh (b).
3.1.2 Powder X-Ray Diffraction (PXRD)
PXRD analyses show that applying certain crystallization methods and certain
solvents the ambazone monohydrate turn into the anhydrous form and vice versa. By
crystallization of anhydrous ambazone with acetone is obtained an identical powder pattern of
ambazone monohydrate and recristalized with chloroform resulting anhydrous form (Figure
3.1.3.a). By applying the slurry method it was prepared a saturated solution of ambazone
monohydrate and anhydrous with diclormethan and another similar one also with
diclormethan but also with water (AMB : AMBanh : Dichl), (AMB : AMBanh : Dichl : H2O),
and were left in the slurry for 5 days (Figure 3.1.3.b). The X-ray powder diffraction analyze
found that AMB + AMBanh + Dichl_SL is similar to AMBanh, but is different from sample
prepared with water (AMB+AMBanh+Dichl+H2O_SL), which is identical to ambazone
monohydrate.
Page 12
8
a
b
Figure 3.1.3. PXRD of forms obtained by crystallization from chloroform and acetone (RC) (a) and Slurry for 5 day (SL) (b) compared with AMB and AMBanh.
The structural changes that
occur after recristalization by
different methods are shown in
Figure 3.1.3.c. It is noted that
according to the method of
crystallization AMBanh becomes
AMB and vice versa.
c
Figure 3.1.3. Transformation diagram due to the applied
processes to the samples (c).
3.1.3 Variabile Temperature Powder X-Ray Diffraction (VTPXRD)
Variable temperature PXRD was applied to ambazone monohydrate in order to follow
any changes in the solid form by heating.
An amount of AMB was heated to
different temperatures in the temperature
range of 90-210°C and PXRD was
carried out at the respective temperatures
(Figure 3.1.4.).
In the temperature range 25-90oC the
PXRD patterns of AMB are similar and
therefore there are no solid form changes
taking place.
Figure 3.1.4. PXRD patterns obtained for form
F1 heated in the temperature interval 90-210 C.
Page 13
9
At 100 C, the anhydrous form of ambazone appears and maintains their crystallinity
up to 198oC. From 210oC the material is completely amorphous. We can conclude that
ambazone monohidrate is thermally stable in solid state up to 198 C, afterwords the structure
collapses into amorphous phase.
3.1.4 Fourier Transformed Infrared Spectroscopy (FTIR)
FTIR spectra were recorded for ambazone monohydrate (AMB) and anhydrous form
(AMBanh) and are presented in Figure 3.1.5. a,b. The FTIR analysis showed changes in the
characteristic absorption bands of the primary and secondary amines. The two spectra are
different due to changes in crystal structure by dehydration of ambazone.
a b
Figure 3.1.5. FTIR spectra obtained for ambazone monohydrate and anhydrous, in the range of 4000-2500 cm-1 (a) and 1800-1000 cm-1 (b).
For AMB were identified the stretching vibration of primary amines around 3398 and
3232 cm-1, respectively at 3397, 3415 and 3214 cm-1 for AMBanh (Figure 3.1.5.a). The
stretching vibrations of secondary amine have been identified at 3145 cm-1 for AMB,
respectively 3129 cm-1 for AMBanh [Socrates 2001]. For AMB, the medium intensity bands
at 1636 and 1613 cm-1 (Figure 3.1.5.b) are attributable to C = N deformation vibration
[Stilinovic et al 2008], this vibration is identified around 1649 cm-1 in the AMBanh spectra.
The vibration from 1592, 1586 cm-1 for AMB respectively AMBanh is assigned to
deformation of primary amine NH2 [Socrates 2001]. The deformation vibration of secondary
amine at 1509 cm-1 corresponding to ambazone monohydrate is shifted to 1520 cm-1 in the
spectrum of anhydrous form (AMBanh).
Page 14
10
3.1.5 Solid state CP/MAS NMR analysis
From 13C CP/MAS NMR spectrum (Figure 3.1.6.), there were identified eight
resonance lines corresponding to the eight carbon molecules found in the ambazone structure:
(i) the resonance lines in the region 110-140 ppm are corresponding to non-equivalent
protonation of carbons from the aromatic rings C3, C4, C6, C7, (ii) the two lines at ~ 146 ppm
are attributed to non-protonation of the carbons from C2, C5, and (iii) resonance lines at 162
ppm and 175 ppm are assigned to C8 carbon and C1carbon respectively.
Figure 3.1.6. 13C CP / MAS NMR spectrum of AMB (υR = 15 kHz, CP = 2 ms).
3.1.6 Scanning Electron Microscopy (SEM)
SEM images (Figure 3.1.7. a, b)
present different morphology
obtained for Ambazone
monohydrate and anhydrous for.
a b
Figure 3.1.7. SEM images for AMB (a) and AMBanh (b).
3.1.7 Crystal and molecular structure determination from X-ray Single-crystal
diffraction
Single crystals of ambazone monohydrate and ambazone anhydrous were obtained by
applying multi- layer crystallization method. There were used three layers of liquid,
superimposed over one another and allowed to difuse.
AMB: From Ambazone monohydrate and acetone was obtained a saturated solution.
This solution was placed in a tube and added pentane (2 ml) and ether (2 ml).
Page 15
11
AMBanh: A saturated solution was obtained from Ambazone monohydrate with p-
Aminobenzoic acid and nitromethane.
This solution was placed in a tube and
tetrahydrofuran (2 ml) and hexane (2
ml) was added. The closed system was
left to react for 5 days at room
temperature. There were obtained
plate- like crystals with suitable ~0.08 -
0.3 mm dimensions for single-crystal
analysis (Figure 3.1.8. a, b).
a. b.
Figure 3.1.8. Single crystals for AMB (a) and
AMBanh (b).
Single-crystal analysis led to the determination of the crystallographic system, cell
parameters and the space group. Also, crystal structure determination revealed the molecular
conformation, the hydrogen bonds and the molecular packing of the ambazone monohydrate
molecules (Figure 3.1.9, 3.1.10.). There are four asymmetric units cell in the unit cell and one
asymmetric unit contains one ambazone monohydrate molecule. The following hydrogen
bonds are presented in the ambazone monohydrate structure: S1-N1: S1-N12: N14-O15
(water): O15-S1: N2-O15 (water). Water molecule link the two ambazone molecules by
hydrogen bonds.
Crystallographic data for ambazone monohydrate
Molecular formula Molar mass Masa molară Sistemul cristalografic
Crystal system Space group
Cell parameters Cell volume
Z (No. molecules per unit cell Calculated density
R factor Goodness-of-fit on F2
C8 H11 N7 S H2O 255.30 g/mol
monoclinic P21/c
a = 7.2008(10) Å, b = 7.2753(9) Å, c = 22.363(2) Å
= 90.00°, = 90.00°, = 90.00°.
1171.55(20) Å3 4 (1 AMB molecule in the asymmetric unit) 1.368 g/cm3
0.08 1.272.
Although all angles are 90 degrees, is a monoclinic crystallographic system.
Page 16
12
Figure 3.1.9. Molecular conformation of ambazone
monohidrate
Figure 3.1.10. Molecular packing and H-bonding for
ambazone monohidrate.
Single-crystal of Ambazone anhydrous analysis led also to the determination of the
crystallographic system, cell parameters and the space group. Crystal structure determination
revealed the molecular conformation, the hydrogen bonds and the molecular packing of the
ambazone anhydrous molecules (Figure 3.1.11, 3.1.12.). There are two asymmetric units in
the unit cell and two ambazone anhydrous molecules in the asymmetric unit. The following
hydrogen bonds are present in the ambazone monohydrate structure: S1-N11, S1-N12, N6-
N15). Ambazone molecules link together by hydrogen bonds.
Crystallographic data for ambazone anhydrous
Molecular formula Molar mass Masa molară Sistemul cristalografic
Crystal system Space group Cell parameters
Cell volume
Z (No. molecules per unit cell Calculated density R factor
Goodness-of-fit on F2
C8 H11 N7 S 237.30 g/mol
monoclinic P 1 21 1 (no. 4) a = 7.847(10) Å, b = 17.856(2) Å, c = 8.365(2) Å
α = 90.00 °, = 109.45(2) °, γ= 90.00 ° 1105.2(3) Å3
4, (1 AMBanh molecules in the asymmetric unit). 1.426 g/cm3
0.0995 1.141
Page 17
13
Figure 3.1.11. Molecular conformation of ambazone anhydrous.
Figure 3.1.12. Molecular packing and H-bonding for ambazone anhydrous.
3.2 Ambazone with acetic acid
Ambazone monohydrate has pKa(B) values of: 6.27; 7.37; 10.67 [Kuhnel et al 1988],
[Löber et al 1990, Petersen et al 1955] and acetic acid (C2H4O2) has a pKa(A) value of about
4.76, reason for trying to obtain the salt of acetic acid with Ambazone. The samples were
obtained by three methods: SDG, SL and VDig. All the resulting solids were characterized by
PXRD (3.2.1) in order to identify the different solid forms. For each solid form additional
analytical methods were applied for their further characterization (Sections 3.2.2 - 3.2.4).
3.2.1 Powder X-Ray Diffraction (PXRD)
The PXRD analysis led to the following results:
1. The PXRD patterns of the samples prepared by SDG method, using a 1:1 molar
ratio between ambazone and acetic acid, were different from each other and from the PXRD
pattern of the starting ambazone. These two different forms of ambazone with acetic acid
were denoted with F1 (with molar ratio 1:1), respectively F2 (with molar ratio 2:1) (Figure
3.2.1).
2. The two samples obtained by the SL method, prepare in acetic acid alone or in
mixture with dichloromethane had identical PXRD patterns with F2.
3. Four samples were prepared by VDig method by exposing ambazone monohydrate
powder to acetic acid vapors for different period of times. The PXRD analysis showed that
the sample exposed to vapors for 32 h is a new solid form, denoted F3. The samples exposed
to acetic acid vapors for 14 and 30 days had identical PXRD patterns with F2. The sample
Page 18
14
obtained after 5 days exposure showed a mixture of the forms F2 and F3 (Figure 3.2.2.). One
can conclude that after 32 h vapor exposure, the first new F3 form develops, followed by its
partial transformation to F2 after 5 days and its complete transformation to F2 after 14 days.
Form F2 remains stable even after vapor exposure of 30 days.
Figure 3.2.1. PXRD patterns for the
solid forms of ambazone with acetic acid compared with the PXRD pattern of
ambazone monohydrate.
Figure 3.2.2. PXRD patterns
obtained for AMBACE_VDig-5Day and F2, F3 samples.
The PXRD patterns of the forms F2 and F3 were indexed and the results are as
follows:
- form F2 crystallizes in the monoclinic C2 space group with the following cell
parameters: a =16.548 Å, b =7.1592 Å, c =16.5713 Å, β = 96.521o, = = 90 .
- Form F3 crystallizes in the monoclinic C2/c space group with the following cell
parameters: a=19.0198Å, b=9.2478Å c=17.8843Å, β =92.535o, = = 90 .
3.2.2 DTA-TGA analysis
The thermograms obtained for the solid forms F1, F2 and F3 are shown in Figure
3.2.3.b-d. The thermogram of ambazone monohydrate is included for comparison (Figure
3.2.3. a). Thermogravimetric analysis of form F1 (Figure 3.2.3.b.) shows that it is thermally
stable up to 60 C given the fact that no weight loss is detected in the TGA trace. In the
temperature interval 60–158°C the DTA curve shows an endothermic event with a maximum
at 115°C, while the TGA trace shows a weight loss of 15%. This event is most likely related
to dehydration and the loss of acetic acid taking place together with the melting of the form. A
second excotermic event was observed in the temperature interval 158 – 205°C, with a
maximum located at about 172oC, which is associated with a weight loss of 10% in the TGA.
Page 19
15
This event is likely related to sample thermal decomposition, given the fact that additional
weight losses of 7.5% and 11% are observed in the temperature interval of 205–400oC.
DTA-TGA analysis of form F2 (Figure 3.2.3.c.) shows three, well-defined thermal
events. The first event is endothermic, located at about 65 C and has an associated TGA
weight loss of 2% related to the loss of water. The second event, also endothermic, located at
130ºC is associated with a TGA weight loss of 25% and is most likely related to the loss of
acetic acid and melting of the form. One should remark that in form F1 these two events are
overlapping. Further, a third exothermic event is observed and is associated with thermal
decomposition of the form.
100 200 300 400Temp [C]
60
70
80
90
100
%TGA
0
10
20
30
40
50
uVDTA
207.72x100C317.46x100C
190.55x100C
-6.496x100%
-17.926x100%
-3.685x100%
-3.560x100%
-9.119x100%
215
133
190
208 318
-6.5%
-9%
-18%
-3.7%
-3.5%
AMB
TG
DTA
a.
100 200 300 400Temp [C]
60
80
100
%TGA
-20
-10
0
10
20
30
uVDTA
115.47x100C
172.10x100C
214.26x100C
316.98x100C
345.74x100C
-14.864x100%
-10.465x100%
-7.464x100%
-10.931x100%
115
172
-15%
-10%
-7.5%
-11%
TG
DTA
F1
214
317 346
b.
100 200 300 400Temp [C]
40
60
80
100
120
%TGA
-10
0
10
uVDTA
129.92x100C
175.51x100C
280.18x100C
-2.081x100%
-25.199x100%
-13.862x100%
-7.662x100%
175
130
-2%
-25%
-14%
-7.7%
65
280
TG
DTA
F2
c.
100 200 300 400Temp [C]
50
60
70
80
90
100
%TGA
0
5
10
15
uVDTA
-35.243x100%
156
174
205
TG
DTA
F3
d.
Figure 3.2.3. DTA-TGA thermograms of: AMB (a), F1(b), F2 (c) and F3 (d) forms
Thermal analysis of form F3 (Figure 3.2.3.d.) shows two major events. A first
endothermic event present at 156 C corresponds to the loss of acetic acid (indicated by the
TGA weight loss) and melting of the form. The second exothermic event and the
corresponding weight loss are related to the thermal decomposition process, as in the case of
forms F1 and F2.
Page 20
16
3.2.3 Variabile temperature powder X-ray diffraction
Variable temperature PXRD was applied to form F1 in order to follow any changes in
the solid form by heating. A sample of form F1 was heated to different temperatures in the
temperature interval 25-110ºC and PXRD was carried out at the respective temperatures
(Figure 3.2.4.).
In the temperature interval 25-82ºC
the PXRD patterns are similar and
therefore there are no solid form
changes. At 100oC, the amorphous
form appears together with F1, while
at 110oC, the material is completely
amorphous. We can conclude that
form F1 is relatively thermally stable
in solid state up to 100oC, after
which the structure collapses into
amorphous phase.
Figure 3.2.4. PXRD patterns obtained for F1 form
heated in the 25-110 C interval temperature.
3.2.4 Fourier Transformed Infrared Spectroscopy
FTIR spectra were recorded for ambazone monohydrate AMB and new solid forms
F1, F2 and F3 ( Figura 3.2.5. a,b). The FTIR analysis showed changes in the characteristic
absorption bands of the primary and secondary amines. These changes can be explained by
the protonation of the ambazone amino groups (Table 3.2.1.).
a b
Figure 3.2.5. FTIR spectra of spectral range 4000-2400 cm-1 (a) respectively 1850-1300 cm-1
(b) for AMB, F1, F2 and F3.
Page 21
17
Table 3.2.1. FTIR analysis for AMB, F1, F2 and F3 forms.
AMB 3400, 3230 cm−1
NH2
3145cm-1 NH
1592, 1509 cm-1
1636 cm-1
C=N
C-C
1447, 1417 cm−1
F1 3427,3263 cm-1
NH3+
3155 NH2+
1512, 1600 cm-1
1696 cm-1
C=N
C-C
1429, 1408 cm−1
F2 3412, 3297
NH3+
3200 NH2+
1510, 1600 cm-1
New vibration at 3000 cm-1
1678 cm-1
C=N
C-C
1480, 1427 cm−1
F3 3420, 3300
NH3+
3163 NH2+
1514, 1590 cm-1,
New vibration at 3230 and 2970 cm-1
1672 cm-1
C=N
C-C
1476, 1396 cm−1
3.2.5 Crystal and molecular structure determination from X-ray Single-crystal
diffraction
Single crystals of ambazone with acetic acid were obtained by applying the vapor
diffusion method. A saturated solution of ambazone with acetic acid and dichloromethane
was exposed to diethyl ether vapors for 5 days. This resulted in plate- like crystals (Figure
3.2.6.) with 0.08 - 0.3 mm, suitable dimensions for single-crystal analysis.
Single-crystal analysis led to the
determination of the crystallographic
system, cell parameters and the space
group. Also, crystal structure
determination revealed the molecular
conformation, the hydrogen bonds and
the molecular packing of the ambazone
acetate molecules (Figure 3.2.7., 3.2.8.).
Figure 3.2.6. Single crystal of ambazone acetate.
Crystallographic data for ambazone acetate
Molecular formula Molar mass Masa molară Sistemul cristalografic Crystal system
Space group
Cell parameters Cell volume
Z (No. molecules per unit cell Calculated density
C12 H18 N7 O4 S 356.39 g/mol monoclinic
C 2/c (no. 15) a = 19.1681(16) Å, b = 9.3693(17) Å, c = 17.976(3) Å
α = 90.00 °, = 94.00(1) °, γ= 90.00 ° 3220.48(80) Å3
8 (1 molecule of ambazone and 2 acetic acid molecules in the asymmetric unit). 1.470 g/cm3
Page 22
18
R factor Goodness-of-fit on F2
0.0877 1.272
There are eight asymmetric units in the unit cell and one asymmetric unit contains one
ambazone and two acetate molecules. The following hydrogen bonds a re present in the
ambazone acetate structure: N6-O1, N5-O2, N5-O3, N4-S1, N1-O2, O4-O1.
Figure 3.2.7. Molecular conformation and H-bonding of ambazone acetate.
Figure 3.2.8. Molecular packing for ambazone acetate.
3.3 Ambazone with hydrocloric acid
By SDG method has been prepared a sample of AMB with HCl, in molar rate 1:1, for
4 hours, at room temperature. The Ambazone hydrochloride (AMBHCl _SDG) was prepared
by grinding of 255.3 mg AMB with 2 mL HCl aqueous solution (0.5 M) in an agate mortar at
room temperature, until a dried compound was obtain. It was observed the change of AMB
colour from reddish-brown to yellowish-brown.
3.3.1 DTA-TGA analysis
The DSC curves obtained for pure AMB and for the compound obtained by SDG
method (AMBHCl_SDG) are different (Figure 3.3.1). The curve for the pure AMB revealed a
broad endothermic signal from 105 to 143°C, with a maximum at 125°C and H = 36 kJ/mol,
that corresponds to the loss of the water molecule followed by sharp exothermic signal at
204°C, ΔH = 75 kJ/mol due to the melting with decomposition of AMB.
The DSC curve for AMBHCl_SDG shows three signals: a broad endothermic signal
with maximum at 77°C, ΔH = 38 kJ / mol, assigned to loss of water molecules, which appears
Page 23
19
in the DSC curve for AMB at about 125 C, the second broad endothermic signal located
between 121-160°C, with maximum at 144°C, and ΔH = 18 kJ / mol, most likely due to loss
of HCl and that is not found in the DSC curve for AMB.
50 100 150 200 250 300 350Temp [C]
60
70
80
90
100
%TGA
-0
10
20
30
40
50
uVDTA
-5.338x100%
-9.110x100%
-23.687x100%
190
127
AMBHCl_SDGAMBHCl_SDG
DTATGA
Figure 3.3.1. DSC analysis for AMB and AMBHCl_SDG.
Figure 3.3.2. DTA-TGA traces for AMBHCl_SDG.
The third signal is the exothermic one which has a maximum at 190 C with ΔH = 185
kJ/mol, corresponding to the melting with decomposition of the sample. For AMB, this
exothermic signal occurs at 204oC. From simultaneous DTA-TGA measurements made for
AMBHCl_SDG (Figure 3.3.2.) it appears that mass loss occurs due to elimination of water
and hydrochloric acid. These mass losses correspond to phenomena that have been identified
in DSC measurements.
3.3.2 Powder X-ray diffraction
From Powder X-ray Diffraction of AMB and AMBHCl_SDG (Figure 3.3.3.) on can
be observed a significant difference between the two powder diffraction patterns.
The PXRD patterns of the AMBHCl_SDG
were indexed [Boultif et al 2004] and the
results are: crystallizes in a monoclinic
system with the following lattice
parameters: a =7.006Å, b =13.017Å, c
=16.959 Å, =107.17° and unit cell
volume V =1477Å3. The most likely space
group is P21/c.
Figure 3.3.3. X-ray Powder Diffraction patterns for AMB and AMBHCl_SDG..
Page 24
20
3.3.3 Fourier Transformed Infrared Spectroscopy
In the FTIR spectra obtained for (AMBHCl_SDG) is observed a shift to higher values
compared to AMB spectrum. These is due to secondary protonated amines (signal at ~ 2980
cm-1) and respectively at the primary amine (~ 1686 cm-1). Salt formation is motivated by the
appearance of a band at ~ 3267 cm-1 (Figure 3.3.4.a.; Figure 3.3.4.a.) [Socrates 2001].
a b
Figure 3.3.4. FTIR for AMB and AMBHCl_SDG in the 4000-2500 cm-1 (a) and 1800–1300
cm-1 (b) spectral range.
3.3.4 Solid state 13C and 15N NMR analysis
The 13C CP/MAS spectra of the AMB and AMBHCl_SDG are shown in Figure
3.3.5.a. Both spectra consist of eight resonance lines, corresponding to the eight carbon sites
in the molecular structure of the studied compounds. The main feature of these 13C CP/MAS
spectra is the important shift of the resonance lines of AMBHCl_SDG compound compared
with the similar spectrum which correspond to pure AMB. Most probably this line shift can
be attributed to the aromatic ring current effect, [Gomes et Mallion 2001] and the presence of
Cl- were disrupts a possible p–p stacking in AMB. Since all the AMB and AMBHCl_SDG
resonance lines are not multiplied, we can draw the conclusion that there is only one molecule
per asymmetric unit of both.
The 15N CP/MAS spectrum (Figure 3.3.5.b) consists of seven resonance lines,
according to the molecular structure of AMBHCl_SDG. These lines are assigned as follows:
two NH2 groups with resonances at 44.3 and 45.8 ppm; a NH2+ group with the resonance line
at 105.6 ppm; two NH groups at 141 and 171.5 ppm, respectively, and two non-protonated
nitrogens linked to the aromatic ring, which exhibit resonances at 266 and 282.8 ppm. 13C and
15N NMR data which establishes that asymmetric unit contains one molecule.
Page 25
21
a
b
Figure 3.3.5. The 13C CP/MAS NMR spectra of AMB and AMBHCl_SDG, recorded at
spinning frequency mR = 10 kHz with a CP 1,5 ms (a). The asterisks indicate spinning sidebands. The 15N CP/MAS RMN for AMBHCl_SDG (b).
3.4. Ambazone with glutamic acid
L-Glutamic Acid (C5H9NO4) (Glu), is a non-essential amino acid and has applications
in cancer therapy [Otsuka et al 1994]. Ambazone (AMB), contains several amino groups and
hence their property to capture electrons and thus the formation of salts with various acids.
Glutamic acid has pKa = 2.01 for COOH value and pKa of ambazone: 6.27, 7.37, 10.67,
indicating the possibility of obtaining the combination of salts.
Solvent-drop grinding experiments were performed by placing 255.3 mg AMB with
147.13 mg Glu by addition of water in an agate mortar at room temperature, until a dried
compound was obtained. There was a change in color of mixing.
3.4.1. DSC, DTA-TGA analyses
DSC traces obtained for AMB and AMBGlu_SDG compounds (Figure 3.4.1.a)
evidenced water loss by the appearance of an endothermic signal at 125oC for AMB and 97oC
for the compound AMBGlu_SDG and ΔH = 19 kJ / mol.
The exothermic sharp signal at 204.5 C, ΔH = 75 kJ/mol for AMB is moved in the
case of the prepared compound by SDG at 187.8 C, ΔH = 106 kJ/mol, proof of
decomposition overlapped with melting.
DTA-TGA thermograms for AMB and AMBGlu_Glu (Figure 3.4.1.b) showed
diferences. Thermograms for AMBGlu_Glu showed tree well-defined thermal events: an
endotherm event at 107 C associated with a TGA weight loss of 5.84%, most likely
corresponding to the water loss; the seccond endotherm event at 192 C, associated with a
Page 26
22
TGA weight loss of 7,46%, Tonset = 189ºC corresponding to the glutamic acid loss and
begining of melting process of AMBGlu_SDG compound; an exotherm event at 204 C
associated with a TGA weight loss of 9% related to the thermal decomposition process.
a
50 100 150 200 250 300 350 400Temp [C]
50
60
70
80
90
100
%TGA
-0
10
20
30
40
50uV
DTA
-9.012x100%
-24.243x100%
-5.844x100%
-7.463x100%
340
289
204
192
107
AMBGLU_SDGAMBGLU_SDG
DTATGA
b
Figure 3.4.1. DSC traces for AMB and AMBGlu_SDG (a), DTA-TGA thermograms for
AMBGlu_SDG (b).
Therefore AMBGlu_SDG thermal behavior is totally different from AMB and indicate
the glutamate salt formation .
3.4.2. Powder X-Ray Diffraction
Powder diffraction pattern for
AMBGlu_SDG (Figure 3.4.2.) is
totally different from patterns of
AMB and Glu, therefore a new solid
form was obtained. By indexed
procedure it was established that
crystallize in monoclinic system
space group probabilly P21. Is have
the following lattice parameters: a=
9.8352 Å, b= 4.7014 Å, c= 40.0987
Å, β= 94.5050 , V= 1844 Å3.
Figure 3.4.2. PXRD for AMB, Glu and AMBGlu_SDG.
3.4.3. Fourier Transformed Infrared Spectroscopy
FTIR spectra obtained for AMB, Glu and AMBGlu_SDG are shown in Figure 3.4.3
a,b. For the new obtained compound AMBGlu_SDG the vibrations at ~3426 cm−1 are
Page 27
23
assigned to the primary amino group. The vibrations at ~3258 cm−1 correspond to the
protonated primary amino group NH3+. The band located at 3145 cm−1 in AMB is shifted to
~3158 cm−1 in the AMBGLU_SDG spectrum; it confirms the secondary amine protonation
[Ivanova et al 2010].
a b
Figure 3.4.3. FTIR spectra of AMB, AMBGlu_SDG and Glu in 4000-2500 cm-1 (a) and 1800-1000 cm-1 (b) spectral domain.
The band located at ~2930 cm−1 can be attributed to the NH2+ stretching vibration.The
broad band at 1698 cm−1 (medium intensity) can correspond to the NH2+ deformation
vibration in the solid form. The secondary amine presents a band of medium intensity at 1616
cm−1 deformation vibration of the protonated secondary amine NH2+. In the 1650–1475 cm−1
spectral range, the IR bands at 1601 and and 1527 cm−1 can be assigned to the NH3+, δas+
and
δas- bending vibrations [Ivanova et al 2010]. Based on the vibrational frequencie’s shifts and
the new recorded bands one can conclude that a new solid form of ambazone was formed, i.e.
an ambazone–glutamate salt.
3.4.4. 13C solid state NMR analysis.
The 13C CP/MAS spectra of the AMB, Glu, and AMBGlu_SDG are shown in the
Figure 3.4.4. The NMR spectra of AMB and Glu consist of eight, respectively five resonance
lines, corresponding to the carbon sites in the molecular structure of these two compounds.
The chemical shifts of the resonance lines are illustrated in Table 3.4.1. Regarding the Glu
molecule, a full assignment was possible taking as a reference the 13C liquid-state NMR
spectrum. Analyzing the resonance lines, one can conclude that (i) there are two
conformationally non-equivalent Glu molecules in the asymmetric unit of the AMBGlu_SDG
solid form and (ii) the line at 180.1 ppm (and 181.0 ppm, respectively) indicates the presence
of COO− site, which proves that AMBGlu_SDG belongs to the salts class. The presence of a
Page 28
24
small quantity of Glu which remains after the chemical reaction with AMB is indicated by
black arrows in Figure 3.4.4. [SDBS 2007].
Figure 3.4.4. 13C CP/MAS NMR spectra
of AMB (a), Glu (b), and AMBGlu_SDG (c).
Table 3.4.1. Chemical shift 13C CP/MAS NMR for AMB, Glu and AMBGlu_SDG.
δ
AMB
[ppm]
δ Glu
[p m]
δ AMBGlu_SDG
[ppm]
Protonated
at aromatic
ring
(C3, C4, C6,
C7)
112.9
120.5
129.5
140.9
-
-
-
-
-
-
-
-
120.1
123.1
129.7
133
Non-
protonated
at aromatic
ring
(C2, C5)
146.7
147.1
141.4
144.3
C8 162.1 155.2
C1 174.8 174.9
C1a
C2a
C3a
C4a
C5a
-
-
-
-
-
25.6
27.7
54.4
177.8
178.8
28.9; 29.2
33.4; 35.5
53.8; 55.5
177.5; 178.1
180.1; 181.0
3.5. Ambazone with p-Aminobenzoic acid
p-Aminobenzoic acid (PABA) or vitamin B10 it' s a organic compound with chemical
formula (NH2O2C7H7), poorly solubile in water, with molecular mass of 137.14 g/mol and
melting point 187oC, it is nontoxic, being used in treating cancer melanoma and in the
antitumor activity of ionizing radiation [Chakrapani et al 2008]. Because both ambazona and
p-Aminobenzoic acid have positive effects in antitumor treatments, it was tried to obtain a
new form by combining their solids. The modalities of obtaining new forms occurred starting
from the ambazone with para-aminobenzoic acid, in 1:1 stoechiometry, mixing in an agate
mortar with water (SDG method), at constant temperature, for 30 minute.
3.5.1. DSC, DTA-TGA analysis
DSC curve shows two signals for AMBPABA_SDG compound (Figure 3.5.1.): an
endothermic peack between 80 and 100°C, corresponding to loss of water molecules and a
broad exothermic peack between 165 and 195°C, probably due to ovwelapping melting with
decomposition. DTA-TGA thermograms obtained for AMBPABA_SDG compound (Figure
3.5.2.), indicates by presence of PABA, remove from lower temperature the water loss, than
the temperature recorded for pure compound AMB, an event highlighted by two mass losses
Page 29
25
of 5.6 and 4.2% respectively, the to two signals corresponding to broad endothermic peaks at
62°C and 92°C (Figure 3.5.2.). Melting and decomposition occurs between 140 and 185°C
with a mass loss of 7.8%, which corresponds to a broad exothermic peak temperature in the
range of 100-186°C, with maximum at 176°C. The final mass loss of 23.5% occurs in the
range 190-300°C corresponding to the elimination of volatile components which results by
decomposition of compound AMBPABA_SDG.
Figure 3.5.1. DSC curves of AMB,
PABA and AMBPABA_SDG
50 100 150 200 250 300 350Temp [C]
50
60
70
80
90
100
%TGA
-0
10
20
uVDTA
257
-5.618x100%
-4.194x100%
-7.819x100%
-5.751x100%
-17.783x100%
62 92
176
245 270
AMBPABA_SDGAMBPABA_SDG
DTATGA
Figure 3.5.2. DTA-TG thermograms for
AMBPABA_SDG.
3.5.2. Powder X-Ray Diffraction (PXRD)
The PXRD pattern for
AMBPABA_SDG is different from
AMB and PABA, which confirms the
obtained new solid form. By indexing
procedure the lattice parameters of the
unit cell were determined: a = 14.294Ǻ,
b = 9.162 Ǻ, c = 8.777Ǻ, α = 95.90º, β
= 100.63 º, γ = 91.73.15 º.
The compound AMBPABA_SDG
crystallizes in the triclinic system
(Figure 3.5.3.).
Figure 3.5.3. Powder X-ray Diffraction patterns of AMB, PABA and AMBPABA_SDG.
3.5.3. Fourier Transformed Infrared Spectroscopy
From the analysis of spectral absorption bands obtained for AMB and
AMBPABA_SDG (Figure 3.5.4.) there were evidenced stretching vibrations of primary
amino group NH2 which appear modified in the spectrum of the new compound obtained by
SDG method. FTIR measurements revealed modified NH stretching absorption bands of
Page 30
26
amines [Otsuka et al 2010], due to the protonation of the primary amine and secondary amine,
which demonstrates the formation of ambazone p-aminobenzoate salt (Table 3.5.1.).
Figure 3.5.4. FTIR spectra for AMB, PABA and AMBPABA_SDG în 4000-1450 cm-1 spectral
range.
Table 3.5.1. Frequencies vibration in IR for AMB and AMBPABA_SDG.
Spectral
domain cm-1
AMB
cm-1
AMBPABA_SD
G
cm-1
3400–3200
3398, 3232
NH2
3420, 3385,
3308 NH2
3241 NH3+
3200 - 2700
3147 NH 3156 υNH2+
1800–1500
1636, 1613
NH2 or C=N
1592 NH2
1684, 1560
NH3+ δas-, δas
_
1615 υNH2+
1600–1500 1509 NH 1513 NH
3.5.4. 13C solid state NMR Spectroscopic
The 13C CP/MAS spectra of the AMB, PABA, and AMBPABA_SDG are shown in
the Figure 3.5.5. The NMR spectra of AMB and PABA consist of eight, respectively six
resonance lines, corresponding to the carbon sites in the molecular structure of these two
compounds. From the comparison the 13C CP/MAS NMR spectra between AMB, PABA,
AMBPABA_SDG, and the following conclusions can be drawn:
(i) The 13C CP/MAS spectrum of the final compound (AMBPABA_SDG) is that it contains
one molecule per asymmetric unit;
(ii) The most significant difference which arises is a major AMB chemical shift displacement
and line broadening especially for the C1 and C8 resonances;
13C solid-state NMR measurements are in concordance with PXRD conclusions
regarding obtaining a new solid form.
Page 31
27
Figure 3.5.5. The 13C CP/MAS NMR spectra of AMB (a), PABA (b), and AMBPABA_SDG (c),
υR = 15 kHz with and CP = 2 ms.
3.6. Ambazone with aspartatic acid
Aspartic acid C4H7NO4 (ASP) is part of the amino acids class, is soluble in water and
acts as an excitatory neuro-transmitter, as a generator of cellular energy and to stimulate
increased production of immunoglobulins and antibodies. Aspartic acid has pKa values of:
1.88, 3.65, 9.60 and pKa value of ambazone is: 6.27, 7.37, 10.67, indicating the possibility of
obtaining of salts. By SDG method were prepared two samples in 1:1 molar ratio of ambazone
with aspartic acid at room temperature: one by grinding mixture of ethanol 5 minutes
(AMBASP_SDG 5min) and the second sample grinding mixture of ethanol for 1 hour
(AMBASP_SDG 1h).
3.6.1. DTA-TGA analyses
From the thermograms analysis obtained for the sample AMBASP_SDG (5 min)
(Figure 3.6.1.a), an endothermic signal with maximum at 47oC appears which corresponds to
3.93 mass loss, associated with water removal. In the range 180-220oC exothermic signal
is observed with maximum at 211oC with a mass loss of 30.23 phenomenons associated to
to sample decomposition accompanied melting.
The DTA-TGA analysis obtained for sample AMBASP_SDG 1h (Figure 3.6.1.b),
reveals an endothermic signal with maximum at 48oC which corresponds to 4.57 mass
losses associated with removal of none bonded water. In the range 180-220oC, exothermic
Page 32
28
signal is observed with maximum at 212oC and a mass loss of 30.6 , phenomenon associated
with the sample decomposition accompanied melting.
100.00 200.00
Temp [C]
50
60
70
80
90
100
%
TGA
-0
10
20
uV
DTA
-3.927x100%
-30.231x100%
47
211
TG
DTA
AMBASP_SDG 5min AMBASP_SDG 5min
DTATGA
a
100 200
Temp [C]
60
70
80
90
100
%
TGA
-0
5
10
15
uV
DTA
-4.575x100%
-30.626x100%
48
212
TG
DTA
AMBASP1hAMBASP1h
DTATGA
b
Figure 3.6.1. DTA-TGA of: AMBASP_SDG 5 min (a) and AMBASP_SDG 1 h (b).
3.6.2. Powder X-Ray Difraction
Differences between PXRD patterns of AMB, ASP, AMBASP_SDG (5 min) and
AMBASP_SDG 1h (Figure 3.6.2.) highlights two different solid forms for ambazone with
aspartic acid. The two solid forms show that does not contain lines from ambazone or aspartic
acid, thus proving relatively pure compounds obtained.
After indexing powder patterns
for compound AMBASP_SDG 1 hour
there were determined lattice
parameters:
a = 21.37 Ǻ, b = 6.09 Ǻ, c= 8.55 Ǻ,
α = 90°, β = 96.65°, γ = 90°.
These compound crystallize in
monoclinic system.
Figure 3.6.2. PXRD patterns for AMBASP_SDG
5min and AMBASP_SDG 1h.
3.6.3. Powder X-ray difraction with variabile temperature
In order to verify of results obtained by thermal analysis by X-ray diffraction with
variabile temperature in the 25-240oC range were performed (Figure 3.6.3.).
Page 33
29
The powder patterns made on samples
obtained by SDG 1 hour with variabile
temperature VTPXRD, shows the
stability of AMBASP_SDG 1h to 198 oC
temperature.Between 198 and 240°C
occurs the transition from amorphous
phase to a christaline phase. This result is
in concordance with the DTA-TGA
measurements, which are exothermic
event at 212 oC, event attributed to
decomposition overlapped with melting
compound.
Figure 3.6.3 VTPXRD by AMBASP_SDG 1h,
heated in the 25-240oC temperature range.
3.6.4. Fourier Transformed Infrared Spectroscopy
The analysis of spectra obtained for compounds AMB, ASP şi AMBASP_SDG 5min,
AMBASP_SDG 1h respectively (Figure 3.6.4.a,b) evidenced that the vibrations
corresponding to amino-functional groups change in the case of compounds obtained by SDG
for 5 minutes and one hour.
a b
Figure 3.6.4. FTIR spectra of AMB, ASP and AMBASP_SDG 5min, AMBASP_SDG 1h in 4000-2400 cm-1 (a), respectivelly 2000-1000 cm-1 (b) spectral range.
The primary amine vibration around 3398 cm-1 in the spectrum of AMB is shifted to
higher value at 3472 cm-1 in the spectra recorded for the compounds obtained by SDG
method (AMBASP_SDG 5 min, AMBASP_SDG 1h respectively). Vibrations located around
3357 cm-1 for AMBASP_SDG 5 min and 3355 cm-1 for AMBASP_SDG 1h respectively,
corresponds to protonated primary amines group NH3+ [Socrates 2001] .
Page 34
30
The vibration located at ~3147 cm-1 in AMB spectrum is shifted in the spectrum of the
compounds obtained by SDG 5 min and 1hour at 3196 and 3201 cm-1, which confirms the
protonation of secondary amino-group for both compounds [Ivanova et al 2010]. New bands
at ~3076, 3059 cm-1 respectivelly can be attributed to the stretching vibration of the
protonated secondary amine (NH2+) [Socrates 2001]. A broad bands of medium intensity at
1689 and 1651 cm-1 of AMBASP_SDG 5min respectively AMBASP_SDG 1h can be
assigned to deformation vibrations of the protonated secondary amine NH2+. The medium
intensity bands at 1621 respectively 1618 cm-1 identified for the sample AMBASP_SDG
5min and AMBASP_SDG 1h correspond to deformation vibration of protonated primary
amine NH3+. These two new solid forms obtained with Ambazone aspartic acid, is justified by
protonation of the secondary amines and shifts that occur in the spectra of the new
compounds.
3.6.5. 13C solid state NMR analysis
The solid state spectra 13C NMR (Figure 3.6.5.) obtained for Ambazone and aspartic
acid consist of eight and respectively six resonance lines. 13C NMR spectra of
AMBASP_SDG 5min and AMBASP_SDG 1h, have different resonance lines number
compared with the 13C NMR spectra of ambazone.
The solid state 13CNMR spectrum of AMBASP_SDG 5min sample shows the
apearece of a non-equivalence of aspartic acid in the network and we can conclude that most
probably in the asymmetric unit exist two molecules of aspartic acid for one molecule of
ambazone. On the other hand, the 3CNMR spectrum of the solid state AMBASP_SDG 1 h
shows that in this case exist one aspartic acid molecule for each Ambazone molecule into the
asymmetric unit. Chemical shifts of resonance lines for AMB, ASP and two other samples
prepared by SDG method are presented in Table 3.6.1.
Page 35
31
Table 3.6.1. Chemical shifts 13C CP/MAS NMR
for AMB, ASP, AMBASP_SDG (5min, 1hour).
Figure 3.6.5. 13C CP/MAS NMR spectra of AMB, ASP, (AMBASP_SDG 5min) and
(AMBASP_SDG 1h)
δ
AMB
[ppm]
δ
AMBASP
_SDG
5min
[ppm]
δ
AMBASP
_SDG 1h
[ppm]
δ
ASP
[ppm]
Protonarea
la
inelu l
aromat ic
(C3, C4,
C6, C7)
116.7
124.1
133.2
144.6
124.63
125.8
135.7x2
124.63x2
135.7x2
Non-
protonarea
la
inelul
aromat ic
(C2, C5)
150.6
-
144.13
147.9
143.97
148.93
C1,C8 165.8
178.7
161
180.2
161.2
180.8
C9,C11
175.9
177.7
182.15
177.52
182.48
C9
38.5
39.34
40.33
38.5
39.5
C10 56.4 56.5
57.5
C1a
C2a
C3a
C4a
C5a
25.6
27.7
54.4
177.8
178.8
3.7. Ambazone with nicotinic acid
Nicotinic acid (NA), with chemical formula C6H5NO2 or vitamin B3, is one of the
essential human nutrients, water-soluble solid is a derivative of pyridine, is used as vase-
dilating medicines and in the treatment of diseases of the gastro-enteric tract [Makareyer et al
1997]. NA it present pKa of the aromatic ring N is 4.9 carboxyl group (-COOH) and pKa of
the COOH group is 2.1 [Tim et al 1999]. Ambazone undergoes three protonation reactions
with pK values at 10.69, 7.39 and 6.22 [Günter et Hoffmann 1990] and based on the fact that
differences in pKa values for ambazone and nicotinic acid are large enough to allow the
formation of salts, was prepared ambazona with nicotinic acid (NA) using SDG method. The
Ambazone nicotinate (AMBNA_SDG) was prepared by grinding a mixture of 255.3 mg
AMB and 123.11 mg NA with 1 ml twice distilled water added in drops in an agate mortar, at
Page 36
32
room temperature, until a dried compound was obtained. The obtained solid form was
characterized by thermal analysis DSC; DTA-TGA, X-ray powder diffraction and FTIR
spectroscopy.
3.7.1. DSC, DTA-TGA analyses
Thermal analysis of AMB, NA and AMBNA_SDG are presented în Figure 3.7.1.a.
The thermal behavior of nicotinic acid presents an endothermic peak between 180-
185°C, ΔH=1.66 kJ/mol due probable to solid-solid transition and other sharp endotherm
between 236-239°C, ΔH=27.92 kJ/mol corresponding to the melt of compound followed by a
small endothermic peak between 242-270°C due to the subliming of the nicotinic acid
[Jingyan et al 2008]. The DSC curve for the AMBNA_SDG presents four signals: an
endothermic peak between 80 and 115°C, with ΔH=32.37 kJ/mol, corresponding to the loss of
water molecules, an exothermic peak between 142 and 158°C, ΔH=11 kJ/mol due probably to
the solid-solid transition, an exothermic peak between 190 and 197°C with ΔH=31.61 kJ/mol,
followed by other exotherm event between 198–204°C, ΔH=6.44 kJ/mol corresponding to the
melting with decomposition of the sample.
a
50 100 150 200 250 300 350 400Temp [C]
50
60
70
80
90
100
%TGA
-10
0
10
20
30
uVDTA
-6.894x100%
-4.030x100%
-15.558x100%
-19.185x100%
87
105
152
194
274
AMBNA_SDGAMBNA_SDG
DTATGA
b
Figure 3.7.1. DSC traces for AMB, NA, AMBNA_SDG (a) and DTA-TGA thermograms for AMBNA_SDG (b).
DTA-TGA termograms of AMBNA_SDG (Figure 3.7.1.b) indicate in the 60–100°C
temperature range the first mass loss of 6.9 %, corresponding to a broad endothermic peak
and another endotherm between 100 and 130°C with maximum at 106°C and mass loss of
3.8% due to the non-bonded and bonded water elimination. The third mass loss occurs
between 180 and 210°C with loss of 15.6%, probably due to nicotinic acid subliming and
Page 37
33
evaporation, and final in the range of 210–350°C, the mass loss of 19% occurs, corresponding
to the elimination of volatile components which results by decomposition of ambazone and
evaporation of the nicotinic acid. This step of mass loss corresponds to a sharp exotherm with
Tonset at 175°C and peak maximum at 194°C. These signals have good similarity with DSC
measurements.
3.7.2. Powder X-Ray Difraction
The PXRD pattern of
AMBNA_SDG (Figure 3.7.4.) is
different as compared to those of
AMB and NA ones. So, a new
crystalline compound was obtained
which belong to monoclinic system
with the following unit cell
parameters: a=7.422 Ǻ, b=40.439 Ǻ,
c=6.905 Ǻ, α=90º, β=106.43º, γ=90º.
Figure 3.7.2. PXRD of AMB, NA and
AMBNA_SDG
3.7.3. Fourier Transformed Infrared Spectroscopy
The characteristic peaks of nicotinic acid (Figure 3.7.3.a,b) can be recognized in the
pure Nicotinic acid spectrum as to be: ν(O–H) 3431 cm–1, ν(=C–H) 3074 cm–1, ν(C=O) 1716
cm–1, ν(C=C) 1595–1416 cm–1, δ(=C–H) (in-plane) 1183–1039 cm–1 [Jingyan et al 2008].
The band at ~3400 cm-1 can be assigned to N–H stretching of primary amine in pure
ambazone (Figure 3.7.3.a), it can be also observed as a shoulder in the spectrum of
AMBNA_SDG. The salt formation has been shown to modify the NH stretching absorption in
amines [Socrates 2001]; it was observed that the free bases have a sharp strong band at ~3226
cm-1 due to the NH stretching and that this band is greatly reduced in intensity in the spectra
of the AMBNA_SDG. The band at 3146 cm-1 corresponds to the NH vibration [Socrates
2001] for pure AMB, it identify in salt spectrum at 3164 cm-1 can be assigned to N–H
stretching of secondary amine. A new shoulder appeared at ~2970 cm-1 probably due to the
protonated secondary amine.
Page 38
34
a b
Figure 3.7.3. FTIR spectra of AMB, NA and AMBNA_SDG in 4000-2000 cm-1 (a) and
1800-1000 cm-1 (b) spectral range.
Primary amine has an absorption band of medium intensity at ~1613 cm-1 (Figure
3.7.3.b.), being located at ~1618 cm-1 by salt formation [Socrates 2009]. Pure ambazone
spectrum contains the secondary amine vibration at 1508 cm-1 which is not shifted in
AMBNA_SDG spectrum. In the spectrum of the salt a new strong absorption appeared at
~1692 cm-1, which is assigned to deformation vibration of the protonated secondary amino
group [Muresan-Pop et al 2011a,b]. This frequency is not present in the FTIR spectrum of
pure AMB, i.e., a salt was formed between ambazone and nicotinic acid.
3.8. Ambazone with lactic acid
The Lactic acid, C3H6O3 (2-hydroxypropanoic acid) (LA), is a chemical compound
that plays an important role in various biochemical processes; it is able to release energy for
the resynthesize of ATP without oxygen involvement, the process is called anaerobic
glycolysis. The Lactic Acid belongs to the group of weak hygroscopicacids containing
alcohol in the position Alpha in the group carboxylic [Siegfried 1995]. The sample
AMBLA_SDG was prepared by grinding a mixture of 255.3 mg AMB and 0.086 ml LA to fill
up 1 ml with twice distilled water added in drops in an agate mortar at room temperature, until
a dried compound was obtained (SDG method).
3.8.1. DSC, DTA-TGA analyses
The DSC curves of the pure AMB and of the compound obtained by solvent drop
grinding between AMB and LA are presented in Figure 3.8.1.a. The thermal behavior of
aqueous solution of LA presents two endothermic events with maximums at 119 and 126°C,
due to water elimination, respectively to the sublimation of the compound. DSC curve of
AMBLA_SDG presents two events: a small broad endothermic peak between 100 and 140°C,
Page 39
35
with a maximum at 125°C corresponding to the loss of water molecules and an exothermic
event between 170 and 200°C, with maximum at 182°C due to the sample decomposition.
a
50 100 150 200 250 300 350Temp [C]
40
50
60
70
80
90
100
%TGA
-0
10
20
30
40
uVDTA
-4.338x100%
-21.244x100%
-26.030x100%
185
132 277
215
AMBLA_SDGAMBLA_SDG
DTATGA
b Figure 3.8.1. DSC traces of AMB; LA, and AMBLA_SDG (a); DTA-TGA thermograms of
AMB and AMBLA_SDG (b).
Simultaneous DTA-TGA measurements for AMBLA_SDG (Figure 3.8.1.b) indicates
in the 100–140°C temperature range the first mass loss of 4.4%, corresponding to a small
broad endothermic peak with maximum at 132°C. The second mass loss occurs between 140
and 210°C with a loss of 21%, probably due to lactic acid subliming and corresponds to a
sharp exotherm with a maximum at 185°C. The final mass loss of 26% occurs in the range of
210–330°C and corresponds to the elimination of volatile components which results by
decomposition of ambazone and evaporation of the lactic acid. The difference between the
characteristic temperatures of the pure samples and of the AMBLA_SDG shows the
formation of a new compound.
3.8.2. Powder X-Ray Difraction
The powder patterns for AMB and
AMBLA_SDG (Figure 3.8.2.) are
different; this indicates the formation of
a new solid form.The compound
obtained was included and found to
crystallize in the triclinic system with the
following network parameters:
a=10.781Ǻ, b=9.352Ǻ, c=7.348Ǻ,
α=93.65º, β=92.14º, γ=98.15 º.
Figure 3.8.2 PXRD of AMB and AMBLA_SDG.
Page 40
36
3.8.3. Fourier Transformed Infrared Spectroscopy
The band at ~3400 cm-1 can be assigned to N–H stretching from primary amine in pure
ambazone; it can be observed also as a shoulder in the spectrum of AMBLA_SDG (Figure
3.8.3.a.).
a b
Figure 3.8.3. FTIR spectra of AMB and AMBLA_SDG in 4000-2500 cm-1 (a) and 2000–
1000 cm-1 (b) spectral range.
Salt formation has been shown to modify the NH stretching absorption in amines
[Socrates 2001]; it was observed at 3273 cm-1 a signal reduced in intensity in the spectrum of
the AMBLA_SDG compared with the ambazone one. The band at 3146 cm-1 for AMB which
corresponds to the N-H stretching vibration of secondary amine [Socrates 2001] is shifted at
3182 cm-1 in salt spectrum. A new shoulder appeared at ~2975 cm-1 probably due to the
protonated secondary amine.
Primary amine has an absorption band of medium intensity at ~1613 cm-1 (Figure
3.8.3.b), being located at ~1618 cm-1 by salt formation [Socrates 2009] correlated with NH
stretching vibration. The pure ambazone spectrum contains the secondary amine vibration at
1508 cm-1 which is not shifted in AMBLA_SDG spectrum, but greatly reduced in intensity. In
the spectrum of the salt a new strong absorption band appeared at ~1676 cm-1, which is
assigned to deformation vibration of the protonated secondary amino group NH2+. This
frequency is not present in the FTIR spectrum of pure AMB, i.e., a salt was formed between
ambazone and lactic acid [Muresan-Pop et al 2011a].
Based on the FTIR spectrum of AMBLA_SDG the occurrence of the characteristic
frequencies of the NH2+ group indicates a salt formation between AMB and LA by proton
transfer.
Page 41
37
CHAPTER 4
4. Conclusions, original contributions, publications,
perspectives
4.1. General conclusions
During this research, there have been prepared and investigated a large number of
biologically active compounds based on Ambazone. These compounds are new solid forms of
Ambazone obtained and characterized for the first time.
The following conclusions had been drawn:
1. Depending on the solvent which had been used, through some recrystallization
procedures we could established the conditions for the anhydrous Ambazone to transform into
monohydrate Ambazone and reversely. Through DTA-TGA, FTIR, NMR analysis and
powder X-Ray Diffraction method, it was revealed the different behaviour of anhydrous
Ambazone in comparison with the monohydrate form. Using variabile temperature X-ray
Powder Diffraction on monohydrate Ambazone it was pointed out that: up to 90oC remains
the monohydrate form, between 90-125oC it becomes anhydrous form, between 125-185oC
the anhydrous form holds, between 185-198oC the anhydrous form disappears and at 210oC it
decomposes. These results are in agreement with the thermal analysis.
2. Monocrystal of Ambazone monohydrate was obtained and its crystal structure was
resolved by X-ray single-crystal diffraction; the compound crystallizes in the monoclinic
system having the space group P21/c, with a molecule per asymmetric unit. There were
determined the unit cell’s parameters and the atoms positions in the unit cell. Consequently,
the distances between atoms, bond angles and hydrogen bonds were obtained. Further on, the
anhydrous Ambazone single crystal was obtained and its crystal structure was determined. It
was established that the compound crystallize in monoclinic system, having the space group
P21, with two molecules per asymmetrical unit. The unit cell parameters and the atoms
positions into the unit cell were determined. From the atoms position in the unit cell there
were obtained the distances between atoms, bond angles and hydrogen bonds.
3. Three different solid forms of ambazone were prepared by various methods, using
acetic acid. Powder X-ray diffraction, thermal and spectroscopic methods revealed that the
Page 42
38
obtained Ambazone compounds are salts. By the variable temperature powder X-ray
diffraction, for the solid form of Ambazone with acetic acid obtained through SDG in 1:1
molar ratio, the temperature up to which the compound is stable was found to be 100oC;
above this temperature, the transformation into amorphous phase takes place. By the powder
X-ray diffraction and indexing procedure of the other two forms obtained by Ambazone with
acetic acid, it was established that both of them crystalized in the monoclinic system, one of
them having the space group C2, and the other one C2/c. There were also determined the
lattice parameters for these solid forms.
4. Ambazone acetate single-crystals were also prepared using the vapor diffusion
method. The crystal structure was determined by X-ray single-crystal diffraction, and it was
established that this compound crystallizes in monoclinic system, having the space group
C2/c, with one Ambazone molecule and two acetic acid molecules per asymmetric unit. There
were determined the lattice parameters, atoms positions into the unit cell, distances and bond
angles, and it was pointed out inter and intra-molecular hydrogen bonds.
5. It was obtained a new solid form of Ambazone with hydrochloric acid it was proved
its formation. FTIR, RMN and thermal analyses have shown that this new compound is a salt.
By indexing of powder patterns, results that the new compound crystallizes in the monoclinic
system, having the space group P21/c with four ambazone molecules and four chlorine atoms
per unit cell.
6. Another resulted salt was Ambazone with glutamic acid. DTA, DTA-TGA analyses
revealed the differences between Ambazone and the new compound thermal behavior. By FT-
IR the protonation at amino groups in Ambazone structure were identified, thus establishing
the salt character of the compound. By powder patterns indexing it was concluded that the
resulted salt crystallizes in the monoclinic system having the space group P21, two Ambazone
and two glutamic acid molecules per asymmetric unit. This conclusion was also sustained by
solids state NMR analysis.
7. From Ambazone with p-aminobenzoic acid it resulted a new solid form that was
also investigated through thermal methods, spectroscopic analysisses (FTIR and NMR),
leading to the conclusion that the Ambazone salt with p-aminobenzoic acid was formed. By
powder diffraction patterns indexing it resulted that the crystallographic system of the
compound is triclinic and the lattice parameters were obtained.
8. Using SDG method, Ambazone with aspartic acid was prepared, resulting two
different solid forms, considering different preparation time, five minutes and one hour
Page 43
39
respectively. For both samples the thermal behavior was analyzed by DTA-TGA. Using
powder X-ray diffraction on sample obtained by SDG one hour it was shown that the
crystallization system is monoclinic and the lattice parameters were obtained. FTIR
measurements on pure Ambazone and SDG resulting compounds attest the obtaining of
Ambazone salt with aspartic acid. Variable temperature diffraction measurements for the
compound obtained by SDG one hour, demonstrated its stability up to 198oC, this result being
in agreement with the thermal measurements. The solids state NMR analysis pointed out that
the new compound obtained from SDG 5 minutes has two aspartic acid for one Ambazone
molecule in the asymmetric unit, while the compound obtained by SDG one hour compound
has one aspartic acid molecules at one Ambazone molecule in the asymmetric unit.
9. From Ambazone with lactic acid it was prepared a new compound that was also
investigated through DSC, DTA-TGA methods, being established the thermal behavior,
different from that of pure Ambazone. FT-IR method revealed the protonation of the amine
group, thus resulted the salt feature of the compound. Using the powder X-ray diffraction it
was established that crystallographic system is triclinic and the lattice parameters were
obtained.
10. Starting from Ambazone and nicotinic acid it was obtained a new solid form
which was investigated through DSC, DTA-TGA; the thermal behavior was different from
that of pure Ambazone. As a result of FTIR analysis, it was established that a protonation at
the secondary amine group from Ambazone structure takes place, meaning that a salt is being
formed. By indexing the powder diffraction pattern of the compound it resulted that it
crystallizes in the monoclinic system and the lattice parameters were determined.
4.2. Original contributions
As a synthesis of the research results there are the following conclusions:
There were obtained 11 new solid forms from Ambazone;
These were characterized through PXRD, thermal methods (DSC, DTA-TGA),
spectroscopic methods (FTIR, NMR);
There were obtained three single-crystals: for the hydrous and anhydrous form
of Ambazone and for Ambazone with acetic acid;
It was determinated the complete crystalline structure for the three single-
crystals.
Page 44
40
Bibliografie selectivă
[Amlacher et al 1990a] Amlacher R, Baumgart J, Hartl A, Weber H, Kuhnel HJ, Schulze W,
Hoffmann H, Arch Geschwulstforsch 60 (1990) 11–8. [Baumgart et al 1990] Baumgart J, Gase K, Schulze W, Suehnel J, Gutsche W, Behnke D,
Cancer Lett. 54 (1990) 119-24.
[Bernstein 2006] Bernstein J, Polymorphism and Patents from a Chemist’s Point of View, în Polymorphism în the pharmaceutical industry, Wiley-VCH, Weinheim, (2006) 365–
82. [Bond 2007] Bond AD, Cryst Eng Comm 9 (2007) 833-834. [Brittain 2009] Brittain HG, Polymorphism în pharmaceutical solids, (Drugs and the
Pharmaceutical Sciences), Second Edition Informa Healthcare USA Inc.52 Vanderbilt Avenue New York, NY 10017, 192 (2009).
[Chakrapani et al 2008] Chakrapani H, Wilde TC, Citro ML, Goodblatt MM, Keefer LK, Saavedra JE, Bioorg. & Med. Chem., 16 (2008) 2657–64.
[Etter et al 1993] Etter MC, Reutzel SM, Choo CG, J Am Chem Soc 115 (1993) 4411-12.
[Fichtner et Arnold 1983] Fichtner I, Arnold W, Pharmazie, 38(2) (1983) 130–1. [Gomes et Mallion 2001] Gomes JANF, Mallion RB, Chem Rev 101 (2001) 1349–84.
[Günter et Hoffmann 1990] Gunter L, Hoffmann H, Biophysical Chemistry (1990) 287-300. [Ivanova et al 2010] Ivanova B and Spiteller M, Spectrochim. ActaA 77 (2010) 849–855. [Jingyan et al 2008] Jingyan S, Jie L, Yun D, Ling H, Xi Y, Zhiyong W, Yuwen L and
Cunxin W, JTAC 93 (2008) 403–9. [Koleva et al 2009] Koleva BB, Kolev T, Seidel RW, Spiteller M, Mayer-Figge H and
Sheldrick WS, J Phys ChemA,113 3088–95 (2009). [Kuhnel et al 1988a] Kuhnel HJ, Amlacher R, Baumgart J, Schulze W, Arch
Geschwulstforsch 58 (1988) 217–22.
[Löber et Hoffmann 1990] Löber G and Hoffmann H, Biophys Chem 35 (1990) 287–300. [Makareyer et al 1997] Makareyer EN, Makedonov Yu V and Lozorskaya EL, Russian
Chemical Bulletin 46 (1997). [Mocuta et al 2008] Mocuta H, Borodi G, Simon S, 3rd International Conference Advanced
Spectroscopies on Biomedical and Nanostructured Systems”, 7-10 sept Babes-Bolyai
University Cluj-Napoca (2008). [Mureşan-Pop et al 2011a] Mureşan-Pop M, Kacsó I, Tripon C, Moldovan Z, Borodi Gh,
Bratu I and Simon S, J. Therm. Anal. Calorim.104 (2011) 299–306. [Mureşan-Pop et al 2011b] Mureşan-Pop M, Kacsó I, Filip X, Vanea E, Borodi G, Leopold N,
Bratu I, Simon S, Spectroscopy, 26 (2011) 115-28.
[Otsuka et al 1994] Otsuka M, Otsuka K, Kaneniwa N, Drug DevInd Pharm 20 (1994) 1649–60.
[Petersen et al 1955] Petersen S, Gauss W, Urbschat E, Angew. Chem. 67 (1955), on line (2006) 217-231.
[SDBS 2007] Spectral Database for Organic Compounds SDBS
(http://riodb01.ibase.aist.go.jp) SDBS 1097 (2007). [Siegfried 1995] Siegfried RW, Drug Cosmet Ind 156 (1995) 30-37 104-105.
[Socrates 2001] Socrates G, Infrared and Raman Characteristic Group Frequencies: Tables and Charts, 3rd edn, Wiley, West Sussex 332 (2001) 107-13 222-24 332.
[Stilinovic et al 2008] Stilinovic V, Cincik D and Kaitner B, Acta Chim Slov 55 (2008) 874–
79. [Tim et al 1999] Tim KY and Takacs, Novak K, Pharm Res 16 (1999) 377-81.
Page 45
41
MULŢUMIRI
Doresc să-i mulţumesc în mod special coordonatorului stiinţific al acestei lucrări, D-nului
Prof. Univ. Dr. Simion Simon, pentru îndrumarea, sprijinul şi valoroasele cunoştinţe
stiinţifice oferite pe parcursul întregul program doctoral.
Mulţumiri grupului de cercetători de la INCDTIM din Cluj-Napoca: Dr. Irina Kacso, Tehn.
Sorina Ciupe, Dr. G. Borodi şi Dr. I. Bratu, pentru valoroasa colaborare din aceşti ani.
Mulţumesc colaboratorilor de la Universitatea din Bologna, departamentul “Molecular
CrystalI Engineering Group, G. Ciamician” Prof. Univ. Dr. Dario Braga, Prof. Univ. Dr.
Fabrizia Grepioni, Dr. Lucia Maini din Bologna, pentru sprijinul acordat in cadrul
experimentelor de creştere de monocristale.
De asemenea, îmi exprim mulţumirea faţă de toţi colegii din cadrul Institutului de Cercetări
Experimentale şi Interdisciplinare ICEI (Cristina, Oana, Emilia, Adriana, Monica, Diana,
Zsolt, Mihai) care mi-au oferit deopotrivă suport ştiinţific şi sprijin moral.
Mulţumiri speciale faţă de cei care au condus proiectul POSDRU 6/1.5/S/3 – “Doctoral
Studies: Through Science Towards Society” Babeş-Bolyai University, Cluj-Napoca, Romania,
pentru finanţarea acordată in cei trei ani de studiu.
Şi nu în ultimul rând,
Mulţumesc părinţilor mei, fiicei mele Isabelle, surorilor şi prietenei mele Iulia Miclăuş,
pentru susţinerea şi încurajările pe care mi le-au dat în aceşti ani.


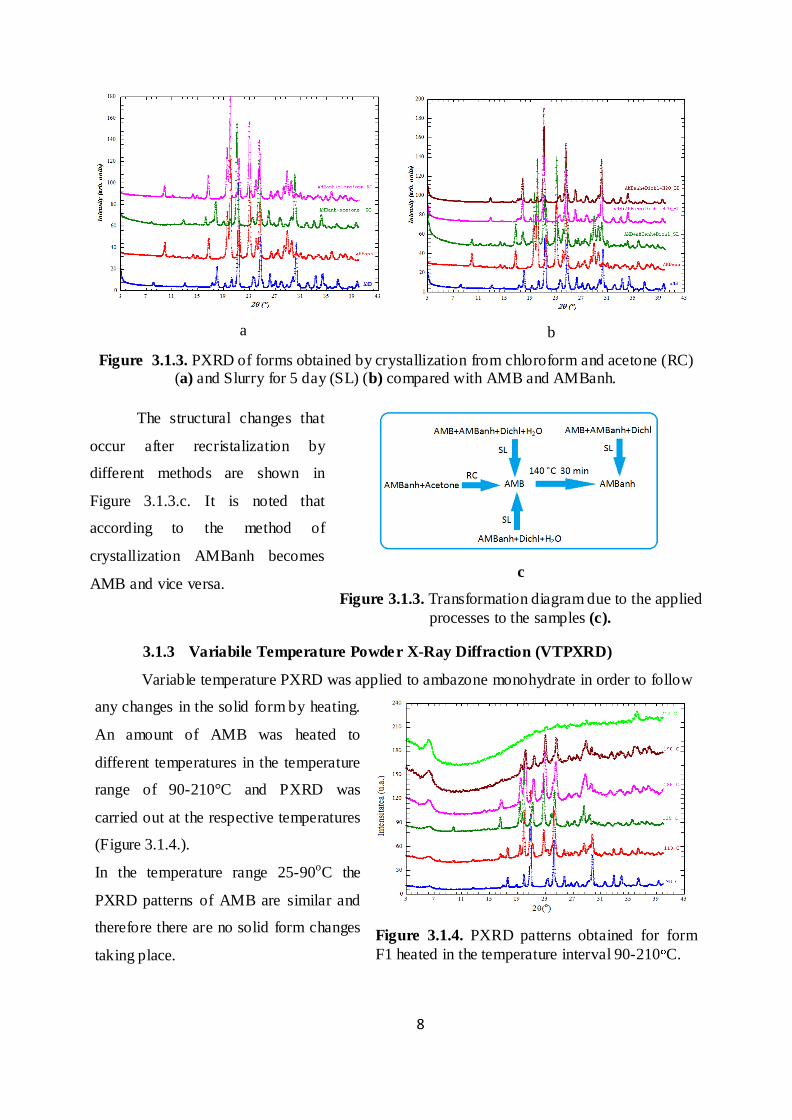


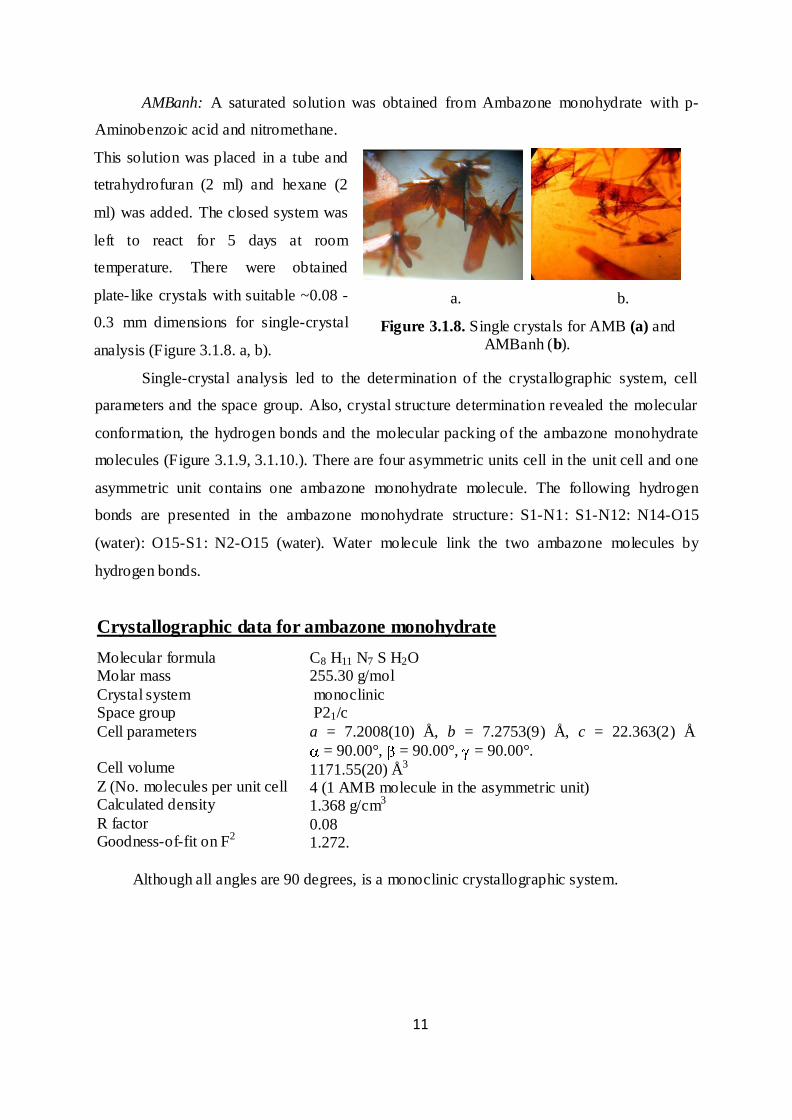
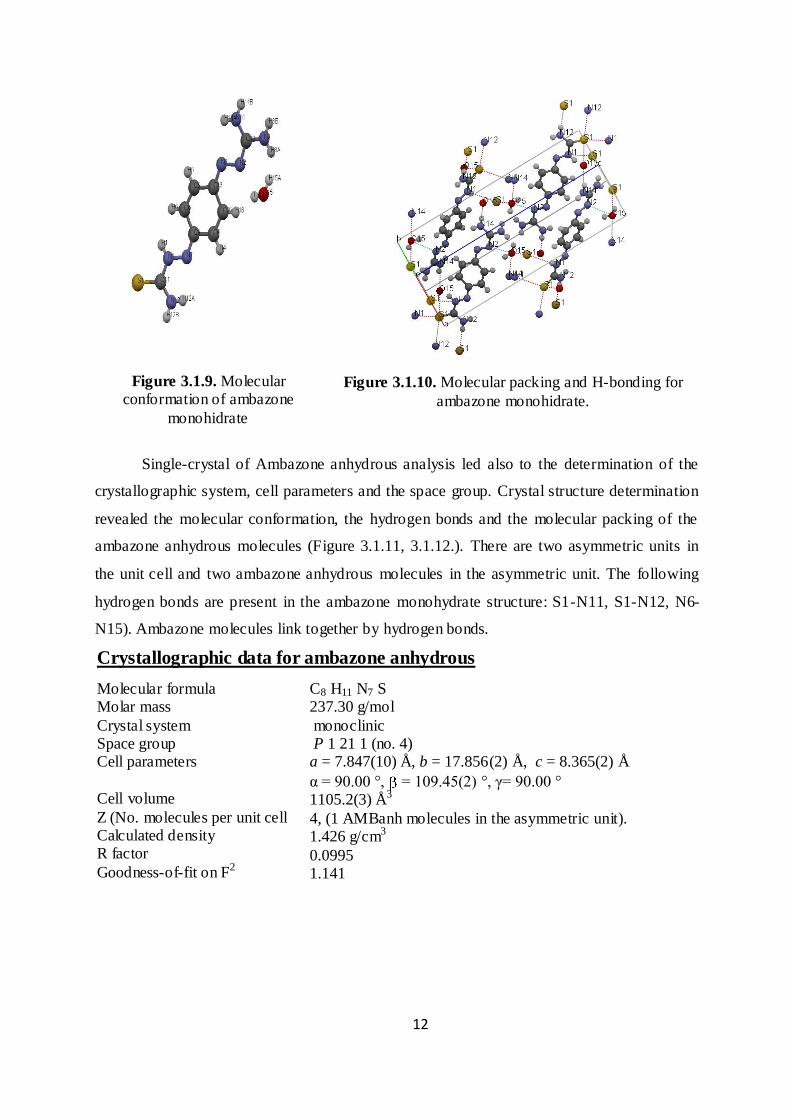
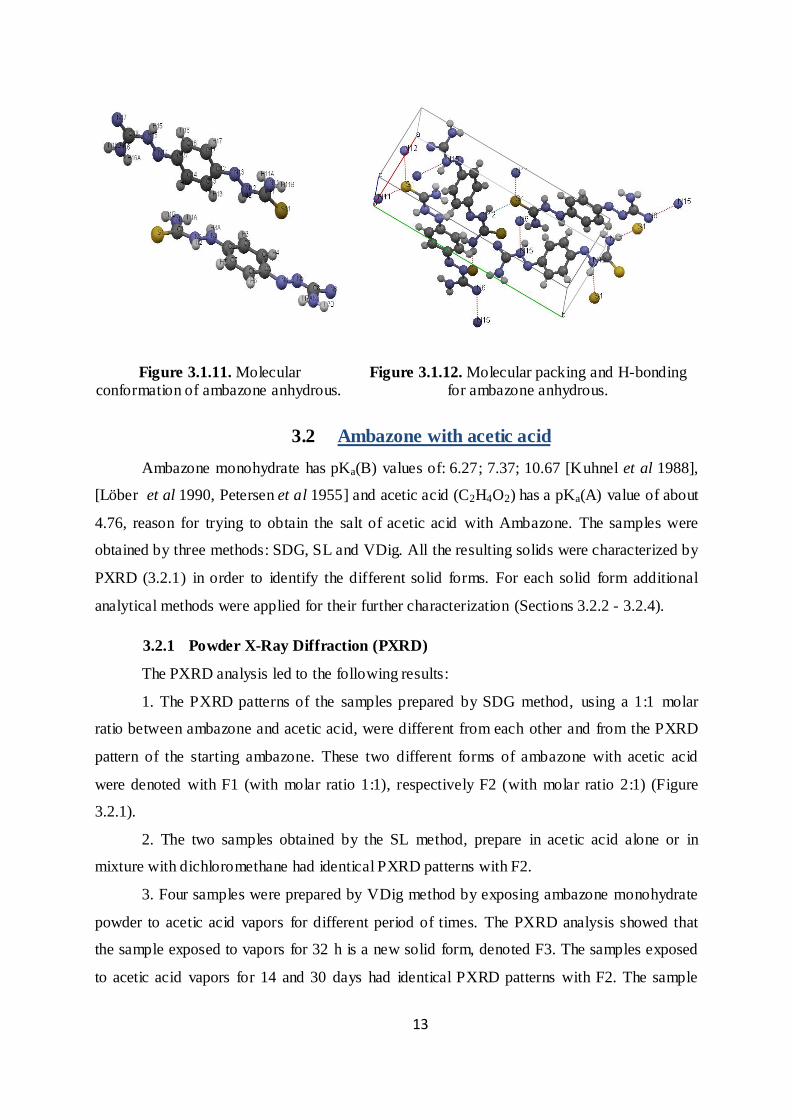


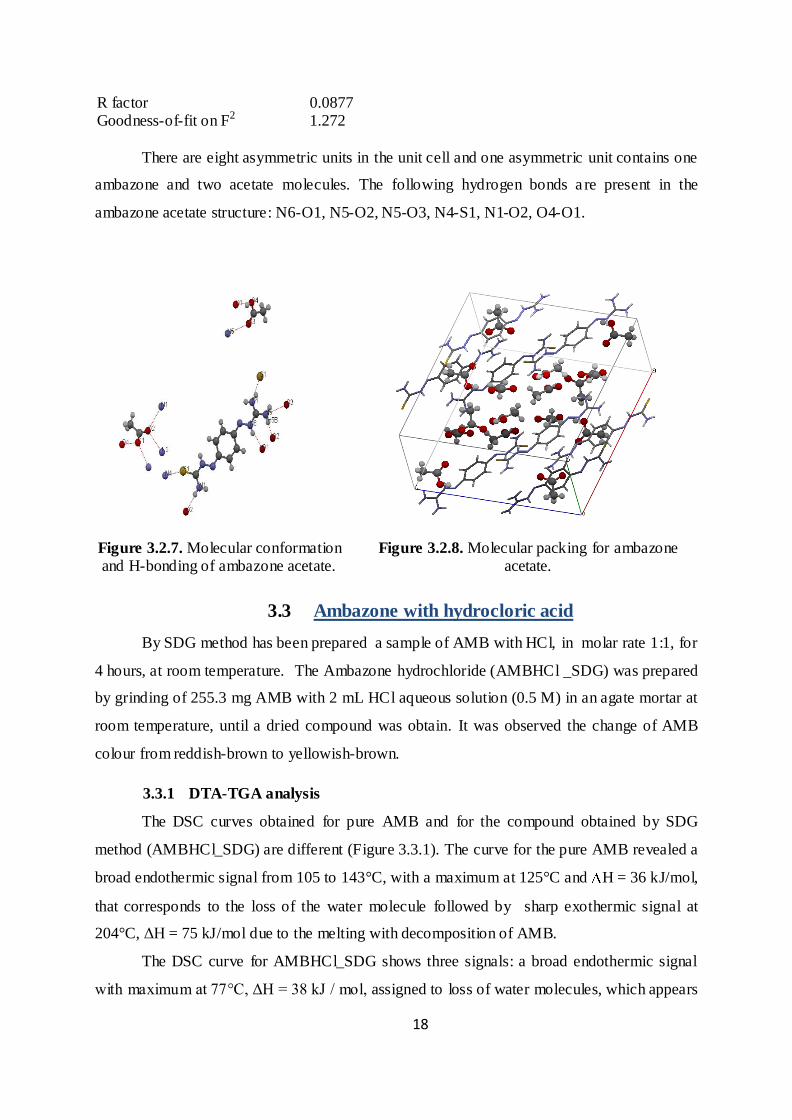


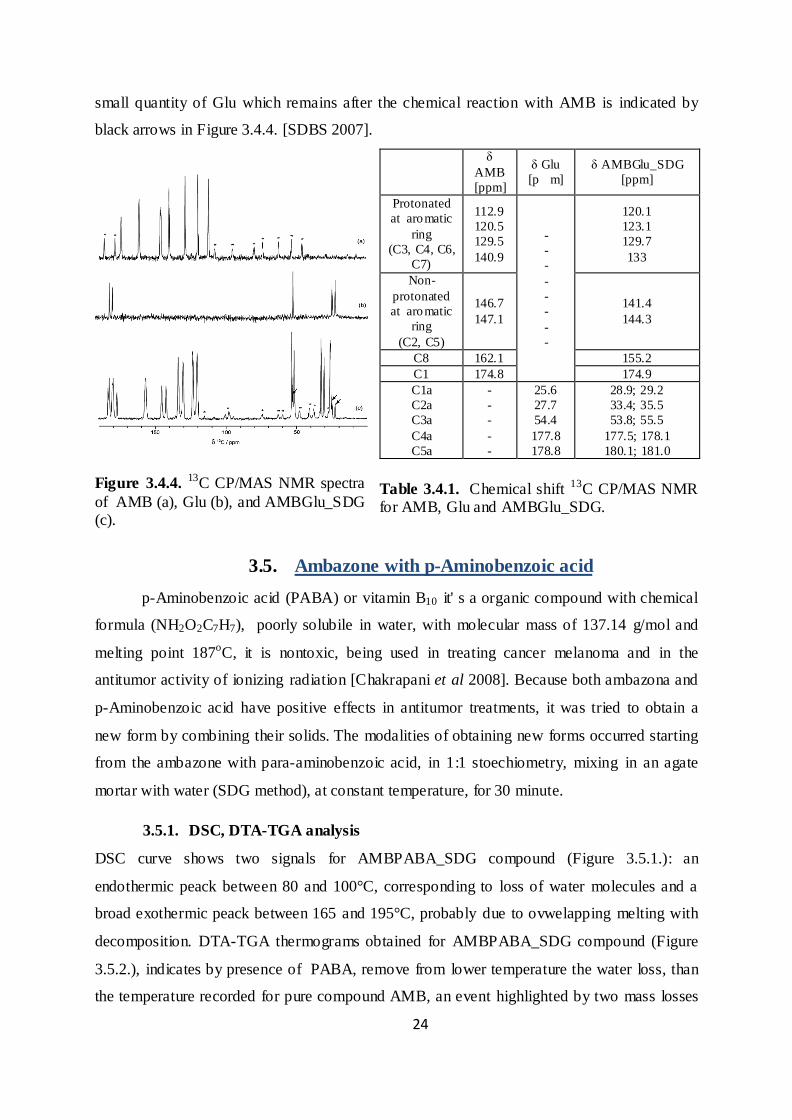

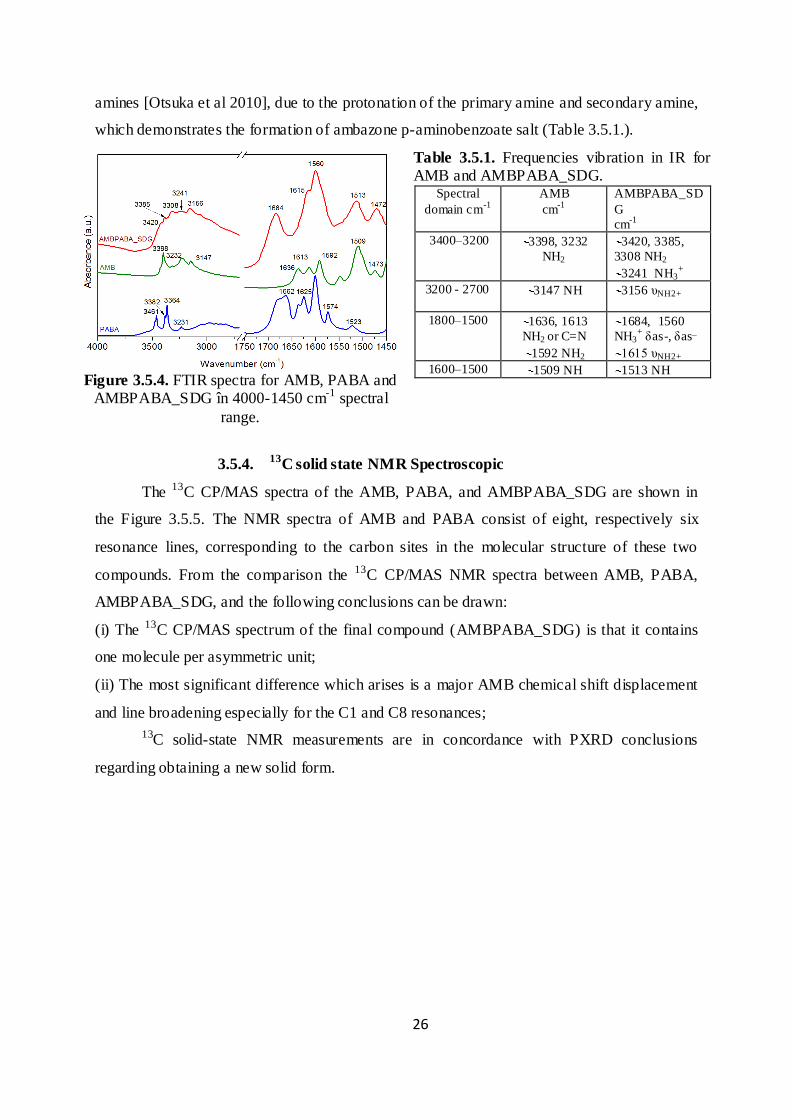


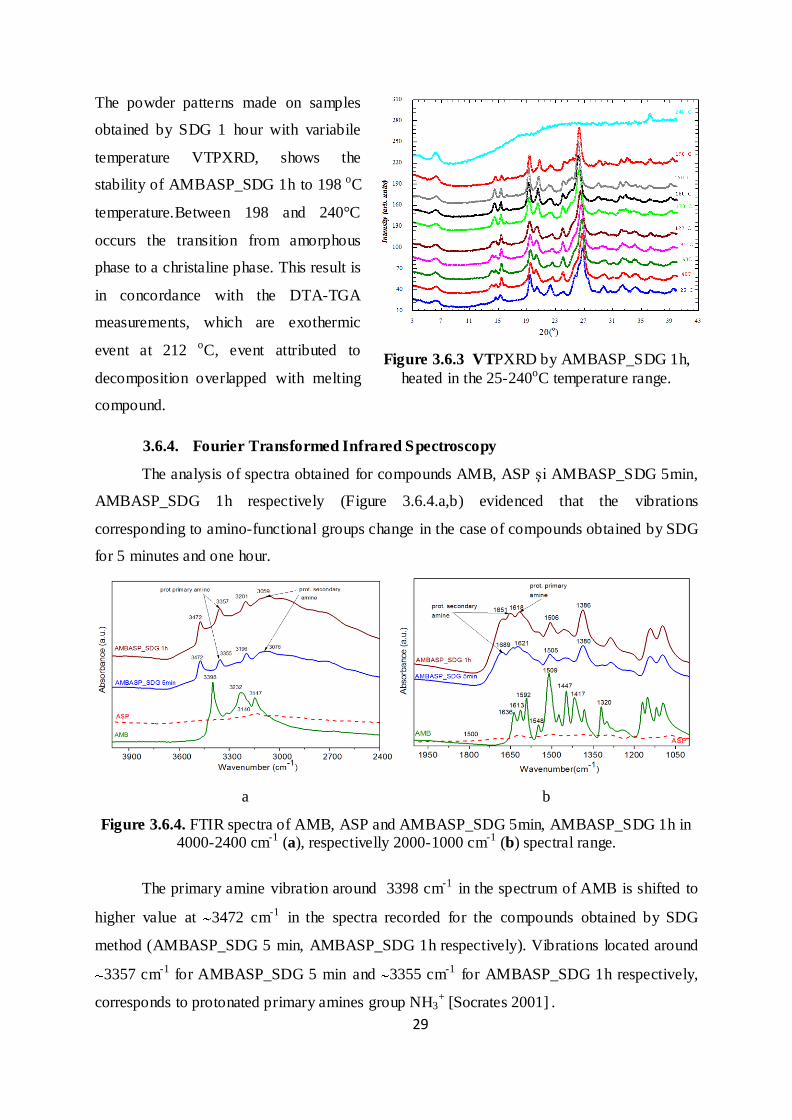
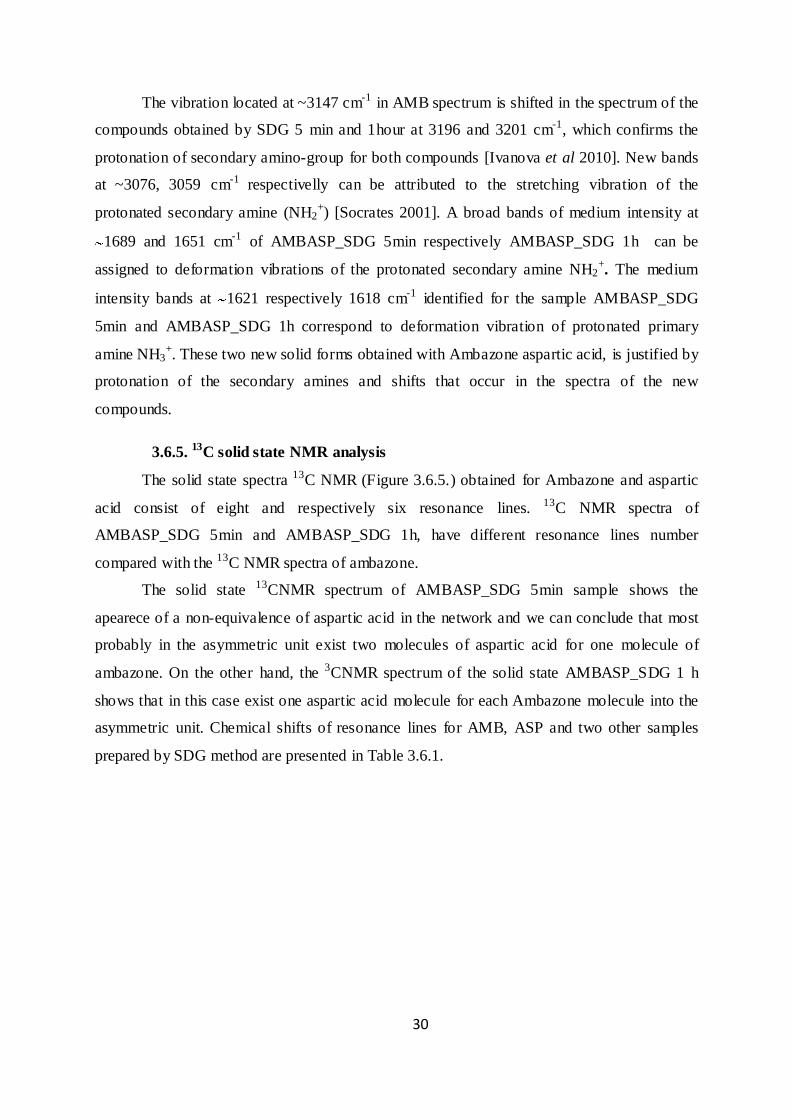

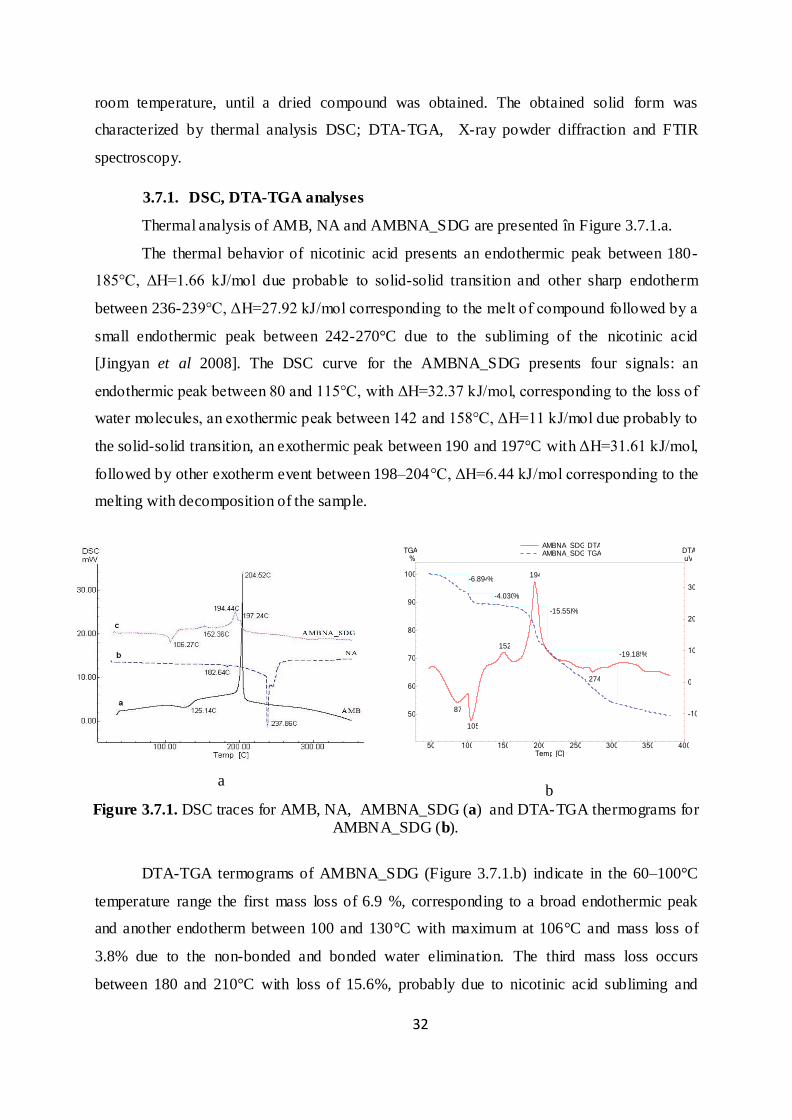

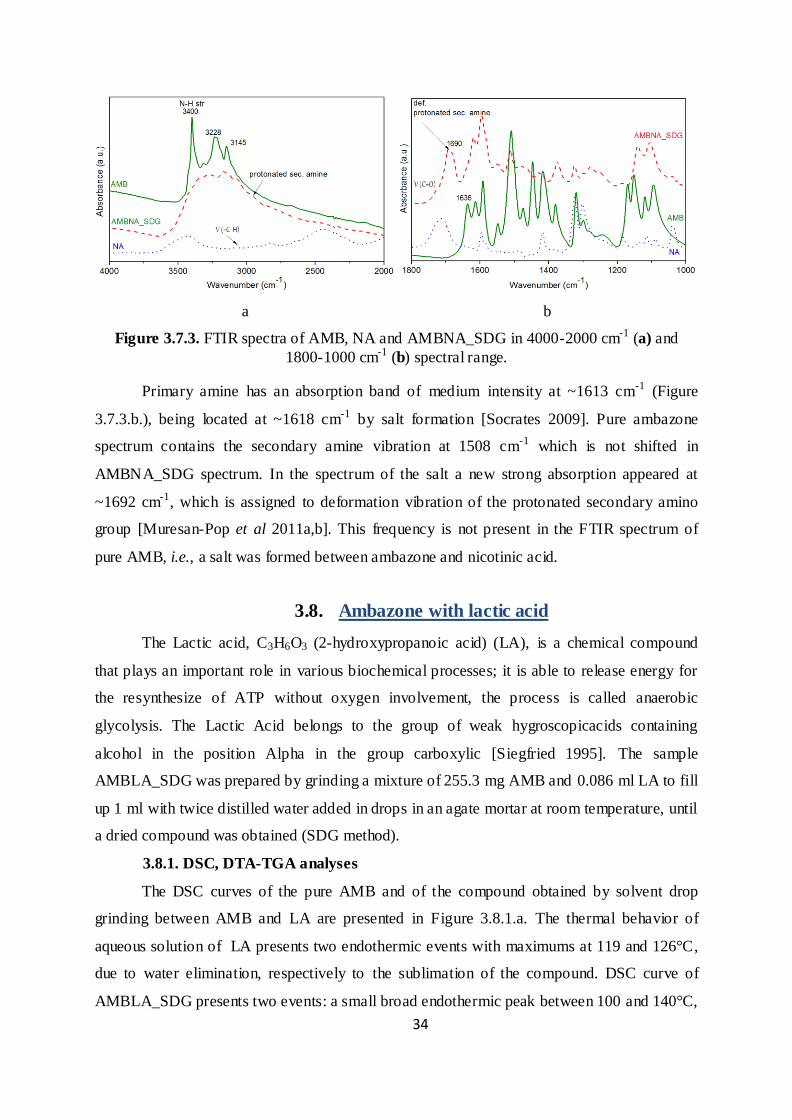

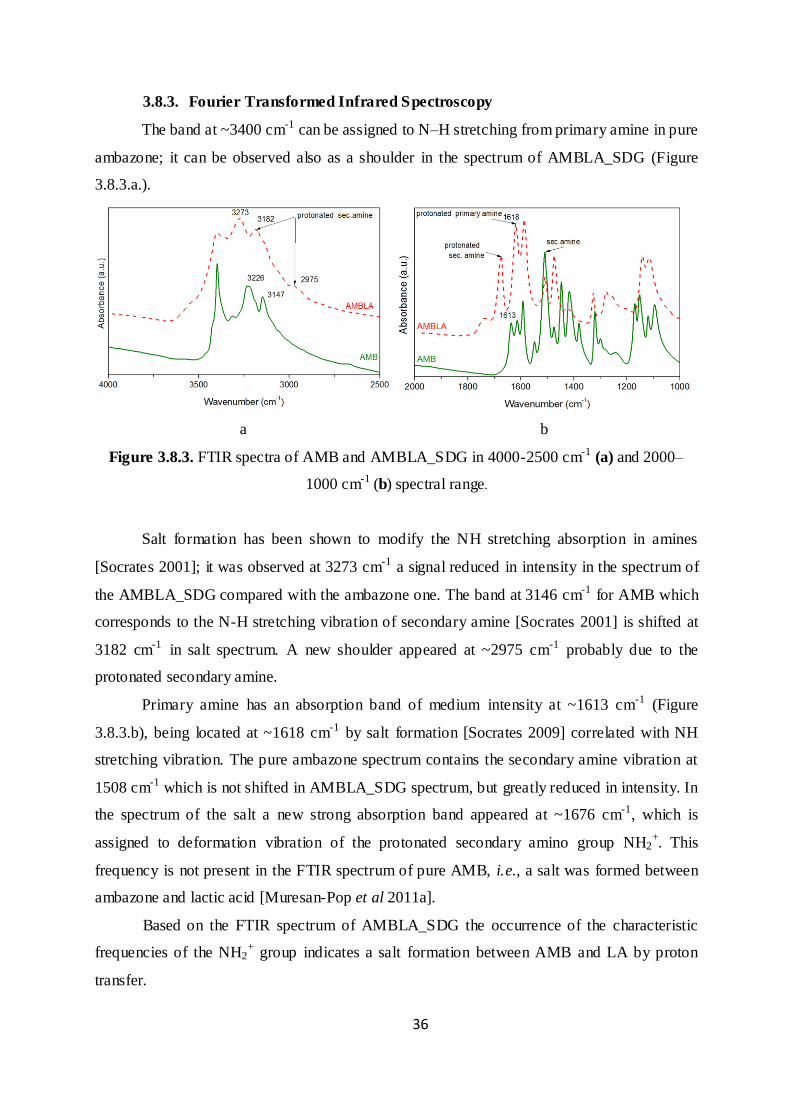


![Application of Saccharides to the Synthesis of Biologically Active Compounds[PDF:551KB]](https://static.documents.pub/doc/80x56/6206537f8c2f7b173006afa3/application-of-saccharides-to-the-synthesis-of-biologically-active-compoundspdf551kb.jpg)


