Page 1
1
Investigation of electrorefining of metallic alloy fuel onto
solid Al cathodes
L.Cassayre, R. Malmbeck*, P. Masset, J. Rebizant, J.Serp, P.Soucek, J.-P.Glatz
European Commission, JRC, Institute for Transuranium Elements, P.O. 2340,
76125 Karlsruhe, Germany
*: Corresponding author. Tel.: +49 7247 951 376; fax: +49 7247 95199611; E-
mail address: [email protected]
Abstract
This work concerned the electrorefining of UZr and UPuZr alloys on a solid
aluminium cathode, in the LiCl-KCl eutectic melt containing U3+, Pu3+, Np3+,
Zr2+ or Zr 4+, Am3+, Nd3+, Y3+, Ce3+ and Gd3+ chlorides. During constant current
electrolyses, the use of a cathodic cut-off potential (-1.25 V vs. Ag/AgCl)
allowed to selectively deposit actinides (mainly U), while lanthanides remained
in the salt. The aim was to determine the maximal load achievable on a single
aluminium electrode. The total exchange charge was 4300 C, which represents
the deposition of 3.72 g of actinides in 4.17 g Al, yielding a composition of 44.6
wt% An in Al. It was shown that the melting of the cathode contributed to
increase the total amount of actinides deposited on the aluminium.
Page 2
2
1. Introduction
One important criterion for future innovative reactor systems is sustainability
including minimisation of waste output and its radiotoxicity. In this sense, the
radiotoxic character of actinides (Np, Pu, Am, Cm) has a key impact and their
recycling is mandatory [1, 2]. For homogenous recycling of all actinides,
pyrochemical separation schemes involving molten salt or molten metal media
seem today the most suitable. Thermodynamic calculations have shown that
aluminium could be the most promising metallic solvent to support the grouped
recovery of actinides (An) and an efficient separation from lanthanides (Ln) [3,
4]. In molten fluoride salts, the technique of reductive extraction is under
development, with a separation process based on the different distribution of An
and Ln between the salt and metallic Al phase [5].
In molten chloride media, the An-Ln separation is being developed using
electrochemical techniques. It has already been shown that a selective separation
of actinides can be achieved by electrolysis onto solid Al cathodes in the LiCl-
KCl eutectic, with the formation of stable An-Al surface alloys [6]. In previous
experiments, constant current electrolyses have been carried out on Al rod
electrodes (S ~ 4 cm²) to characterise the alloys formed by electrodeposition of
U3+ dissolved in the melt [7]. In these tests, the anodic reaction consisted in the
electrochemical dissolution of uranium, by the use of a metallic U-Zr alloy as
anode. The current density was gradually increased and adjusted until a stable
cathodic potential was reached (~ -1.10 V vs. Ag/AgCl), corresponding to the
potential of formation of a uranium-aluminium alloy. SEM-EDX mapping
revealed the presence of the UAl4 alloy as expected by the U-Al binary phase
diagram at the experimental temperature (450 °C) [8].
Page 3
3
In such an electrolytic process, the rate of the alloy formation depends on the
diffusion of the involved elements in and through the solid alloy phase. Thus
with increasing thickness of the alloy, further deposition of An as An-Al alloy
becomes more and more difficult. If the deposition rate of An is too high, a
depletion of Al occurs at the surface and the actinides will deposit as pure metals,
at potentials shifted towards more negative values. This must be avoided, since
for an efficient grouped separation of actinides from lanthanides a potential more
anodic than -1.25 V vs. Ag/AgCl is required. The applied current has to be
lowered as soon as the cathodic potential becomes too negative. However, a
point is finally reached when it is no more possible to maintain the cathodic
potential positive enough to ensure the separation of An from Ln. This limits the
amount of An which can be recovered onto Al.
In order to further develop this pyrochemical process for separation of An onto
solid Al cathodes, this study has focussed on evaluating the maximum amount of
actinides that can be collected on a single Al electrode. This paper also discusses
the limitation induced by low concentration of actinides when a cut-off potential
is used.
2. Experimental
The experiments, storage and handling of chemicals were carried out in a
glovebox under purified Ar atmosphere (less than 5 ppm of water and oxygen).
An alumina double compartment crucible was used as a container (Fig. 1). The
two compartments were filled with 10.93 g of Bi pellets and 4.62 g of Al pellets
respectively. In order to provide an electrical lead to the Al cathode, the
Page 4
4
temperature was raised to 665 °C (the melting point of aluminium is 661°C) and
a Ta wire was inserted in the molten Al pool. As the temperature was reduced to
450 °C, the Al solidified and the Ta wire was attached. By solidifying, the Al
cathode formed an irregular metal ball having an undefined surface area.
Considering a spherical shape, the area was estimated to be 3-5 cm2. The
chloride salt was finally added in the crucible. It contained U3+, Pu3+, Np3+, Zr2+
or Zr4+, Am3+, Nd3+, Y3+, Ce3+ and Gd3+, dissolved in 40 g of LiCl-KCl eutectic
(Aldrich 99.99 %).
The melt was first investigated by cyclic voltammetry at 450°C, using either
tungsten wire or aluminium wire (1 mm in diameter) as working electrode, the
aluminium ball as counter electrode and an Ag/LiCl-KCl-AgCl (1 wt%)
reference electrode. All potential values mentioned in this text refer to the
Ag/AgCl (1 wt%) equilibrium potential.
Then, constant current electrolyses were carried out, the cathodic reaction being
the selective reduction of An. The anodic reaction consisted in the dissolution of
UZr (80/20 wt%) or UPuZr (71/19/10 wt%) alloys loaded in a Ta basket placed
above the Bi pool. During the electrolyses, the anodic, cathodic and cell
potentials were monitored versus the Ag/AgCl reference electrode.
Salt samples were regularly collected with a glass tube and the concentration of
An-Ln was analysed by ICP-MS and XRF [9].
3. Results and discussion
3.1 Cyclic voltammetry
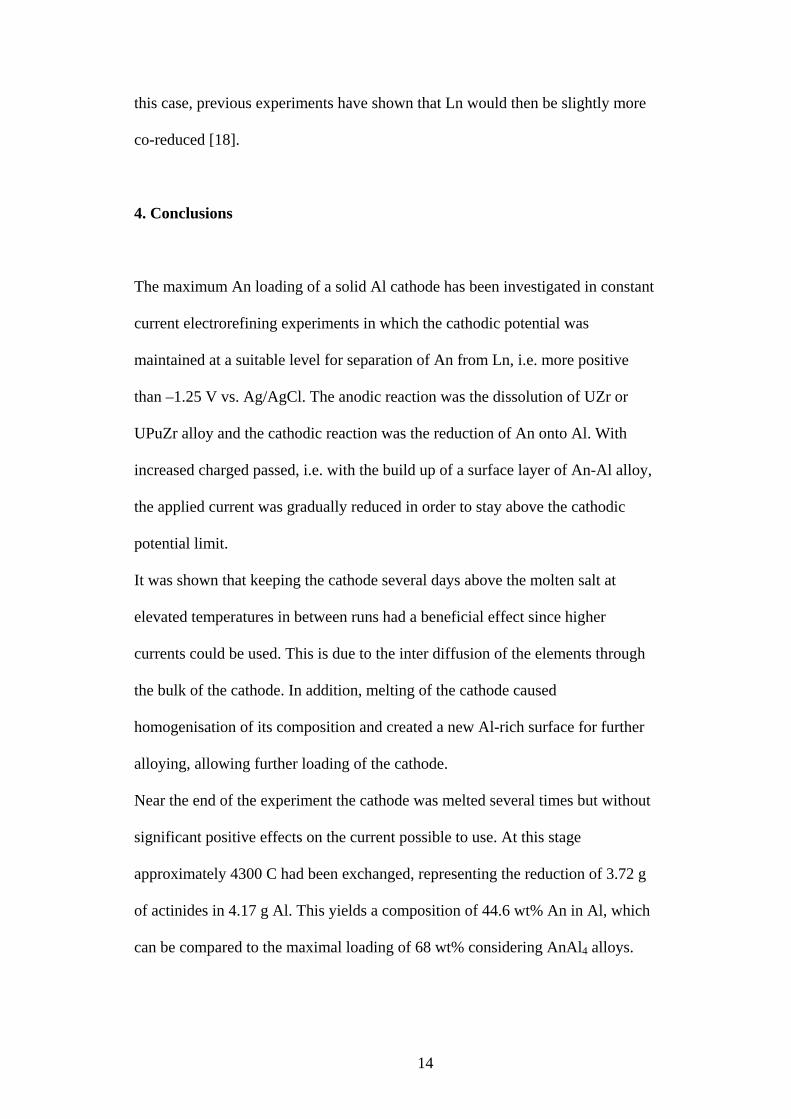
The melt was first investigated by cyclic voltammetry on a W working electrode.
A cyclic voltammogram of the initial salt phase is presented in Fig. 2.
Page 5
5
Characteristic reduction peaks of trivalent An and Ln are observed during the
sweep from anodic to cathodic potentials. The first cathodic wave is attributed to
the reduction of uranium (U3+ to U0) at –1.50 V. This is followed by the
reduction of Np3+ to Np0 at –1.69 V (not clearly visible), the deposition of Pu at
–1.77 V and the reduction of Ln3+ to Ln0 at around –2.00 V [10]. Due to the low
concentration of Am3+ (0.06 wt%), its reduction is not detected by cyclic
voltammetry, but occurs at a potential in between the Pu and the Ln reduction
potentials [11]. The cathodic limit of the solvent is reached at –2.50 V, where Li+
is reduced to Li metal.
The W working electrode was then replaced by an Al wire in order to investigate
the best conditions to perform the selective electrolysis of the An onto the Al
cathode. A cyclic voltammogram is plotted in Fig. 2. As the metals alloy with Al,
their reduction potentials shift to more positive values compared to the reduction
potentials on the inert W cathode [6]: U3+ is reduced to UAl4 at –1.05 V and Pu3+
to PuAl4 at –1.17V. The Am and Np concentrations are too low to detect clear
reduction signals on the Al electrode. Lanthanides start reducing at potentials
more negative than –1.35 V.
For a better evaluation of the An-Ln reduction potentials on the aluminium
electrode, LiCl-KCl melts containing only one compound (U, Pu, Np, Am or Nd)
were prepared. Fig. 3 presents two voltammograms obtained in two LiCl-KCl
melts containing PuCl3 (1.39 wt%) and AmCl3 (0.45 wt%) respectively. These
voltammograms allowed a graphic determination of the equilibrium potentials
EeqM(III)/M(Al) of each compound, as shown in Fig. 3.
Page 6
6
The measured equilibrium potentials EeqM(III)/M(Al) can be expressed with the
activity coefficients in the salt phase and in the metal phase. For instance, in the
case of the U(III)/U(0) system, the equilibrium potential of the UAl4 alloy is:
EeqU(III)/U(Al) = E0
U(III)/U(0) + )(
3ln3 AlU
UCl
aa
FRT (1)
where 0)0(/)( UIIIUE is the standard potential of the U(III)/U(0) redox couple,
3UCla
and )( AlUa are the activity of UCl3 in the salt and of uranium in Al, respectively.
The apparent standard potential, 0*)0(/)( UIIIUE of the U(III)/U(0) redox couple is :
3ln
30
)0(/)(0*
)0(/)( UClUIIIUUIIIU FRTEE γ+= (2)
where 3
3
3UCl
UClUCl X
a=γ is the activity coefficient of UCl3 and XUCl3 is the molar
fraction of UCl3 in the salt.
Combining Eq. (1) and Eq. (2), EeqU(III)/U(Al) can be expressed as:
)(0*
)0(/)()(/)( ln3
ln3 3 AlUUClUIIIU
eqAlUIIIU a
FRTX
FRTEE −+= (3)
Then, by introducing the apparent standard potential of reduction of UCl3 onto
Al, which is defined as:
)(0*
)0(/)(0*
)(/)( ln3 AlUUIIIUAlUIIIU a
FRTEE −= (4)
and by combining Eq. (3) and (4), the equilibrium potential is finally expressed
as:
3ln
30*
)(/)()(/)( UClAlUIIIUAlUIIIUeq X
FRTEE += (5)
Using Eq. (5) and the equilibrium potentials measured on the voltammograms,
the apparent standard potentials on Al were determined. Results are listed in
Page 7
7
Table 1, along with additional data concerning lanthanides from Bermejo [12],
measured in molten LiCl-KCl by electrochemical techniques.
Another way of evaluating the apparent standard potential is to calculate it from
tabulated thermochemical data, using the energy of formation of AnAl4 alloys. In
this case, the only data available concern UAl4 and PuAl4 alloys [13]. For
uranium, the corresponding electrochemical cell is:
4 Al(s) + UCl3(dissolved) + 3 Ag(s) = UAl4(s) + 3 AgCl(dissolved) (6)
The equilibrium potential EeqU(III)/U(Al) can be expressed as:
30
/)(0
/)(/)()(/)(3
4ln
3 AgCl
UClAgClIAgUAlIIIU
eqAgIAgAlUIIIU
eq
aa
FRTEEEE +−=− (7)
where eqAgIAgE /)( = 0 V since it is the reference potential,
FGEE r
AgClIAgUAlIIIU 3
00
/)(0
4/)(Δ
−=− , ΔrG° being the standard Gibbs energy
of Eq. (6),
333 UClUClUCl Xa γ= ,
aAgCl is equal to the molar fraction XAgCl, assuming unity activity
coefficient for AgCl [14].
From Eq. (7) comes:
33ln
3ln
3ln
3
0
)(/)( UClUClAgClr
AlUIIIUeq X
FRT
FRTX
FRT
FG
E +⎥⎦
⎤⎢⎣
⎡+−
Δ−= γ (8)
Comparison of Eq. (5) and Eq. (8) allows expressing the standard apparent
potential as:
Page 8
8
3ln
3ln
3
00*
)(/)( UClAgClr
AlUIIIU FRTX
FRT
FGE γ+−
Δ−= (9)
where FGr
3
0Δ− =-1.15 V according to data from Chiotti [13] and Barin [15],
3UClγ =2.0x10⁻³ according to data from [16],
XAgCl=3.25x10⁻³ (1 wt%).
At 450 °C, the calculated value of the apparent standard potential according to
Eq. (9) is -0.92 V, which is close to the value derived from measurement (-0.89
V) as shown in Table 1. For Pu(III)/Pu(Al), calculation was also consistent with
experimental value, since the calculated apparent standard potential is equal to -
1.12 V (with an activity coefficient of 3.5x10⁻³ [10] and FGr
3
0Δ− =-1.32 V
[13,15]).
The data shown in Table 1 clearly confirm that a selective extraction of An is
feasible, provided that the reduction potential of the Al electrode is not too
negative.
3.2 Electrolysis experiments
Before starting electrorefining, the concentration of uranium was increased by
adding UZr into the Bi pool and oxidising it by the addition of BiCl3 in the salt
phase, as described in [16]. The uranium concentration was thereby increased to
1 wt%, allowing the use of higher currents during the electrolysis. The resulting
composition of the melt is presented in Table 2.
An were collected in the Al cathode by constant current electrorefining. Each run
was controlled by maintaining a cathodic potential suitable for separation of An
Page 9
9
from Ln, i.e. more positive than –1.25 V (see dashed vertical line in Fig. 2). As
soon as the cathodic potential dropped below –1.25 V, the current density was
reduced in order to slow down the reaction and ensure a selective An deposition.
During the night the cathode was lifted up and maintained 1 cm above the bath,
at roughly 400 °C. On some occasions the temperature of the bath was raised to
700 °C and the Al cathode was melted in order to homogenise the deposit and
create a fresh surface. In total more than 70 electrolyses were performed
applying currents in a 10-50 mA range, and the total charge passed was around
4300 C.
3.2.1 Potential evolution during electrorefining
Fig. 4 shows the evolution of the potential of the Al electrode as well as the
applied current during the complete experiment.
In the first electrolysis, at 30 mA, a total charge of 250 C was passed before the
cathodic current reached the limit of –1.25 V. The second electrolysis at 20 mA
involved a total charge of 210 C before interruption. The cathode was then lifted
up and kept at 400 °C over the bath for several days before the experiment
continued. In the next electrolyses a higher current could be used and a total
charge of 220 C was passed at currents between 30 and 40 mA. This was
followed by a few electrolyses passing roughly 550 C with currents decreasing
from 35 to 15 mA. The next set of experiments performed 48 hours later in a
series of electrolyses involving some 340 C of which 220 C was passed at a
current of 20 mA.
Although the applied current had to be gradually decreased with increasing total
charge passed, it appeared that maintaining the cathode above the melt between
Page 10
10
each run had a beneficial effect. It was then possible to restart electrolysis
applying a current, due to the inter-diffusion of An and Al.
After a total charge of 1500 C had been passed (corresponding to approximately
1.25 g of An), the applied currents had to be kept at a maximum of 20 mA, with
frequent stops imposed by the cut-off potential. The cathode was often
maintained above the bath to allow the diffusion of the deposited An into the
bulk of the aluminium. Between 2500 and 3100 C, the effect of Al saturation
became more and more evident. As shown in Fig. 4, the frequency of the stops
increased, and thus the length of each run decreased accordingly.
After 3100 C were exchanged, 2.59 g of actinides had been deposited in 4.62 g
of Al, according to Faraday’s law. This corresponds to an An loading of the
electrode of 35.9 wt%. At this point, the Al cathode was heated to 700 °C in
order to homogenise its composition and create a fresh Al-rich surface for further
alloying (see * in Fig. 4). According to the U-Al binary phase diagram presented
in Fig. 5, a complete homogenisation of the alloy is not possible at this
temperature. However, pure unused Al in the centre of the cathode probably
melted, thus improving the life time of the cathode for further electrorefining.
After this process, it was again possible to electrolyse at 30 mA for longer runs.
Finally, between 4000 C and 4300 C, the Al cathode was melted several times
without significant positive effects. At this point the experiment was stopped.
In total a charge of 4300 C was electrolysed at an average current of 25 mA,
corresponding to the reduction of 3.72 g of actinides in 4.17 g of Al. This yields
Page 11
11
a total loading of 44.6 wt% An in Al. The recovered Al cathode (after washing in
methanol to remove adhering salt) is shown in Fig. 6. On top, the Ta lead and a
small piece of the Al2O3 tube can be seen. The white areas show small amounts
of remaining salt.
During the experiment, the potential of the anode basket was around –1.30 V,
which corresponds to the anodic dissolution of U3+ from the UZr alloy (80-20
wt%). After 1600 C the anode potential suddenly increased and the electrolysis
was stopped. According to the weight and composition of the UZr alloy, at this
point the anode was depleted in U and the positive jump in anodic potential
indicated the start of Zr dissolution (above –1.0 V) [17]. The anode was then
replaced by the UPuZr alloy. After 2800 C the same rise in anodic potential
effect was observed, and the anode was replaced after roughly 3200 C. A third
basket containing UZr alloy was used as anode for the end of the experiment.
3.2.2 Salt analysis
The evolution of An-Ln concentrations in the salt is shown in Fig. 7. The
corresponding anode basket composition is also reported on this plot.
Ln
During the whole experiment the concentration of lanthanides (Gd, Nd, Ce and
Y) remained stable, which means that the cathodic potential was positive enough
to avoid their reduction.
U
Page 12
12
During electrorefining using the UZr anode, U was anodically dissolved but also
reduced at the cathode, which means that the concentration of uranium should
remain fairly constant. However, during passage of the first 1500 C charge, the
uranium concentration decreased from approximately 1 wt% to 0.4 wt%. This
represents a uranium loss in the bath of about 250 mg compared to the 1.23 g of
actinides oxidised and collected on the cathode. One possible reaction that could
account for this is the chemical reductive extraction of U3+ onto Al, because the
potential of U-Al alloy formation is close (less than 50 mV) to the Al open-
circuit potential.
At the end of the experiment, as the anode material was changed back to UZr, a
slight decrease in U concentration was also observed. During these last runs the
Al cathode was heated several times at 700 °C, which might have enhanced the
chemical reaction between Al and U3+.
Pu
During the first part of the electrorefining (involving the UZr anode), the amount
of Pu in the melt should decrease, since Pu is co-reduced at the cathode and not
balanced by the anodic reaction. A small decrease in Pu concentration (from 0.28
wt% to 0.23 wt%) is actually observed in Fig. 7.
When the anode was replaced by an UPuZr alloy, the anodic dissolution led to an
increase of the concentration of Pu3+. Indeed, the concentration of Pu increased
from 0.3 wt% up to 0.7 wt% between 2000 and 3000 C, which corresponds
approximately to the amount of Pu released by congruent dissolution of the
anode. At the end of the experiment, as the anode material was changed back to
UZr, the concentration of Pu remained roughly stable.
Page 13
13
These measurements show that during the electrorefining, U3+ is mainly reduced
compared to Pu3+. The deposition of U is indeed enhanced by the fact that the
reduction potential of U3+ is more positive (~ 150 mV) than the reduction
potential of Pu3+, and that during a large part of the electrorefining, the cathodic
potential is more positive than – 1.15 V.
Am-Np
As shown in Fig. 8, some Np was co-reduced onto the Al cathode. Indeed, the
Np concentration decreased from 0.12 wt% down to about 0.04 wt%. Am
concentration remained stable during the complete experiment at 0.06 wt%.
According to the Nernst equation, the reduction potential of a dissolved cation in
the melt will shift towards a more negative value when its concentration
decreases. If, as in this experiment, a cathodic cut-off potential is used, the
recovery of Pu, Np and Am will be possible as long as their concentrations are
high enough to allow their reduction onto the cathode. The required
concentration is lower for Np and Pu than for Am as their reduction potentials
onto Al are more positive (see Table 1). This is in agreement with the data
presented in Fig. 7 and Fig. 8, since Np and Pu concentrations slightly decrease
while Am concentration remains stable. It is also in good agreement with the
calculated evolution of the reduction potentials on the aluminium cathode,
plotted in Fig. 9. These potentials were calculated according to Eq. (5), using
standard potentials from Table 1. According to Fig. 9, a slightly more negative
cut-off potential (~ -1.30 V) should be used to extract more Am from the melt. In
Page 14
14
this case, previous experiments have shown that Ln would then be slightly more
co-reduced [18].
4. Conclusions
The maximum An loading of a solid Al cathode has been investigated in constant
current electrorefining experiments in which the cathodic potential was
maintained at a suitable level for separation of An from Ln, i.e. more positive
than –1.25 V vs. Ag/AgCl. The anodic reaction was the dissolution of UZr or
UPuZr alloy and the cathodic reaction was the reduction of An onto Al. With
increased charged passed, i.e. with the build up of a surface layer of An-Al alloy,
the applied current was gradually reduced in order to stay above the cathodic
potential limit.
It was shown that keeping the cathode several days above the molten salt at
elevated temperatures in between runs had a beneficial effect since higher
currents could be used. This is due to the inter diffusion of the elements through
the bulk of the cathode. In addition, melting of the cathode caused
homogenisation of its composition and created a new Al-rich surface for further
alloying, allowing further loading of the cathode.
Near the end of the experiment the cathode was melted several times but without
significant positive effects on the current possible to use. At this stage
approximately 4300 C had been exchanged, representing the reduction of 3.72 g
of actinides in 4.17 g Al. This yields a composition of 44.6 wt% An in Al, which
can be compared to the maximal loading of 68 wt% considering AnAl4 alloys.
Page 15
15
Salt analysis confirmed that the use of a cathodic cut-off potential (-1.25 V vs.
Ag/AgCl) allows to selectively deposit actinides (mainly U) and leave
lanthanides in the salt. However Am was probably not deposited because its
deposition potential at the used concentration (0.06 wt%) was below the cut-off
potential. This effect will be an important issue when aiming at the complete
removal of minor actinides (mostly Am, Cm) dissolved in the salt.
Acknowledgments
The authors wish to thank C. Scheppler for ICP measurements, B. Lynch for
XRF measurements and M. Iizuka for his help with the data acquisition system.
Part of this study was carried out with CEC financial support under the Sixth
Framework Program under Management and Disposal of Radioactive Waste,
Contract FP6-508854 (EUROPART).
References
[1] Actinide and Fission Product Partitioning and Transmutation - Status and Assessment
report, OECD-NEA (1999).
[2] Accelerator Driven Systems (ADS) and Fast Reactors (FR) in Advanced Nuclear Fuel
Cycles - A Comparative study, OECD/NEA (2002).
[3] V.A. Lebedev, Selectivity of liquid metal electrodes in molten halides (title
translated), ISBN 5-229-00962-4 (1993) (in Russian).
[4] O. Conocar, N. Douyere, J.-P. Glatz, J. Lacquement, R. Malmbeck and J. Serp,
Promising Pyrochemical Actinides/Lanthanides Separation Processes using
Aluminium, Nucl. Sci. Eng., 153 (2006) 253.
Page 16
16
[5] O. Conocar, N. Douyere and J. Lacquement, Extraction behavior of actinides and
lanthanides in a molten fluoride/liquid aluminum system, J. Nucl. Mater. 344, 1-3
(2005) 136.
[6] J. Serp, M. Allibert, A. Le Terrier, R. Malmbeck, M. Ougier, J. Rebizant and J.-P.
Glatz, Electroseparation of Actinides from Lanthanides on Solid Aluminum Electrode
in LiCl-KCl Eutectic Melts, J. Electrochem. Soc. 152 (2005) C167.
[7] J. Serp, R. Malmbeck, E. Yakub and J.-P. Glatz, Electroseparation of Actinides on
Solid Aluminium in LiCl-KCl Eutectic, in: Proceedings of GLOBAL 2003, New
Orleans (2003).
[8] T.B. Massalski, H. Okamoto, P.R. Subramanian and L. Kacprzak, Binary Alloy Phase
Diagrams, 2nd ed., ASM International, Ohio (1990).
[9] S. Abousahl, P. van Belle, H. Eberle, H. Ottmar, B. Lynch, P. Vallet, K. Mayer, M.
Ougier, Development of quantitative analytical methods for the control of actinides in
a pyrochemical partitioning process, Radiochim. Acta 93 (2005) 147.
[10] P. Masset, R.J.M. Konings, R. Malmbeck, J. Serp and J.-P. Glatz, Thermochemical
Properties of Lanthanides (Ln=La,Nd) and Actinides (An=U,Np.Pu,Am) in the Molten
LiCl-KCl Eutectic, J. Nucl. Mater. 344 (2005) 173.
[11] J. Serp, P. Chamelot, S. Fourcaudot; R.J.M. Konings, R. Malmbeck, C. Pernel, J.C.
Poignet, J. Rebizant, J.-P. Glatz, Electrochemical behaviour of americium ions in
LiCL-KCL eutectic melt, Electrochim. Acta, 51(19) (2006) 4024.
[12] M. R. R. Bermejo, Adquisición de datos básicos en cloruros fundidos de las tierras
raras (La, Ce, Pr, Nd e Y) presentes en un combustible nuclear simulado, Facultad de
C.C. Químicas. Universidad de Valladolid (2003).
Page 17
17
[13] P. Chiotti, V.V. Akhachinskij, I. Ansara and M.H. Rand, The Chemical
thermodynamics of actinide elements and compounds. Part 5. The actinide binary
alloys, IAEA, Vienna (1981).
[14] J.J. Roy, L.F. Grantham, D.L. Grimmett, S.P. Fusselman, C.L. Krueger, T.S. Storvick,
T. Inoue, Y. Sakamura, N. Takahashi, Thermodynamic Properties of U, Np, Pu and
Am in Molten Lic.-KCl Eutectic and Liquid Cadmium, J. Electrochem. Soc. 143, 8
(1996) 2487.
[15] I. Barin, O. Knacke and O. Kubashewski, Thermochemical properties of inorganic
substances, Springer-Verlag, Berlin (1991).
[16] P. Masset, P.D.W. Bottomley, R.J.M. Konings, R. Malmbeck, A. Rodrigues, J. Serp
and J.-P. Glatz, Electrochemistry of Uranium in Molten LiCl-KCl, J. Electrochem.
Soc. 152, 6 (2005) A1109.
[17] M. Iizuka, K. Kinoshita, T. Koyama, Modelling of anodic dissolution of U-Pu-Zr
ternary alloy in the molten LiCl-KCl electrolyte, J. Phys. Chem. Solids 66 (2005) 427
[18] J. Serp, R. Malmbeck, C. Scheppler and J.-P. Glatz, Electroseparation of actinides
using Al cathodes in LiCl-KCl, in: Proceedings of ATALANTE 2004, Nîmes (2004).
Page 18
18
Figure Captions
Fig. 1. Experimental set-up used in the electrorefining experiments
Fig. 2. Cyclic voltammogram on W and Al wires. Reference electrode:
Ag/AgCl-1 wt%, v=100 mV/s, T = 450 °C. Salt composition in wt%: U – 0.29,
Np – 0.12, Pu – 0.28, Am – 0.06, Zr < 0.07 and Ln - 1.0.
Fig. 3. Cyclic voltammograms on Al wire in LiCl-KCl + 1.39 wt% PuCl3 and in
LiCl-KCl + 0.45 wt% AmCl3. Reference electrode: Ag/AgCl-1 wt%, v=100
mV/s, T = 450 °C.
Fig. 4. Cathodic potential and applied current during the complete experiment.
Fig. 5. U-Al phase diagram [8] Copyright © 1996 by ASM International.
Fig. 6. Al cathode, washed in methanol after the experiment.
Fig. 7. Salt concentration vs. total charge.
Fig. 8. Salt concentration of Np and Am.
Fig. 9. Calculation of the influence of concentration on the reduction potential of
U, Np, Pu, Am and Nd on an aluminium electrode in LiCl-KCl at 450 °C.
Page 19
19
Tables
Table 1
Derived apparent standard potentials of An and Ln on Al
Element 0*
)Al(M/)III(ME V vs. Ag/AgCl (1 wt%)
U -0.89, -0.921 Np -1.02 Pu -1.03, -1.071 Am -1.08 Nd -1.20, -1.282 La -1.282 Y -1.332 Ce -1.242 Pr -1.252
1: calculated potential according to tabulated thermochemical data (see Eq. (9)) 2: experimental data from [11]
Table 2
Initial composition of the electrolyte
Element Initial concentration [wt%] Y 0.04 Ce 0.05 Nd 0.28 Gd 0.61 Zr 0.007 U 1.05 Np 0.12 Pu 0.28 Am 0.06
Page 20
20
Figures
LiClLiCl--KCl KCl + AnCl+ AnCl33++ LnClLnCl33
BiBi Liquid Al Liquid Al
T = 665°C
LiClLiCl--KClKCl+ AnCl+ AnCl33++
LnClLnCl33
BiBi Solid AlSolid Al
Anode
Cathode RefRef
T = 460°C
Fig. 1.
Page 21
21
-150
-100
-50
0
50
100
150
-3.00 -2.50 -2.00 -1.50 -1.00 -0.50 0.00 0.50 1.00 1.50Potential [V vs. Ag/AgCl]
Cur
rent
[mA
]W electrodeAl electrode
U3+ => U
Pu3+ => Pu
Ln3+ => Ln
Li+ => Li
Np3+ => Np Cl- => Cl2
U3+ => UAl4
Pu3+ => PuAl4
Al => Al3+
cut-off potential (-1.25 V)
Fig. 2.
Page 22
22
-0.02
-0.01
0.00
0.01
0.02
0.03
0.04
0.05
-1.50 -1.30 -1.10 -0.90 -0.70 -0.50E [V vs. Ag/AgCl]
Cur
rent
[A
]
EeqPu(III)/Pu(Al)
EeqAm(III)/Am(Al)
LiCl-KCl + PuCl3 (1.39 wt%)
LiCl-KCl + AmCl3 (0.45 wt%)
Fig. 3.
Page 23
23
-1.4
-1.2
-1.0
-0.8
-0.6
0 1000 2000 3000 4000
Charge passed [C]
Pot
entia
l [V
vs. A
g/A
gCl]
-60
-40
-20
0
20
40
60
Cur
rent
[mA
]
* * * *
* : electrode heated at 700°C
cut-off potential
Al saturation
Fig. 4.
Page 26
26
0.0
0.2
0.4
0.6
0.8
1.0
1.2
1.4
0 1000 2000 3000 4000 5000
Total charge [C]
Con
cent
ratio
n in
sal
t pha
se [w
t %]
U
Gd
Pu
Nd
Np
Am
Ce
Y
UZr UPuZr UZr
Fig. 7.
Page 27
27
0.00
0.02
0.04
0.06
0.08
0.10
0.12
0.14
0 1000 2000 3000 4000 5000
Total charge [C]
Con
cent
ratio
n in
sal
t pha
se [w
t %] Np
Am
Fig. 8.
Page 28
28
-1.50
-1.45
-1.40
-1.35
-1.30
-1.25
-1.20
-1.15
-1.10
-1.05
-1.000 0.1 0.2 0.3 0.4 0.5 0.6 0.7 0.8 0.9 1
Concentration in salt [wt%]Po
tent
ial [
V vs
. Ag/
AgC
l] U
Np
Pu
Am
Ndcut-off potential
Fig. 9.