34
H ILLIN 0 S UNIVERSITY OF ILLINOIS AT URBANA-CHAMPAIGN PRODUCTION NOTE University of Illinois at Urbana-Champaign Library Large-scale Digitization Project, 2007.

HILLIN 0 SUNIVERSITY OF ILLINOIS AT URBANA-CHAMPAIGN
PRODUCTION NOTE
University of Illinois atUrbana-Champaign Library
Large-scale Digitization Project, 2007.


UNIVERSITY OF ILLINOIS BULLETINIJSUED WEKLY
VoL XXVII December 31, 1929 No. 18
tEntered as econd-class mattef December 11, 1912, at the post office at Urbana, Illinois, underthe Act of August 24 1912. Acceptance for mailing at the special rate of postage provided
for m section 110, Act of October 3, 117, authorized July 31, 1918.]
INVESTIGATION OF ENDURANCE OFBOND STRENGTH OF VARIOUS CLAYS
IN MOLDING SAND
BT
CARL H. CASBERG
AND
WILLIAM H. SPENCER
BULLETIN No. 200
ENGINEERING EXPERIMENT STATIONPosusan sy w-a UmtJnariYIT or Itwoa, ULsANA
PauP: FPrrie CKTMr

HE Engineering Experiment Statiop was established by actof the Board of Trustees of the University of Illinois on De-cember 8, 1903. It is the purpose of the Station to conduct
investigations and make studies of importance to the engineering,manufacturing, railway, mining, and other industrial interests of theState.
The management of the Engineering Experiment Station is vestedin an Executive Staff composed of the Director and his Assistant, theHeads of the several Departments in the College of Engineering, andthe Professor of Industrial Chemistry. This Staff is responsible forthe establishment of general policies governing the work of the Station,including the approval of material for publication. All members ofthe teaching staff of the College are encouraged to engage in scientificresearch, either directly or in coiperation with the Research Corpscomposed of full-time research assistants, research graduate assistants,and special investigators.
To render the results of its scientific investigations available tothe public, the Engineering Experiment Station publishes and dis-tributes a series of bulletins. Occasionally it publishes circulars oftimely interest, presenting information of importance, compiled fromvarious sources which may not readily be accessible to the clienteleof the Station.
The volume and number at the top of the front cover page aremerely arbitrary numbers and refer to the general publications of the'University. Either above the title or below the seal is given the num-ber of the Engineering Experiment Station bulletin or circular whichshould be used in referring to these publications.
For copies of bulletins or circulars or for other information addressTHE ENGINEERING EXPERIMENT _STATIONX,
UNIVERSITY or IL~INOIS,
URBA, ILLNOIS

UNIVERSITY OF ILLINOISENGINEERING EXPERIMENT STATION
BULLETIN No. 200 DECEMBER, 1929
INVESTIGATION OF ENDURANCE OF BONDSTRENGTH OF VARIOUS CLAYS
IN MOLDING SAND
BY
CARL H. CASBERGMANAGER SHOP LABORATORIES
WILLIAM H. SPENCERSUPERINTENDENT, FOUNDRY LABORATORY
ENGINEERING EXPERIMENT STATIONPUBLISHED BY THE UNIVERSITY OF ILLINOIS, URBANA

UNIVE RSITOF ILLINOIS
6000 711 6511 .. PRESS 11

CONTENTSPAGE
I. INTRODUCTION . . . . . . . . . . . 7
1. Introductory . . . . . . . . . . 72. Acknowledgments . . . . . . . . 7
II. OBJECTS OF INVESTIGATION . . . . . . . . 7
3. Objects . . . . . . . . . . . 7
III. APPARATUS . . . . . . . . . . . . 8
4. Apparatus Used in This Investigation . . . 8
IV. METHODS . . . . . . . . . . . . . 9
5. Methods for Determining Physical and Chemical
Properties of Clays . . . . . . . . 96. Methods Used in Endurance Tests of Bond
Strength of Sands . . . . . . . . 107. Method of Preparing Artificial Molding Sand
Samples . . . . . . . . . . . 118. Details of Test . . . . . . . . . 11
9. Methods for Measuring Comparative Thermal
Conductivity of Molding Sands and Effect of
Heat on Clays and Sands . . . . . . 1210. Permeability Tests . . . . . . . . 13
V. RESULTS OF PHYSICAL AND CHEMICAL TESTS OF CLAY 13
11. Fineness . . . . . ... . . 1312. Ignition Losses . . . . . . . . . 1413. Chemical Analyses . . . . . . . . 1414. Fusion Point Results . . .. . . . 15
15. Acidity and Alkalinity of Clays . . . . . 1616. Colloidal Tests . . . . . . . . . 16
VI. RESULTS OF TESTS FOR ENDURANCE OF BOND STRENGTH IN
MOLDING SANDS . . . . . . . . . . . 17
17. Effect of Repeated Casting on Bond Strength . 1718. Use of Formula . . . . . . . . . 20

4 CONTENTS (CONTINUED)
PAGE
VII. RESULTS OF COMPARATIVE THERMAL CONDUCTIVITY TESTS
ON MOLDING SANDS AND HEAT TESTS OF CLAYS AND SANDS 21
19. Comparative Conductivity Tests on Molding
Sands in Molds . . . . . . . . . 2120. Effect of Heat on the Colloidal Condition of Clay 2221. Effect of Ignition on Molding Sands . . . 23
VIII. PERMEABILITY TEST RESULTS . . . . . . . . 23
22. Results of Permeability Tests . . . . . 23
IX. CONCLUSIONS . . . . . . . . . . . . ,24
23. Conclusions . . . . . . . . . . 24

LIST OF FIGURES
No. PAGE
1. First and Second Pattern . . . . . . . . . . . . . 9
2. Short Sedimentation Tube .. . . . . . . . . . .. . 10
3. Transite Flask for Thermocouple . . . . . . . . . .. 11
4. Results of Endurance Tests . . . . . . . . . . .. 17
5. Relation of Percentage Loss of Bond Strength After Seventh Casting to
Original Bond Strength . . . . .
6. Permeability Factors After Each Casting
. . . . . . 19
. . . . . . . 23
LIST OF TABLES
List of Clays Tested . . . . . .
Fineness of Silica Sand Base . . . .Fineness Tests on Clays . . . .
Results from Ignition of Clays . . .Chemical Analysis of Clays . . . .
Fusion Points of Clays . . . . .Acidity or Alkalinity of Clays . . .
Colloidal Condition of Clays . . . .Percentage Loss in Bond Strength of Sands
10. Ratio of Loss of Bond Strength to Original Bond11. Comparative Conductivity Results on Sand in M
8. . . . . . . 12. . . . . . . 12. . . . . . . 14
. . . . . 14
. . . . . . 15
....... 15. . . . . . 16
. . . . . . 16S . . . . . . 18
Strength . . . . 20lolds . . . . . 21
12. Sedimentation Tests on Clays for Effect of Heat on the Clay
.
.


INVESTIGATION OF ENDURANCE OF BOND STRENGTH OF
VARIOUS CLAYS IN MOLDING SANDS
I. INTRODUCTION
1. Introductory.-Molding sands consist of clay, silica sand, andwater. The clay acts as a bond to hold the grains of sand together, sothat the impression of the pattern in the molding sand will maintainits form or shape until the molten metal poured into the mold hassolidified. The bond strength, or cohesiveness, of the molding sanddepends largely upon the quantity and type of clay present.
In the past few years producers of clays have been marketing claysknown as bonding or rebonding clays. These clays are used to makeartificial molding sands, or to replace the original clay in used sands,whose bond strength has been destroyed by the action of the moltenmetal.
The clays tested in this investigation are listed in Table 1, whichalso gives the sources, and the letters assigned to them in this work.All clays were bought in the open market.
2. Acknowledgments.-This investigation has been part of thework of the Engineering Experiment Station of the University ofIllinois of which DEAN M. S. KETCHUM is director, and of the Depart-ment of Mechanical Engineering of which PROF. A. C. WILLARD ishead.
Acknowledgment is made to Dr. A. I. ANDREWS of the CeramicsDepartment of the University for furnishing information as to fusionpoints on six of the clays tested.
II. OBJECTS OF INVESTIGATION
3. Objects.-This investigation was conducted(a) to determine physical and chemical properties of clays
tested;(b) to compare the various clays for endurance of bond
strength when used as bonds in molding sands under cast-ing conditions;
(c) to determine the thermal conductivity of molding sandsand the effect of heat on clays and molding sands;
(d) to determine the effect of repeated heatings on the permea-bility of molding sands.
7

ILLINOIS ENGINEERING EXPERIMENT STATION
TABLE 1LIST OF CLAYS TESTED
Clay Class of Clay Source Clay Class of Clay Source
A.............. Fire Clay Illinois F............. Ball Clay FloridaB.............. Shale Illinois G............ Fire Clay MissouriC.............. Fire Clay Illinois H. ........... Unknown UnknownD............. Ball Clay Tennessee I............. Unknown ArkansasE............. Ball Clay Kentucky
III. APPARATUS
4. Apparatus Used in This Investigation.-A Ro-tap machine, anda set of U. S. Standard sieves, 40, 70, 100, 140, 200, 270 and pan, wereused for all fineness determinations. Sedimentation rates were de-termined by means of a glass tube, % in. in diameter and 32 in. long,stopped at one end. Ignition losses were determined in an electric muf-fle furnace. The temperatures in this furnace, and wherever else possi-ble, were read with a base metal thermocouple and galvanometer.
Bond strength, permeability, and moisture tests on the moldingsands were made by means of apparatus approved by the AmericanFoundrymen's Association.* Temperatures on molten metal were toohigh to permit the use of a thermocouple and a radiation pyrometerwas used for these readings.
The sands were stored in wide mouth glass bottles having paraffincovered corks. Two rammers were used in making the molds, one aregular floor rammer having a three-inch butt diameter, and the othera wooden rammer % in. in diameter. The flasks were 12 in. sectionsof boiler tubing, having an inside diameter of 3 % in. Two patternswere used, as are shown in Fig. 1.
Sedimentation determinations, after ignition of clays, were madein a glass tube 12 in. long and % in. in inside diameter with a com-bination wooden plug and pedestal on one end and a meter scale be-hind the tube. Figure 2 illustrates this piece of apparatus. Heat-effecttests on molding sands were made in a muffle furnace with porcelaincontainers for the sands. Figure 3 illustrates a transitet container forsmall molds, containing a thermocouple, which was inserted in a muf-fle furnace.
*Standard and Tentatively Adopted Methods of Testing and Grading Foundry Sands,A.F.A., 1928.
tNon-conductive hard asbestos material.

BOND STRENGTH OF CLAYS IN MOLDING SAND
E/i~-zf P7/ter/2
Secor'd P'a7'te/??
FIG. 1. FIRST AND SECOND PATTERN
IV. METHODS
5. Methods for Determining Physical and Chemical Properties of
Clays.-Fineness tests on clays were made by placing 100 grams of
dried clay in the Ro-tap machine and running it for 30 minutes. The
weight of clay retained on each sieve was then determined.This method of testing for fineness was used for determining the
fineness of the clays as it is commonly used in foundry sand testing
laboratories.Ignition losses were determined by heating one gram of dry clay
for 30 minutes at a temperature of 705 deg. C. (1301 deg. F.). Thirty
minutes was arbitrarily chosen because it was thought that clay
in a molding sand would not be subjected to heat for a greater length
of time during the life of the sand.These clays were then cooled in a dessicator and reweighed. The
loss in weight was taken as the ignition loss for the clay. Chemical
analyses of the clays were made by accepted methods* for silicate
minerals.Half-gram samples of the various clays were boiled with 10 c.c.
portions of distilled water for 10 minutes. Four drops of phenol-
phthalin indicator solution were added to each sample and these
samples were then titrated with a one-hundredth normal sodium hy-
droxide or hydrochloric acid solution, as the case required, to establishneutrality. The volume of reagent in cubic centimeters required to
*Scott, "Standard Methods of Chemical Analysis," and Mahin, "Quantitative Analysis,"3rd Edition.
I I

ILLINOIS ENGINEERING EXPERIMENT STATION
FIG. 2. SHORT SEDIMENTATION TUBE
neutralize indicated the apparent degree of alkalinity or acidity of thegiven clay.
Fusion points on these clays were determined by comparison withpyrometric cones, and were furnished by the Ceramics Dept.
Colloidal condition of the clays was determined by mixing 10grams of dry clay with 50 c.c. of distilled water, and placing this mix-ture in a 32-in. sedimentation tube. The time required for the clear-ing of the supernatant liquid was taken as a measure of the colloidalcondition of the clay.
6. Methods Used in Endurance Tests of Bond Strength of Sands.-For the first five sets of castings* a pattern similar to the upper oneshown in Fig. 1 was used, and for the last five sets a pattern similarto the lower one. The first of these patterns gave a large surfacewith a comparatively small volume. The surface area was 64 squareinches, with the sand extending 8 inches up on the pattern whenrammed. The volume of the casting in this case was 14 cubic inches.The round pattern had a surface area of only 50.3 square inchesand a volume of 25.1 cubic inches with the same depth of sand.
There were two reasons for changing the style of pattern at theend of the fifth set of castings. One reason was to compare the bondstrength losses caused by a large-volume, small-surface casting with
*A set of castings means one casting in each sand.

BOND STRENGTH OF CLAYS IN MOLDING SAND
7-----•-----
L- -
5San7/d //7 £tr/2 E Sdd Be/efeet?urnace a/d Th7f/7c o/fp/e
FIG. 3. TRANSITE FLASK FOR THERMOCOUPLE
those caused by a small-volume, large-surface one. The reason forchanging from a sharp-cornered to a round pattern was to secure apattern which could be more easily drawn from the weakened sandswithout breaking up the molds.
7. Methods of Preparing Artificial Molding Sand Samples.-Washed silica sand was used as a base for the samples, and the fine-ness of this sand was determined. The results are given in Table 2.The analysis of this sand was SiO2 , 98.75 per cent, Fe,0 3 , 0.05 percent, and merely traces of Al0 3,, MgO, CaO, and alkalies.
The clays used were designated by letters; these letters were alsoused to designate the sand samples prepared from the respective clays.
Five hundred grams of a given dried clay were weighed out,thoroughly mixed with 200 grams of silica sand, and sufficient distilledwater was added to give a moisture content of seven per cent in thesample. These samples were then assigned the same letters as theclays used for bond in making them. Nine sand samples thus wereprepared, one for each clay.
The molding sands were thoroughly mixed and placed in the humi-dors, and then tempered for 30 days, being mixed by hand five timesduring this period. At the end of this period the samples were testedfor moisture and adjusted to 7 per cent, plus or minus 0.2 per cent.Tempering was then continued for 24 hours longer.
8. Details of Test.-The prepared sand was tested for bondstrength by means of the Bar Strength Test (Doty Method) appara-tus.* Permeability was determined by the A.F.A. standard perme-ability machine* and moisture by drying 100 grams of sand in an
*Standard and Tentatively Adopted Methods of Testing and Grading Foundry Sands,A.F.A., 1928, pp. 6 and 46.
Th"'"""o"p/'l

ILLINOIS ENGINEERING EXPERIMENT STATION
TABLE 2
FINENESS OF SILICA SAND BASE
Grams Remaining e N Grams RemainingSieve Number on Sieve Sieve Number on Sieve
40................... 5.2 200.................. . 2.170.................... 63.9 270................... . 0.2100.................. . 21.1 Pan.................. 0.2140.................. 7.2
electric oven for one hour at a temperature of 105 deg. C. and notingthe loss in weight. Then one of the flasks was set upright on a gal-vanized iron plate, and some of sample A placed in it, and rammedwith a hand rammer to give a %-in. sand bottom to the flask. Thepattern was placed upright on this bottom sand directly in the centerof the flask. The remainder of the sample was poured in aroundthe pattern, and the flask, containing the pattern and sand, was raiseda height of 4 inches and dropped. This jolting was repeated fifteentimes. The sand was then packed evenly across the top and aroundthe pattern with the small wooden rammer, and the pattern was rap-ped slightly and drawn. This completed the mold for Sample A. Othersamples were treated in a similar manner.
As soon as possible after completion, the mold was poured withmolten gray iron. The temperature of the metal when poured wasapproximately the same for each mold in a set. The casting was al-lowed to stand for 24 hours in the sand, then removed and cleaned.The sand was carefully removed from the casting and mixed withthe remainder of the sample. Each batch of sand was carefullysaved and mixed with sufficient distilled water to bring the moistureback to 7 per cent. After tempering 24 hours, bond strength, perme-ability and moisture determinations were again made on the sample,and the sand was rammed up again and the casting test repeated. Thisprocess was repeated until the bond strength of the sand became 75*or less on the majority of the sands.
9. Methods for Measuring Comparative Thermal Conductivity ofMolding Sands and Effect of Heat on Clays and Sands.-The com-parative thermal conductivities of the molding sands were obtained byinserting a thermocouple into a %-in. hole, 3 in. deep, in the top ofthe mold, % in. from the cavity into which the metal was poured inthe endurance tests. Observations of temperature were made on the
*Standard and Tentatively Adopted Method of Testing and Grading Foundry Sands (DotyMethod), pp. 6 and 46.

BOND STRENGTH OF CLAYS IN MOLDING SAND
metal before it was poured, and after pouring the temperature of thesand was noted at five-minute intervals until a maximum tempera-ture was reached. The time required to reach this maximum temper-ature was recorded.
In a second test a thermocouple was rammed up in molding sand,using a transite box for a flask. The box, containing the thermocouplewith % in. of rammed Sand A covering it at the point of minimumsand thickness, was placed in a muffle furnace having a temperatureof 1600 deg. F. (871 deg. C.). The flask of sand remained in thefurnace two hours, the temperature indicated by the thermocouple wasrecorded, the box removed, and the temperature of the furnace re-corded.
Heat effects on the clays used in this investigation were determinedby a second series of sedimentation tests. Half-gram samples of dryclays were mixed with 25 c.c. of distilled water and placed in a glasstube 12 in. long and %• in. in inside diameter, stoppered at the lowerend. The amounts of sediment at the end of one-minute and two-minute periods were read on a meter stick placed behind the tube.Fifteen minutes after the mixture was placed in the tube the clear-ness of the supernatant liquid was observed. The clay was permittedto settle and its total volume read on the meter stick. The volumesettling in one-minute and two-minute intervals was then calculatedas a percentage of the total volume, and recorded. The same testswere made on clays after ignition.
Additional tests were made by igniting samples of molding sandunder the same conditions as the clays were ignited and testing thesand for bond strength. These molding sand specimens were spreadout in thin layers so that the heat reached all parts of the sample.
10. Permeability Tests.-Permeability factors were determined onthe sands after each set of castings in the endurance tests. These testswere run in conjunction with the bond strength tests.
V. RESULTS OF PHYSICAL AND CHEMICAL TESTS OF CLAY
11. Fineness.-Table 3 gives the results of fineness tests. Theseresults may be misinterpreted unless remarks in this table are noted.Those marked "clean grains" gave the true fineness of the clay;"aggregates" indicated that fine particles formed lumps and remainedon the coarse screens, but these lumps could be crushed between thefingers, and showed much finer grains than indicated in the test.

ILLINOIS ENGINEERING EXPERIMENT STATION
TABLE 3FINENESS TESTS ON CLAYS
Clean grainsAggregatesSlightly aggregatedAggregatesPink and blue aggre-
gatesAdhered to No. 200
and No. 270Fairly clean grainsClean grainsAdhered slightly to
sieves
Clay
A ... ..............B .......... ..C .............. ...D . . .. ... .............E ...... .. ... . . .. .. . .. .F .... . . . . .. . . . . . . . . . . .G . . . .. . . .. .. . .. . . . .. .H ...................I ....................
Loss of Weight onIgnitionper cent
9.157.19
12.4412.2911.9814.5714. 1.
8.585.33
Color after Ignition
Pinkish CreamChocolateWhiteWhitePale PinkWhiteLight ChocolatePinkish CreamCream
From' Table 3 it is evident that Clay I was extremely fine, fol-lowed by Clays A, H,. C and F in order of increasing coarseness;Clay G was the coarsest. The true fineness of the other clays wasmore or less doubtful. Six clays were shown to have widely varieddegrees of fineness.
12. Ignition Losses.-Table 4 gives the loss of weight on ignition,the moisture content of the clays exposed to similar atmospheric con-ditions, and the color of the clays after ignition. These same colorswere evident in the burned molding sands, and show a close relationto the iron content of the clays as given in Table 5, the darkercolors being associated with the higher iron percentages.
13. Chemical Analyses.-Table 5 gives the partial analysis of theclays used in this investigation. Only the elements commonly ac-
Grams Remaining on Screen Number
Clay
A .......B ........C ........D ... ..E ........
F ........
G. ......H .......I . . . . . . . .
40 70
1.9 8.062.4 10.04.2 13.7
22.1 24.039.8 23.8
5.7 33.4
50.6 20.24.5 16.00.0 0.4
100
6.53.5
10.17.06.1
11.7
6.47.60.9
200
14.63.1
12.911.97.1
13.5
5.59.5
14.9
TABLE 4
RESULTS FROM IGNITION OF CLAYS
MoisturePercentage
1.50.52.04.51.21.01.61.8
16.3

BOND STRENGTH OF CLAYS IN MOLDING SAND
TABLE 5
CHEMICAL ANALYSIS OF CLAYS
Content, per cent
Clay
SiU2 Fe20U3
A........... 61.16 2.71B........... 56.48 3.53C........... 52.82 0.63D.......... 51.14 0.15E........... 50.80 0.48F........... 50.74 0.670 ........... 44.66 2.23H.......... 56.52 2.23I........... 61.54 1.28
AIU23 MgO CaU Na2U0+K2O
21.17 0.48 0.95 1.0723.03 0.98 1.10 1.6533.31 0.14 0.98 0.1731.53 0.26 0.92 1.8031.84 0.13 1.39 1.3245.05 0.09 0.56 0.7331.19 1.36 1.06 0.8724.65 0.49 0.67 1.2123.54 0.37 1.18 3.25
TABLE 6
FUSION POINTS OF CLAYS
Degrees F.*
327330923092
*Temperatures corresponding to Standard Orton Cones.
cepted as of importance in clays were determined in these tests. Allresults are reported as oxides. Using this method it is evident thatthe total percentages given for a clay will not be equal to 100 percent. The greatest value of this table lies in the fact that it showsthe clays used in this investigation to have had a wide range of chemi-cal content. The table shows that the silica content of the claysvaried from 44.66 per cent to 61.16 per cent; the.alumina content,from 21.17 per cent to 45.05 per cent; iron, calculated as oxide, from0.15 per cent to 3.53 per cent; total fluxes, exclusive of iron oxide,from 1.29 per cent to 4.80 per cent.
14. Fusion Point Results.-While the table of fusion points, Table6, does not include all the clays, it shows that one of the clays fusedat as low a temperature as the fusion point of cone 11, or approxi-mately 2420 deg. F., which is below the temperature of the moltenmetal used in this investigation, and one of the clays did not fuseuntil the temperature of the fusion point of cone 33, or 3270 deg.F. was reached. The equivalent deg. F. for the fusing points of the

ILLINOIS ENGINEERING EXPERIMENT STATION
TABLE 7ACIDITY OR ALKALINITY OF CLAYS
Bond Strength LossClay Number of cc. Number of e.c. after first casting
Alkali Required Acid Required per cent
F ..................... 0.7 50.4E.................... 0.8 30.2C..................... 1.5 20.0I..................... 0.8 10.8H .................... 3.5 4.8A ..................... 2.3 3.7G ..................... 4.9 3.0B ..................... Neutral 0.0
TABLE 8
COLLOIDAL CONDITION OF CLAYS
Clay Remarks
G. ....................... Entirely clear at end of 117 hours
D....................... Supernatant liquid opalescent at end of 11 weeks
I........................ Supernatant liquid opaque at end of 11 weeks
pyrometric cones was calculated on the basis of a heat increase of 150deg. C. per hour on the cones.
15. Acidity and Alkalinity of Clays.-Table 7 shows the resultsof tests for free acid or alkali in the clays. This table is arrangedin inverse order of bond strength loss after first casting (see Fig. 4),which is in direct ratio to resistance to first heat. The fact that thistable shows that increased acidity or alkalinity of the clay, exceptin the case of Clay B, is associated with increased resistance to pri-mary heating is to be noted.
16. Colloidal Tests.-Table 8 gives the results of sedimentationtests on three different typical clays. Clay G was a fire clay; ClayD a ball clay; and Clay I, unknown. Clay G is here shown to havesettled out much more rapidly than the other clays and to have beenthe least colloidal in character. Clay I approached a colloidal gel,and Clay D was intermediate in character. The greatest value ofthis test was to show the wide range of properties possessed by theclays tested in this investigation.

BOND STRENGTH OF CLAYS IN MOLDING SAND
0 ' 4 6 8 /0Se0s of Ca7s/;1g-s ardae
FIG. 4. RESULTS OF ENDURANCE TESTS
VI. RESULTS OF TESTS FOR ENDURANCE OF BOND STRENGTH
IN MOLDING SANDS
17. Effect of Repeated Casting on Bond Strength.-The resultsof the bond strength endurance test can be most effectively shown ascurves, and results calculated from the observed data are presentedin this manner in Fig. 4.
The temperatures recorded at the top of the graph were those ob-served on the molten metal when poured into the molds. The tem-

ILLINOIS ENGINEERING EXPERIMENT STATION
TABLE 9
PERCENTAGE Loss IN BOND STRENGTH OF SANDS(After seven sets of castings)
Loss in BondSand Strength
per cent
B .. .. ................. .1 12 .5H .................... . 24 .2G.................... .. 28.3A........................ 34.9D ................ ...... . 47.0E .... ............... . 59 .6I ................ . . .. 65.4C .... .................. 68 .1F ............. ......... . 73.9
Original BondStrength
88*103
99132234228304245288
Name of BondingClay
ShaleUnknownFire ClayFire ClayBall ClayBall ClayUnknownFire ClayBall Clay
*Original bond strength for sand made from powdered Clay B was 135.
perature readings were inserted here for the purpose of comparison,but they do not seem to have any material effect on the loss of bondstrength. This was to be expected, for when a mold is open on topit soon cools 300 deg. F., and 300 deg. F. in a total of 2500 deg. F.constitutes a relatively small percentage and therefore has a relativelysmall effect on the result.
Sand D was very irregular in bond strength, due, no doubt, tothe fact that cleavage planes opened in the bond strength test bars,and made true values extremely difficult to obtain in this test.
The change in pattern, on the whole, decreased the bond strengthmore rapidly. This seemed to indicate that a heavy casting destroyedthe bond strength more rapidly than a light one with larger surfaceexposed to the sand, probably due to the fact that the larger volumeof iron contained more heat.
The bond strengths of two of the sands were so low after theseventh set of castings that further testing was discontinued on them,and it was deemed best to consider this heat as the end of the seriesfor determining comparative results.
Table 9 gives the loss of bond strength on heating the sands seventimes, the original strength, and the name of the bonding clay. Sandsare arranged in order of endurance of bond strength. From this tableit is apparent that the type of clay used as bond, the original bondstrength, and the percentage loss in bond strength are related. Thetype of clay, however, is important only in so far as it determines theoriginal bond strength. The percentage loss in bond strength, or thelack of endurance of the clay as a bond, apparently depends on theoriginal bond strength.
BOND STRENGTH OF CLAYS IN MOLDING SAND
?r7/gi7a/ 8oa'd Sfrezg7
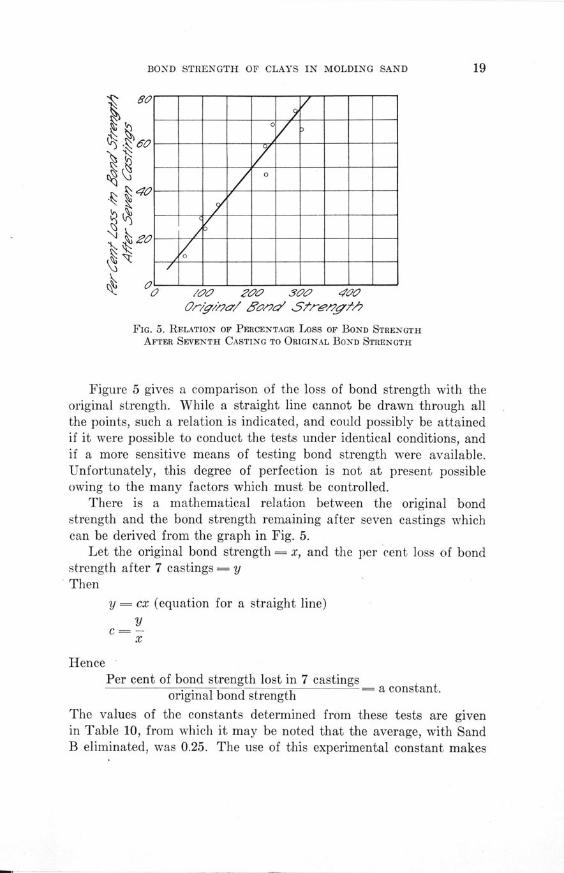
FIG. 5. RELATION OF PERCENTAGE LOSS OF BOND STRENGTHAFTER SEVENTH CASTING TO ORIGINAL BOND STRENGTH
Figure 5 gives a comparison of the loss of bond strength with theoriginal strength. While a straight line cannot be drawn through allthe points, such a relation is indicated, and could possibly be attainedif it were possible to conduct the tests under identical conditions, andif a more sensitive means of testing bond strength were available.Unfortunately, this degree of perfection is not at present possibleowing to the many factors which must be controlled.
There is a mathematical relation between the original bondstrength and the bond strength remaining after seven castings whichcan be derived from the graph in Fig. 5.
Let the original bond strength = x, and the per cent loss of bondstrength after 7 castings = yThen
y = cx (equation for a straight line)y
c-x
HencePer cent of bond strength lost in 7 castings = a constant.
original bond strength
The values of the constants determined from these tests are givenin Table 10, from which it may be noted that the average, with SandB eliminated, was 0.25. The use of this experimental constant makes

ILLINOIS ENGINEERING EXPERIMENT STATION
TABLE 10
RATIO OF LOSS OF BOND STRENGTH TO ORIGINAL BOND STRENGTH
Sand Ratio Sand Ratio
A .................... 0.264 F .................... 0.257B .................... 0.141 G .................... - 0.286C .................... 0.278 H ................... 0.235D................... 0.200 I.................... 0.215E .................... 0.261
Average ratio (eliminating Sand B) 0.250
it possible to predict the probable loss in bond strength after the 7thcasting if the original bond strength of a given sand is known.
Since the value of Sand B, as expressed in Table 10, was de-cidedly low, additional work was done on this sample. Clay B,having many aggregates, was reduced to a powder in a mortar andtriturated wet. After drying out, a new sample B was prepared withthe powdered Clay B. Bond strength on this new sample was 135,as compared with 88 on the original sample. In order to determine ifthe same results could be obtained with the other clays, sample Cwas treated in the same manner as sample B. The powdered Clay Cgave a bond strength of 242, a very good check on the original 245.
It was concluded that Clay B was not all distributed throughoutthe sand when added as lumps and was only broken up and well mixedafter the sand had been used several times, so the original bondstrength of 88 was not representative. This latent bond strength ex-plains also why coarse clays are sometimes believed more enduringthan fine clays.
18. Use of Formula.--By the use of this formula the bond strengthof any clay in a used molding sand under given conditions may becalculated without the use of endurance tests. If the original bondstrengths of two clays under identical conditions are determined andthe residual bond strength of one after certain usage is known thebond strength of the second clay after the same usage may be cal-culated.
For example, a Clay m and a Clay n have been tested undeir identi-cal conditions and found to have the following bond strengths in mold-ing sands, Clay m 205 and Clay n 150. If sand made with Clay n afteruse in making ten tons of castings has a bond strength of 100, thebond strength of a molding sand made with Clay m, with the sameproportion of clay and the same moisture content, used under identical

BOND STRENGTH OF CLAYS IN MOLDING SAND
TABLE 11
COMPARATIVE .CONDUCTIVITY RESULTS ON SAND IN MOLDS
Maximum Temperature of metal Time required totemperature of sand when poured reach maximum tem-
Sand % in. from casting perature
dg. F. deg. F. min.deg. F.
A................... 500 2800 25B.................... 520 2800 24D.................... 520 2750 26E.................... 560 2750 25F.................... 550 2700 25G ................... 540 2750 24
shop conditions to make 10 tons of the same class of castings, canbe calculated.
Clay n lost 150 - 100 = 5050
and 150- X 100 = 33.33 per cent of bond strength lost.
33.33 -- 0.22 = constant for the given conditions.150
Now, for Clay m, we have0.22 per cent of bond strength lost
0.22 =205
45.1 = per cent bond strength lost.205 X 0.451 = 92.46 bond strength lost.205 - 92.5 = 112.5 = bond strength which will remain in molding
sand made with Clay m and subjected to same treatment as thatwhich left bond strength of 100 in molding sand bonded with Clay n.
The fact that this result was not obtained in previous investiga-tions of endurance of bond strength in molding sands is no doubtdue to the fact that these investigations were not conducted underlike conditions as to (a) clay content in the sand, (b) moisture con-tent, (c) ramming conditions, (d) temperature of metal poured, (e)base sand, (f) mixing of sands, (g) volume of casting, and (h) cool-ing time of casting in sand.
VII. RESULTS OF COMPARATIVE THERMAL CONDUCTIVITY TESTS ON
MOLDING SANDS AND HEAT TESTS OF CLAYS AND SANDS
19. Comparative Conductivity Tests on Molding Sands in Molds.-Measurements of maximum temperatures reached in molds % in. fromcastings made on upper pattern shown in Fig. 1 are given in Table 11.These maximum temperatures were in agreement as well as could beexpected when it was considered that as much as one sixteenth of an

ILLINOIS ENGINEERING EXPERIMENT STATION
TABLE 12SEDIMENTATION TESTS ON CLAYS FOR EFFECT OF HEAT ON THE CLAY
Before Ignition -After Ignition
Clay Per Cent Settled In Per Cent Settled In
1 min. 2 min. 1 min. 2 min.
A...................... 36.0 44.0 69.2 76.9B...................... 32.0 36.0 69.2 76.9C...................... 42.3 65.4 71.4 85.7D ...................... 23.1 34.6 63.5 76.4E..................... 75.9 89.7 85.7 92.8F...................... 44.8 82.8 77.8 88.9G...................... 50.0 72.7 80.0 90.0H ...................... 40.0 65.0 70.0 80.0I...................... 0.0 0.0 65.0 75.0
inch variations, caused by crumbling of the sand, occurred in thethickness of the sand between the thermocouple and the casting. Theresults in this table indicate that all the sands tested had approximate-ly the same amount of heat transferred to them by conduction. Thesand temperatures were very much less than the casting temperature,and the maxima were reached in approximately the same space oftime.
The result of the test in which a thermocouple was rammed up inmolding sand and inserted in a hot muffle furnace can be summarizedas follows:Sand A covered thermocouple to a depth of 5/% inch.Temperature of furnace at start of test= 1600 deg. F. (871 deg. C.).Length of time sand remained in furnace = 2.hours.Temperature of sand at end of test - 1300 deg. F. (705 deg. C.).Temperature of furnace at end of test 1700 deg. F. (927 deg. C.).
These results indicate that heat is transferred through a mold veryslowly.
20. Effect of Heat on the Colloidal Condition of Clay.-The per-centages of clay settled during periods of one minute and two minutesbefore and after ignition of the clay are shown in Table 12. It isshown in this table that the clays before ignition had a great rangeof sedimentation rates; from 0.0 per cent to 75.9 per cent of the totalvolume of the clays was settled in one minute. After ignition the sedi-mentation rate was increased on all clays, and tended toward a uni-form rate, as shown by the rates for one minute percentages afterignition, where the range was only from 64 per cent to 86 per cent,with an average of 72.4 per cent.

BOND STRENGTH OF CLAYS IN MOLDING SAND
.SeAI of CosTf//g2s /,7aC7
FIG. 6. PERMEABILITY FACTORS AFTER EACH CASTING
21. Effect of Ignition on Molding Sands.-The ignited moldingsands did not have sufficient bond strength remaining to allow of themaking of bond strength tests. This showed that molding sand, wherethe heat reached all parts, lost practically all of its bond strength in30 minutes at 1300 deg F. (705 deg. C.), regardless of the type of clayused as bond.
VIII. PERMEABILITY TEST RESULTS
22. Results of Permeability Tests.-The graphs in Fig. 6 give thepermeability changes in the molding sands caused by each set of cast-ings. The ordinates represent permeability factors and the abscissasthe number of castings made in the sand previous to the determination.
The most noticeable feature of these graphs was the rise in permea-bility after the first casting. This was probably due in part to vitrifi-cation, and small lumps or balls present after the first heat. The

ILLINOIS ENGINEERING EXPERIMENT STATION
lumping here was probably due to fusing of low melting elements and-organic compounds in the clay, which broke up and were scatteredthrough the sand on additional heating. Otherwise the curves closelyresemble each other in general shape.
The increase in the permeability factor as the bond strength wasdestroyed was the second most notable feature of these curves. Thefact that this same condition is not encountered in the foundry, thereverse being true, the permeability factor decreasing on used sands,is due no doubt to the fact that finely powdered facings are used inthe foundry, and the accumulation of the fine material closes the open-ings between the sand grains. No facings were used in these tests.
IX. CONCLUSIONS
23. Conclusions.-This investigation included a variety of claysand the results obtained should be applicable to the types of clays nowbeing used for bonding or rebonding molding sands. The followingare the principal conclusions:
(1) Abnormal bond strength losses on first heating are relatedto the alkaline or acidic condition of the clays. These losses, how-ever, adjust themselves to normal conditions on additional heat-ing.
(2) The endurance of bond strength in a molding sand isdependent on the original bond strength of the clay.
(3) The physical and chemical properties of the clay haveno appreciable effect on the endurance of the bond strength be-yond their effect on the original bond strength.
(4) The type of clay affects the original bond strength butdoes not, in any other way, influence the endurance of bondstrength. This is true only when all factors, except the type ofclay, are identical in the composition and the testing of the mold-ing sand.
(5) The endurance of bond strength of a molding sand withany given clay may be calculated, if the endurance under thesame conditions of the molding sand bonded with another clayis known, for
percentage loss of bond strength a constant for any given setoriginal bond strength of conditions.
(6) The sand conducts heat very slowly, and only a smallshell or envelope of sand in contact with the casting has its bondstrength destroyed by the heat. This shell is approximately the

BOND STRENGTH OF CLAYS IN MOLDING SAND 25
same thickness for any sand, providing the type of clay used asbond is the only variable. This being the case, the loss of bondstrength of the sands under these conditions is dependent only onthe original bond strength of the clay.
(7) Molding sands lose practically all of their bond strengthwhen exposed to temperatures well below the melting point of themetals cast in them. The reason the sand is not rendered uselessby one casting is the fact that the intense heat is not conductedthrough the sand to any great extent.
(8) In the absence of facing materials the permeability of amolding sand increases as the clay bond is destroyed.
(9) The first heating of the sands causes vitrification and theforming of lumps, which are subsequently broken up and scat-tered throughout the sand.


RECENT PUBLICATIONS OFTHE ENGINEERING'EXPERIMENT STATION t
*Bulletin No. 154. An Investigation of the Translucency of Porcelains, by C. W.Parmelee and P. W. Ketchum. 1926. Fifteen cents.
Bulletin No. 155. The Cause and Prevention of Embrittlement of Boiler Plate,by S. W. Parr and F. G. Straub. 1926. Thirty-five cents.
Bulletin No. 156. Tests of the Fatigue Strength of Cast Steel, by H. F. Moore.1926. Ten cents.
Bulletin No. 157. An Investigation of the Mechanism of Explosive Reactions,by C. Z. Rosecrans. 1926. Thirty-five cents.
Circular No. 13. The Density of Carbon Dioxide with a Table of RecalculatedValues, by S. W. Parr and W. R. King, Jr. 1926. Fifteen cents.
Circular No. 14. The Measurement of the Permeability of Ceramic Bodies, byP. W. Ketchum, A. E. R. Westman, and R. K. Hursh. 1926. Fifteen cents.
Bulletin No. 158. The Measurement of Air Quantities and Energy Losses inMine Entries, by Alfred C. Callen and Cloyde M. Smith. 1927. Forty-five cents.
Bulletin No. 159. An Investigation of Twist Drills. Part II, by B. W. Benedictand A. E. Hershey. 1926. Forty cents.
Bulletin No. 160. A Thermodynamic Analysis of Internal Combustion EngineCycles, by G. A. Goodenough and J. B. Baker. 1927. Forty cents.
Bulletin No. 161. Short Wave Transmitters and Methods of Tuning, by J. T.Tykociner. 1927. Thirty-five cents.
Bulletin No. 162. Tests on the Bearing Value of Large Rollers, by W. M. Wil-son. 1927. Forty cents.
Bulletin No. 163. A Study of Hard Finish Gypsum Plasters, by Thomas N.McVay. 1927. Thirty cents.
Circular No. 15. The Warm-Air Heating Research Residence in Zero Weather,by Vincent S. Day. 1927. None Available.
Bulletin No. 164. Tests of the Fatigue Strength of Cast Iron, by H. F. Moore,S. W. Lyon, and N. P. Inglis. 1927. Thirty cents.
Bulletin No. 165. A Study of Fatigue Cracks in Car Axles, by H. F. Moore.1927. Fifteen cents.
Bulletin No. 166. Investigation of Web Stresses in Reinforced Concrete Beams,by F. E. Richart. 1927. Sixty cents.
Bulletin No. 167. Freight Train Curve-Resistance on a One-Degree Curve anda Three-Degree Curve, by Edward C. Schmidt. 1927. Twenty-five cents.
Bulletin No. 168. Heat Transmission Through Boiler Tubes, by Huber O.Croft. 1927. Thirty cents.
Bulletin No. 169. Effect of Enclosures on Direct Steam Radiator Performance,by Maurice K. Fahnestock. 1927. Twenty cents.
Bulletin No. 170. The Measurement of Air Quantities and Energy Losses inMine Entries. Part II, by Alfred C. Callen and Cloyde M. Smith. 1927. Forty-five cents.
Bulletin No. 171. Heat Transfer in Ammonia Condensers, by Alonzo P. Kratz,Horace J. Macintire, and Richard E. Gould. 1927. Thirty-five cents.
Bulletin No. 172. The Absorption of Sound by Materials, by Floyd R. Watson.1927. Twenty cents.
*Bulletin No. 173. The Surface Tension of Molten Metals, by Earl E. Libman.1928. Thirty cents.
*Circular No. 16. A Simple Method of Determining Stress in Curved FlexuralMembers, by Benjamin J. Wilson and John F. Quereau. 1928. Fifteen cents.
Bulletin No. 174. The Effect of Climatic Changes upon a Multiple-Span Re-inforced Concrete Arch Bridge, by Wilbur M. Wilson. 1928. Forty cents.
Bulletin No. 175. An Investigation of Web Stresses in Reinforced ConcreteBeams. Part II. Restrained Beams, by Frank E. Richart and Louis J. Larson.1928. Forty-five cents.
tCopies of the complete list of publications can be obtained without charge by addressing theEngineering Experiment Station, Urbana, Ill.
*A limited number of copies of the bulletins starred are available for free distribution.
27

ILLINOIS ENGINEERING EXPERIMENT STATION
Bulletin No. 176. A Metallographic Study of the Path of Fatigue Failure inCopper, by Herbert F. Moore and Frank C. Howard. 1928. Twenty cents.
Bulletin No. 177. Embrittlement of Boiler Plate, by Samuel W. Parr and Fred-erick G. Straub. 1928. None available.
*Bulletin No. 178. Tests on the Hydraulics and Pneumatics of House Plumb-ing. Part II, by Harold E. Babbitt. 1928. Thirty-five cents.
Bulletin No. 179. An Investigation of Checkerbrick for Carbureters of Water-gas Machines, by C. W. Parmelee, A. E. R. Westman, and W. H. Pfeiffer. 1928. Fiftycents.
Bulletin No. 180. The Classification of Coal, by Samuel W. Parr. 1928. Thirty-five cents.
Bulletin No. 181. The Thermal Expansion of Fireclay Bricks, by Albert E. R.Westman. 1928. Twenty cents.
*Bulletin No. 182. Flow of Brine in Pipes, by Richard E. Gould and Marion I.Levy. 1928. Fifteen cents.
Circular No. 17. A Laboratory Furnace for Testing Resistance of Firebrick toSlag Erosion, by Ralph K. Hursh and Chester E. Grigsby. 1928. Fifteen cents.
*Bulletin No. 183. Tests of the Fatigue Strength of Steam Turbine Blade Shapes,by Herbert F. Moore, Stuart W. Lyon, and Norville J. Alleman. 1928. Twenty-five cents.
*Bulletin No. 184. The Measurement of Air Quantities and Energy Losses inMine Entries. Part III, by Alfred C. Callen and Cloyde M. Smith. 1928. Thirty-five cents.
*Bulletin No. 185. A Study of the Failure of Concrete Under Combined Com-pressive Stresses, by Frank E. Richart, Anton Brandtzaeg, and Rex L. Brown. 1928.Fifty-five cents.
*Bulletin No. 186. Heat Transfer in Ammonia Condensers. Part II, by AlonzoP. Kratz, Horace J. Macintire, and Richard E. Gould. 1928. Twenty cents.
*Bulletin No. 187. The Surface Tension of Molten Metals. Part II, by Earl E.Libman. 1928. Fifteen cents.
*Bulletin No. 188. Investigation of Warm-Air Furnaces and Heating Systems.Part III, by Arthur C. Willard, Alonzo P. Kratz, and Vincent S. Day. 1928. Forty-five cents.
*Bulletin No. 189. Investigation of Warm-Air Furnaces and Heating Systems.Part IV, by Arthur C. Willard, Alonzo P. Kratz, and Vincent S. Day. 1929. Sixtycents.
*Bulletin No. 190. The Failure of Plain and Spirally Reinforced Concrete inCompression, by Frank E. Richart, Anton Brandtzaeg, and Rex L. Brown. 1929.Forty cents.
Bulletin No. 191. Rolling Tests of Plates, by Wilbur M. Wilson. 1929. Thirtycents.
*Bulletin No. 199. Investigation of Heating Rooms with Direct Steam RadiatorsEquipped with Enclosures and Shields, by Arthur C. Willard, Alonzo P. Kratz,Maurice K. Fahnestock, and Seichi Konzo. 1929. Forty cents.
*Bulletin No. 193. An X-Ray Study of Firebrick, by Albert E. R. Westman.1929. Fifteen cents.
*Bulletin No. 194. Tuning of Oscillating Circuits by Plate Current Variations,by J. Tykocinski-Tykociner and Ralph W. Armstrong. 1929. Twenty-five cents.
Bulletin No. 195. The Plaster-Model Method of Determining Stresses Appliedto Curved Beams, by Fred B. Seely and Richard V. James. 1929. Twenty cents.
*Bulletin No. 196. An Investigation of the Friability of Different Coals, by CloydeM. Smith. 1929. Thirty cents.
*Circular No. 18. The Construction, Rehabilitation, and Maintenance of GravelRoads Suitable for Moderate Traffic, by Carroll C. Wiley. 1929. Thirty cents.
*Bulletin No. 197. A Study of Fatigue Cracks in Car Axles, Part II, by HerbertF. Moore, Stuart W. Lyon, and Norville J. Alleman. 1929. Twenty cents.
*Bulletin No. 198. Results of Tests on Sewage Treatment, by Harold E. Babbittand Harry E. Schlenz. 1929. Fifty-five cents.
*Bulletin No. 199. The Measurement of Air Quantities and Energy Losses inMine Entries, Part IV, by Cloyde M. Smith. 1929. Thirty-cents.
*Bulletin No. 200. Investigation of Endurance of Bond Strength of Various Claysin Molding Sand, by Carl H. Casberg and William H. Spencer. 1929. Fifteen cents.
*A limited number of copies of the bulletins starred are available for free distribution.

THE UNIVERSITY OF ILLINOISTHE STATE UNIVERSITY
UrbanaDAVID KINLEY, Ph.D., LL.D., President
THE UNIVERSITY INCLUDES THE FOLLOWING DEPARTMENTS:
The Graduate School
The College of Liberal Arts and Sciences (Curricula: General with majors, inthe Humanities and the Sciences; Chemistry and Chemical Engineering;Pre-legal, Pre-medical, and Pre-dental; Pre-journalism,a Home Economics,Economic Entomology, and Applied Optics)
The College of Commerce and Business Administration (Curricula: GeneralBusiness, Banking and Finance, Insurance, Accountancy, Railway Adminis-tration, Railway Transportation, Industrial Administration, Foreign Com-merce, Commercial Teachers, Trade and Civic Secretarial Service, PublicUtilities, Commerce and Law)
The College of Engineering (Curricula: Architecture, Ceramics; Architectural,Ceramic, Civil, Electrical, Gas, General, Mechanical, Mining, and RailwayEngineering; Engineering Physics)
The College of Agriculture (Curricula: General Agriculture; Floriculture; HomeEconomics; Landscape Architecture; Smith-Hughes-in conjunction with theCollege of Education)
The College of Education (Curricula: Two year, prescribing junior standing foradmission -General Education, Smith-Hughes Agriculture, Smith-HyghesHome Economics, Public School Music; Four year, admitting from the highschool-Industrial Education, Athletic Coaching, Physical Education. TheUniversity High School is the practice school of the College of Education)
The School ot Music (four-year curriculum)
The College of Law (three-year curriculum based on two years of college work.For requirements after January 1, 1929, address the Registrar)
The Library School (two-year curriculum for college graduates)
The School of Journalism (two-year curriculum based on two years of collegework)
The College of Medicine (in Chicago)
The College of Dentistry (in Chicago)
The School of Pharmacy (in Chicago)
The Summer Session ~eight weeks)
Experiment Stations and Scientific Bureaus: U. S. Agricultural ExperimentStation; Engineering Experiment Station; State Natural History Survey;State Water Survey; State Geological Survey; Bureau of EducationalResearch.
The Library collections contain (June 1, 1928) 760,000 volumes and 175,000pamphlets.
For catalogs and information addressTHE REGISTRAR
Urbana, Illinois

I:
1:
..·
r·
hr- \·
; ·i · .··, . · ~~:
--
i;- ;; · : '' ·i i:-
;;i
:;~-:=.~ ;~;.:::- .I·:: ~:::: : -- .::.
i- .I: i~· i ,--i"
\i;


