Engineering, 2017, 9, 599-624 http://www.scirp.org/journal/eng ISSN Online: 1947-394X ISSN Print: 1947-3931 DOI: 10.4236/eng.2017.97038 July 19, 2017 Investigation of Excavator Performance Factors in an Open-Pit Mine Using Loading Cycle Time Samwel Victor Manyele Abstract Keywords
Investigation of Excavator Performance Factors in an Open-Pit Mine Using Loading Cycle Time
Samwel Victor Manyele
Department of Chemical and Mining Engineering, College of Engineering and Technology, University of Dar es Salaam, Dar es Salaam, Tanzania
Abstract This study presents the effect of excavator model, loading operation location, shift availability and truck-shovel combination on loading cycle time and productivity of an open-pit mine. The loading cycle time was used to assess the material loading system performance which is one of the key components of the total cycle time for material transportation in an open-pit mine. Load-ing is among the components of cycle time during which material is being handled. The data analyzed was collected from a computerized dispatch sys-tem at GGM from which 62,000 loading dispatches per month involving sev-eral shifts, 14 excavators and 49 trucks were loaded. About 4465 dispatches per excavator and 1276 dispatches per truck were assessed using loading cycle time data for each dispatch for a period of four months (between August and December). Under fixed tonnage loaded and waste type (33 t of non-acid forming waste rock), it was observed that loading cycle time depends on ex-cavator model, location and truck being loaded. Average cycle times, PDFS and CDFS of loading cycle time series were used to identify differences in per-formance under different situations. It was concluded that shift availability for excavators, loading location, excavator model and truck-shovel combi-nations strongly affect the productivity during loading process in an open- pit mine.
Keywords Potentially Acid-Forming (PAF) Rock, Non-Acid Forming (NAF) Rock, Truck Utilization, Truck Fill-Factor, Queuing Time, Loading Cycle Time, Full and Empty Haul, Total Cycle Time, Theoretical Cycle Time, Non-Productive Cycle Time, Cycle Time Performance Ratio
During material transportation in an open-pit mine, trucks shunt between sho-vels located in different loading points and the dump points, while fully loaded (full haul) and vice versa while empty (empty haul). The truck dispatch problem occurs in several practical situations in the real-world, both in the mining indus-try and outside it, especially in any industry that needs to manage a vehicle fleet. Such systems are currently computerized, giving signals to truck and shovel drivers for the next operations, while storing data on loading, dumping, haul, etc. The data from such a dispatch system in Geita Gold Mine (GGM) was used in this study to assess the productivity of the open-pit mine.
Open-pit mine operation is an expensive business endeavor, with main cost components comprising of earth moving (or material transport) costs and heavy duty equipment investment, to mention a few. Several means of identifying costs exist, including direct financial analysis which uses operational parameters to es-timate the cost using the information based on breakdown and maintenance da-ta, fuel consumption, number and categories of employees, material transporta-tion data, operational cycle time or delays, etc.
One of the major problems addressed in this study is the wide variation in production capacity for an open-pit mine, caused by a large number of factors. For simplicity, researchers fix some factors and focus on few factors to make logical results. Understanding the factors causing performance variations can lead to improved production capacity in the rather complex and stochastic sys-tems like material transport in an open-pit mine. In this study, identification of the factors affecting excavator/shovel performance during material loading by analyzing loading cycle time data is presented. Statistical time series analysis techniques were used to analyze the loading cycle time data recorded from dif-ferent scenarios.
Challenges in production capacity based on loading rate do exist in open-pit mine operations, leading to wide variations in the production capacity, as shown in Figure 1. With the mean value of 1365 t/h, it is important to note that the production capacity in one month varied between 100 and 10,000 t/h which is about 100 times. The wide variations in production capacity manifests also in its high standard deviation which is about 3870 t/h, showing that very high produc-tion capacity values exist. This paper investigates why the mines are unable to stick to consistently high range of production capacity for a long time. The an-swer to this problem is that there are many factors influencing the production capacity, identification and analysis of which forms the basis of this paper.
Several factors effecting productivity like location design, truck model, exca-vator model, weather conditions, material type, shift availability, truck-excavator matching, etc., were used to assess performance, using loading cycle time data. The use of loading cycle time for measuring performance of the open-pit mine focuses on one out of seven components of the total cycle time, while other re-searches consider all the components for identification of bottlenecks in produc-tion capacity.
S. V. Manyele
601
Figure 1. PDF of the production capacity based on loading cycle times.
Thus, the paper looks deep into the variations of loading cycle time as deter-
minant of production capacity. To address the problem of varying production capacity, the following key issues were studied: dispatch frequencies for excava-tors (by models and types), shift availability index and bucket capacities for ex-cavators, dispatch frequencies based on type and model of shovel-truck combi-nations, effect of shovel-truck matching on loading cycle time, effect of changing location on excavator performance, and effect of changing truck models. The variations were assessed using statistical analysis of loading cycle time data. Some of the factor or mine parameters affecting the loading cycle time were fixed such as tonnage and material type loaded.
2. Literature Review
Cycle times can be one of the more puzzling aspects of open-pit mining. De-pending on one’s perspective, the term has several connotations. A mine meas-ures cycle times to determine equipment performance as well as operator effi-ciency [1]. Unusually, high readings of cycle time in certain segments highlight problems in the process, or bottlenecks. By measuring cycle times, benchmarks can be established, allowing a quick identification of operations bottlenecks and solving of problems.
In the past, original equipment manufacturers (OEM) focused on the piece of equipment that they marketed. That has changed, especially with hydraulic ex-cavators, because most of today’s OEMs offer a loading tool and a haul truck. Thus, a key problem is not on equipment, but rather on efficient use of equip-ment. The reality of the situation is that more mines are using enterprise plat-forms that employ dispatching systems to optimize truck fleets. The shovels are
S. V. Manyele
602
competing with a computer that is staging the trucks and also monitoring its performance.
Different researchers have been able to identify areas of open-pit mines where improvements can be made based on cycle times. Although most of the discus-sion was centered on haul trucks, very few studies shared their thoughts on sho-vel productivity as it relates to cycle times [2] [3] [4]. The topics ranged from truck-shovel pass matching optimization of shovel-truck system, machine per-formance monitoring, prediction of shovel productivity, to payload manage-ment. In the study operators were identified by truck and shovel series, DT and EX, respectively.
The coming of hydraulic excavators has brought improvements in perfor-mance. More recently, productivity improvements on the machines have been made ranging from electronically optimized pump management systems, a closed-loop swing that provides highest power when needed, independent cool-ing systems that allow the machine to run full speed, to high-pressure hydraulics [1] [5]. Over the years, not only has the size of the hydraulic excavator grown, but so has the machine’s reliability. The excavator cycle time comprises of the following components: swing time (25%), bucket fill time (41%), swing time for a full bucket (24%) and dumping time, (10%). All these cycles repeat again for each pass until the truck is fully loaded. The loading cycle time (taking about 3 to 6 passes) is what comprises most of the analyzed data in this study. It is ob-vious that drivers of trucks and excavator operators’ skills play a key role in the loading cycle time reduction. When it comes to pass matching, the optimum value lies somewhere between three and six passes [6].
Loading the truck in the fewest number of passes is not necessarily the best approach. The mines are focusing attention also on fill factor together with passes, but the most important to the mine operation is to achieve faster truck cycle [7]. Few passes can be achieved while loading small tonnage, while extra time on the loading cycle time is required to attain 100% fill factor [1].
Truck and shovel elevations also play an important role for front-shovel ap-plications. Backhoe configurations are however slightly different and the cycle times can be quite fast compared to front-shovel configurations. If the backhoe is set up correctly with the truck on the lower level with the bucket raking up the face and a low swing angle (20˚ to 30˚), the cycle time could be as little as 20 to 23 seconds. With the truck on the upper level, it’s not nearly as efficient. In a comparison between loading configurations, double-side loading, which is a lit-tle more complex than single-side loading, proved to be a little more productive.
The payload management system on the haul trucks is another challenge to the mine operations. Payload management is nice from an operational point of view, especially great from a management point of view, but in terms of control-ling what goes into the truck, it’s counter-productive. The shovel operators take more time to load the trucks perfectly, while dispatch systems cannot have to match the truck to the shovel for ever changing digs. Payload is essentially the load carried by a piece of equipment (e.g., in the bucket of a shovel which is then
S. V. Manyele
603
dumped into the truck). The problem regarding shovel-based payload manage-ment is provision of timely, accurate and clear data for consistent loading opera-tion. A number of studies on large mining machinery have looked at the way in which other variables influence machine performance. For example, the effect of fragmentation in the dig-material for electric rope shovel operation has been in-vestigated [2], which shows that diggability was correlated with fragmentation.
Efficient equipment utilization and accurate estimation is very important in open-pit mine. In such operations, materials handling system is composed of loading, hauling and dumping. Shovel-truck systems are most common in open- pit mining, involving any combination of loading units and trucks. This paper provides an analysis of truck-shovel loading cycle time under changing locations [6] [8]. There are various factors influencing the shovel truck productivity, in-cluding truck-shovel match, operating and schedule efficiency, haul-road design and conditions, truck size and spotting time, inefficiencies in drilling and blast-ing, etc.
A universally accepted method for measuring the improvement potential of a production process with one simple number adopted for the purpose of this pa-per is Overall Equipment Effectiveness (OEE) [9] [10]. OEE is a simple tool that can help managers to measure the effectiveness of their equipment. It takes the most common and important sources of productivity losses availability, perfor-mance and quality to estimate OEE.
In open-pit mines, the hydraulic excavators are operated to handle materials with varying degrees of fragmentation and hence performance variations. Oper-ational variations are not solely due to fragmentation alone, but depend on other factors including operator skills. One of the most significant factors is the cha-racteristic of the muck being loaded, such as the looseness, angle of repose, size distribution and moisture content of the blasted material. Looseness in the muck increases with the increase in the value of the mean particle size and index of uniformity of the fragmented rock. Looseness and angle of repose affect the fill factor and the digging cycle time of a loader and in turn the productivity of the equipment. Moisture content affects the angle of repose as well as the stickiness of the material to the loader’s bucket. The bucket fill factor and rate of produc-tion decrease with increasing values of mean particle size and index of unifor-mity. Literature shows further that production rate decreases when material to be excavated is mainly oversized rocks [11]. Other studies affirmed the latter in their study when they found a decreasing trend of shovel productivity with in-creasing percentage of oversized rocks [3]. Thus, improving blasting perfor-mance to achieve minimal oversize rocks can impact positively on excavator dig time and bucket payload, which results in increased production.
Productivity of shovel-truck system reduces when operational delays occur. Factors that can contribute to operational delays in the shovel-truck system may include: shovel-truck mismatch, poor haul road design and maintenance, poor equipment maintenance culture, operator inefficiencies and extreme weather conditions [4] [12] [13] [14].
S. V. Manyele
604
Loading area cleanup is an important factor for loading performance, because conditions at loading and dumping areas contribute up to 70% of truck tyre damage [15]. Confined space at loading point affects truck maneuverability during spotting. When a truck arrives at a free shovel at loading point, it takes some turns to position its bucket directly and correctly under the shovel for loading. The total time used by the truck to go through this positioning exercise is called spotting time. Poor spotting in confined loading areas affect loading cycle time, thus decreasing productivity.
Production is thus decreased due to increased truck travel time, leading to long waiting time by the excavator. It has been also reported that extreme weather condition such as heavy fog can deteriorate visibility, affecting the loading process. As a safety norm, loading and hauling operations must be halted if visibility is very poor. Halting operations in effect increases idle time of entire shovel-truck fleet, resulting in decreased overall fleet productivity.
Modern excavators are loaded with productivity enhancing features, advan-tages of which need to be exploited. Every manufacturer offers own unique nuances, features and technology of which can cut cycle times. To maximize ex-cavator performance, one must of cycles as possible. The bigger machines are a bit slower than smaller machine. Shorter cycle times reduce cost and vice versa, while longer cycle times drops productivity, as per Figure 1.
There are many universal tips that can increase excavator effectiveness, re-gardless of make and model of excavator. Experienced operators know many tricks to maximize productivity and decrease the cost of operating any type of earth moving equipment. Positioning the bucket teeth at the proper angle and having proper tools to assist in lifting applications when digging saves time and maximizes productivity. Excavators have more lifting power when the boom arm is tucked in closer to the machine. Thus understanding excavators’ unique features increases productivity by shortening the loading cycle time. The most important thing an operator can do to maximize the productivity of any ma-chine is to know the equipment, which starts with reading the operator’s ma-nual. This study investigates on the operational factors effecting loading cycle time and productivity of the track shovel system.
3. Methodology 3.1. Data Collection Method
Data collected from the field for the truck-shovel transportation system included 12-months data on the status of excavators (loaders) and haulage trucks that were operating at five of the Geita Gold Mine pits. These are the Nyankanga, Geita Hill, Lone Cone, Kukuluma and Matandani pits. The actual data analyzed was collected in the period of August 2005 to July 2006. The computerized mod-ular dispatch system operates on a continuous basis tracking the equipment with the aid of radio communication. This provides a more accurate record of events taking place inside the pits and surrounding areas over a 24-hour period for 365 days of the year.
S. V. Manyele
605
3.2. Study Area and the Structure of Collected Data
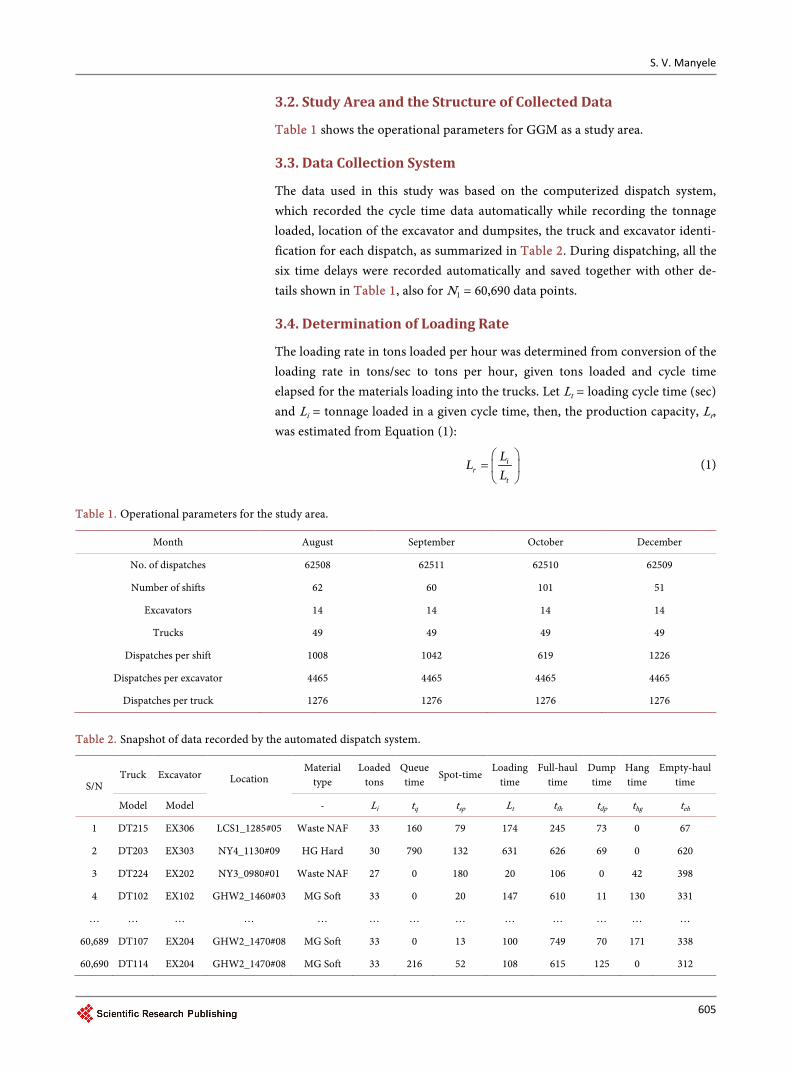
Table 1 shows the operational parameters for GGM as a study area.
3.3. Data Collection System
The data used in this study was based on the computerized dispatch system, which recorded the cycle time data automatically while recording the tonnage loaded, location of the excavator and dumpsites, the truck and excavator identi-fication for each dispatch, as summarized in Table 2. During dispatching, all the six time delays were recorded automatically and saved together with other de-tails shown in Table 1, also for N1 = 60,690 data points.
3.4. Determination of Loading Rate
The loading rate in tons loaded per hour was determined from conversion of the loading rate in tons/sec to tons per hour, given tons loaded and cycle time elapsed for the materials loading into the trucks. Let Lt = loading cycle time (sec) and Li = tonnage loaded in a given cycle time, then, the production capacity, Lr, was estimated from Equation (1):
ir
t
LL
L
=
(1)
Table 1. Operational parameters for the study area.
Month August September October December
No. of dispatches 62508 62511 62510 62509
Number of shifts 62 60 101 51
Excavators 14 14 14 14
Trucks 49 49 49 49
Dispatches per shift 1008 1042 619 1226
Dispatches per excavator 4465 4465 4465 4465
Dispatches per truck 1276 1276 1276 1276
Table 2. Snapshot of data recorded by the automated dispatch system.
3.5. Determination of Shift Availability Index for Excavators
If dfi are the dispatch frequencies of excavators during a given shift, where i = 1, 2, 3, ···, Nex, is the number of excavators available for dispatch in a selected pe-riod (say 1 month), then the total number of dispatch can be determined as per Equation (2):
( )1exN
ft fiid d=
= ∑ (2)
In a selected period of interest, if there were j shifts during which excavators were dispatched in various areas of the open-pit mine, accessible and monitored by the computerized system, where j = 1, 2, 3, ···, Nsh, then for each excavator, the shift availability index is defined as per Equation (3):
1
1 shN fiav j
sh ft
dS
N d=
=
∑ (3)
The value of Sav indicates the machine availability for the period under con-sideration. Higher value indicates that the machine was ready to work and per-formed well with higher dispatch frequency during the whole period. Lower value of Sav indicates, on the other hand, either the machine was down during most of the shifts or it performed few loading cycles. Table 3 shows the sample dispatch data recorded during material loading in an open-pit mine, while Table 4 shows how the dispatch data for each excavator for the shifts recorded in one month were used to calculate the values of Sav for each machine.
Table 3. Sample dispatch data for calculation of shift availability index.
Shift index, j Excavator index, i i = 1 i = 2 i = 3 i = 4 … i = 14
4. Results and Discussion 4.1. Dispatch Frequency for Excavators as a Performance
Measure
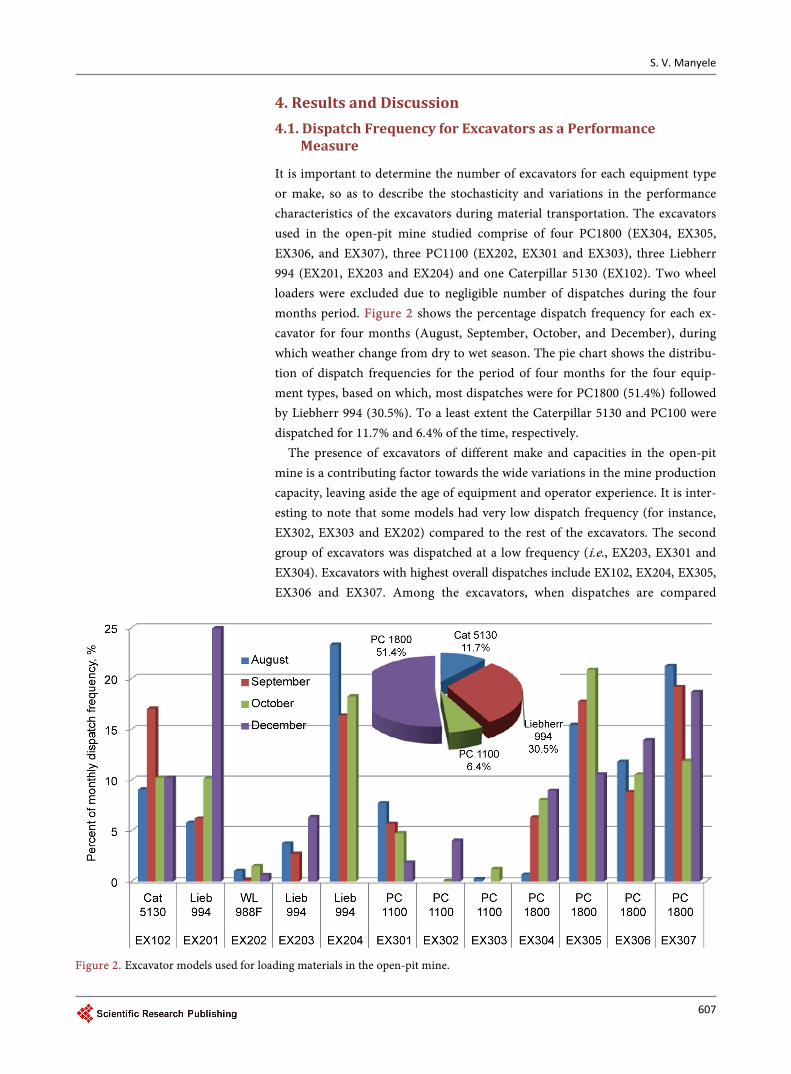
It is important to determine the number of excavators for each equipment type or make, so as to describe the stochasticity and variations in the performance characteristics of the excavators during material transportation. The excavators used in the open-pit mine studied comprise of four PC1800 (EX304, EX305, EX306, and EX307), three PC1100 (EX202, EX301 and EX303), three Liebherr 994 (EX201, EX203 and EX204) and one Caterpillar 5130 (EX102). Two wheel loaders were excluded due to negligible number of dispatches during the four months period. Figure 2 shows the percentage dispatch frequency for each ex-cavator for four months (August, September, October, and December), during which weather change from dry to wet season. The pie chart shows the distribu-tion of dispatch frequencies for the period of four months for the four equip-ment types, based on which, most dispatches were for PC1800 (51.4%) followed by Liebherr 994 (30.5%). To a least extent the Caterpillar 5130 and PC100 were dispatched for 11.7% and 6.4% of the time, respectively.
The presence of excavators of different make and capacities in the open-pit mine is a contributing factor towards the wide variations in the mine production capacity, leaving aside the age of equipment and operator experience. It is inter-esting to note that some models had very low dispatch frequency (for instance, EX302, EX303 and EX202) compared to the rest of the excavators. The second group of excavators was dispatched at a low frequency (i.e., EX203, EX301 and EX304). Excavators with highest overall dispatches include EX102, EX204, EX305, EX306 and EX307. Among the excavators, when dispatches are compared
Figure 2. Excavator models used for loading materials in the open-pit mine.
S. V. Manyele
608
between the four months, variations still persist, reducing equipment availability for dispatch due to equipment breakdowns and planned maintenance. This is because the maintenance schedule for all excavators is always intercepted as soon as an emergency breakdown occurs. The variations in availability affect the production capacity of the whole mine.
Figure 2 shows that there was high dispatch frequency (also a performance measure) for only few excavators:PC1800 (EX307) and Liebherr 994 (EX201 and EX204) for the period studied. This is attributable to: high bucket capacity for Liebherr 994 (11 - 20 m3) and also for the hydraulic excavator (PC1800) that is 5.9 - 12 m3, while PC1100 and WL908F have very low bucket capacities (3.4 - 5 m3 and 7.7 m3), respectively. Very low dispatch frequency for EX303, EX302 and EX 202 for all of four months is a major cause of drop in productivity.
4.2. Shift Availability Index for Excavators in an Open-Pit Mine
Figure 2 and Figure 3 show that on average, there was lower dispatch frequency corresponding to lower shift availability, respectively, observed for EX302, EX303 and EX304 excavators. Moreover, excavator models EX305 and EX307 have higher shift availability, attributable to lower frequency of breakdown. Further analysis shows that EX307 and EX305 had very low frequency of downs due to other reasons compared to the rest of the models. Thus, these excavator models have high performance. Moreover, Figure 3 shows also that EX203 and
Figure 3. Variation of the shift availability index for excavators used in the open-pit mine.
S. V. Manyele
609
EX204 exhibits higher shift availability, attributable to high bucket capacity for Liebherr 994 models that is, 11 - 20 m3, which attracts faster fill rate at smaller number of passes.
A great similarity between Sav profiles is evident for all of the three months has been observed, according to Figure 3. This shows that Sav is not dependent on weather or environmental conditions, but rather on the equipment performance features. It is thus suggested that Sav data becomes part of the dispatch systems by drivers putting a signal that their equipment is down. However, controls have to be implemented as drivers may impact the data and system performance based on personal decision making. Causes of delays not due to machine failure include road conditions, weather, dust (which causes speed losses), equipment setup and adjustments, etc. On the other hand, it is evident that Sav is strongly affected by shovel waiting time, since equipment is regarded available while it is practically idle.
Bucket size is determined by lift specs, material weight, bucket weight, bucket capacity, and distance to dump bucket from excavator. Moreover, the excava-tor’s hydraulic power will be decisive in bucket working range. Sizing the correct bucket to the excavator will increase production without increasing wear to in-ternal pins and bushings, swing bearings, hydraulic pumps, and/or undercar-riage wear. Oversizing the excavator bucket will cause extra load time, swing time, and dump time, plus extra machine heat when the operator is stalling the bucket trying to maintain huge bucket loads. When using an oversized bucket, the machine becomes tippy and the operator will restrain from full bucket loads. So, the extra weight of the big bucket becomes disadvantageous. Table 5 sum-marizes the bucket size and other excavator specifications for models used in this study.
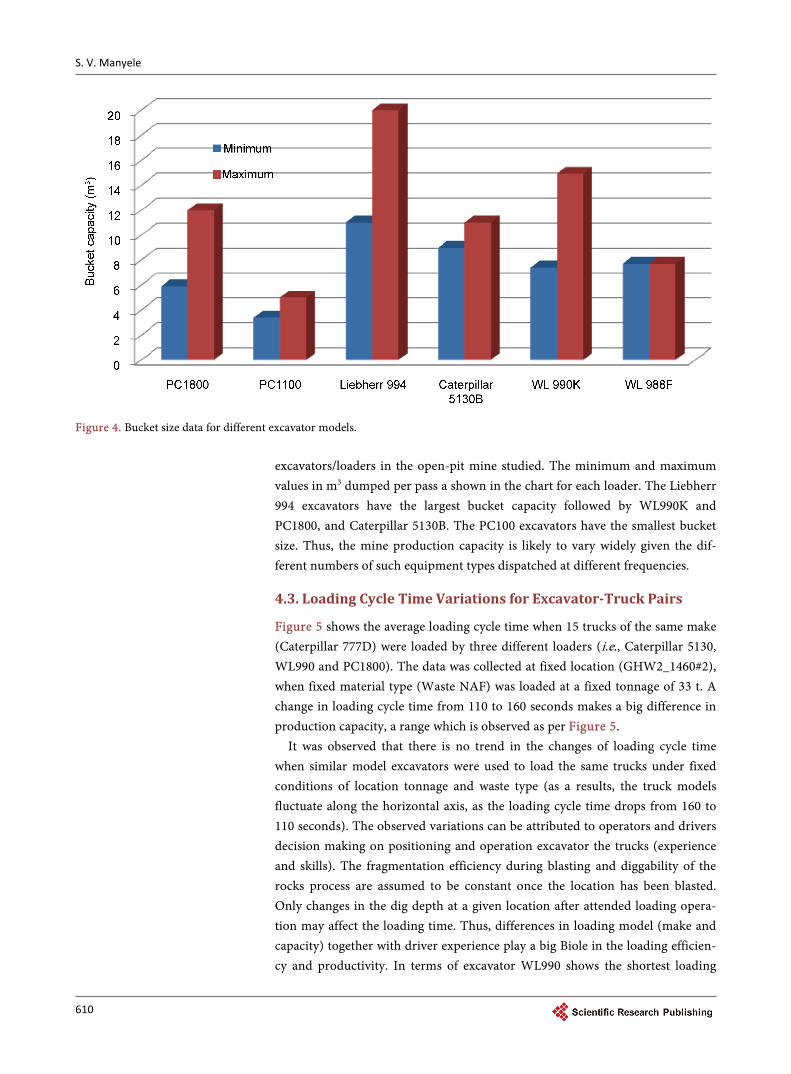
Figure 4 presents a comparison of bucket capacity data between 6 dominant Table 5. Excavator types and specifications related to material loading used in the open- pit mine.
Excavator Specifications
WL 988F Wheel Loader Max. Bucket Capacity: 7.7 m3; Total Hydraulic Cycle Time (Cycle Decomposition: Raise, Dump, Lower Float Down (Empty)): 15.6 seconds
Bucket capacity (Front Shovel): 9.0 to 11.0 m3 Available in Front Shovel and Backhoe configuration, primarily matched to the Caterpillar 777D truck, but can also be teamed with the 773D or 775D and other trucks in the 65 to 100 ton size class. This leads to efficient loading and hauling systems for mining, quarrying and heavy construction applications
Figure 4. Bucket size data for different excavator models.
excavators/loaders in the open-pit mine studied. The minimum and maximum values in m3 dumped per pass a shown in the chart for each loader. The Liebherr 994 excavators have the largest bucket capacity followed by WL990K and PC1800, and Caterpillar 5130B. The PC100 excavators have the smallest bucket size. Thus, the mine production capacity is likely to vary widely given the dif-ferent numbers of such equipment types dispatched at different frequencies.
4.3. Loading Cycle Time Variations for Excavator-Truck Pairs
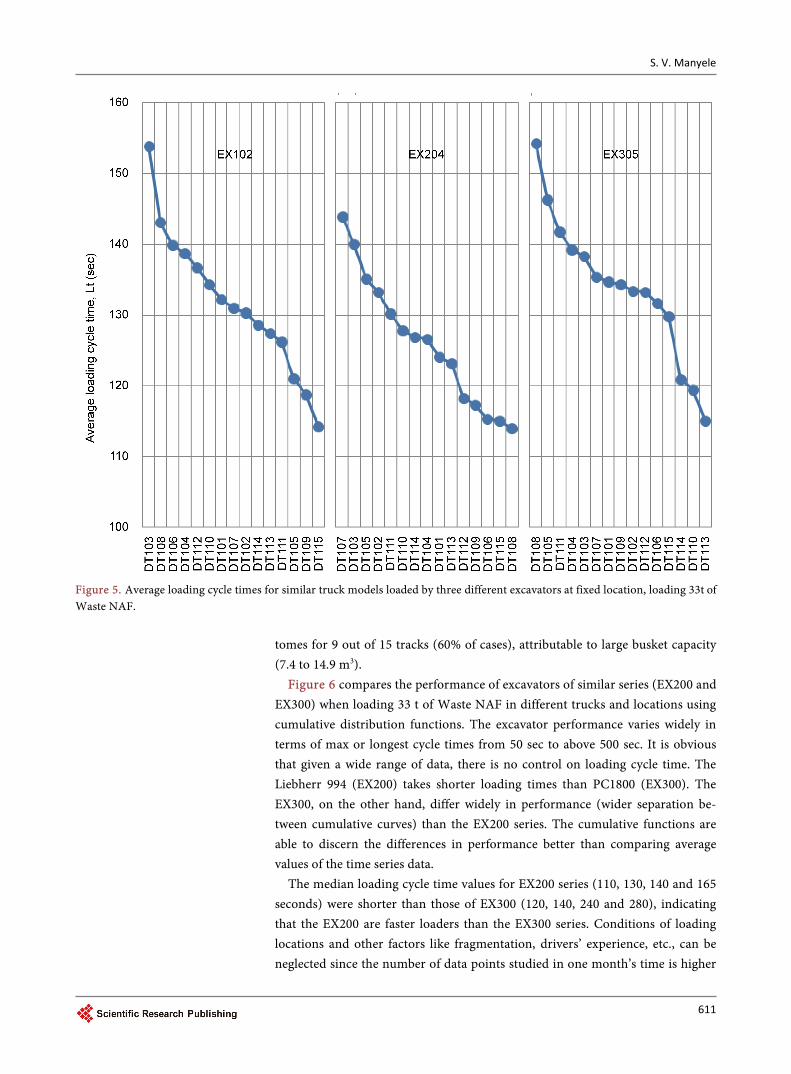
Figure 5 shows the average loading cycle time when 15 trucks of the same make (Caterpillar 777D) were loaded by three different loaders (i.e., Caterpillar 5130, WL990 and PC1800). The data was collected at fixed location (GHW2_1460#2), when fixed material type (Waste NAF) was loaded at a fixed tonnage of 33 t. A change in loading cycle time from 110 to 160 seconds makes a big difference in production capacity, a range which is observed as per Figure 5.
It was observed that there is no trend in the changes of loading cycle time when similar model excavators were used to load the same trucks under fixed conditions of location tonnage and waste type (as a results, the truck models fluctuate along the horizontal axis, as the loading cycle time drops from 160 to 110 seconds). The observed variations can be attributed to operators and drivers decision making on positioning and operation excavator the trucks (experience and skills). The fragmentation efficiency during blasting and diggability of the rocks process are assumed to be constant once the location has been blasted. Only changes in the dig depth at a given location after attended loading opera-tion may affect the loading time. Thus, differences in loading model (make and capacity) together with driver experience play a big Biole in the loading efficien-cy and productivity. In terms of excavator WL990 shows the shortest loading
S. V. Manyele
611
Figure 5. Average loading cycle times for similar truck models loaded by three different excavators at fixed location, loading 33t of Waste NAF.
tomes for 9 out of 15 tracks (60% of cases), attributable to large busket capacity (7.4 to 14.9 m3).
Figure 6 compares the performance of excavators of similar series (EX200 and EX300) when loading 33 t of Waste NAF in different trucks and locations using cumulative distribution functions. The excavator performance varies widely in terms of max or longest cycle times from 50 sec to above 500 sec. It is obvious that given a wide range of data, there is no control on loading cycle time. The Liebherr 994 (EX200) takes shorter loading times than PC1800 (EX300). The EX300, on the other hand, differ widely in performance (wider separation be-tween cumulative curves) than the EX200 series. The cumulative functions are able to discern the differences in performance better than comparing average values of the time series data.
The median loading cycle time values for EX200 series (110, 130, 140 and 165 seconds) were shorter than those of EX300 (120, 140, 240 and 280), indicating that the EX200 are faster loaders than the EX300 series. Conditions of loading locations and other factors like fragmentation, drivers’ experience, etc., can be neglected since the number of data points studied in one month’s time is higher
S. V. Manyele
612
Figure 6. Comparison of the excavator performance based on loading cycle time (EX200 and EX300 Series) loading trucks at any location.
as shown in Table 1. While performance differ among the excavators of Liebherr 994 and PC1800, it is interesting to note also that the cumulative curves have similar S-shapes, with changing horizontal position, depending on loading speed. For the faster loaders, the curves are closer to the vertical axis than curves of the slower loaders. The similarity in shape signifies that the process is affected by similar factors leading to the similar stochastic nature of the loading process.
4.4. Monthly Variations in Excavator Performance
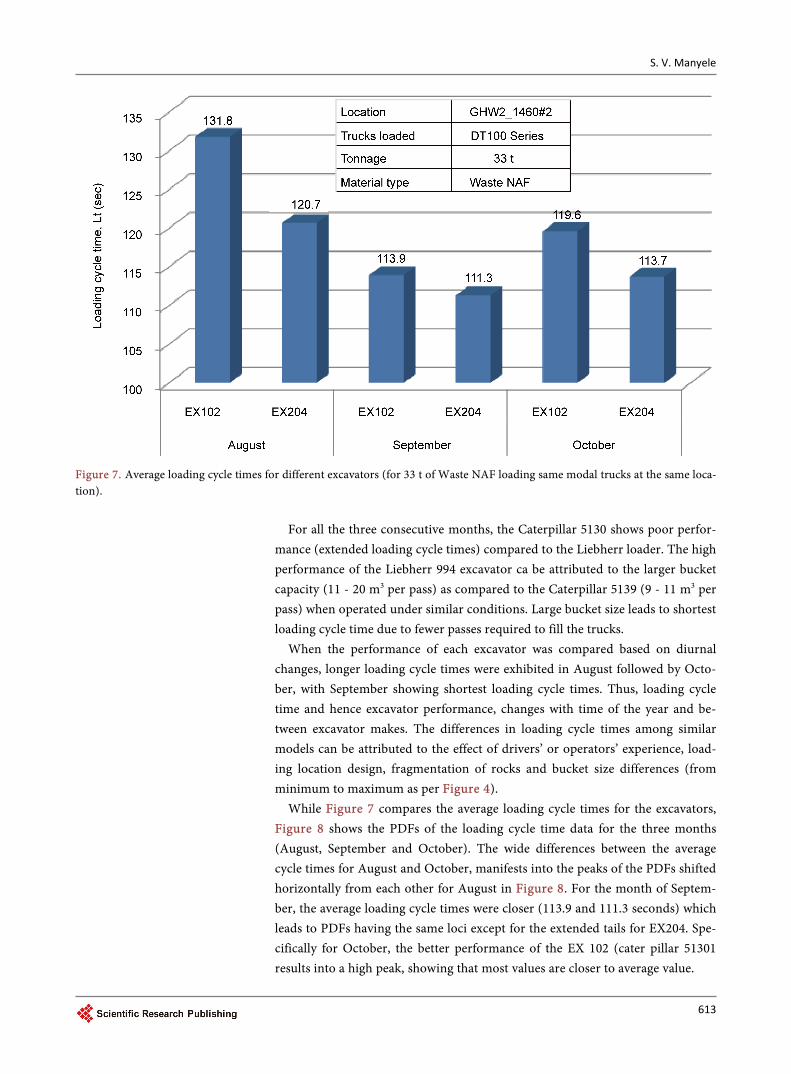
Figure 7 shows the performance of different excavators as a mine operation continues with time from August to October. The performance was measured for two excavator types used to load Caterpillar 777D trucks (DT100 Series) at the same location (GHW2_1460#2), constant tonnage of 33t and same material (Waste NAF). The data was further compared for the three consecutive months (August to October) to study the effect of progress in time on performance using loading cycle time. Two excavator types were compared, that is, Caterpillar 5130 (EX102) and Liebherr 994 (EX204). For Liebherr 994, loading cycle time de-creased from 120.7 to 111.3 seconds, while for Caterpillar 5130, the cycle time decreased in a wider range, from 131.8 to 113.9 seconds the months of between the months of August and September, respectively, which are dry seasons. In October, when it starts to rain, the Lt increases again for both cases. That is changes in time affected the cater pillars 5130 strongly than the Liebherr 994.
S. V. Manyele
613
Figure 7. Average loading cycle times for different excavators (for 33 t of Waste NAF loading same modal trucks at the same loca-tion).
For all the three consecutive months, the Caterpillar 5130 shows poor perfor-
mance (extended loading cycle times) compared to the Liebherr loader. The high performance of the Liebherr 994 excavator ca be attributed to the larger bucket capacity (11 - 20 m3 per pass) as compared to the Caterpillar 5139 (9 - 11 m3 per pass) when operated under similar conditions. Large bucket size leads to shortest loading cycle time due to fewer passes required to fill the trucks.
When the performance of each excavator was compared based on diurnal changes, longer loading cycle times were exhibited in August followed by Octo-ber, with September showing shortest loading cycle times. Thus, loading cycle time and hence excavator performance, changes with time of the year and be-tween excavator makes. The differences in loading cycle times among similar models can be attributed to the effect of drivers’ or operators’ experience, load-ing location design, fragmentation of rocks and bucket size differences (from minimum to maximum as per Figure 4).
While Figure 7 compares the average loading cycle times for the excavators, Figure 8 shows the PDFs of the loading cycle time data for the three months (August, September and October). The wide differences between the average cycle times for August and October, manifests into the peaks of the PDFs shifted horizontally from each other for August in Figure 8. For the month of Septem-ber, the average loading cycle times were closer (113.9 and 111.3 seconds) which leads to PDFs having the same loci except for the extended tails for EX204. Spe-cifically for October, the better performance of the EX 102 (cater pillar 51301 results into a high peak, showing that most values are closer to average value.
S. V. Manyele
614
Figure 8. Probability distribution functions for loading cycle time for excavators (EX102 and EX204) both loading DT100 trucks with 33 t of Waste NAF at a fixed location.
S. V. Manyele
615
Together with bucket size difference among excavators, another factor is dif-ferences in dig time which leads to variations in the loading cycle times for the excavators. The duration of each loading comprise of the following components: bucket passes time, total dig time and truck load time, all affecting the excavator performance. This study focused on the truck load time which, however, com-prise of the excavating cycles for each pass dumped into the truck. Five items to increase excavator productivity include: the correct-sized bucket for quicker cycle times, a short tip radius increases bucket breakout, short tubs for faster bucket dump, long arms are for reach while shorts arms increase arm force.
4.5. Effect of Truck-Excavator Matching on Loading Process Effectiveness
For effective truck and shovel operation, it is necessary that the capacities of a dig unit or shovels are compatible with the capacities of the truck fleet. Truck shovel match refers to the situation where the ideal capacity and number of haul truck is available for any given dig unit and how well they are suited to each other. The match factor itself provides a measure of productivity of the fleet. The match ratio is so called because it can be used to match the truck arrival rate to loader service rate. This ratio removes itself from equipment capacities, and in this sense, potential productivity, by also including the loading times in the truck cycle times.
This study focuses on technical match between shovels and trucks. During loading, dimensions like overall height, length, capacity of the bucket and truck matters. Because of technical limitations, the number of trucks loaded by an ex-cavator and the resulting mean loading cycle time, depend strongly on the me-chanical configurations of both trucks and excavators, like heights of both exca-vator and truck, bucket capacity in relation to number of passes required to fill the truck, shovel reach and truck capacity usually referred to as operating para-meters.
Given that the mine uses a mixed truck fleet, the open-pit mine would per-form better when serviced by certain shovels than by others, as shown in this study. One particular aspect that constitutes most of the loading time in a truck shovel cycle, is the time taken to complete each and all of the passes to fill the truck. The best match is one where the shovel, loading its maximum payload is able to fill a truck to its maximum payload in 3 or 4 passes (Collins and Kizil, 2012). Thus, loading cycle time is used in this study as a measure of a match be-tween operating parameters. To assess the match between the truck and shovel, some of the parameters were fixed such as location, excavator tonnage (33 t) and material type (Waste NAF). As stated earlier, the mine uses 49 trucks and 14 ex-cavators, matching of which form a complex problem given that other factors affect the loading process as well.
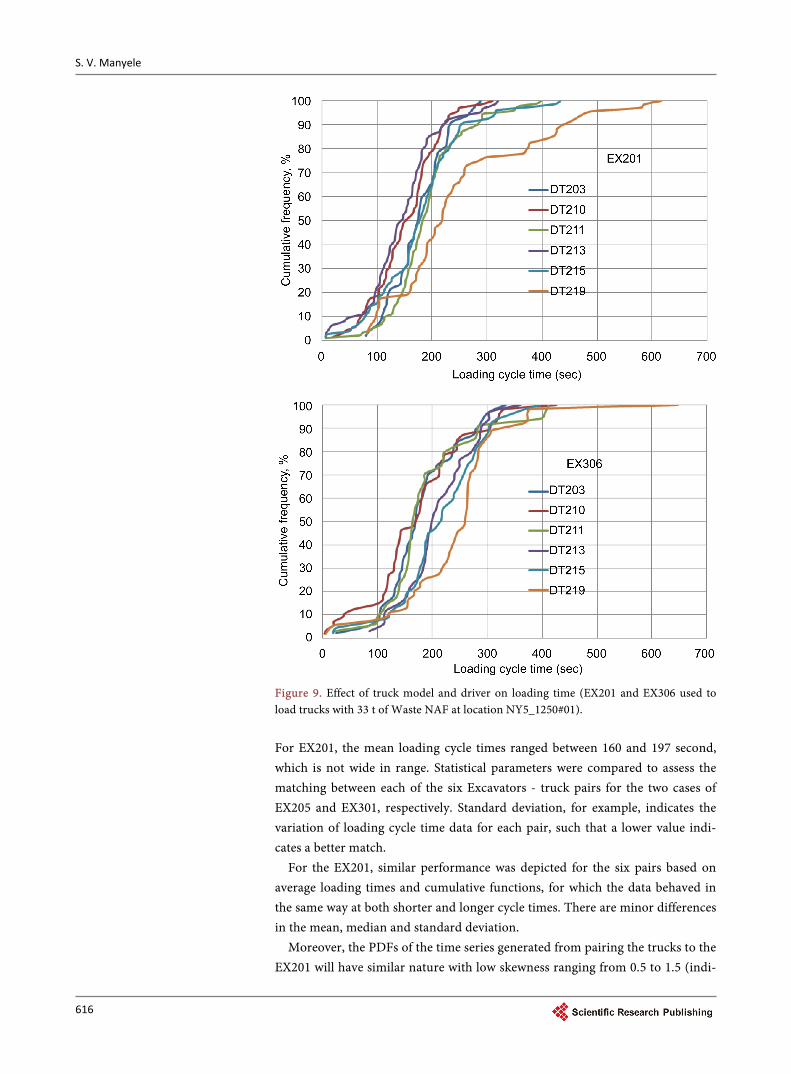
This study assessed matching for 6 selected tracks (DT200) and two excava-tors (EX201 and EX 306) as shown in Figure 9. The mean loading time and cu-mulative functions were determined using a large sample (Nd) sizes as per Table 3.
S. V. Manyele
616
Figure 9. Effect of truck model and driver on loading time (EX201 and EX306 used to load trucks with 33 t of Waste NAF at location NY5_1250#01). For EX201, the mean loading cycle times ranged between 160 and 197 second, which is not wide in range. Statistical parameters were compared to assess the matching between each of the six Excavators - truck pairs for the two cases of EX205 and EX301, respectively. Standard deviation, for example, indicates the variation of loading cycle time data for each pair, such that a lower value indi-cates a better match.
For the EX201, similar performance was depicted for the six pairs based on average loading times and cumulative functions, for which the data behaved in the same way at both shorter and longer cycle times. There are minor differences in the mean, median and standard deviation.
Moreover, the PDFs of the time series generated from pairing the trucks to the EX201 will have similar nature with low skewness ranging from 0.5 to 1.5 (indi-
S. V. Manyele
617
cating positively skewed data). The loading cycle time, on the other hand, did not depend on truck model for EX201 at a fixed location, tonnage loaded and waste type indicating a good match between the excavator and the trucks. Ob-served differences are only due to driver skills since the trucks are of the same make.
4.6. Effect of Changing Location on Excavator Loading Process Efficiency
To assess the effect of changing location, loading cycle times were compared for three different excavators located in three different locations leading to five sets of conditions, A to E, as shown in Figure 10. The loading cycle times were compared while keeping the tonnage loaded and waste type constant (33 t of Waste NAF). It was observed that loading cycle time depends strongly on exca-vator model and location. The three excavators (EX102, EX204 and EX305) lo-cated at the same position had different loading cycle times of 129.5, 120.5 and 130.5 seconds, respectively due to differences in capacity for different makes. Set B shows fastest loading process at 120.5 seconds only. When the same excavator (EX305) was positioned in three different locations (#2, #4 and #9), the loading cycle time increased from 130.5, 140.0 to 145.2 seconds, respectively. In general, the EX204 shows faster loading rate than the EX305 when located at the same loading point #2. The EX305 located at location #9 lead to the longest average loading cycle time series with negatively skewed PDF while other data set had positive skewness. The dataset E had flattest PDF based on the lowest kurtosis of 0.568, the maximum being 7.959 for Set A.
While other studies define ideal shovel-truck combinations based on how scenarios characterized by different haul distances, material type and equipment availability, this study further assessed performance of shovel-truck combina-tions by using cumulative probably functions of loading cycle time as shown in
Figure 10. Average loading cycle time for excavators located in different locations.
S. V. Manyele
618
Figure 11. While the shapes of cumulative functions are similar, they differ in terms of horizontal shift (especially Set E) and median values. Also, at shorter loading cycles (below 50 sec) it was expected that the curves will have same be-havior (compared to Figure 6 and Figure 9) but the curves show different beha-vior.
The performance of different shovel-truck combinations were further tested by using different locations. Figure 12 gives a comparison of average loading cycle times for similar trucks loaded by the same excavator (EX305) at three
Figure 11. Cumulative probability functions of loading cycle time for excavators located in different locations.
Figure 12. Variation of the loading cycle time for trucks loaded with the same excavator (EX305) in different locations.
S. V. Manyele
619
different locations (#2, #3, and #4). The general picture is that location #3 led to longer loading cycle times for all trucks loaded. This indicates a need for further investigation on truck drivers’ skills, since the trucks were of the same model.
Figure 13 compares the average loading cycle times for the same trucks loaded by the same excavator (EX305) located in six different locations. The comparison was made for fixed tonnage of 33 t and Waste NAF. For each loca-tion, the overall average and standard deviation of loading times for seven trucks were also computed as shown at the bottom of Figure 13. For each location, the loading cycle time varied for each truck. All trucks being Caterpillar 777D, the mismatch is therefore due to drivers’ decisions, experience in spotting the load-ing location design, fragmentation, etc., and not due to design features (dimen-sions, capacities, maneuverability of the excavator and trucks).Similar to Figure 12, wider variations in loading cycle times were observed at location #3, as dif-ferent trucks were loaded by the same excavator (also depicted by highest stan-dard deviation). Thus, truck drivers’ experiences together with locations strongly affect the loading time and productivity of a given excavator.
Figure 14 shows the PDFs of the loading cycle time data for four DT100 series trucks loaded at two different locations (#3 and #4) using the same excavator (EX305). The PDF plots show that while most of the data are within 100 and 200 seconds, the tails of the PDFs were extended beyond 400 seconds.
It was observed that, when EX305 was moved from location #3 to #4, there was a notable horizontal shift of peaks, that is, the peak values were within closer range of loading cycle time for location #3 than location #4. For DT101, the
Figure 13. Effect of changing location and trucks on excavator loading cycle time (EX305).
S. V. Manyele
620
Figure 14. PDFs of loading cycle times for different trucks loaded by the same excavator in different loca-tions.
loading cycle time data shows multi-model behavior for location #4 which was not observed at location #3. On the other hand, location #3 was observed to be unfavorable for DT108, for which the PDF was flatter with wide peak) compared to location #4, where tall and narrow PDFs were observed, showing that most of the loading cycle time data fell within a narrow rage closer to the mean value for the latter location.
S. V. Manyele
621
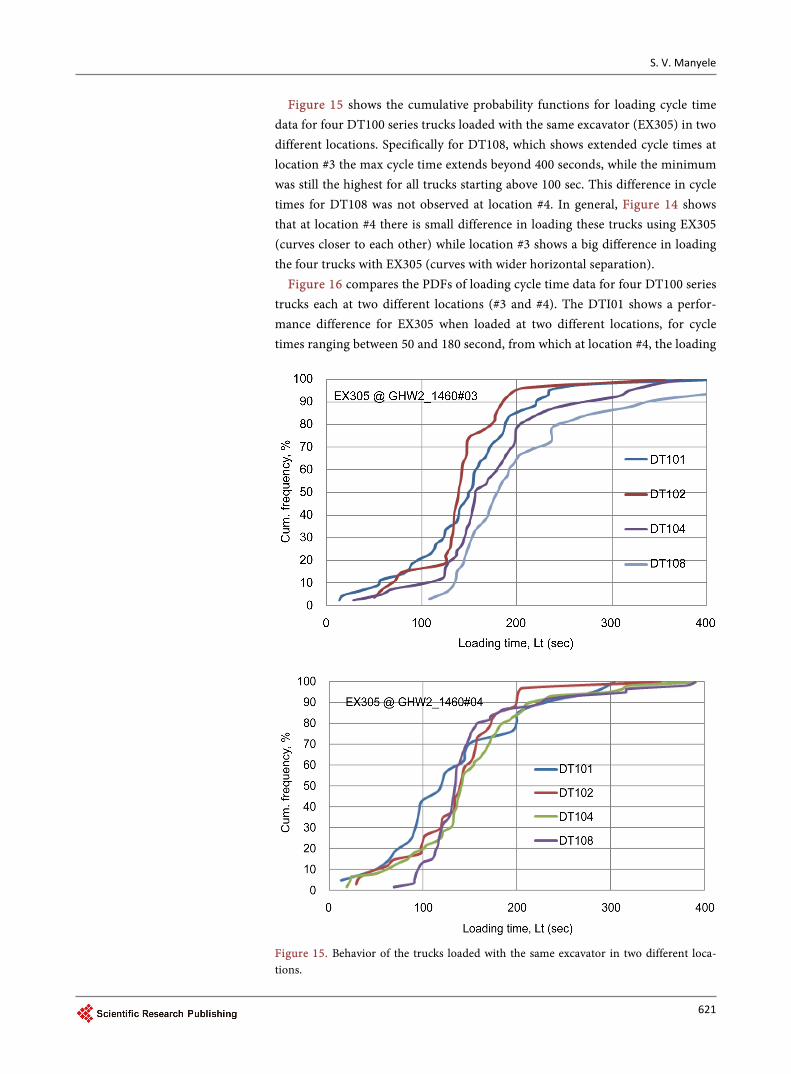
Figure 15 shows the cumulative probability functions for loading cycle time data for four DT100 series trucks loaded with the same excavator (EX305) in two different locations. Specifically for DT108, which shows extended cycle times at location #3 the max cycle time extends beyond 400 seconds, while the minimum was still the highest for all trucks starting above 100 sec. This difference in cycle times for DT108 was not observed at location #4. In general, Figure 14 shows that at location #4 there is small difference in loading these trucks using EX305 (curves closer to each other) while location #3 shows a big difference in loading the four trucks with EX305 (curves with wider horizontal separation).
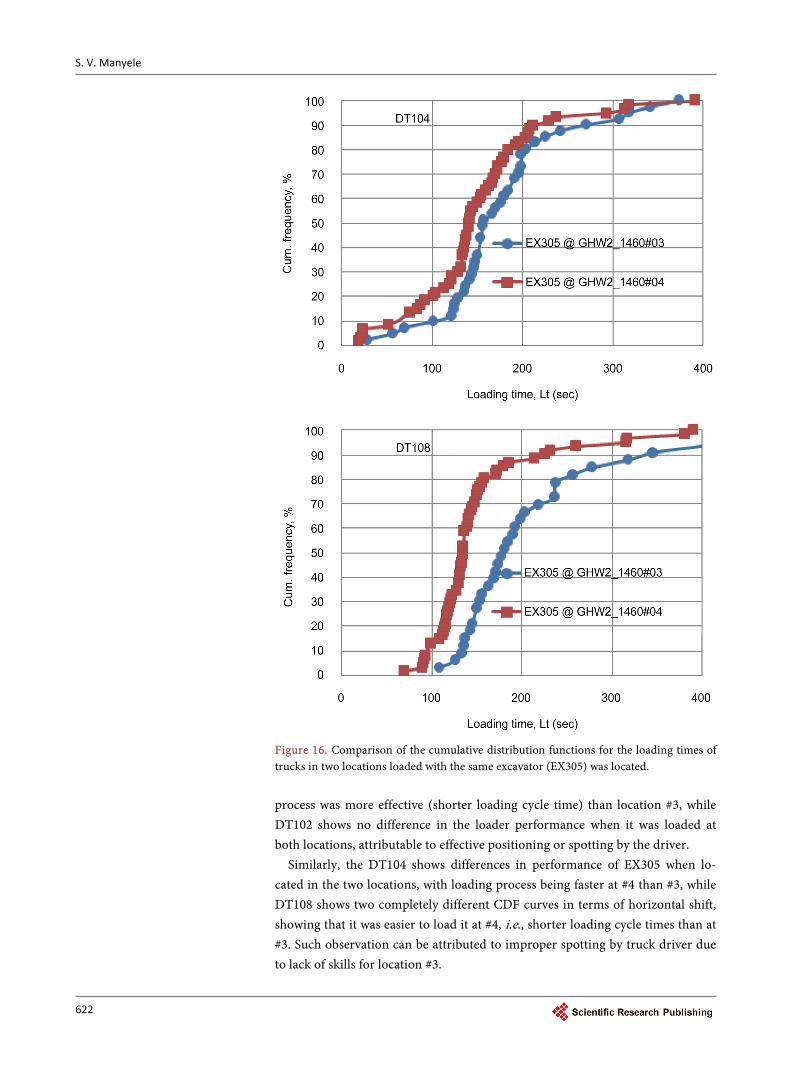
Figure 16 compares the PDFs of loading cycle time data for four DT100 series trucks each at two different locations (#3 and #4). The DTI01 shows a perfor-mance difference for EX305 when loaded at two different locations, for cycle times ranging between 50 and 180 second, from which at location #4, the loading
Figure 15. Behavior of the trucks loaded with the same excavator in two different loca-tions.
S. V. Manyele
622
Figure 16. Comparison of the cumulative distribution functions for the loading times of trucks in two locations loaded with the same excavator (EX305) was located. process was more effective (shorter loading cycle time) than location #3, while DT102 shows no difference in the loader performance when it was loaded at both locations, attributable to effective positioning or spotting by the driver.
Similarly, the DT104 shows differences in performance of EX305 when lo-cated in the two locations, with loading process being faster at #4 than #3, while DT108 shows two completely different CDF curves in terms of horizontal shift, showing that it was easier to load it at #4, i.e., shorter loading cycle times than at #3. Such observation can be attributed to improper spotting by truck driver due to lack of skills for location #3.
S. V. Manyele
623
5. Conclusions
The variation in waste material loading rate is attributable to lower dispatch frequency for some exactors. While some excavators are dispatched at higher frequency throughout the four months’ period, others were least dispatched, for example, EX303 (Komatsu, PC100), EX302 (PC100 Komatsu) and EX202 (Wheel loader, WL 988F). The least performance of excavators, measured using shift availability index, Sav, shows variations with lowest Sav for EX302, EX303, EX304 and EX 102. The profiles of Sav for all three months were similar indicat-ing that equipment availability strongly affects the open-pit mine loading per-formance. The time to load the same type of equipment (DT100 model) varies widely when different excavators are used to load same tonnage, same waste material type and at the same location (due to mismatch of equipment, driver skills, etc.). Thus, matching between truck and excavator is a major factor af-fecting loading efficiency and hence mine productivity. The WL990 was ob-served to match well with the Caterpillar 777D, as revealed by shorter average loading cycle time.
Based on statistical analysis, it was concluded that using average values and PDFs of loading cycle time data, Lt, variations in excavator performance with time (for months of August, September and October) has been observed for Liebherr and Caterpillar excavators. However, Liebherr 994 shows good perfor-mance (short loading cycle time) for the whole period. In September, for in-stance, shortest loading cycle times were observed for both excavator types un-der same tonnage loaded, truck model loaded and for the same material type. By comparing cumulative distribution functions of loading cycle times for EX200 (Liebherr 994) and EX300 (PC1800), it was observed that at constant tonnage loaded and same waste material, the Liebherr 994 excavator took shorter cycles time to load trucks than the PC1800.
Matching two excavators EX201 (Liebherr 994) and EX306 (PC1800) to six trucks (DT200 series) the cumulative distribution functions of loading cycle times indicated that EX201 took shorter times to load trucks at same tonnage, waste type and location; that is, Liebherr 994 was more productive than PC1800. The loading location is one of the major factors affecting cycle time. When the same excavator (EX305) was located in the three different locations (#2, #4 and #9), the average loading cycle time increased in that order while cumulative dis-tribution functions separated horizontally. Meanwhile, different excavators lo-cated in the same location EX102, EX204 and EX355 also led to different average loading cycle times, due of differences in loading capacity. Using the same exca-vator (EX305) to load similar trucks at different locations leads to differences in average loading cycle times, indicating again that loading location strongly af-fects the loading process and productivity.
All loading locations and different truck-shovel combinations leads to highly skewed PDFs. This indicates that loading operations with extended cycle times are common in open-pit mines, which leads to wider range of loading capacity and productivity attributable to several reasons. Thus, PDFs and CDFs of cycle
S. V. Manyele
624
time data are powerful mathematical tools capable of pinpointing performance differences or variations for excavators under different conditions (locations, monthly changes, shovel-truck combinations, etc.).
References [1] Hendricks, C., Peck, J. and Scoble, M. (1991) Machine Performance Monitoring in
Surface Mines. Mining Engineering, 44, 243-250.
[2] Osanloo, M. and Hekmat, A. (2005) Prediction of Shovel Productivity in the Gol-e- Gohar Iron Mine. Journal of Mining Science, 41, 177-184. https://doi.org/10.1007/s10913-005-0081-5
[3] Ercelebi, S.G. and Bascetin, A. (2009) Optimization of Shovel-Truck System for Surface Mining. Journal of the Southern African Institute of Mining and Metallur-gy, 109, 433-439.
[4] Fujita, K., Yasuda, T. and Imaie, K. (2011) Ultra Large Hydraulic Excavators and Dump Trucks for Large Open-Pit Mines. Hitachi Review, 60, 267-271.
[5] Nel, S., Kizil, M.S. and Knights, P. (2011) Improving Truck-Shovel Matching. 35th APCOM Symposium, Wollongong, NSW, 381-391.
[6] Kirmanli, C. and Erceleni, S.G. (2009) An Expert System for Hydraulic Excavator and Truck Selection in Surface Mining. The Journal of the Southern African Insti-tute of Mining and Metallurgy, 109, 727-739.
[7] Vemba, M.M.D.S. (2004) Loading and Transport System at SMC-Optimization. The Journal of the South African Institute of Mining and Metallurgy, 104, 139-147.
[8] Choudhary, R.P. (2015) Optimization of Load-Haul-Dump Mining System by OEE and Match Factor for Surface Mining. International Journal of Applied Engineering and Technology, 5, 96-102.
[9] JideMuili A., Adiodun, I.L. and Adeyemi, E.A. (2013) Optimization of the Overall Equipment Efficiency (OEE) of Loaders and Rigid Frame Trucks in NAMDEB Southern Coastal Mine Stripping Fleet, Namibia. Earth Science, 2, 158-166.
[10] Singh, S.P. and Narendrula, R. (2006) Factors Affecting the Productivity of Loaders in Surface Mines. International Journal of Surface Mining, Reclamation and Envi-ronment, 20, 20-32. https://doi.org/10.1080/13895260500261574
[11] Louit, D.M. and Knights, P.F. (2001) Simulation of Initiatives to Improve Mine Maintenance. Mining Technology, 110, 47-58. https://doi.org/10.1179/mnt.2001.110.1.47
[12] Meech, J. and Parreira, J. (2011) An Interactive Simulation Model of Human Driv-ers to Study Autonomous Haulage Trucks. Procedia Computer Science, 6, 118-123.
[13] Olaiya, F. and Adeyemo, A.B. (2012) Application of Data Mining Techniques in Weather Prediction and Climate Change Studies. International Journal of Informa-tion Engineering and Electronic Business, 4, 51-59. https://doi.org/10.5815/ijieeb.2012.01.07
[14] Thompson, R.J. and Visser, A.T. (2003) Mine Haul Road Maintenance Management Systems. Journal of the South African Institute of Mining and Metallurgy, 103, 303- 312.
[15] Nieto, A., Sun, E. and Li, Z. (2010) Real-time Assisted Driving in Open-Pit Mining Operations Using Google Earth. Mining Engineering, 62, 21-26.
Submit or recommend next manuscript to SCIRP and we will provide best service for you:
Accepting pre-submission inquiries through Email, Facebook, LinkedIn, Twitter, etc. A wide selection of journals (inclusive of 9 subjects, more than 200 journals) Providing 24-hour high-quality service User-friendly online submission system Fair and swift peer-review system Efficient typesetting and proofreading procedure Display of the result of downloads and visits, as well as the number of cited articles Maximum dissemination of your research work
Submit your manuscript at: http://papersubmission.scirp.org/ Or contact [email protected]