INVESTIGATION OF FRP STABILIZATION OF PLASTIC BUCKLING BEHAVIOR OF SLENDER STEEL SECTIONS by Andrew Jeffrey Peck Bachelor of Science in Civil Engineering, University of Michigan, Ann Arbor, 2006 Submitted to the Graduate Faculty of The School of Engineering in partial fulfillment of the requirements for the degree of Master of Science University of Pittsburgh 2007
Transcript
INVESTIGATION OF FRP STABILIZATION OF PLASTIC BUCKLING BEHAVIOR
OF SLENDER STEEL SECTIONS
by
Andrew Jeffrey Peck
Bachelor of Science in Civil Engineering, University of Michigan, Ann Arbor, 2006
Submitted to the Graduate Faculty of
The School of Engineering in partial fulfillment
of the requirements for the degree of
Master of Science
University of Pittsburgh
2007
ii
UNIVERSITY OF PITTSBURGH
SCHOOL OF ENGINEERING
This thesis was presented
by
Andrew Jeffrey Peck
It was defended on
December 3rd, 2007
and approved by
Dr. Amir Koubaa, Academic Coordinator and Lecturer, Department of Civil and Environmental Engineering
Dr. Piervincenzo Rizzo, Assistant Professor, Department of Civil and Environmental Engineering
Dr. Kent A. Harries, William Kepler Whitford Faculty Fellow and Assistant Professor, Department of Civil and Environmental Engineering
2.2 STRENGTHENING OF STEEL USING FRP MATERIALS.... 8
2.3 FATIGUE BEHAVIOR OF STEEL WITH FRP............ ............. 12
2.4 STRUCTURAL REHABILITATION USING FRP............ ......... 13
2.5 BOND INTERFACE BETWEEN FRP AND STEEL SUBSTRATE.................................................................................... 14
2.6 FIELD APPLICATIONS OF FRP ON STEEL STRUCTURES................................................................................ 18
2.7 STRUCTURAL STABILITY OF STEEL SECTIONS............... 19
2.8 ENHANCING STABILITY OF STEEL SECTIONS USING FRP...................................................................................... 23 2.8.1 Companion Study on FRP Stabilization for Elastic Buckling (Abraham, 2006).............................................................. 24
vii
2.9 RELATIONSHIP TO PRESENT WORK.................................... 26
4.2.1 Axial Load Distribution and Apparent Loading Eccentricity....................................................................................... 46 4.2.2 Control Specimen................................................................. 48
Table 2.1 Typical properties of steel-adhesive-FRP systems. (Harries and El-Tawil, 2006).......................................................................................................... 27 Table 2.2 Recommended degradation sub-factors for various FRP materials. (Moy, 2004)............................................................................................................... 27 Table 2.3 CFRP strip strain at rupture/debonding for tested adhesives/development lengths. (Schnerch et al., 2005).......................................... 28 Table 2.4 Elastic buckling test results. (Abraham, 2006)......................................... 28
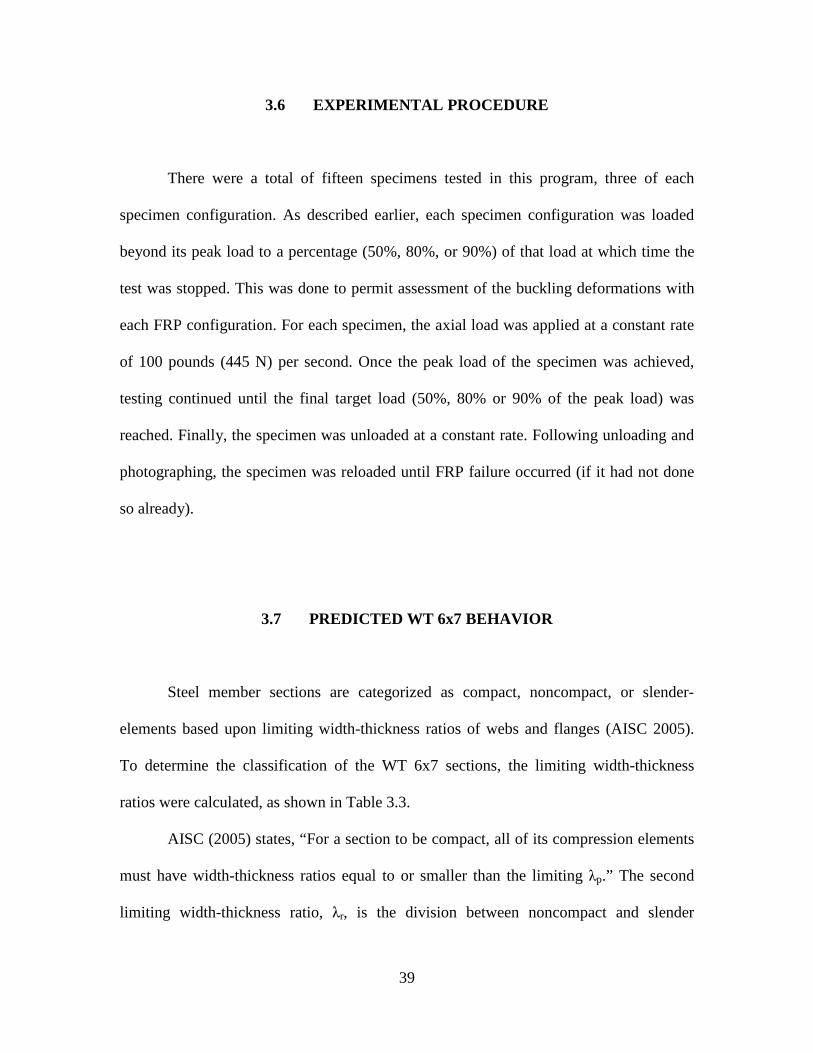
Table 3.1 Preliminary squash test results.................................................................. 41
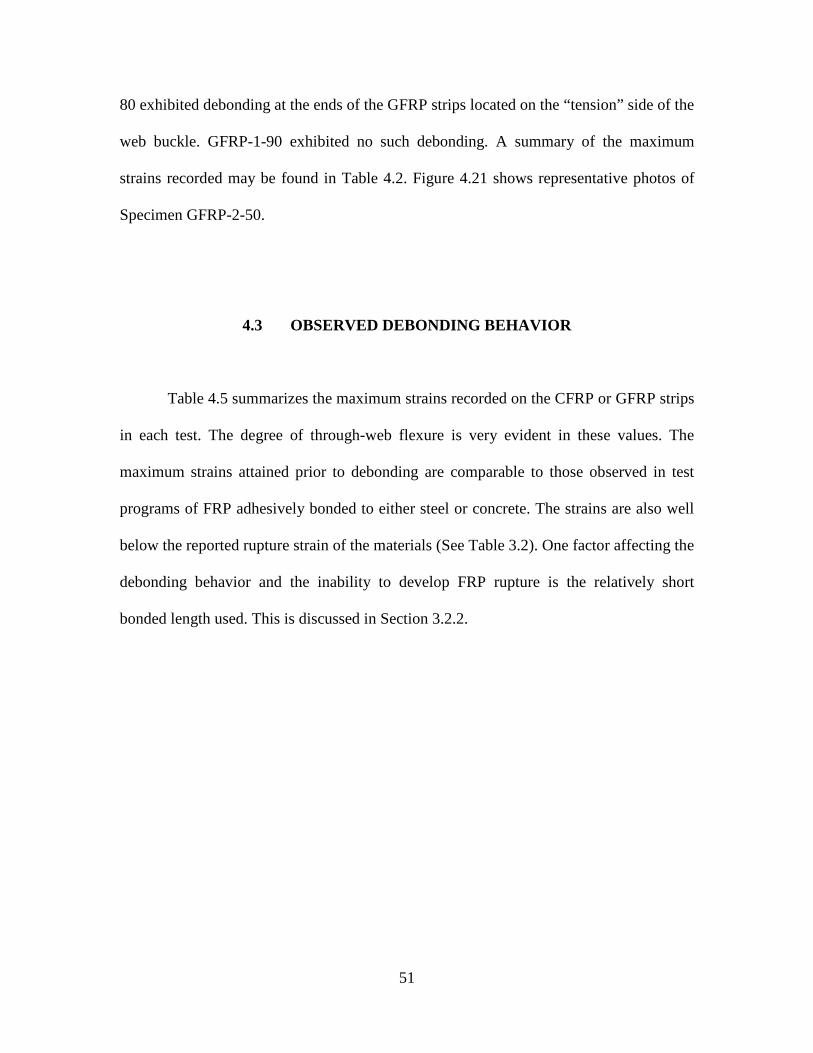
Table 3.2 Material properties reported by manufacturer.......................................... 41 Table 3.3 Limiting Width-Thickness Ratios for WT 6x7......................................... 41 Table 4.1 Summary of displacements resulting from axial compression................. 52
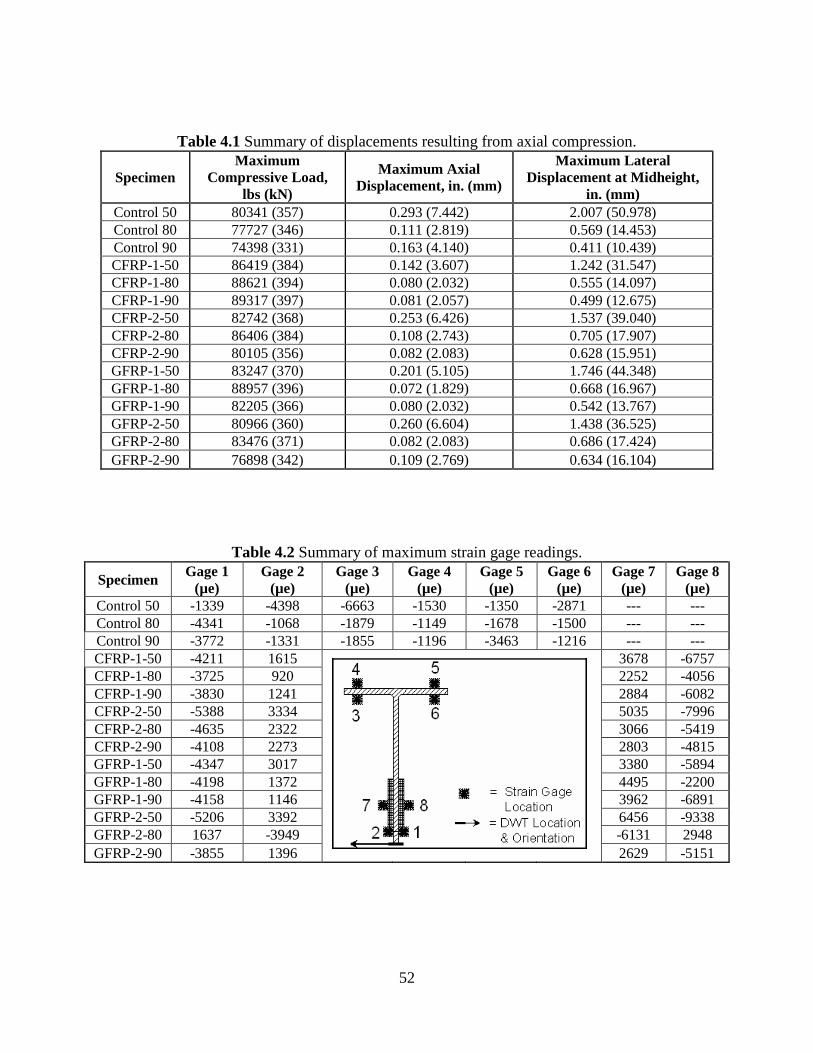
Table 4.2 Summary of maximum strain gage readings............................................ 52
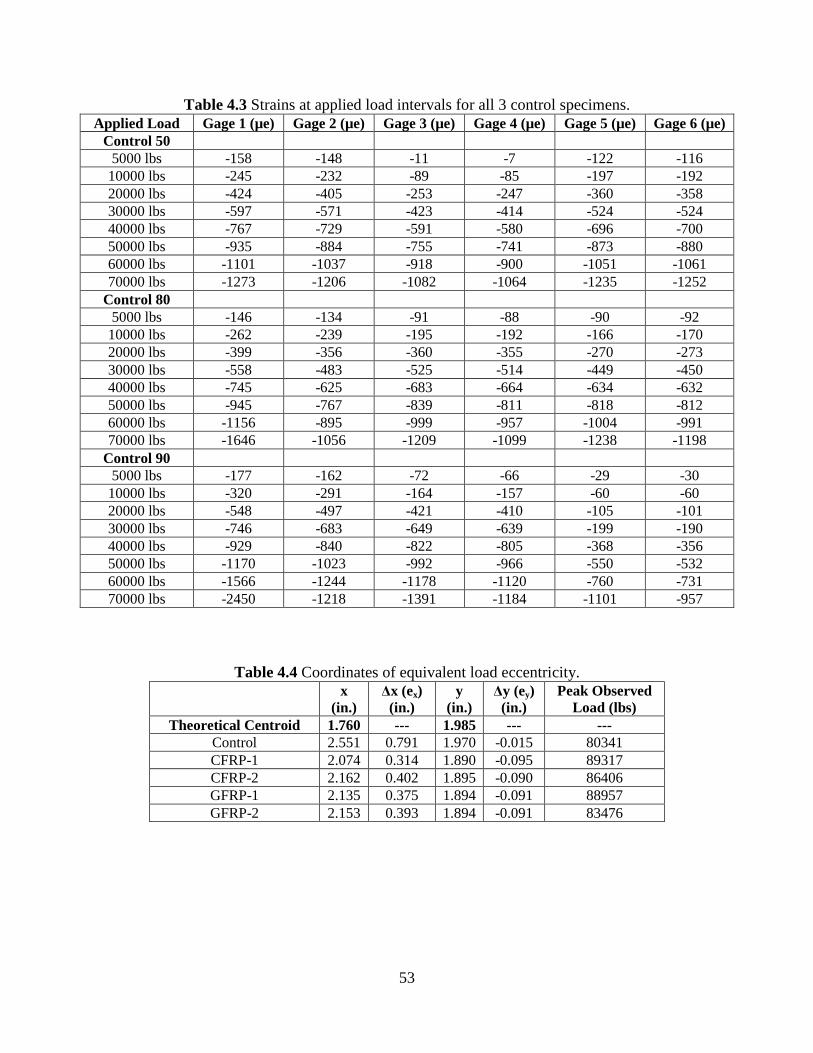
Table 4.3 Strains at applied load intervals for all 3 control specimens.................... 53
Table 4.4 Coordinates of equivalent load eccentricity.............................................. 53
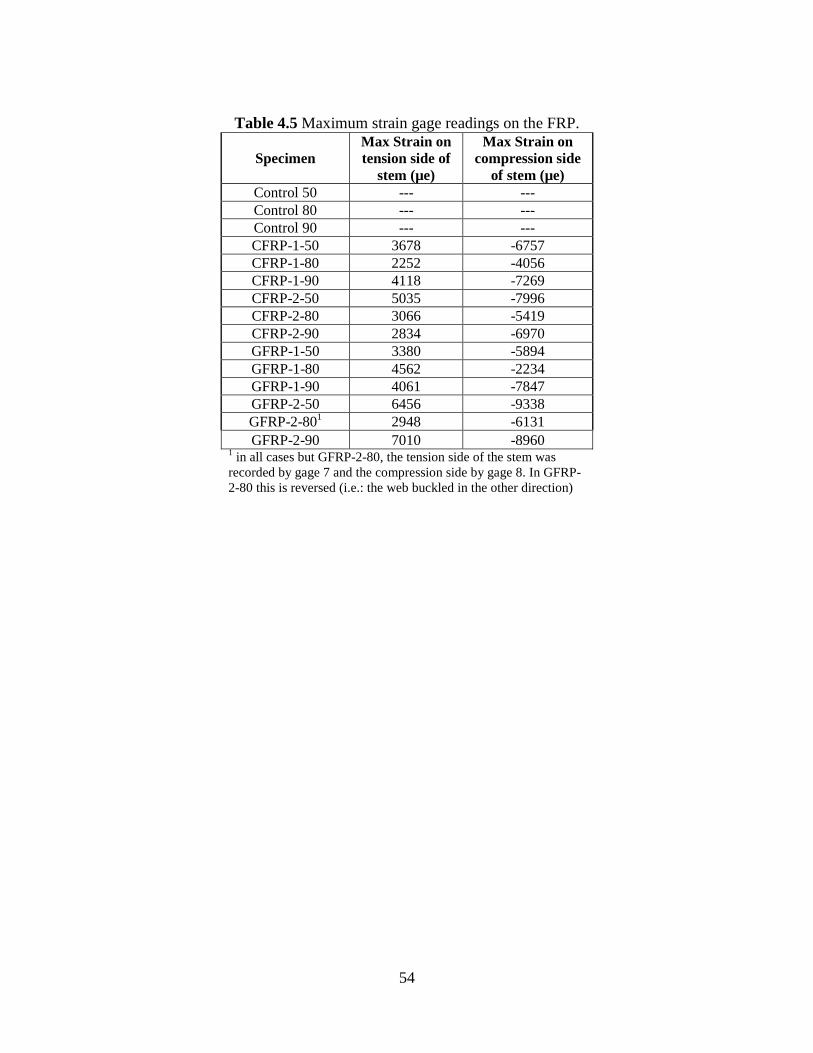
Table 4.5 Maximum strain gage readings on the FRP.............................................. 54
Table 5.1 Results of plastic buckling tests. (Average of three tests in every case)........................................................................ 72 Table 5.2 Predicted ry values. (adapted from Harries and Abraham, 2006)............. 73
x
LIST OF FIGURES
Figure 1.1 Schematic representation of test specimens and behavior...................... 5
Figure 2.1 Slenderness limits associated with beam instabilities. (after Nakashima et al., 2003)................................................................................... 29
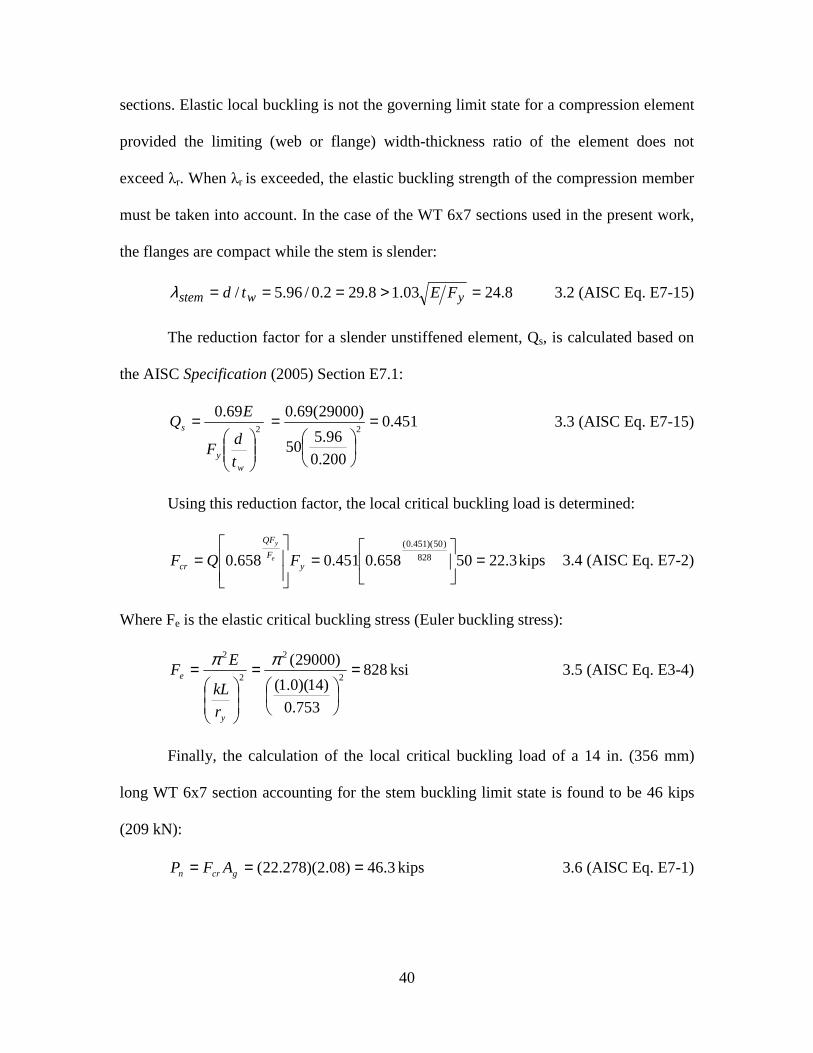
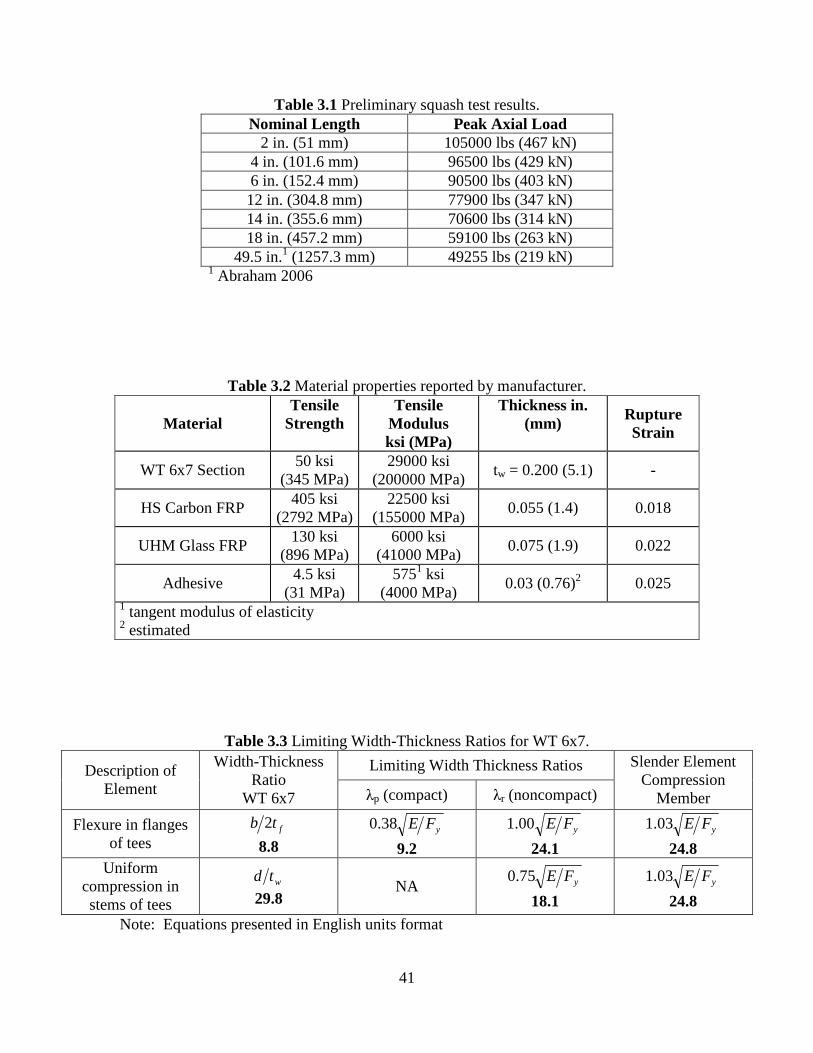
Figure 2.2 Analytical load-deflection behavior of GFRP stabilized steel cantilever. (Accord et al., 2006)................................................................................ 29 Figure 3.1 Peak axial load verses specimen length for squash tests........................ 42 Figure 3.2 Photograph of squash test specimens..................................................... 42
Figure 4.22 Maximum lateral displacements at midheight including representative photographs of the specimens at both 80% and 90% of the axial load capacity....... 67 Figure 5.1 Web bifurcation load eccentricity value calculations.............................. 74 Figure 5.2 Photographic representations of the effects of fiber reinforcement on the behavior of the stem under axial compression..................................................... 75 Figure 5.3 Modified sample hysteresis of brace under cyclic loading to illustrate the effect of the absence of kink formation (original from Bruneau, 1998, adapted from Harries and Abraham, 2006)............................................................................. 75
xii
NOMENCLATURE
Abbreviations
AISC American Institute of Steel Construction
CFRP carbon fiber-reinforced polymer
CISC Canadian Institute of Steel Construction
DWT draw wire transducer
FLB flange local buckling
FRP fiber-reinforced polymer
GFRP glass fiber-reinforced polymer
hmCFRP high modulus carbon fiber-reinforced polymer
hsCFRP high strength carbon fiber-reinforced polymer
LTB lateral torsional buckling
LRFD load and resistance factor design
uhmCFRP ultra high modulus carbon fiber-reinforced polymer
WLB web local buckling
xiii
Notation
Ag gross area
b flange width
Cr first buckling load of bracing members
d depth of the cross section
δ axial deformation
∆ lateral displacement at midlength
ε strain
ex loading eccentricity about the strong axis
ey loading eccentricity about the weak axis
E Young’s modulus
Fcr local buckling critical load
Fcrft flexural torsional buckling capacity
Fcry critical buckling stress
Fe elastic critical buckling stress (Euler buckling stress)
Fy yield stress
Ga shear modulus
KL effective buckling length
λ KL/r; slenderness ratio
λp limiting width-thickness ratio
λc column slenderness parameter
P axial load
xiv
Pcr critical buckling load
Qs Euler buckling reduction factor
ry radius of gyration about the weak axis
ta thickness of adhesive layer
tf flange thickness
tw web thickness
xv
ACKNOWLEDGEMENTS
Firstly, I would like to thank my thesis advisor and committee chair, Dr. Kent A.
Harries for his guidance and assistance throughout my graduate education and the entire
thesis process. I am indebted to him for the vast amount of time and effort he has
provided towards me throughout my graduate career at the University of Pittsburgh.
In addition, I would like to thank my committee members Dr. Piervincenzo Rizzo
and Dr. Amir Koubaa for their support and constructive criticism throughout the thesis
process.
I would also like to acknowledge my fellow graduate student, Karthik
Ramanathan, for his assistance during the research and execution of the experimental
portion of my thesis. Also, I would like to thank the undergraduate students, Lou
Gualtieri and Parker Webb, for their assistance in performing the experimental procedure
of the thesis.
I would like to thank my parents for their love and support not only during my
thesis and educational career, but through all aspects of my life.
Finally, I would like to thank the following companies for supplying the materials
necessary to make this research possible: Fyfe Company LLC, San Diego, CA, and Fox
Industries.
1
1.0 INTRODUCTION
An innovative use of fiber reinforced polymer (FRP) composite materials, to
control the manifestation of local buckling in a flanged steel section, is proposed. In this
method, the high stiffness and linear behavior of FRP materials are utilized to provide
“bracing” against web or flange local buckling in a manner that strategically leverages
the unique mechanical properties of each material in an efficient application domain. The
experimental research reported is aimed at demonstrating the feasibility of using small
quantities of FRP to provide cross-sectional stability through the bonding of FRP strips to
flange elements of the cross-section, thereby increasing the critical load of the member;
constraining plastic flow in the cross-sectional flange elements; and facilitating the
manifestation of a well-formed and stable hysteretic response of the member under cyclic
loading. The member becomes, in effect, an FRP stabilized steel section.
Extensive advances in the application of fiber reinforced polymer (FRP)
composite materials for repair and strengthening of structures and their components have
been made. The merits of FRP retrofit of reinforced concrete members have been well
researched and documented. Relatively limited work however has been conducted
investigating the use of FRP to retrofit steel members (Zhao and Zhang, 2006). Carbon
FRP (CFRP) materials have been used to strengthen steel members (e.g.: Cadei et al.,
2004; Miller et al., 2004), enhance fatigue or fracture performance (e.g.: Jones and
Civjan, 2003) and provide local stability for steel compression members (e.g.: Ekiz and
2
El-Tawil, 2006; Shaat and Fam, 2004). The present work proposes the concept of an FRP
stabilized steel section. It is proposed that through the strategic application of FRP to a
steel compression member a degree of buckling restraint may be affected.
The linear behavior, high strength, and stiffness of FRP materials can be applied
to a steel section to increase member stability. More specifically, small amounts of FRP
can be utilized to increase resistance to flange (FLB) and/or web (WLB) local buckling.
The purpose of such an application is not necessarily to increase load-carrying capacity
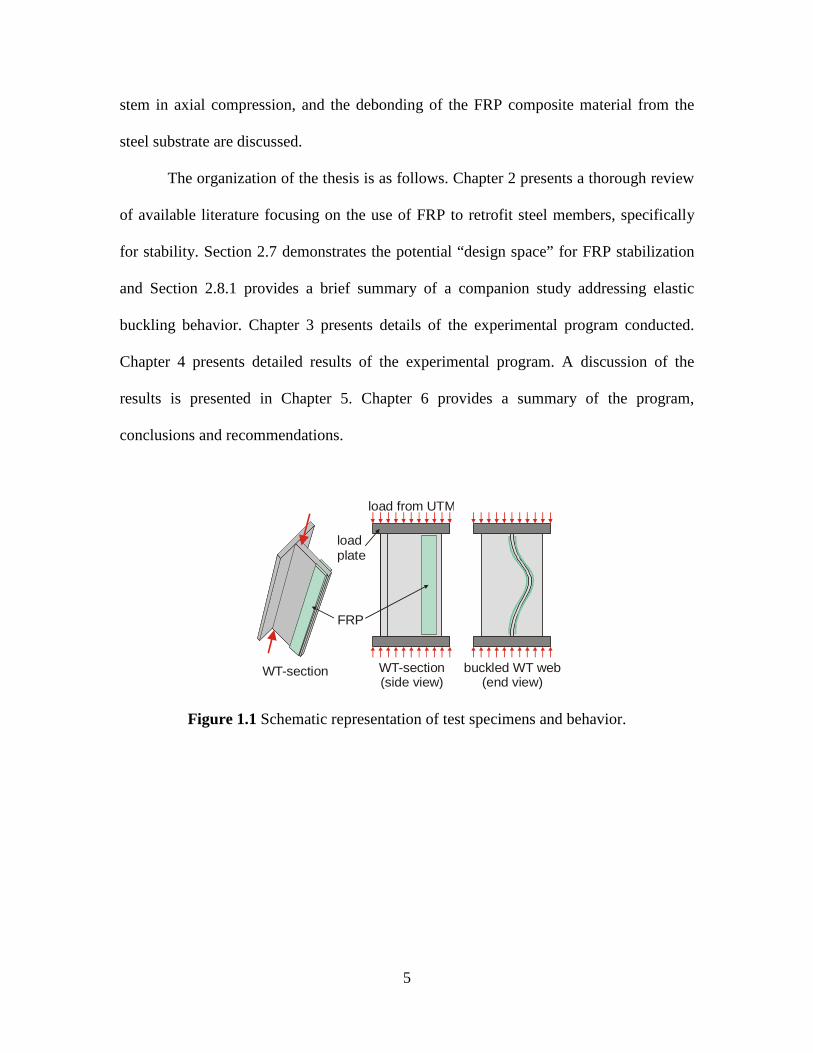
but to restrict plastic flow of the plate member. A schematic representation of the concept
of FRP stabilization and the test specimens used and their behavior is shown in Figure
1.1.
1.1 SUMMARY OF RESEARCH PROGRAM
An experimental program investigating the inelastic buckling behavior of FRP
stabilized members is reported. In all cases, WT 6x7 steel sections were used. Unretrofit
control specimens and four retrofit scenarios were investigated using either high strength
(HS) CFRP strips or ultra-high modulus (UHM) GFRP strips. For each material two
cases were considered: a single 2 in. (50.8 mm) wide strip applied to the WT stem; and
two 1 in. (25.4 mm) wide strips placed on top of each other at the same location. The
FRP strips were applied to each side of the WT stem. The two FRP configurations used
result in the same area of FRP materials having the same centroid applied to the steel
section.
3
Fifteen 14 in. (356 mm) long WT sections were tested in concentric compression
to failure. Three specimens of each detail were tested. The specimen length was selected
to ensure local buckling of the WT stem with no lateral torsional buckling (LTB) of the
section. Each specimen was dominated by web (stem) local buckling (WLB). No
evidence of FLB or LTB was observed. The presence of the FRP increased the axial load
carrying capacity of the WT section between 4% and 14%. The bifurcation loads were
increased as much as 17%. In these tests, the CFRP specimens exhibited a more
pronounced improvement in behavior. Similarly, the specimens having two 1 in. wide
FRP strips performed better that those with one 2 in. strip. Debonding of the FRP strips
was a post-peak phenomenon in all tests. Generally debonding occurred at an applied
load of about 75% of the peak load on the descending branch of the load curve.
1.2 OBJECTIVES OF RETROFIT
When retrofitting steel sections with FRP, the objectives may be a combination of
a) increasing the maximum compressive capacity of the member; and b) increasing the
radius of gyration to improve the buckling behavior. Additionally, the more slender a
member, the more the member behavior deteriorates under cyclic loading (Bruneau et al.,
1998). Decreasing the slenderness of a member ultimately increases the cyclic loading
lifespan as well as its loading capacity.
The slenderness ratio of a compression member is a function of member length
and radius of gyration. In this study, the stem of the WT section tested is locally very
4
slender and presents a specific region at which to concentrate the FRP retrofit application.
Considering only the WT stem, the increase in weak-axis radius gyration (ry) due the
application of the FRP ranged from 12% to 35%. This suggests the prospect of increasing
stability on a local level. However, a negligible increase in ry is determined when the
entire WT cross section is considered; thus there is a negligible effect on the global brace
behavior. The FRP-retrofitted members tested mirror this predicted behavior where the
increases in radius of gyration are proportional to, although approximately three times,
the observed increases in axial load carrying capacity and bifurcation load in the inelastic
stub column tests.
1.3 SCOPE OF THESIS
The objective of the work reported in this thesis is to assess the effectiveness of
FRP composite materials for mitigating inelastic buckling behavior of steel sections. The
work reported here should be considered a pilot study to assess the feasibility of such an
approach. Ultimately, if FRP composite materials prove to provide support for steel
members under inelastic behavior, it may be feasible to improve the cyclic load capacity
of members susceptible to WLB and FLB. Since the behavior of FRP stabilized steel
members is still in its infancy in terms of research, it is the goal of this report to provide a
more thorough understanding of the applications of FRP in this situation. This thesis
focuses on the effects of FRP on axially loaded steel members under inelastic buckling in
terms of; peak load capacity, web bifurcation load, radius of gyration, the effects on the
5
stem in axial compression, and the debonding of the FRP composite material from the
steel substrate are discussed.
The organization of the thesis is as follows. Chapter 2 presents a thorough review
of available literature focusing on the use of FRP to retrofit steel members, specifically
for stability. Section 2.7 demonstrates the potential “design space” for FRP stabilization
and Section 2.8.1 provides a brief summary of a companion study addressing elastic
buckling behavior. Chapter 3 presents details of the experimental program conducted.
Chapter 4 presents detailed results of the experimental program. A discussion of the
results is presented in Chapter 5. Chapter 6 provides a summary of the program,
conclusions and recommendations.
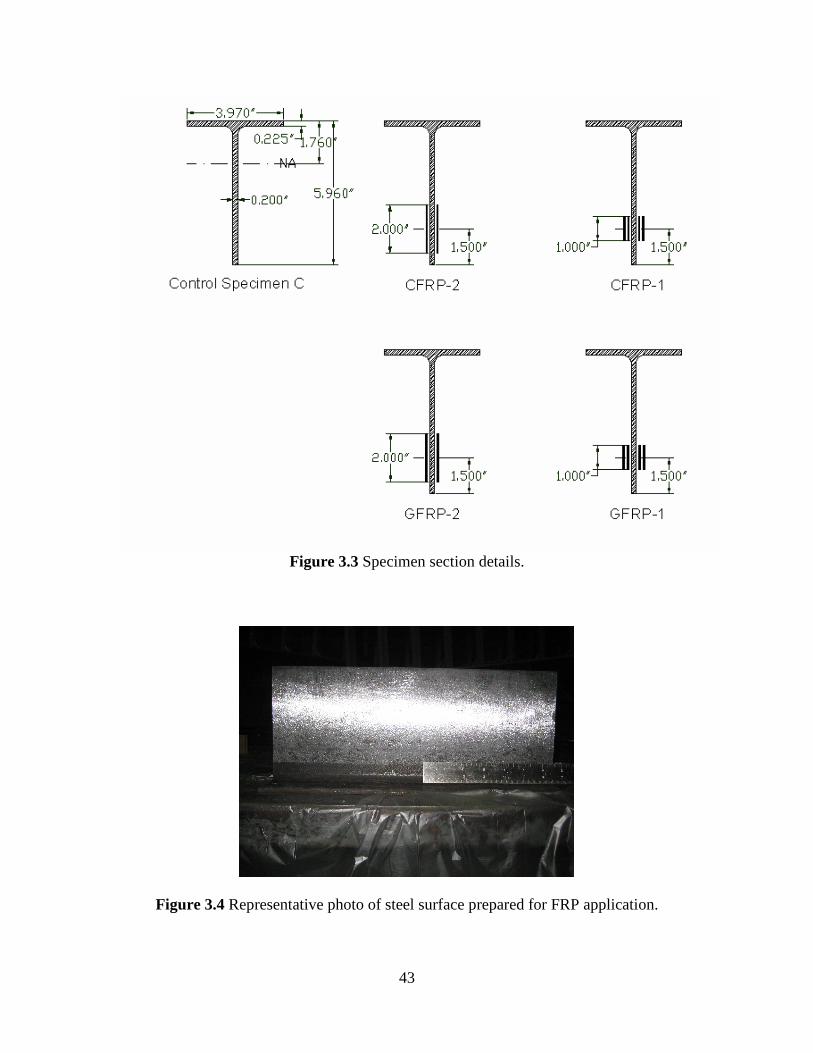
WT-section WT-section(side view)
buckled WT web(end view)
load from UTM
loadplate
FRP
Figure 1.1 Schematic representation of test specimens and behavior.
6
2.0 LITERATURE REVIEW
The study reported in this thesis was conducted to investigate the use of fiber
reinforced polymer (FRP) composite materials for the stabilization of local plastic
buckling of slender steel sections. The use of FRP composite materials in a flanged steel
section was ultimately studied to investigate the ability to control aspects of the
manifestation of local buckling. FRP is a material which exhibits linear elastic behavior
to failure. This behavior, it is proposed, may be used to provide the necessary bracing
force to limit web or flange local buckling in a steel member. By applying small
quantities of FRP composite materials to the web of WT 6x7 sections, it was
hypothesized that the stability of the very slender web would improve. Such an
improvement may result in increased critical load capacity and mitigation of the capacity
loss and “kinking” effects associated with compression buckling under cyclic loading. By
constraining these plastic flow effects within a slender element, a well-formed and stable
hysteretic response under cyclic loading of the slender steel member may be achieved.
This concept has been introduced and is referred to as FRP stabilized steel sections
(Accord et al., 2006; Abraham and Harries, 2007). Previous experimental work has
focused on the elastic buckling behavior of FRP stabilized steel sections (Abraham,
2006). The focus of this work is the affects of FRP stabilization on a steel member prone
to inelastic buckling. This application is believed to be unique but builds on previous
applications of FRP in civil infrastructure as discussed in the following sections.
7
2.1 FRP MATERIALS
Fiber reinforced polymer (FRP) materials combine high-modulus, high strength
fibers with a relatively low-modulus polymeric matrix to produce a material having high
unit strength and unit stiffness. The polymeric matrix serves to protect the fibers and
transfer load between fibers, ensuring a uniform behavior. The strength of FRP is
dependent upon both the fiber type and orientation. FRP composite materials with high
fiber volume ratios are typically found in the civil engineering industry. One of the great
advantages FRP composite materials brings to the civil engineering industry, is their
ability to safely carry large loads and the ease with which they may be employed to
retrofit existing structures (Harries and El-Tawil, 2006).
Two of the most common types of FRP composite materials are those made with
carbon (CFRP) and glass (GFRP) fibers. CFRP can be found in three basic types; high
strength (hsCFRP), high modulus (hmCFRP), and ultra-high modulus (uhmCFRP).
Generally speaking, when the stiffness of CFRP is increased, there is a corresponding
reduction in strength and rupture strain of the FRP material. GFRP, compared to CFRP,
has a much lower modulus but is often more cost effective on the basis of unit stiffness.
When determining the proper type of FRP for a retrofit, it is best to choose a FRP
composite material that has a modulus which is compatible to the substrate to which the
FRP is being applied. CFRP has largely been chosen in retrofitting steel members for this
reason (Harries and El-Tawil, 2006).
8
The mechanics of the FRP itself are extremely refined in themselves. The
individual fibers, yarns or tows (for a glossary of FRP terms used in civil infrastructure,
consult ACI 440R-07) are protected and bound by the polymeric matrix, distributing the
force between the fibers through interfacial shear and providing a degree of stability to
the fibers. Not only does the matrix act as a force transferring system, but it also aids in
protection of the fiber material from the surrounding environment. The most common
FRP systems use epoxy-based resin systems. Similarly, when preformed FRP materials
are used, epoxy-based adhesive systems are preferred for their strength, durability and
ease of use. When utilizing FRP composite materials to retrofit a steel substrate, one must
fully understand the resulting steel-adhesive-FRP system in order to comprehend the
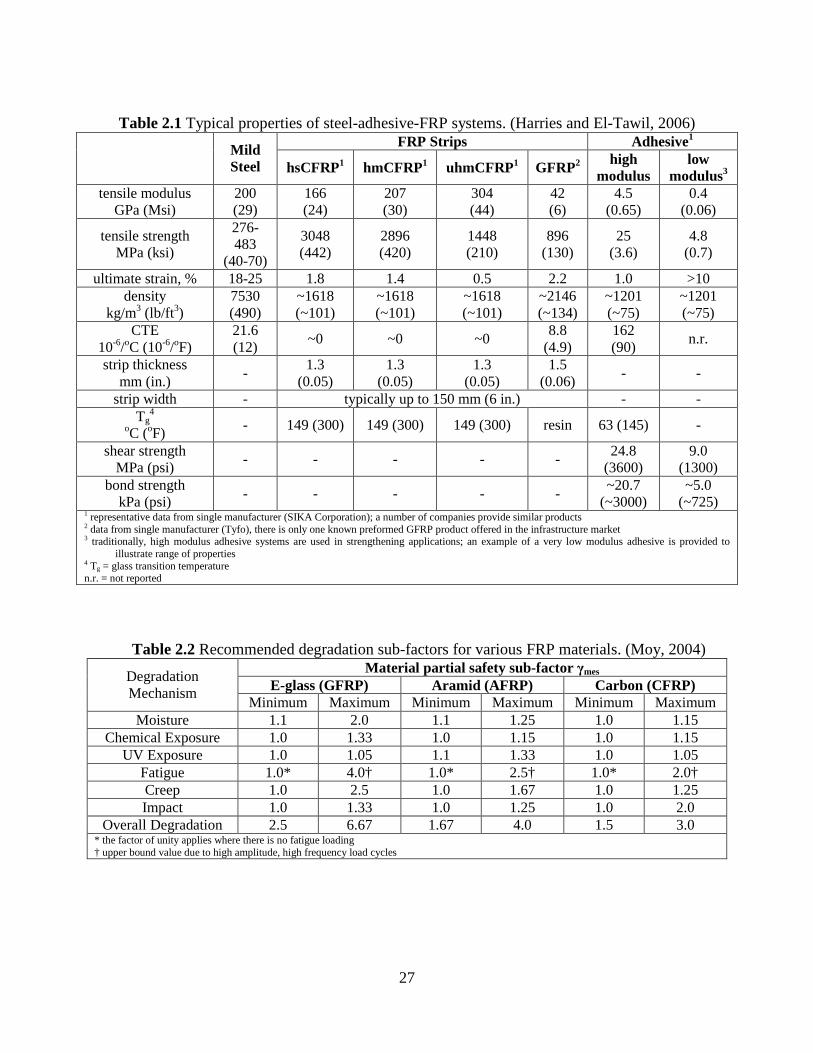
behavior of the new structural system. Table 2.1 provides typical properties of the steel-
adhesive-FRP systems.
2.2 STRENGTHENING OF STEEL USING FRP MATERIALS
Moy (2004a) proposed design guidelines for the strengthening of metallic structures
using FRP materials. These guidelines are formalized in CIRIA’s (UK) Report C595 (Cadei
et al. 2004). According to Moy, when strengthening metallic materials with FRP, several
limit states must be considered. The foremost limit state would be the ultimate limit state,
which would be the partial or total collapse of a structure due to the failure of: a) the FRP in
tension or compression; b) the metallic substrate; c) the adhesive joint; or d) the local or
global buckling of the member. One must also consider the serviceability limit state,
9
addressing member deflection, deformation, or vibration. When utilizing FRP materials to
strengthen metallic structures, it is also imperative to verify that the retrofit will be durable,
introducing a third limiting state focused on time or aging related effects, such as: fatigue,
creep, corrosion, and weathering. Finally, one must consider abnormal or extreme events
such as fire, mechanical impact (collision) and/or seismic resistance, when retrofitting with
FRP composite materials. To address many of these limit states the application process of the
FRP is often critical. When applying FRP to metallic substrates it is essential that the
substrate surface is clean and clear of blemishes, such as corrosion, to ensure a sound bond
between the FRP and the metallic substrate. It is further noted by Moy that GFRP composite
material is seldom used when strengthening metallic structures due to its low modulus of
elasticity.
As with any retrofitting material, the ultimate strength provided is only as good as the
idyllic creation of the FRP composite material itself. This, as in every other aspect of design
engineering, is why safety factors are applied to design codes. A primary concern when
retrofitting any metallic structure with FRP is the long term degradation that may accompany
the retrofit based on the surrounding environment. In particular corrosion or continued
corrosion of the steel substrate may have significant effects on the bond behavior of the FRP.
Degradation of strength, stiffness or bond properties may be caused by several factors (and
their synergies), including; exposure to moisture, ultra-violet light, chemical exposure,
fatigue, and creep. As proposed by Moy (2004a), Table 2.2 displays a list of partial safety
factors proposed for different environmental exposures and different FRP materials. Such
factors would be applied in addition to code-prescribed material resistance or load factors. It
10
can be seen in Table 2.2, that CFRP is generally the most inert of the conventional forms of
FRP material.
When strengthening a metallic structure with a FRP composite system, it is also
essential to optimize the epoxy bond strength between the substrate and the FRP. Poor bond
will hinder the performance of the FRP composite system, ultimately decreasing the
effectiveness of the retrofit. Regular inspections of retrofitted FRP composite metallic
structures are necessary to ensure the safety and durability of the system (Moy, 2004a).
The strengthening of steel members with FRP composite materials has been the
subject of limited research over the past few years. Although the area of strengthening
concrete with FRP composite materials has thoroughly advanced within the civil engineering
industry, the use of such retrofits with steel is still in its relative infancy. With the
advancement of composite materials, they become much more practical as lightweight and
easily installable retrofit materials. Several studies on the strengthening effects of FRP on
steel members have been conducted. Patnaik and Bauer (2004) studied the effects of CFRP
laminates on the strengthening of steel beams in both flexure and shear. The beams tested
under flexural loading were strengthened with CFRP on the tension flange and exhibited a
30% increase in load carrying capacity. The beams tested under shear were retrofitted with
CFRP on the beam webs and exhibited a 62% increase in apparent shear capacity. They
concluded that the composite retrofits strengthened the beam in both flexure and shear, and
that composite FRP materials applied to steel warrant further investigation.
Sayed-Ahmed (2004) conducted an analytical study focused on the effects of local
buckling on thin-webbed steel I-sections with CFRP applied to the areas of local buckling
under compression. The main goal of this technique is to affect a delayed response in the
11
local buckling of the web of the beam. Based on an analytical study where CFRP was applied
at the midheight of the web and assumed to result in a brace point at this location, Sayed-
Ahmed concluded that the application of CFRP strips to these steel members not only
increased the critical load of the member from 20-60%, but it also increased the ultimate
strength by 2-9%. While the study was flawed, it nonetheless introduced the potential of
FRP-stabilized steel members.
Miller et al. (2001), focused on the use of CFRP plates in strengthening a steel bridge
girder on Interstate-95 in Newark, Delaware. The feasibility of such a retrofit was concluded,
and the application in a real world scenario was carried out. It was determined that these
retrofits provide great promise for retrofitting structures for increased strength. The CFRP
plates theoretically increased the capacity corrosion damaged bridge girders from 10-37%
(since this is an active Interstate, no tests to failure can be conducted). The CFRP resulted in
an apparent increase of 11.6% in the structure’s flexural stiffness. As with any real world
scenario testing, further information can be retrieved from such applications to determine the
long-term effectiveness of such retrofits. For instance, it was found that the inclusion of
GFRP plates at the steel interface aided in the prevention of galvanic corrosion.
Shaat and Fam (2004) illustrated the use of FRP sheets for the strengthening of short
HSS steel columns. The use of both CFRP and GFRP perimeter wraps were examined in
axial compression tests of short HSS steel columns. By varying the fiber orientation and FRP
layering it was determined that when two layers of CFRP wraps were both fixed in the
transverse direction an axial strength capacity increase of 18% was recorded. In contrast,
when one layer of the CFRP was oriented longitudinally, and the next layer is applied
transversely, the axial stiffness is increased significantly by 28%. This demonstrates the
12
importance of fiber orientation in steel strengthening capacity. Not only did this test show the
capacity of FRP retrofits to aid in the strengthening of steel, it also displayed the importance
of bonding between the FRP and steel substrate to be a limiting factor in the capacity of the
retrofit. This will be discussed further in following sections.
2.3 FATIGUE BEHAVIOR OF STEEL WITH FRP
The fatigue life of a steel structure is critical to the expected usable or remaining life
of any structure. Jones and Civjan (2003) focused their studies on the application of fiber
reinforced polymer overlays to extend the fatigue life of steel. It was noted through fatigue
experiments that the reduced fatigue-induced stress in the steel, and thus improved behavior,
attributed to the application of FRP materials is largely governed by the adhesive connection
between the steel substrate and the FRP. Generally speaking, there was some demonstrated
effectiveness in increasing of fatigue life, but the behavior of the steel element was entirely
dominated by the adhesive behavior of the epoxy material.
Ekiz (2007) demonstrated improved steel brace fatigue behavior under either seismic
or wind loading conditions using carbon fiber reinforced polymer (CFRP) wrapping. The
improvement in a structure’s ability to maintain greater stability under cyclic loading
scenarios only furthers the potential benefits of the applications of FRP to steel structures.
This application will be explored in the present work.
13
2.4 STRUCTURAL REHABILITATION USING FRP
Rehabilitation, that is: restoring capacity to, rather than specifically strengthening, a
member or structure is presently of great interest in the civil infrastructure community due to
the significant number of deteriorated structures. Through the use of fiber reinforced
polymers, structural rehabilitation may be less time consuming and more easily accomplished
over a broad spectrum of structures. Gillespie et al. (1996), using adhesively bonded FRP
systems, demonstrated the rehabilitation of steel girders having significant corrosion. The use
of composite materials showed great promise for increasing the structural life and stability of
corrosion and fatigue damaged members. Even with corroded girders, it was determined that
composite materials were able to provide significant rehabilitation effect to structural
elements. Not only was the stiffness of the degraded members improved with the application
of FRP composite materials, the desired loads were reached without adhesive failure between
the steel substrate and the composite materials. Through further testing it was determined that
fiber reinforcement additionally provided a means to reduce fatigue crack growth, ultimately
increasing the life of the steel member, in turn leading to a longer life span of the structure. In
this application it is noted that the ultimate strength of the structure was not completely
returned to its “as built” value, however the rehabilitation restored sufficient capacity to
safely resist present-day load demands.
Hollaway and Cadei (2002) explored the technique of upgrading metallic structures
with FRP materials. Through their studies, it was concluded that with the application of FRP
materials to existing metallic structural systems, the working life of a structure could be
extended 1.5 times its original lifespan. In addition to this, the cost saving introduce by using
14
FRP were in the range of 17.5% over alternative steel rehabilitation methods. As previously
mentioned, the adhesive bond of the FRP to the steel is extremely critical in this
rehabilitation method. It is critical that both the FRP and steel substrates surfaces are
properly prepared in order to maximize the epoxy bond. Not only did this report focus on the
rehabilitation properties of FRP, but it also noted the use of GFRP in offshore platforms as a
form of fire protection for the structural member. Thus GFRP has been used in prolonging
the life of a structural element in extreme environments. These findings in the rehabilitation
of both experimentally and field tested steel members through the use of FRP, demonstrate
the practicality and promise of FRP in the field of structural rehabilitation.
2.5 BOND INTERFACE BETWEEN FRP AND STEEL SUBSTRATE
As discussed in previous sections, the interface bond between the fiber reinforced
polymer (FRP) composite material and the steel substrate is one of, if not the most important
factor determining in the effectiveness of FRP on the behavior of steel. The bond of the FRP
to the steel substrate dictates the extent to which the FRP may aid the structural steel element
in improving its capacity, ductility, and/or delaying effects of both local and lateral torsional
buckling. Sebastian and Luke (2007) explored the interface failure mechanics of FRP
reinforced steel beam members. These tests focused on the interface between steel beams and
adhesively bonded elastic reinforcing strips to determine the stresses developed in the
interface between the composite and the steel. Several variations of the composite material
were tested on the steel substrate. First, the affects of multiple layers of the elastic FRP strips
15
were studied. The effects of tapering the composite material were analyzed in the
determination of the plane stress interface between the steel and the composite material. To
minimize bond stresses, the FRP should change in cross-sectional area with the moment
diagram of the steel beam (i.e.: optimize FRP reinforcement to moment demand). The effects
of bond imperfections on steel members with bonded FRP materials loaded in tension were
the second topic explored in this study. It is important to determine defects or bond
imperfections, due to the fact that these imperfections may ultimately control the capacity of
the composite member. Finally, the use of elastic FRP strips in the compression region of the
steel members was analyzed.
Sebastian and Luke (2007) provide several conclusions about the interface failure
mechanics of the FRP material and the steel substrate. For the bonded FRP in tension, failure
of the composite member occurred due to buckling of the member and the separation of the
composite strip from the surface of the steel. In the instance of the four layered composite
strip, it was found that the FRP materials exhibited interlaminar failures before separating
from the steel substrate. Sebastian and Luke cite bond imperfections, localized bending of the
strips, and the presence of adhesive fillets as affecting this behavior. During experimental
testing, several of the beams maintained their final load through larger deflections than may
be expected. This is most likely due to the redistribution of the stresses to the composite
material while buckling occurred in the steel member.
Based on the strains in the FRP material, the peak available FRP-to-steel bond stress
capacity was determined to be 3.55 ksi (24.5 N/mm2). The observed bond stress is largest at
the ends of the FRP material. For the FRP strip under compression, buckling failure of the
strip was observed in the region of steel buckling (largest deformations) and eventually led to
16
the brittle separation of the edges of the composite in this region. Sebastian and Luke
concluded that minimally invasive strain measuring techniques may aid in the further
quantification of bond stresses between substrates and composite materials. Also, the fatigue
performance of steel retrofitted with composite materials should be explored further to
determine the full potential of composite technology.
Schnerch et al. (2005) explored the bond behavior of CFRP-strengthened steel bridge
girders. This focused on uncracked steel girders, strengthened with CFRP strips. These ultra-
high modulus CFRP (uhmCFRP) strips had an elastic modulus of 49,000 ksi (338 GPa) and
an ultimate elongation of 0.0033; they had a linear stress-strain behavior. The test specimens
utilized in this experiment were wide flanged steel members, designated SLB 100 x 4.8. The
first number designates the nominal depth in millimeters and the second designates the mass
in kilograms per meter. To simulate a bridge girder, a steel plate was welded to the
compression flange to simulate a composite concrete deck. The CFRP composite material
strips were adhered to the tension flange, each strip having a width of 1.42 in. (36 mm) and a
thickness of 0.06 in. (1.45 mm). The development length provided for the CFRP strips
ranged from 1.97 in. (50 mm) to 7.87 in. (200 mm). The development length was defined as
“the distance from one of the load points to the end of the CFRP strip, in a region of constant
shear force and decreasing bending moment towards the end of the strip.” That is to say, the
length of the CFRP extending into the shear span of a beam loaded in four point bending.
Schnerch et al. loaded each steel specimen until a tension flange strain of 0.008 was
achieved. One of two events occurred: 1) if sufficient development was provided, the CFRP
ruptured at a strain near its ultimate elongation; or 2) the CFRP debonded from the steel due
to insufficient development length.
17
When determining the most suitable adhesive for applying CFRP to a steel substrate,
one must account not only for the CFRP strain at failure and the mode of failure, but also the
adhesive material which can fully utilize the CFRP at the shortest development length. The
shortest development length adhesives, having development lengths of 3-4 in. (76-102 mm),
were Weld-On SS620 and SP Spabond 345. “The remaining adhesives had development
lengths as follows: the Vantico Araldite 2015 and Jeffco 121 adhesives had a development
length of 4-5 in. (102-127 mm), Fyfe Tyfo MB had a development length of 6 in. (152 mm)
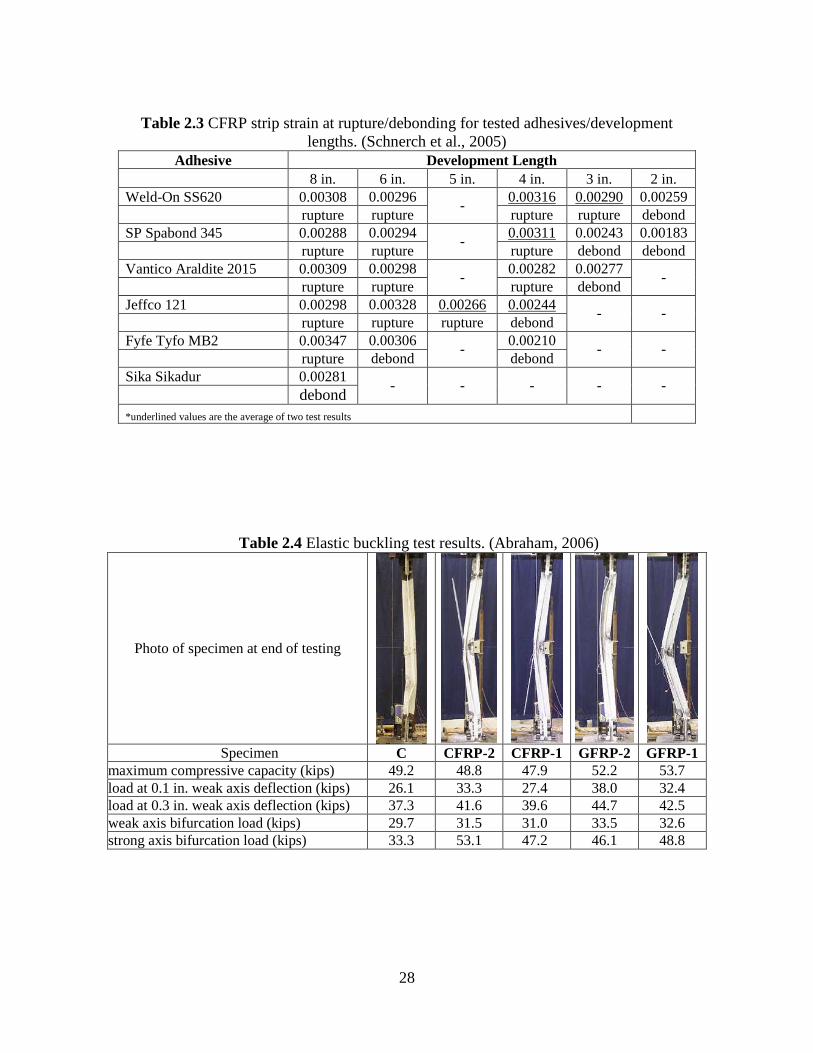
and Sika Sikadur 30 had a development length of more than 8 in. (203 mm). The CFRP strip
strain at rupture or debonding for the tested adhesives and respective development lengths
are given in Table 2.3. The development length of the CFRP strips used, independent of
adhesive type, as determined by Nozaka et al. (2005), is less than 8 in. (203 mm). Schnerch
et al. concluded that the bond of the FRP to the steel is largely dependent upon surface
preparation of the steel.
A complete discussion of factors affecting bond to steel substrates is beyond the
scope of the present work. Cadei et al. (2004) provides an overview of factors affecting FRP-
to-steel bond including those associated with a) surface preparation; b) environmental
exposure; c) creep and fatigue behavior; and, d) issues associated with mitigating galvanic
corrosion.
18
2.6 FIELD APPLICATIONS OF FRP ON STEEL STRUCTURES
Several applications of FRP to steel have been used in the engineering industry to
investigate and demonstrate this burgeoning technology. Moy (2004b) reports three case
studies of CFRP strengthening of metallic structures on the London Underground. The first
study focused on the retrofitting of a steel bridge D65A. This structure serves as a bridge for
Underground trains, over a road in Acton, West London. The bridge has both main and
secondary girders, where the secondary girders directly support the railway track. The
loading on these secondary girders is almost entirely live loads, and fatigue is a major
concern. To extend the life of the girders, the live load stresses were to be reduced by 25%.
Traditionally, this would be accomplished through the addition of welded steel plates. Since,
the steel plates would require extensive scaffolding; the road below the railway bridge would
have to be shut down. This problem was averted, by using lighter weight CFRP material. The
steel substrate was cleaned, and the CFRP plates were easily applied with epoxy. A major
concern was the frequent train loading while the epoxy adhesive was curing. Testing was
performed to assess the effects of cyclic loading during cure on the adhesive bonding the
CFRP to the steel. After confirming the results would be adequate for the bridges’ needs,
CFRP plates were applied to the underside of the bridge. As a result of the CFRP application,
a 24% decrease in the live load stresses was reported, accomplishing the objective of the
retrofit while maintaining the road beneath the bridge open during application.
The second study reported by Moy (2004b) was vent shaft V129, in Shadwell Station,
East London Line. The vent struts needed reinforcement, while allowing the trains in the
tunnel below to keep running. CFRP was applied to the struts using the DML RIFT (Resin
19
Infusion under Flexible Tooling) technique. The struts were successfully strengthened, and
no sign of deterioration was noted. Finally, a third case study focused on the tunnel support
structure on the Circle Line. The strengthening of the ceiling of the tunnel was accomplished
using an all CFRP beam system. These cases demonstrate the versatility of FRP composite
materials in solving structural deficiencies in existing structures.
Chacon et al. (2004) studied the application of CFRP to the Ashland Bridge, in
Delaware, USA. Through the application of CFRP plates to the beams of the bridge, the
stiffness of the beams and distribution of applied loads was improved. The retrofit decreased
the strain in the beams by 5.5%.
2.7 STRUCTURAL STABILITY OF STEEL SECTIONS
Structural stability is a significant and large area of study. In the following brief
synopses, three studies which have been used to help to identify potential design spaces for
the use of FRP stabilization are introduced. Nakashima et al. (2002) focused on lateral
instability and lateral bracing of steel beams subjected to cyclic loading. One must first
understand the behavior of steel members under such loading, before determining the impact
of retrofits to aid or inhibit such behaviors. Lateral instability behavior is affected by the type
of loading, whether it is cyclic or monotonic loading. Particularly when the slenderness ratio
about the weak axis of a steel member is large, cyclic load behavior is degraded in
comparison with monotonic load behavior; this is largely due to the extent of out-of-plane
deformations. The eventual formation of a plastic “kink” (occurring at the point of largest
20
out-of-plane deflection) also impairs the behavior of compression members and tension-
compression members such as braces (Bruneau et al., 1998). This behavior will be discussed
further in Chapter 5.
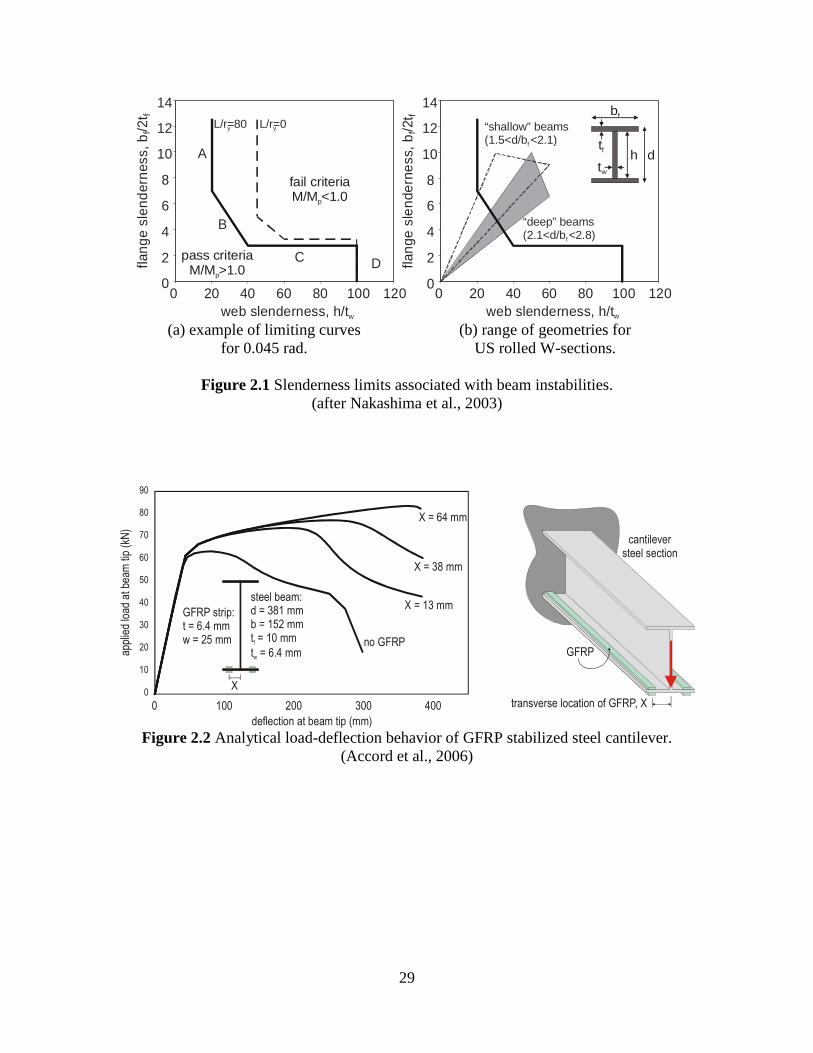
Nakashima et al. (2002) developed limit curves relating web and flange slenderness
to expected instability behavior. Figure 2.1 shows such a curve generated for the
performance objective that the moment capacity meets or exceeds the plastic moment
capacity (M/Mp > 1.0) at a rotation capacity of 0.045 radians. The curve shown is
additionally coupled with the requirement that L/ry < 80, also to ensure M/Mp > 1.0. Such
limit curves may be drawn for any performance objective. The curves describe four distinct
“regions” of behavior: A: behavior controlled by flange local buckling (FLB) followed by
lateral torsional buckling (LTB); B: behavior controlled by LTB occurring almost
simultaneously with FLB; C: behavior controlled by web local buckling (WLB) followed by
almost simultaneous FLB and LTB; and, D: behavior controlled by web shear buckling
(WSB) resulting in rapid loss of capacity upon onset of buckling due to reduction in beam
depth.
LTB can be mitigated by improving bracing. As the slenderness approaches zero (i.e.:
L/ry � 0), the limit curve shifts to encompass a greater range of beam geometries.
Additionally, as LTB is mitigated, Region B is minimized and there is a more abrupt
transition between Regions A and C. The ranges of geometric properties of typically
available U.S. wide flange beam shapes are shown in Figure 2.1b. Only 49 of 146 available
W-sections satisfy the performance objective shown (Nakashima et al., 2003). Additionally,
most behavior is predicted to be in Regions A and B. Mitigating LTB will shift the limit
curve to the right and “sharpen” the Region B transition. In such a case, more sections will
21
satisfy the performance criteria but those remaining will be dominated by the more critical
Region A behavior. Thus it is demonstrated that there is a considerable design space for FRP
stabilized sections to mitigate the critical FLB behavior.
Uang and Fan (2001) investigated the cyclic stability criteria for steel moment
connections with a reduced beam section. Reduced beam section moment connections are
growing in usage throughout the industry. These connections have a portion of the beam
flange intentionally removed a short distance from the connection in order to develop a
controlled plastic hinge having a capacity less than the adjacent connection, thereby
“protecting” the connection from plastic deformations. This reduction in the beam flange
increases the importance of lateral bracing of the steel beam member. In their experiments,
55 full-scale specimens of reduced steel beam sections were analyzed to assess the
relationship between plastic rotation capacity and rate of plastic hinge strength degradation.
The observed response of these sections was largely accounted for by the slenderness ratio
associated with web local buckling and not the lateral-torsional buckling of the member. The
failures involved controlled local flange buckling leading to crippling of the adjacent slender
web; this results in a “collapse” of the section as the depth and thus plastic capacity is
dramatically reduced. It was found that when the reduced beam section is placed with a
composite concrete slab it only improves this behavior in positive bending region (by
providing lateral bracing to the compression flange); whereas in the negative bending region,
the concrete slab provided little assistance in enhancing the plastic rotation capacity of the
reduced beam section.
Uang and Fan (2001) quantified the interaction between lateral torsional buckling
(LTB) and flange (FLB) and web local buckling (WLB). The relationship between beam
22
rotation capacity and flange, web and beam slenderness ratios highlight the interaction
between buckling behaviors and demonstrated a) that behavior is more sensitive to WLB
behavior where it is critical; and b) that there is a relatively weak interaction with LTB in any
case. Uang and Fan proposed equations to provide flange, web and beam slenderness limits
based on desired rotation capacity. The reality however is that such slenderness limits are
only be achievable with more expensive “built-up sections” (those fabricated from welded
plates rather than rolled sections). Thus the design space for improving stability behavior
through FRP stabilization is again demonstrated.
Okazaki et al. (2006) studied the stability requirements for beams in seismic load
resisting steel moment frames. The more rotation in a steel member, the more important the
effects of local buckling become. The greater the rotation demands, the smaller the flange
and web width-thickness ratios must be. Local buckling or a combination of local buckling
and lateral torsional buckling play a large part in the degradation of strength. When dealing
with shallow wide flange beams (depth-width ratio of 2.05), and a target rotation of no
greater than 0.03 radians, lateral torsional buckling is negligible. However, when dealing
with deep beams (depth-width ratio of 2.84), and a target rotation of 0.04 radians, lateral
torsional buckling is the controlling factor more so than the local buckling of the structural
steel element. This again demonstrates the importance of the slenderness of an element and
the role which lateral torsional buckling and local buckling play in the stability of a structural
steel element.
23
2.8 ENHANCING STABILITY OF STEEL SECTIONS USING FRP
Ekiz et al. (2004) looked at the possibilities of enhancing plastic hinge behavior in
steel flexural members using carbon fiber reinforced polymer (CFRP) wraps. They
investigated four steel flexural specimens under reversed cyclic loading; two of the
specimens were completely wrapped in CFRP in the plastic hinge region. Variables
considered were the fiber orientation and the wrapping scheme on the structural steel
members. One of the goals of this program was to introduce the concept of utilizing CFRP
reinforcement in the plastic hinge region of steel members to aid in decreasing local
slenderness and lateral torsional buckling constraints, ultimately aiding in the advancement
of CFRP materials in new construction and seismic region improvements.
Ekiz et al. (2004) used two double-channel built up members, and placed CFRP
wraps around the expected plastic region of the elements. After completing the reversed
cyclic loading tests on the structural frame, the behavior of the unwrapped steel sections was
compared to that of the CFRP-wrapped sections. The CFRP wrapping in the plastic hinge
region greatly improved the behavior of the structure. It was concluded that CFRP wrapping
can increase the size of plastic hinge region (thus permitting greater energy dissipation
through plastic deformation), while inhibiting local buckling and delaying lateral torsional
buckling. This ultimately increases the rotational capacity, improves structural fatigue
behavior, and aids in the dissipation of energy throughout the plastic hinge region. From
these conclusions, Ekiz et al. suggested that the use of CFRP wraps in areas of high seismic
activity may be suitable for upgrading existing structures.
24
Accord et al. (2006) utilized nonlinear finite element analysis to examine the effects
of low modulus GFRP strips bonded to I-shaped sections developing plastic hinges under
moment-gradient loading. The provision of GFRP strips provided effective bracing of the
flange outstands delaying the formation of local buckling of the compression flange,
ultimately increasing structural ductility. Representative results from Accord et al. are shown
in Figure 2.2. In this figure, the same amount of GFRP is located at different locations on the
slender flange. As may be expected, the greatest improvement in behavior is affected when
the GFRP is located as close to the flange tips as possible.
2.8.1 Companion Study on FRP Stabilization for Elastic Buckling (Abraham, 2006)
The present thesis represents one part of an experimental program investigating both
elastic and inelastic buckling behavior of FRP stabilized members. This work reports
inelastic buckling studies while Abraham (2006) discussed elastic buckling behavior. In both
studies, specimen sections and retrofit details are the same and are reported in Chapter 3.
In Abraham’s work, the WT 6x7 sections were cut to a length of 65.5 in. (1664 mm).
A double angle connection engaging only the stem of the WT was designed to a) reflect an
AISC-compliant (2005) brace connection; and b) result in a transfer of forces coincident with
the neutral axis of the WT section. All specimens were heavily instrumented (similar to that
reported in Chapter 3) and tested under concentric cyclic compressive loading to failure.
Each brace was initially subjected to a small tensile force of approximately 2 kips (8.9 kN) to
allow the loading sequence to pass through zero in each cycle. The first loading cycle
imposed a maximum 5 kips (22.2 kN) compressive load and then returned to the initial 2 kips
25
tensile load. The following cycles incrementally increased the maximum compressive load
by 5 kips each cycle and each returned to the initial 2 kips tensile load upon cycle
completion. Each specimen reached at least 45 kips (200 kN) in this manner and cyclic
loading was continued until failure occurred as defined by either excessive lateral deflection
or FRP strip debonding.
A summary of test results and images of each specimen are shown in Table 2.4. Each
specimen exhibited elastic lateral torsional buckling (LTB) typical of a slender WT section.
This behavior is characterized by large lateral translations of the stem tip, twist about the
centroid and nominal strong axis translation as shown in Table 2.4. For the very slender stem
WT tested (d/tw = 29.8), plastic ‘kinking” of the stem was observed with increased axial (and
thus lateral) displacement. This behavior is particularly obvious in Specimen C (Table 2.4).
The presence of FRP on subsequent specimens helped to mitigate this post-buckling
crippling.
The FRP retrofit specimens did not provide a significant increase in axial capacity
compared to the control specimen. The GFRP-2 and GFRP-1 retrofit specimens exhibited 6%
and 9% increases in axial capacity, respectively. Specimens CFRP-2 and CFRP-1 exhibited a
slight decrease in axial capacity as compared with the control specimen, possibly resulting
from misalignment of the specimen in the test frame.
Despite little effect on axial capacity, the retrofit specimens did exhibit greater
control over the weak-axis lateral displacement as well as the weak and strong-axis
bifurcation loads. Weak-axis lateral displacement values of 0.1 in. (2.5 mm) and 0.3 in. (7.6
mm), representing mid-height lateral displacements of L/655 and L/218, respectively, are
arbitrarily selected to illustrate specimen behavior. A weak-axis lateral deflection of 0.1 and
26
0.3 in. occurred at higher loads for the FRP-retrofitted specimens than for the control
specimen. The load to cause a 0.1 in. weak-axis lateral deflection increased between 5% and
46% for the FRP-retrofitted specimens. The load to cause a 0.3 in. weak-axis lateral
deflection increased between 6% and 20% for the FRP-retrofitted specimens. An increase in
the weak-axis bifurcation load ranging from 5% to 13% was observed. The strong-axis
bifurcation load was also observed to increase suggesting a mechanism where the FRP
provides stability to the relatively unstable stem and ultimately delays the onset of strong-
axis buckling of the brace member.
2.9 RELATIONSHIP TO PRESENT WORK
The research discussed in this chapter was aimed at providing some justification
and background for investigating the behavior and use of FRP materials for stabilization
of the plastic buckling of slender steel sections. In the following chapters, the use of FRP
materials in a flanged steel section is studied to assess the ability to control the
manifestation of local buckling of a steel section. A companion study (Abraham, 2006)
focused on the elastic buckling behavior of FRP stabilized steel sections, whereas the
focus of this work is inelastic buckling behavior.
27
Table 2.1 Typical properties of steel-adhesive-FRP systems. (Harries and El-Tawil, 2006)
strip width - typically up to 150 mm (6 in.) - - Tg
4 oC (oF)
- 149 (300) 149 (300) 149 (300) resin 63 (145) -
shear strength MPa (psi)
- - - - - 24.8
(3600) 9.0
(1300) bond strength
kPa (psi) - - - - -
~20.7 (~3000)
~5.0 (~725)
1 representative data from single manufacturer (SIKA Corporation); a number of companies provide similar products 2 data from single manufacturer (Tyfo), there is only one known preformed GFRP product offered in the infrastructure market 3 traditionally, high modulus adhesive systems are used in strengthening applications; an example of a very low modulus adhesive is provided to
illustrate range of properties 4 Tg = glass transition temperature n.r. = not reported
Table 2.2 Recommended degradation sub-factors for various FRP materials. (Moy, 2004) Material partial safety sub-factor γmes
Overall Degradation 2.5 6.67 1.67 4.0 1.5 3.0 * the factor of unity applies where there is no fatigue loading † upper bound value due to high amplitude, high frequency load cycles
28
Table 2.3 CFRP strip strain at rupture/debonding for tested adhesives/development
lengths. (Schnerch et al., 2005) Adhesive Development Length
8 in. 6 in. 5 in. 4 in. 3 in. 2 in. Weld-On SS620 0.00308 0.00296 0.00316 0.00290 0.00259 rupture rupture
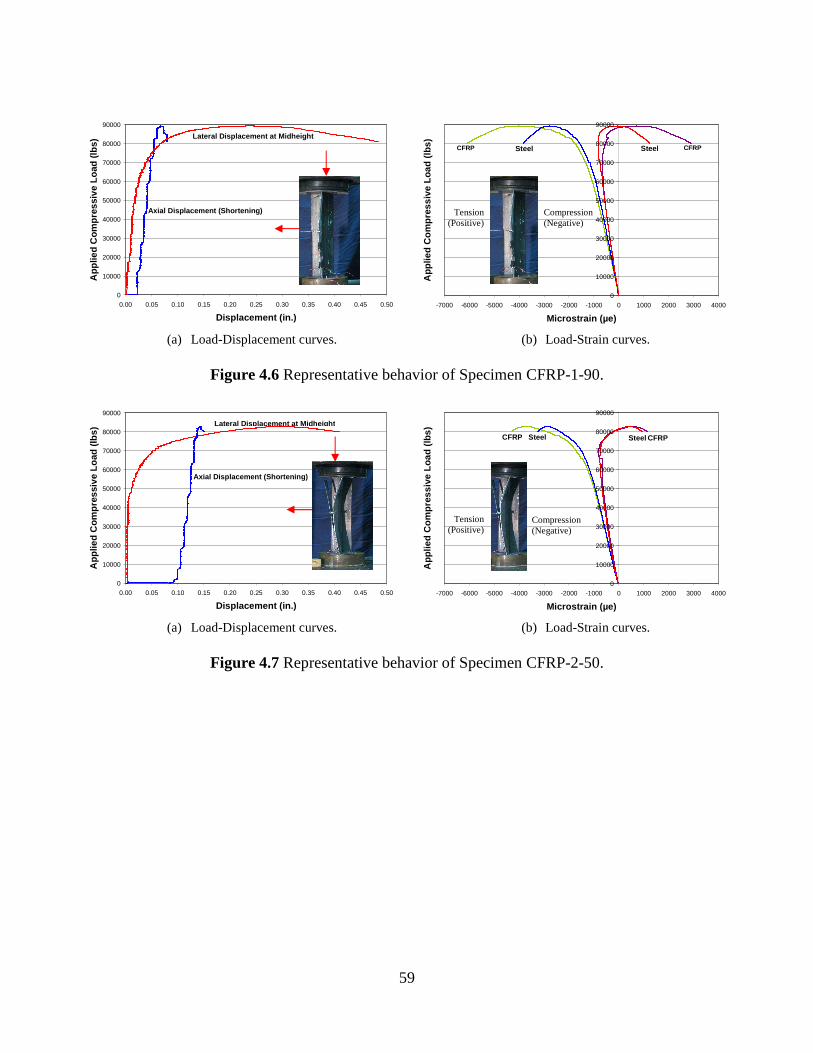
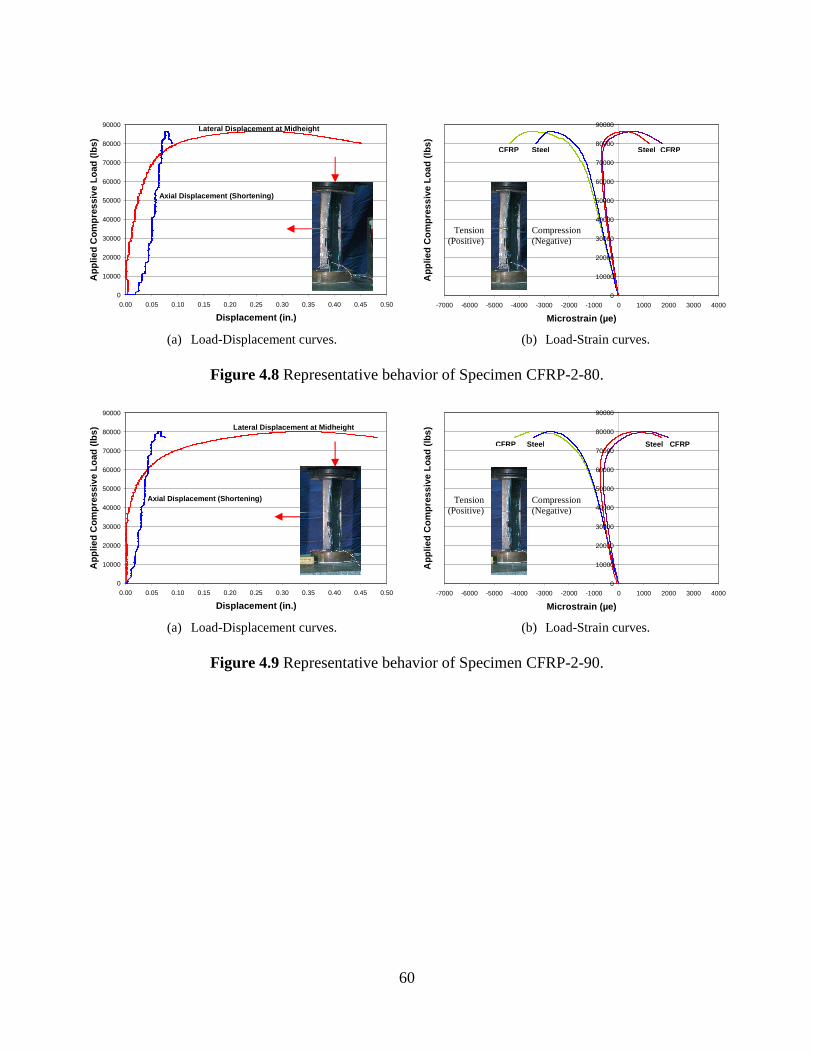
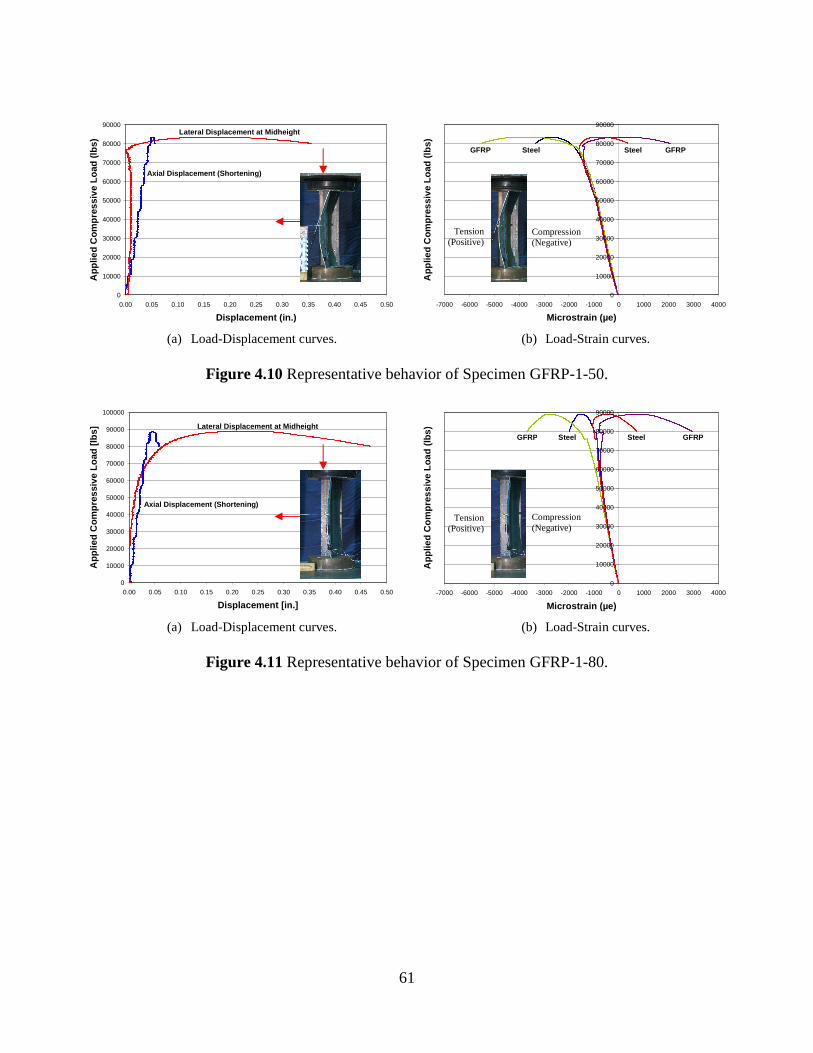
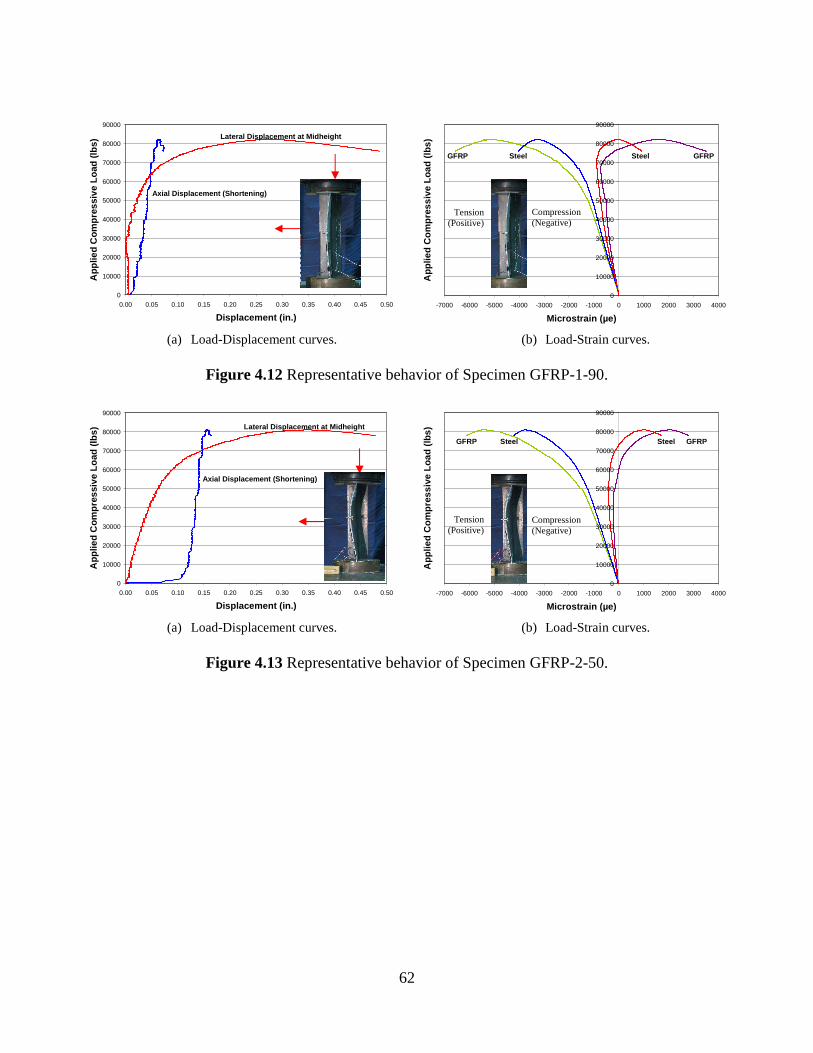
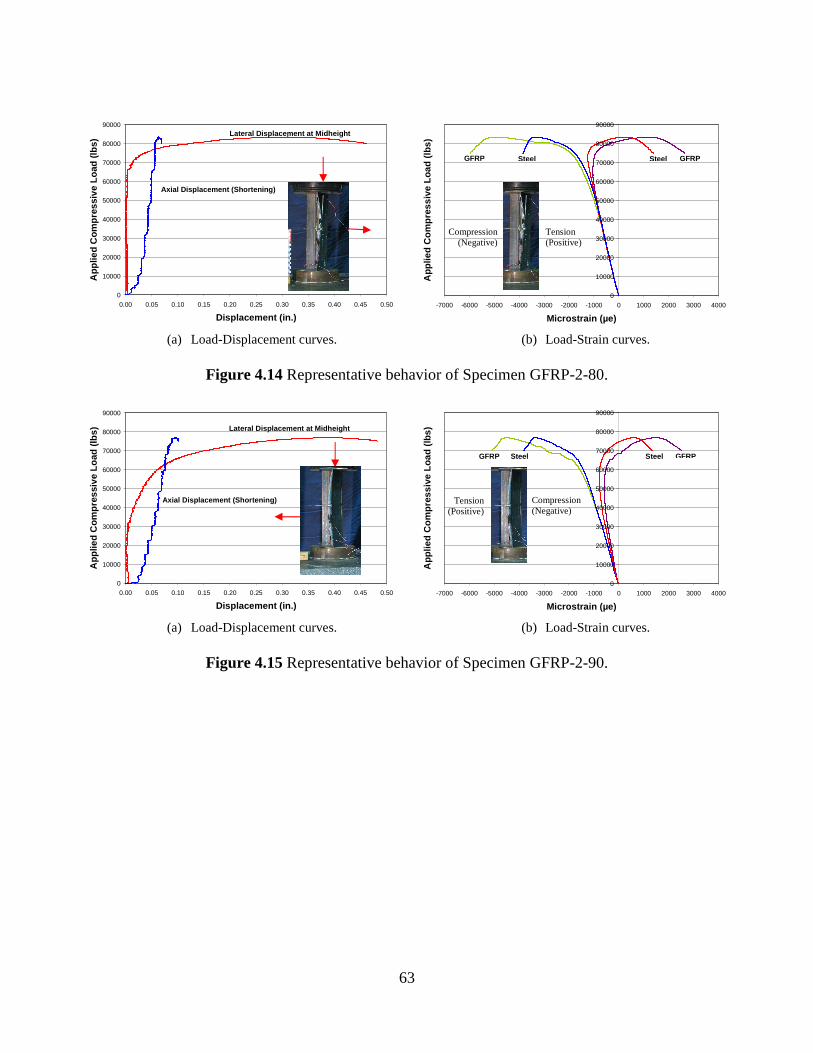
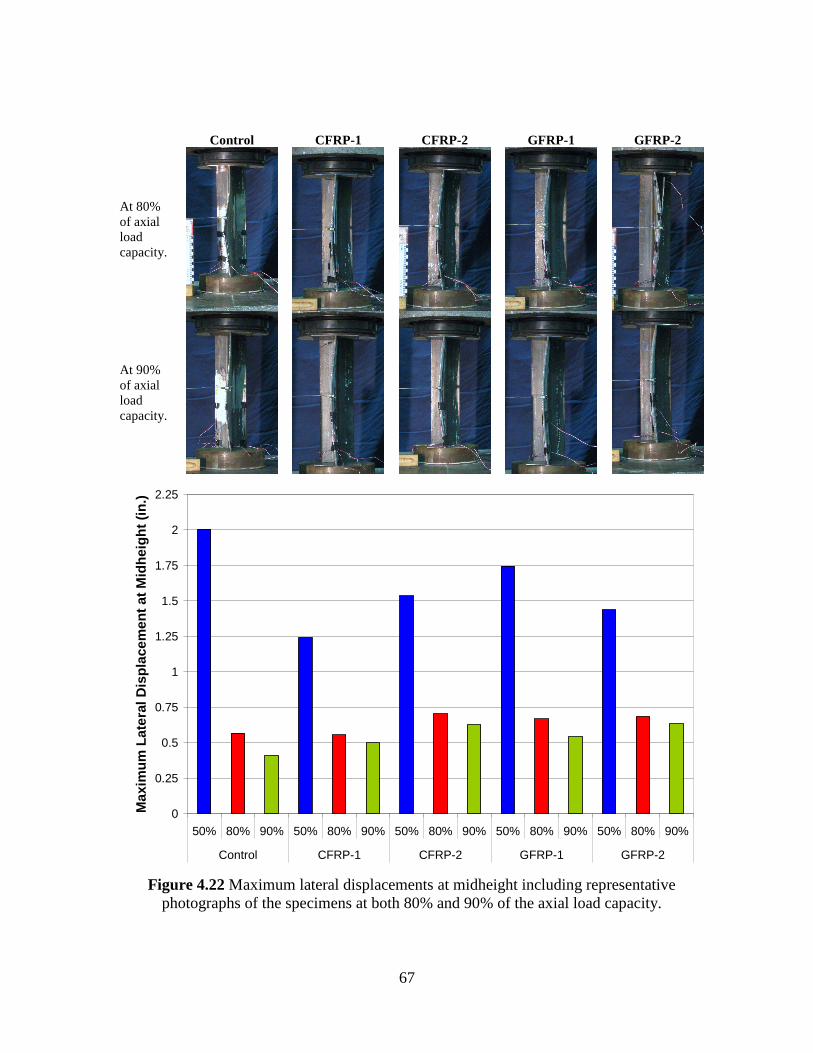
1 in all cases but GFRP-2-80, the tension side of the stem was recorded by gage 7 and the compression side by gage 8. In GFRP-2-80 this is reversed (i.e.: the web buckled in the other direction)
Figure 4.22 Maximum lateral displacements at midheight including representative
photographs of the specimens at both 80% and 90% of the axial load capacity.
68
5.0 EXPERIMENTAL DISCUSSION
This chapter deals with the interpretation and discussion of the data and results
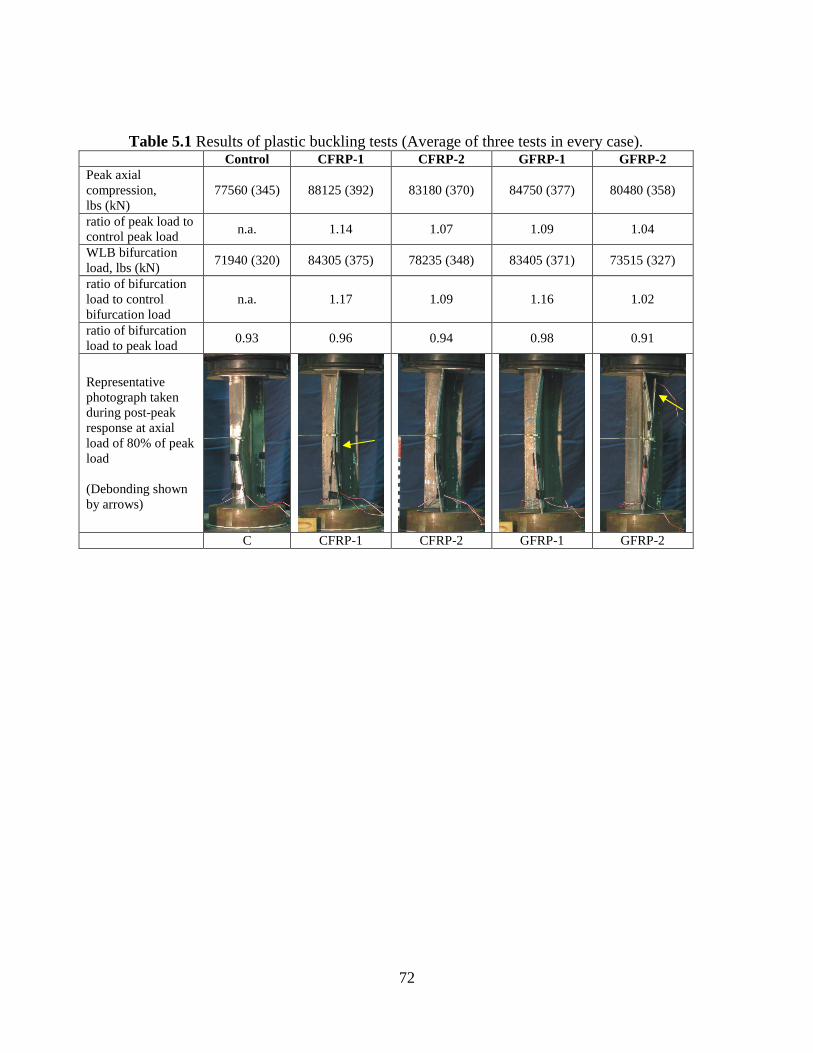
presented in Chapter 4. A summary of the peak load behavior is provided in Table 5.1. It
is seen that the presence of the FRP results in a marginal improvement in axial load
carrying capacity. This effect, as expected, is shown to be proportional to the increase in
radius of gyration affected by the presence of the GFRP.
5.1 WEB BIFURCATION LOAD
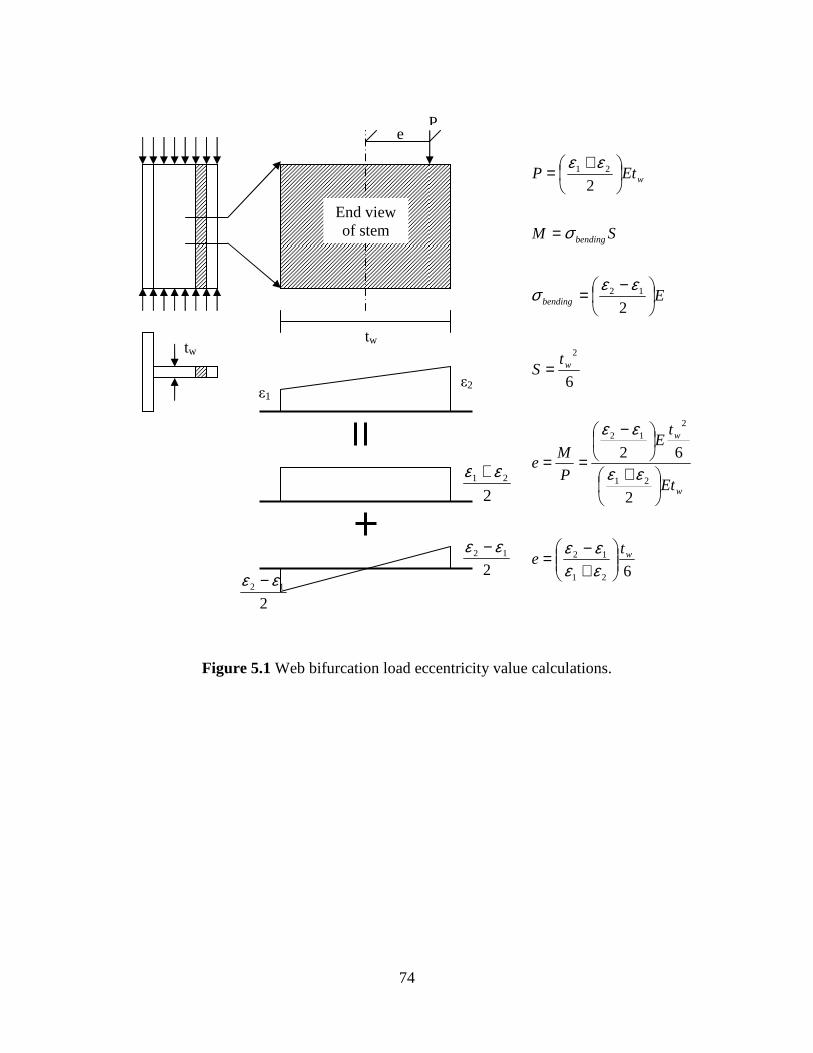
The web local buckling bifurcation load is the applied load at which web local
buckling at the tip of the stem is initiated. Prior to bifurcation, the strain gages on either
side of the web (gages 1 and 2) essentially “track” each other in compression indicating
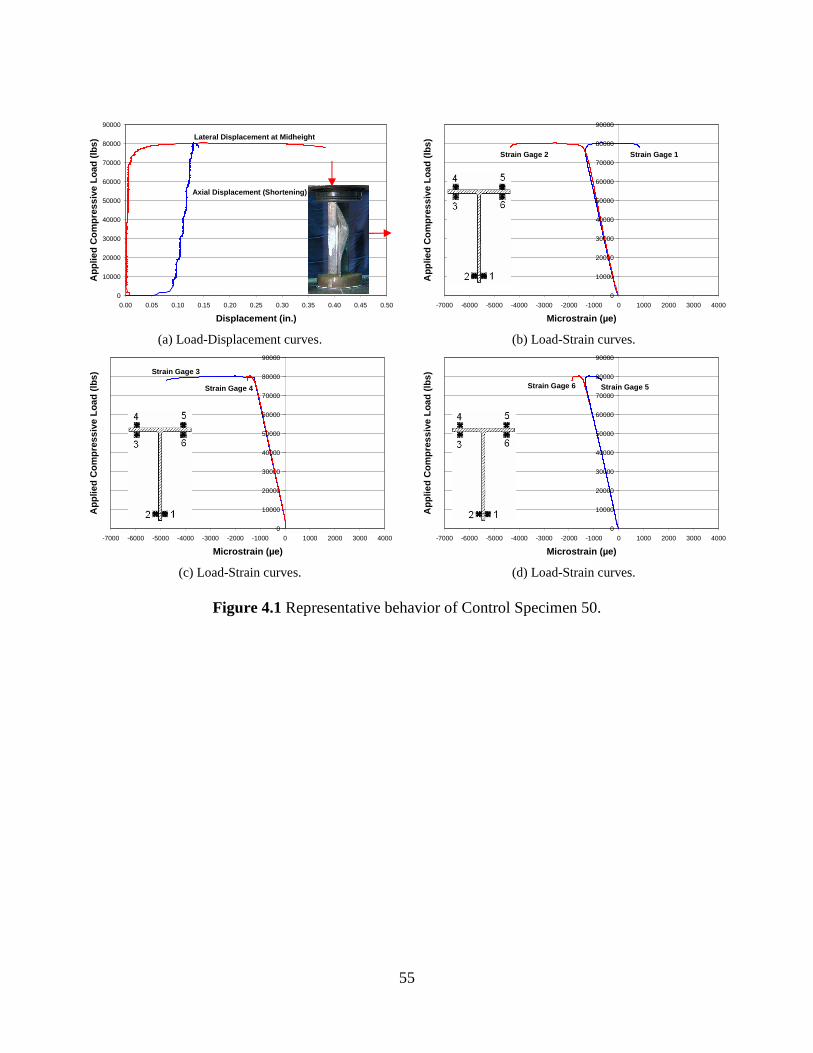
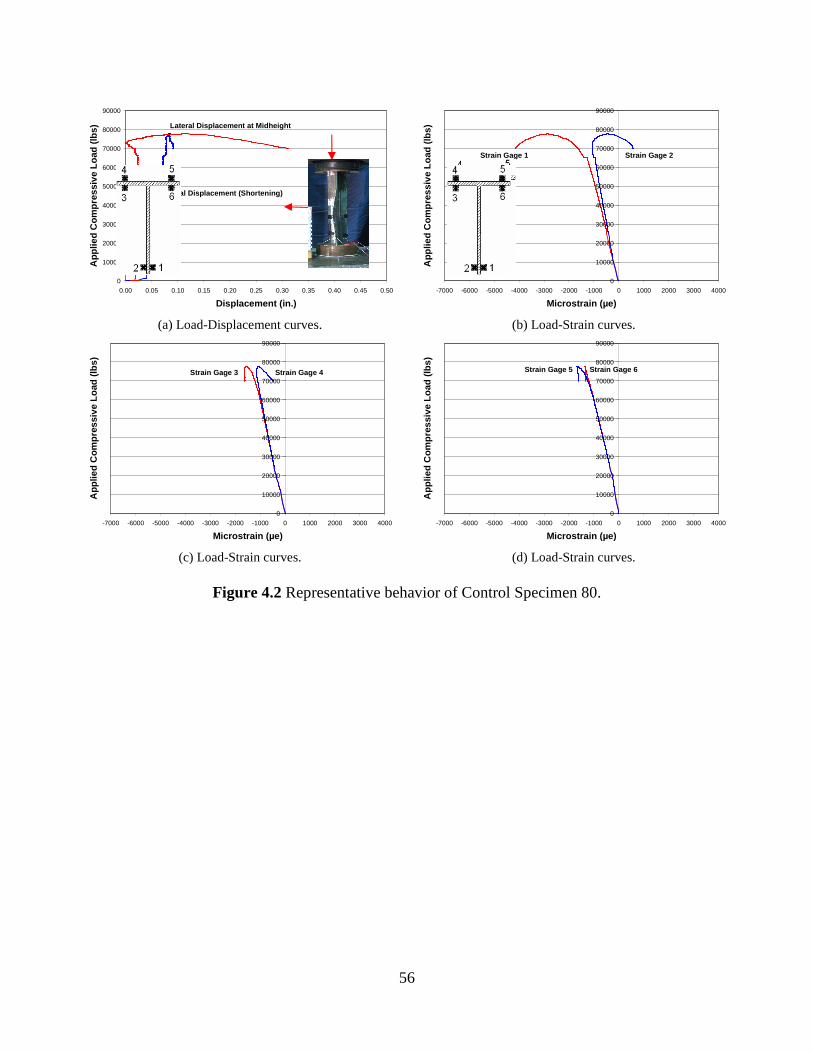
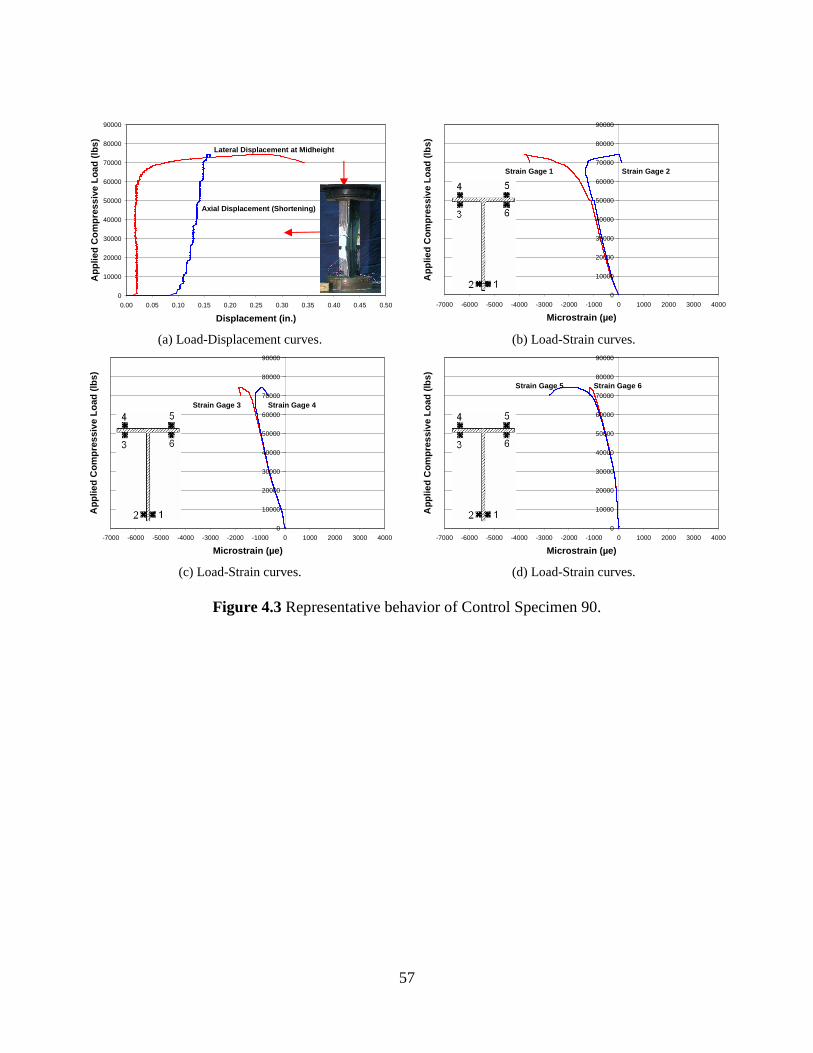
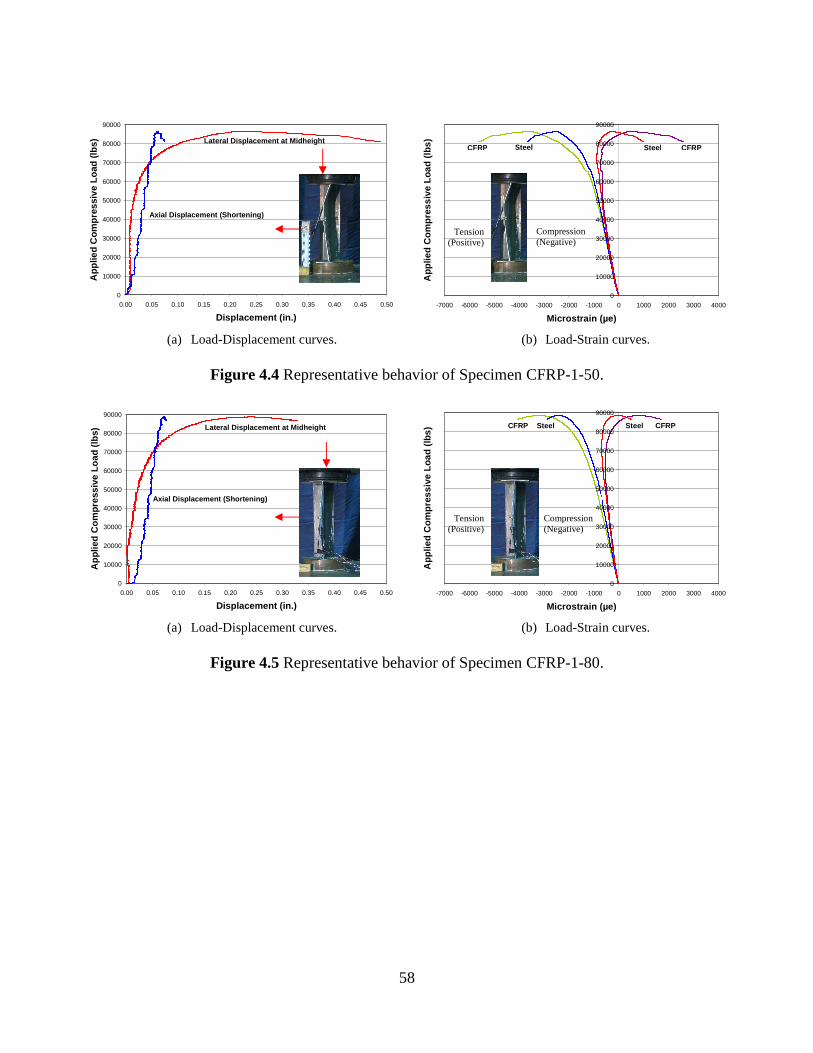
the web stem is subject to uniform compression (as shown in Figure 4.4, for example). As
buckling initiates, the web bends resulting in a superimposed strain gradient through the
thickness of the web. This behavior is easily represented as the application of a moment
to the web equal to the applied axial load multiplied by an apparent eccentricity of this
load; that is: P x e as shown in Figure 5.1. Once this eccentricity is introduced, one gage
continues to increase in compression at a greater rate than the application of axial load
would suggest and the second gage begins shedding compression, eventually going into
69
net tension. The bifurcation load is arbitrarily defined in this work as occurring when the
axial resultant acting on the web stem is beyond the dimension of the web; that is the
eccentricity of the resultant axial load exceeds half the web width: e > tw/2. The
eccentricity is calculated based on the values of strain recorded on gages 1 and 2 (ε1 and
ε2) as follows (see Figure 5.1):
621
12 wte
+−
=εεεε
5.1
The bifurcation loads are reported in Table 5.1. In this test program, bifurcation
was seen to initiate above 90% of the peak load attained indicating a very uniform and
concentric application of axial load. The presence of the FRP appears to affect the
bifurcation load to essentially the same degree as it affects the peak load. The CFRP-1
and GFRP-1 exhibit a marginal increase in the load at which bifurcation initiates
reflecting the greater local increase in radius of gyration affected by the FRP discussed in
the following section.
5.2 RADIUS OF GYRATION
The slenderness ratio of a member is affected by both the length of the element
and its radius of gyration, ry. When retrofitting steel sections with FRP the objectives are
to both increase the maximum compressive capacity of the member while also increasing
the radius of gyration to improve the buckling behavior. The more slender a member, the
more the member behavior deteriorates under cyclic loading (Bruneau et al., 1998).
Decreasing the slenderness of a member ultimately increases the cyclic loading lifespan
70
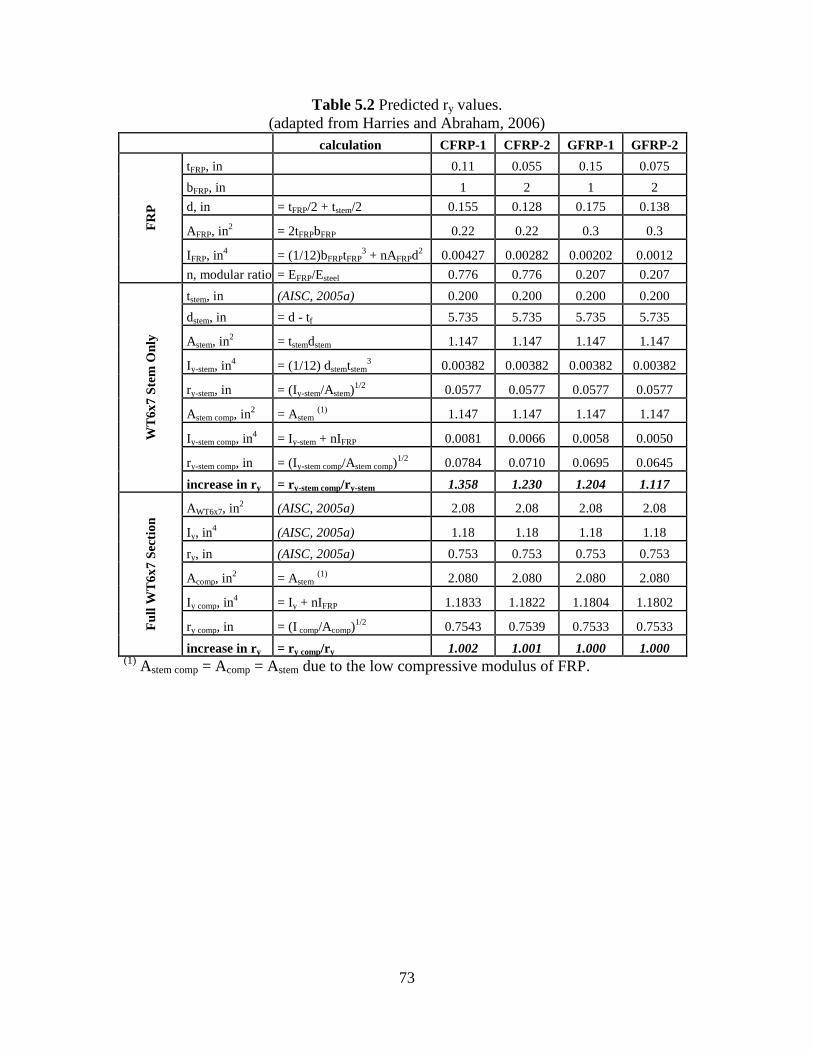
as well as its loading capacity. In this experimental program, the WT 6x7 member has a
slender stem and a compact flange (see Section 3.7); the retrofit is therefore focused on
the stem. Table 5.2 displays the increases in the radii of gyration for the entire WT 6x7
section and for the stem alone (calculated based on the length from the flange to the stem
tip, d – tf) when retrofitted with FRP.
The effect of retrofitting is a significant increase in the value of ry for the stem
alone, ranging from 1.12 to 1.36 times the value of ry for the unretrofit stem (calculated to
be 0.058 in.). These increases are proportional to, although approximately three times, the
observed increases in axial load carrying capacity and bifurcation load. In contrast, when
considering the WT section as a whole, there is essentially no increase of the radius of
gyration.
While the axial load capacity was improved by the FRP retrofitting, the increased
stem radius of gyration greatly aided in delaying the “kinking” of the stem under axial
compression. This results in a more ductile behavior and will ultimately lead to the
increased capacity of a member under reversed cyclic axial loading conditions.
5.3 EFFECTS UPON THE STEM IN AXIAL COMPRESSION
Visual observation of the test specimens during and after testing, revealed the
improved resistance of the WT stem to “kinking” when FRP is applied (Figure 5.2). In
each fiber reinforced specimen, kinking of the stem only occurred after debonding of the
FRP. The FRP material inhibited the stem from kinking and ultimately may allow the
71
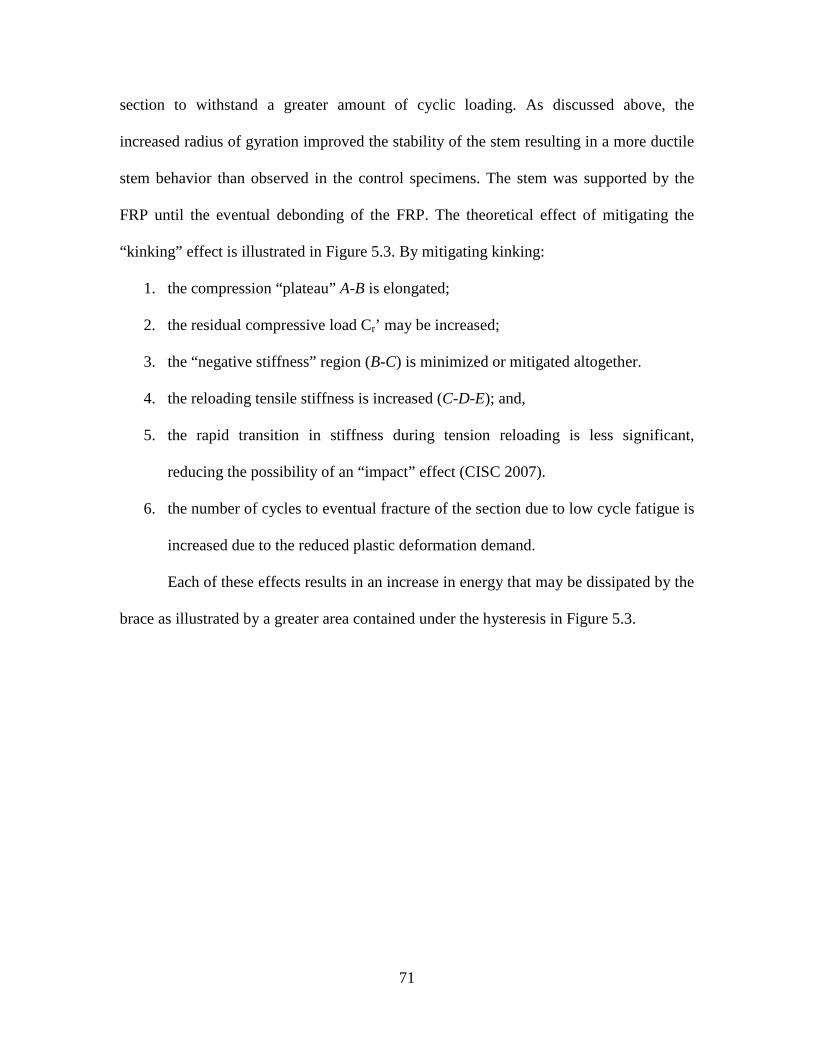
section to withstand a greater amount of cyclic loading. As discussed above, the
increased radius of gyration improved the stability of the stem resulting in a more ductile
stem behavior than observed in the control specimens. The stem was supported by the
FRP until the eventual debonding of the FRP. The theoretical effect of mitigating the
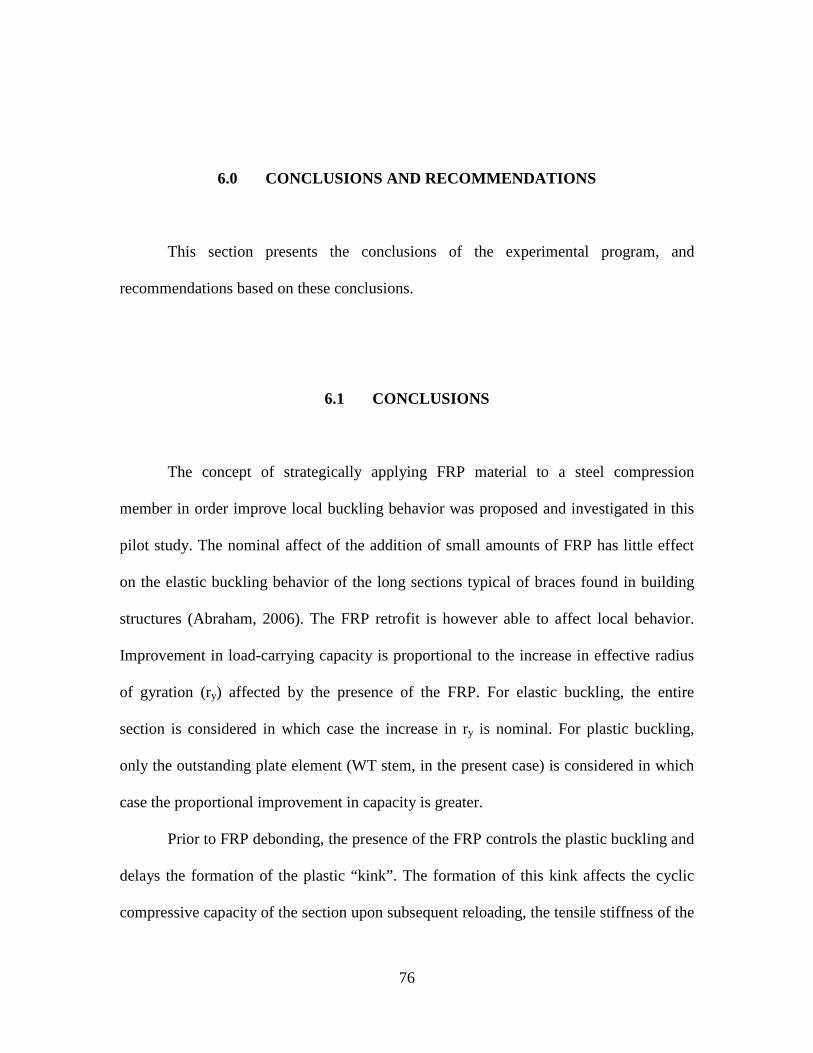
“kinking” effect is illustrated in Figure 5.3. By mitigating kinking:
1. the compression “plateau” A-B is elongated;
2. the residual compressive load Cr’ may be increased;
3. the “negative stiffness” region (B-C) is minimized or mitigated altogether.
4. the reloading tensile stiffness is increased (C-D-E); and,
5. the rapid transition in stiffness during tension reloading is less significant,
reducing the possibility of an “impact” effect (CISC 2007).
6. the number of cycles to eventual fracture of the section due to low cycle fatigue is
increased due to the reduced plastic deformation demand.
Each of these effects results in an increase in energy that may be dissipated by the
brace as illustrated by a greater area contained under the hysteresis in Figure 5.3.
72
Table 5.1 Results of plastic buckling tests (Average of three tests in every case). Control CFRP-1 CFRP-2 GFRP-1 GFRP-2 Peak axial compression, lbs (kN)
ry comp, in = (I comp/Acomp)1/2 0.7543 0.7539 0.7533 0.7533 F
ull W
T6x
7 S
ectio
n
increase in ry = ry comp/r y 1.002 1.001 1.000 1.000 (1) Astem comp = Acomp = Astem due to the low compressive modulus of FRP.
74
6
2
62
6
2
2
21
12
21
212
2
12
21
w
w
w
w
bending
bending
w
te
Et
tE
P
Me
tS
E
SM
EtP
+−=
+
−
==
=
−=
=
+=
εεεε
εε
εε
εεσ
σ
εε
Figure 5.1 Web bifurcation load eccentricity value calculations.
tw tw
e P
End view of stem
ε1 ε2
221 εε +
212 εε −
212 εε −
75
Pretest Peak Load Peak Load Peak Load 90% of Load
Capacity 80% of Load
Capacity 50% of Load
Capacity
Control
(a) (b) (c) (d) (e) (f) (g)
FRP
(h) (i) (j) (k) (l) (m) (n)
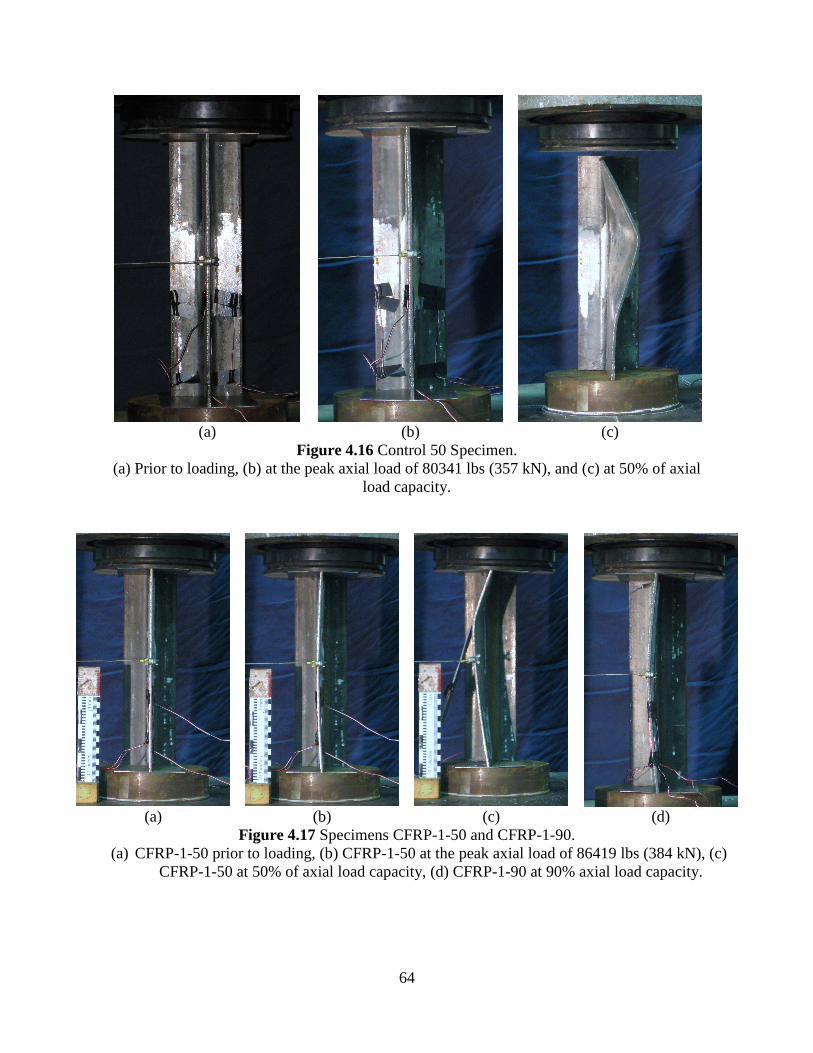
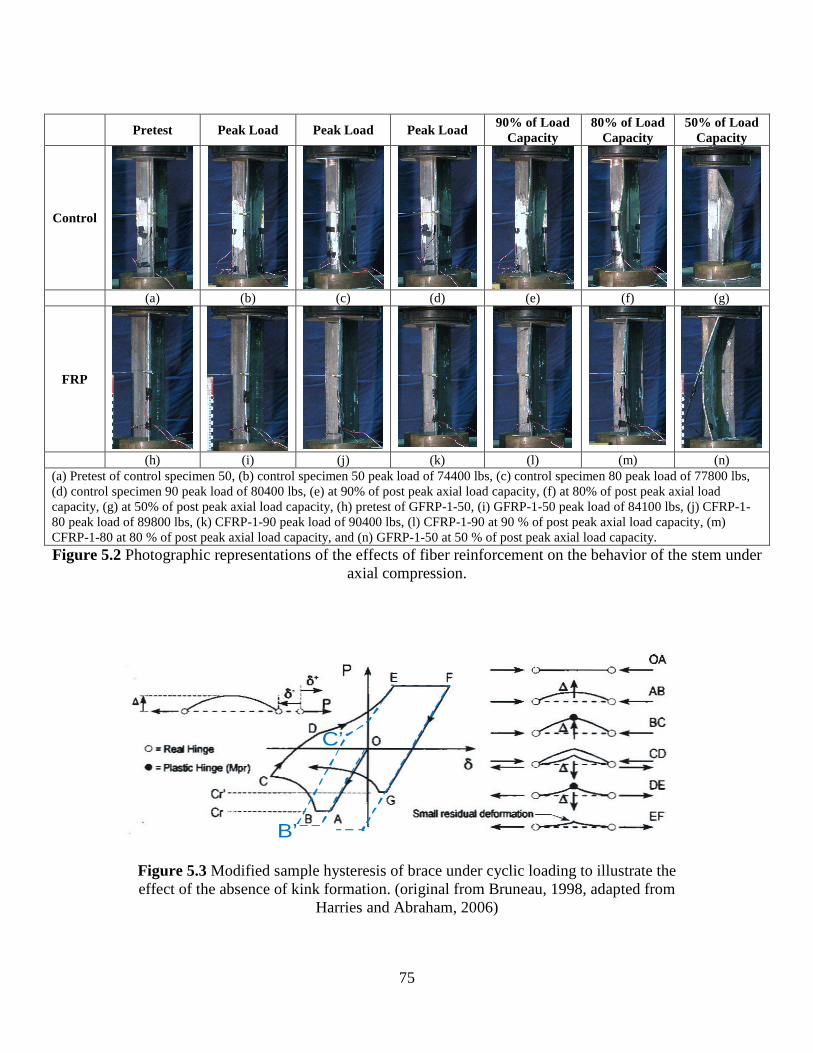
(a) Pretest of control specimen 50, (b) control specimen 50 peak load of 74400 lbs, (c) control specimen 80 peak load of 77800 lbs, (d) control specimen 90 peak load of 80400 lbs, (e) at 90% of post peak axial load capacity, (f) at 80% of post peak axial load capacity, (g) at 50% of post peak axial load capacity, (h) pretest of GFRP-1-50, (i) GFRP-1-50 peak load of 84100 lbs, (j) CFRP-1-80 peak load of 89800 lbs, (k) CFRP-1-90 peak load of 90400 lbs, (l) CFRP-1-90 at 90 % of post peak axial load capacity, (m) CFRP-1-80 at 80 % of post peak axial load capacity, and (n) GFRP-1-50 at 50 % of post peak axial load capacity. Figure 5.2 Photographic representations of the effects of fiber reinforcement on the behavior of the stem under
axial compression.
B’
C’
Figure 5.3 Modified sample hysteresis of brace under cyclic loading to illustrate the effect of the absence of kink formation. (original from Bruneau, 1998, adapted from
Harries and Abraham, 2006)
76
6.0 CONCLUSIONS AND RECOMMENDATIONS
This section presents the conclusions of the experimental program, and
recommendations based on these conclusions.
6.1 CONCLUSIONS
The concept of strategically applying FRP material to a steel compression
member in order improve local buckling behavior was proposed and investigated in this
pilot study. The nominal affect of the addition of small amounts of FRP has little effect
on the elastic buckling behavior of the long sections typical of braces found in building
structures (Abraham, 2006). The FRP retrofit is however able to affect local behavior.
Improvement in load-carrying capacity is proportional to the increase in effective radius
of gyration (ry) affected by the presence of the FRP. For elastic buckling, the entire
section is considered in which case the increase in ry is nominal. For plastic buckling,
only the outstanding plate element (WT stem, in the present case) is considered in which
case the proportional improvement in capacity is greater.
Prior to FRP debonding, the presence of the FRP controls the plastic buckling and
delays the formation of the plastic “kink”. The formation of this kink affects the cyclic
compressive capacity of the section upon subsequent reloading, the tensile stiffness of the
77
section, and can lead to section fracture in relatively few loading cycles. Thus the
application of FRP may represent a viable option for improving the energy absorption
and ultimate cyclic ductility of elements susceptible to plastic buckling in a seismic
lateral force resisting system. The following conclusions were arrived at through this
experimental program:
1. The FRP retrofit measures did not provide a substantial increase in the axial
compression load carrying capacity of the WT steel section members. The CFRP-
1 and CFRP-2 specimens exhibited an increase in axial capacity of 14% and 7%,
respectively. The GFRP-1 and GFRP-2 specimens exhibited an increase in axial
capacity of 9% and 4%, respectively.
2. In this test program, bifurcation was seen to initiate above 90% of the peak axial
load attained indicating a very uniform and concentric application of axial load.
The presence of the FRP appears to affect the bifurcation load to essentially the
same degree as it affects the peak load. The CFRP-1 and GFRP-1 specimens
exhibited a marginal increase in the load at which bifurcation initiated reflecting
the greater local increase in radius of gyration affected by the FRP.
3. The effect of retrofitting is a significant increase in the value of ry for the WT
stem alone, ranging from 1.12 to 1.36 times the value of ry for the unretrofit stem.
These increases are proportional to, although approximately three times, the
observed increases in axial load carrying capacity and bifurcation load. In
contrast, when considering the WT section as a whole, there is essentially no
increase of the radius of gyration.
78
4. While the axial load carrying capacity was improved by the FRP retrofitting, the
FRP was most effective in delaying the “kinking” of the stem under axial
compression. This results in a more ductile behavior and will ultimately lead to
increased capacity of a member under reversed cyclic axial loading conditions.
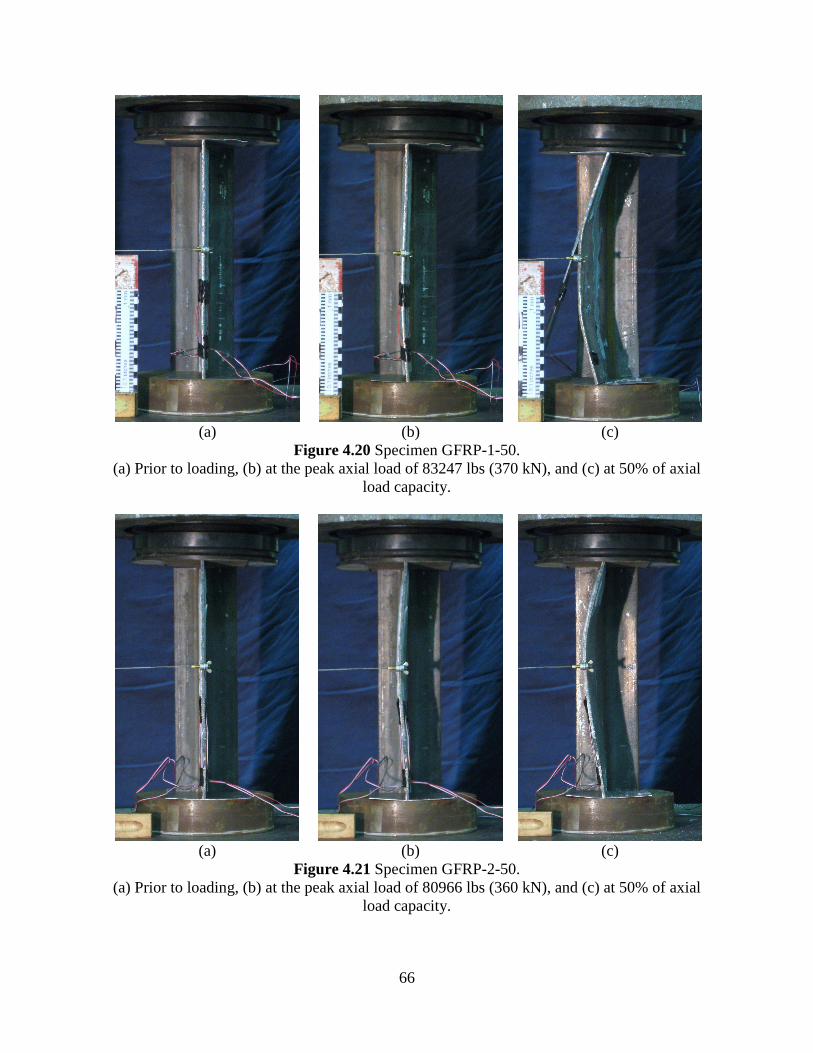
5. Visual observation of the test specimens during and after testing, revealed the
improved resistance of the WT stem to “kinking” when FRP is applied (Figure
5.2). In each FRP specimen, kinking of the stem only occurred after debonding of
the FRP. The FRP material inhibited the stem from kinking and ultimately may
allow the section to withstand a greater amount of cyclic loading. The stem was
supported by the FRP until the eventual debonding of the FRP. The FRP, in this
case, may serve to “spread” the plastic behavior over a larger region of the WT
stem.
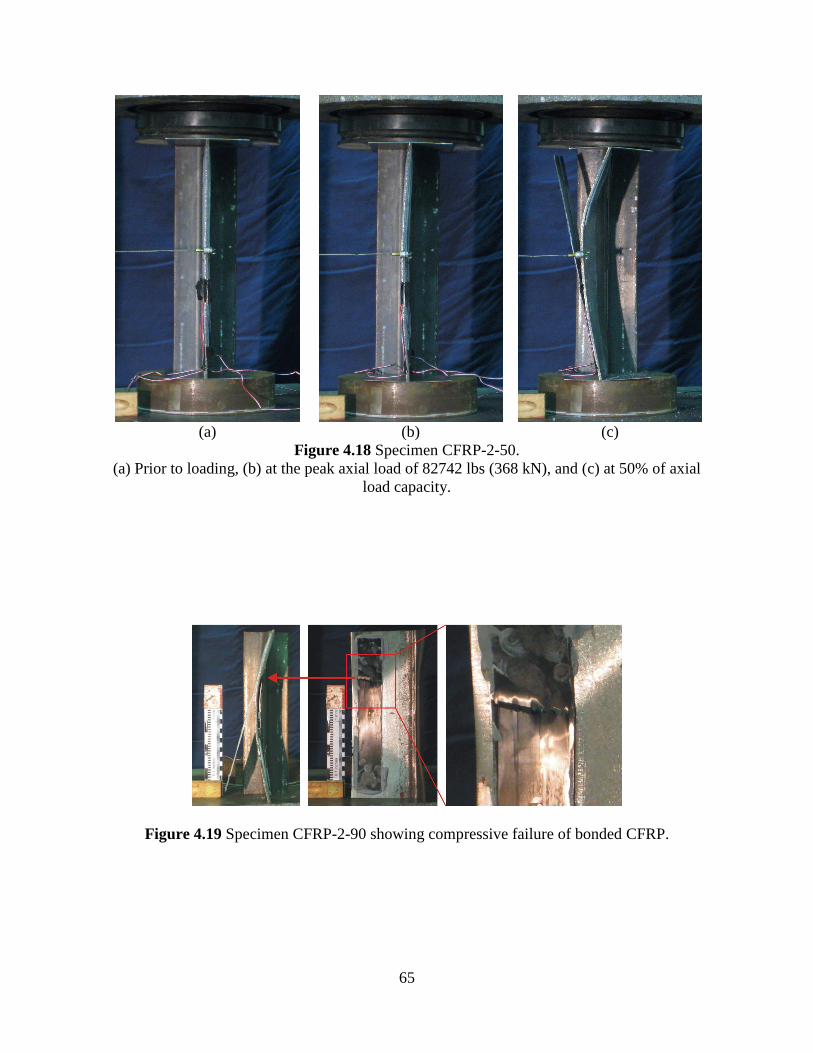
6. The effectiveness of the FRP is limited by its ability to remain affixed to the steel
substrate under axial compression load. The debonding behavior may be
described as “end-peel” debonding. The end peel behavior of the FRP from the
steel substrate is linked to the strains due to curvature and the interfacial shear
caused by this curvature at the termination of the bonded FRP.
79
6.2 RECOMMENDATIONS
Recommendations for future study include:
1. The application of FRP composite retrofitting should be explored in areas of
moderate and high seismic activity. The large impact that the FRP had on
delaying “kinking” behavior of the WT stem suggests the need to explore this
behavior under reversed cyclic axial loading conditions.
2. Investigating the effects of the FRP development lengths on steel members to
which the FRP composite materials are applied. This in turn may lead to further
investigation of the impact of bond adhesion to the steel substrate, and ways in
which to improve the bond behavior. The improvement of bonding FRP
composite materials to the steel substrate will enhance the effectiveness of the
FRP.
3. Related to the previous recommendation, methods of providing FRP anchorage
where extension of the FRP is not an option (such as in flexural hinges in beams
at column faces) should be investigated to maximize the usability of the concept
of FRP stabilization.
The field of FRP composite materials is relatively new, leaving much more
investigation on the effects of FRP on steel members still left to be done. The vast array
of practical applications of FRP in the field of civil engineering has only yet to be
discovered.
80
APPENDIX
APPARENT CENTROID LOCATION
81
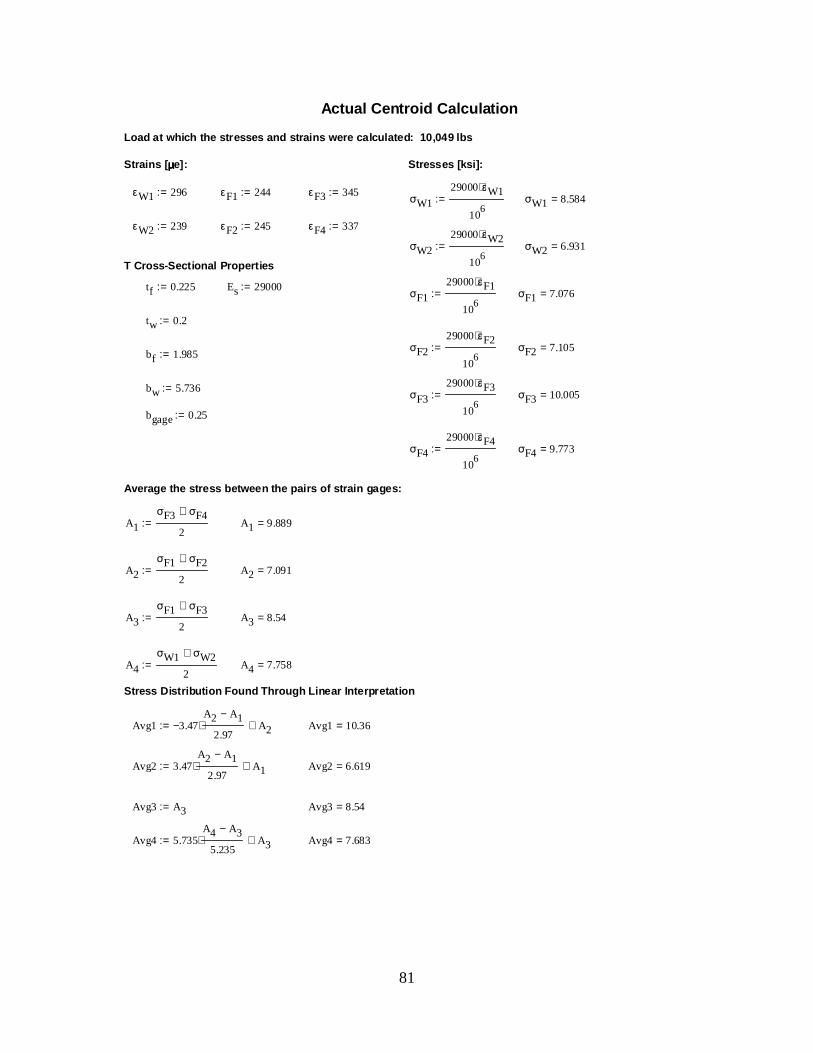
Actual Centroid Calculation
Load at which the stresses and strains were calcula ted: 10,049 lbs
Strains [ µµµµe]: Stresses [ksi]:
εW1 296:= εF1 244:= εF3 345:=σW1
29000εW1⋅
106
:= σW1 8.584=
εW2 239:= εF2 245:= εF4 337:=
σW2
29000εW2⋅
106
:= σW2 6.931=
T Cross-Sectional Properties
tf 0.225:= Es 29000:=σF1
29000εF1⋅
106
:= σF1 7.076=
tw 0.2:=
σF2
29000εF2⋅
106
:= σF2 7.105=bf 1.985:=
bw 5.736:=σF3
29000εF3⋅
106
:= σF3 10.005=
bgage 0.25:=
σF4
29000εF4⋅
106
:= σF4 9.773=
Average the stress between the pairs of strain gage s:
A1
σF3 σF4+
2:= A1 9.889=
A2
σF1 σF2+
2:= A2 7.091=
A3
σF1 σF3+
2:= A3 8.54=
A4
σW1 σW2+
2:= A4 7.758=
Stress Distribution Found Through Linear Interpreta tion
Avg1 3.47−A2 A1−
2.97⋅ A2+:= Avg1 10.36=
Avg2 3.47A2 A1−
2.97⋅ A1+:= Avg2 6.619=
Avg3 A3:= Avg3 8.54=
Avg4 5.735A4 A3−
5.235⋅ A3+:= Avg4 7.683=
82
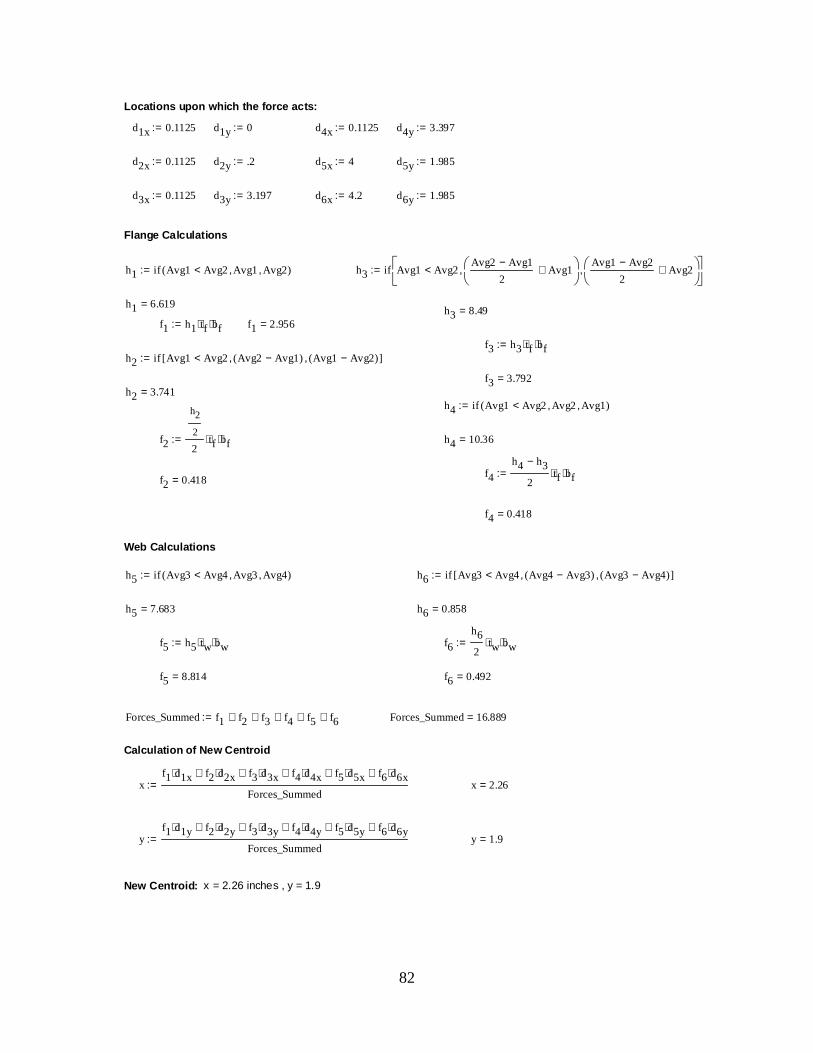
Locations upon which the force acts:
d1x 0.1125:= d1y 0:= d4x 0.1125:= d4y 3.397:=
d2x 0.1125:= d2y .2:= d5x 4:= d5y 1.985:=
d3x 0.1125:= d3y 3.197:= d6x 4.2:= d6y 1.985:=
Flange Calculations
h1 if Avg1 Avg2< Avg1, Avg2, ( ):= h3 if Avg1 Avg2<Avg2 Avg1−
Abraham, E.J. (2006). “Conceptual Investigation of Partially Buckling Restrained Braces.” MSc Thesis, Department of Civil and Environmental Engineering, University of Pittsburgh, Pittsburgh, PA. Abraham, E.J. and Harries, K.A. (2007). “Development of “Partial Buckling-Restrained Braces” using FRP”, Proceedings of the ASCE STRUCTURES 07 Congress, Long Beach CA, May 2007. Accord, N.B., Earls, C.J., and Harries, K.A., (2006). “On the use of Fiber Reinforced Composites to Improve Structural Ductility in Steel Flexural Members” Proceedings of the 2006 SSRC-AISC Joint AISC-NASCC Conference, San Antonio, February 2006. American Concrete Institute (ACI) Committee 440, (2007) Report on Fiber-Reinforced Polymer Reinforcement for Concrete Structures, ACI, Farmington Hills MI, 100 pp. American Institute of Steel Construction (AISC) 2005. Steel Construction Manual, 13th Edition. American Institute of Steel Construction (AISC). (2005a). Steel Construction Manual, 13th Edition. Bruneau, M., Uang, C. M., and A. Whittaker. (1998). Ductile Design of Steel Structures, The McGraw-Hill Companies, Boston, Massachusetts, ISBN 0-07-008580-3. Cadei, J.M.C., Stratford, T.J., Hollaway, L.C. and Duckett, W.G. (2004). “Strengthening Metallic Structures Using Externally Bonded Fibre-Reinforced Polymers,” CIRIA Publication No. C595. CIRIA, London, 233 pp. Canadian Institute of Steel Construction CISC). (2007). Handbook of Steel Construction, 9th Edition. Chacon, A., Chajes, M., Swinehart, M., Richardson, D., and G. Wenczel. (2004). “Applications of Advanced Composites to Steel Bridges: A Case Study on the Ashland Bridge.” Proceedings of the 4th Advanced Composites for Bridges and Structures Conference, Calgary, July 2004.
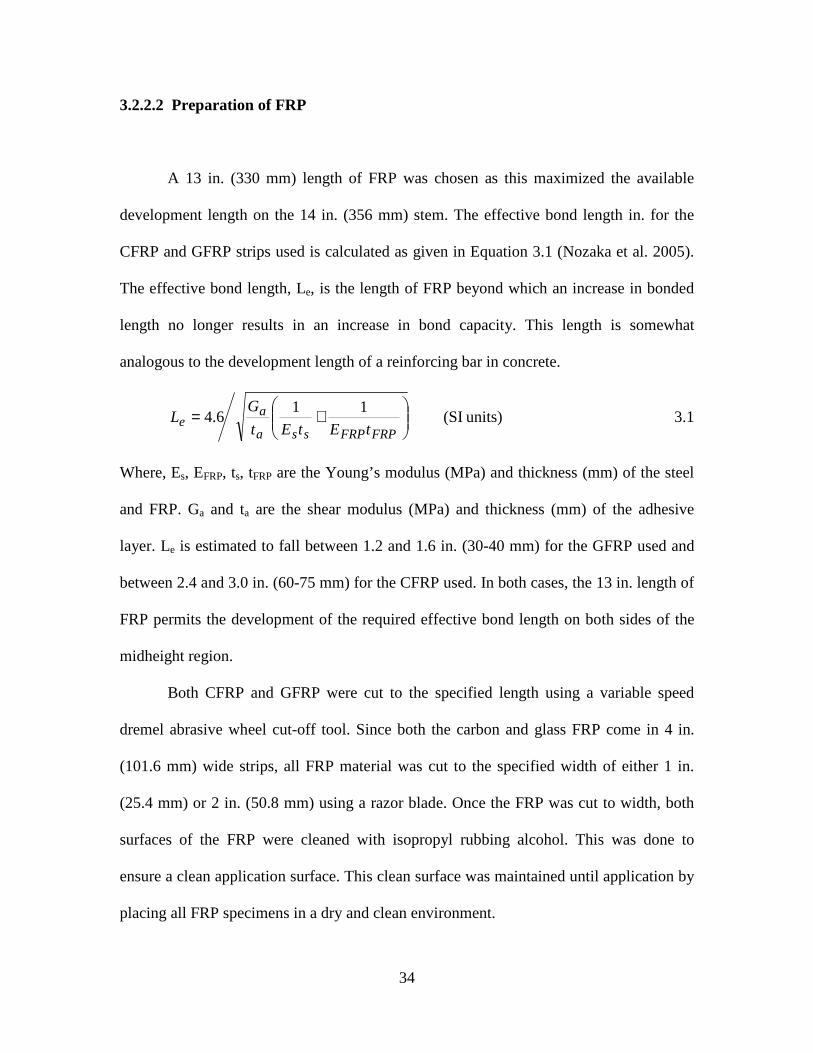
84
Ekiz, E. (2007). “Improving Steel Behavior Using Carbon Fiber Reinforced Polymer (CFRP) Wrapping.” PhD Thesis, Department of Civil and Environmental Engineering, University of Michigan, Ann Arbor, MI. Ekiz, E., El-Tawil, S., Parra-Montesinos, G., and S. Goel. (2004). “Enhancing Plastic Hinge Behavior in Steel Flexural Members Using CFRP Wraps.” Proceedings of the 13th World Conference on Earthquake Engineering, Vancouver, August 2004. Gillespie Jr., J.W., Mertz, D.R., Kasai, K., Edberg, W.M., Demitz, J.R., and I. Hodgson. (1996). “Rehabilitation of Steel Bridge Girders: Large Scale Testing.” Proceedings of the American Society for Composites 11th Technical Conference, Atlanta, GA, October 1996. Harries, K.A., and S. El-Tawil. (2006). “Steel-FRP Composite Structural Systems: State of the Art.” Report to the ASCE Committee on Composite Construction Task Group on Steel-FRP Composite Structures. Hollaway, L.C., and J. Cadei. (2002). “Progress in the technique of upgrading metallic structures with advanced polymer composites.” Prog. Struct. Engng Mater. 2002, 4, 131-148. Jones, S.C., and S.A. Civjan. (2003). “Application of Fiber Reinforced Polymer Overlays to Extend Steel Fatigue Life.” Journal of Composites for Construction, 7(4), 331-338. Miller, T.C., Chajes, M.J., Mertz, D.R., and J.N. Hastings. (2001). “Strengthening of a Steel Bridge Girder Using CFRP Plates.” Journal of Bridge Engineering, November/December, 514-522. Moy, S.S.J. (2004a). “Design Guidelines for the Strengthening of Metallic Structures Using Fibre Reinforced Composites.” Proceedings of the 4th International Conference on Advanced Composite Materials in Bridges and Structures, Calgary, July 2004. Moy, S.S.J. (2004b). “Three Case Studies of Carbon Fibre Composite Strengthening of Metallic Structures on the London Underground.” Proceedings of the 4th International Conference on Advanced Composite Materials in Bridges and Structures, Calgary, July 2004. Nakashima1, M., Kanao, I., and D. Liu. (2002). “Lateral Instability and Lateral Bracing of Steel Beams Subjected to Cyclic Loading.” Journal of Structural Engineering, October 2002, 1308-1316. Nakashima, M., Liu, D., and I. Kanao. (2003). “Lateral-Torsional and Local Instability of Steel Beams Subjected to Large Cyclic Loading.” Steel Structures 3, 179-189. Nozaka, K., Shield, C.K., and J.F. Hajjar (2005). “Effective bond length of carbon-fiber-reinforced polymer strips bonded to fatigued steel bridge I-girders.” Journal of Bridge Engineering, ASCE, v. 10, n. 2, March, pp. 195-205.
85
Okazaki, T., Liu, D., Nakashima, M., and M.D. Engelhardt. (2006). “Stability Requirements for Beams in Seismic Steel Moment Frames.” Journal of Structural Engineering, September 2006, 1334-1342. Patnaik, A.K. and C.L. Bauer. (2004). “Strengthening of Steel Beams with Carbon FRP Laminates.” Proceedings of the 4th International Conference on Advanced Composite Materials in Bridges and Structures, Calgary, July 2004. Sayed-Ahmed, E.Y. (2004). “Strengthening of Thin-walled Steel I-Section Beams Using CFRP Strips.” Proceedings of the 4th
International Conference on Advanced Composite
Materials in Bridges and Structures, Calgary, July 2004. Schnerch, D., Stanford, K., Sumner, E., and S. Rizkalla. (2005). “Bond Behavior of CFRP Strengthened Steel Bridges and Structures.” Proceedings of the International Symposium on Bond Behavior of FRP in Structures, pp 443-451. Sebastian, W., and S. Luke. (2007). “Interface Failure Mechanics of Elastically (Advanced Composite) Reinforced Steel Members.” Journal of Structural Engineering ASCE, May 2007, 683-694. Shaat, A., and A. Fam. (2004). “Strengthening of Short HSS Steel Columns Using FRP Sheets.” Proceedings of the 4th International Conference on Advanced Composite Materials in Bridges and Structures, Calgary, July 2004, paper No. 093. Uang, C-M., and C-C. Fan. (2001). “Cyclic Stability Criteria For Steel Moment Connections With Reduced Beam Section.” Journal of Structural Engineering, Vol. 127, No. 9, pp 1021-1027. Zhao X-L and Zhang L. (2006). “State-of-the-art review on FRP strengthened steel structures.” Engineering Structures, Volume 29, Issue 8, 1808-1823. Published Work Stemming from this Thesis Harries, K.A., Peck, A., and E.J. Abraham. (2008). “Experimental Investigations of FRP-stabilized Steel Compression Members”, Proceedings of the 4rd International Conference on FRP Composites in Civil Engineering (CICE 2008), Zurich, July 2008. Harries, K.A., Abraham, E.J., and A. Peck. (2007). “FRP-stabilized Steel Compression Members”, Proceedings of the Asia-Pacific Conference on FRP in Structures (APFIS 2007), Hong Kong, December 2007.