Tomasik, Brian 1 Investigation of Internal Phosphorus Loading in the Watervliet Reservoir, New York, August 2004 Brian Tomasik Guilderland Central High School Guilderland Center, NY 12085 Watervliet Reservoir, Spring 2003. Photo by Brian Tomasik.
Transcript
Tomasik, Brian 1
Investigation of Internal Phosphorus Loading
in the Watervliet Reservoir, New York, August 2004
Brian Tomasik Guilderland Central High School
Guilderland Center, NY 12085
Watervliet Reservoir, Spring 2003. Photo by Brian Tomasik.
Tomasik, Brian 2
Abstract
This study examined internal phosphorus release in a thermally stratified fresh water
body in upstate New York. Temperature, dissolved oxygen, and total dissolved phosphorus were
measured at regular intervals to the bottom of a shallow site and a deep site on the Watervliet
Reservoir in mid-August 2004. Both temperature and dissolved-oxygen readings at the deeper
sampling location closely matched the general pattern of a thermally stratified lake. Beneath the
surface of the reservoir’s epilimnion, which extended from 0.0 m to 5.0 m, dissolved oxygen was
consistently between 4 and 6 mg O2/L. However, beginning at the metalimnion—which lay
between 5.0 m and 6.0 m—and continuing throughout the hypolimnion—which ranged from 6.0
m to the bottom—dissolved-oxygen concentrations fell close to zero. The water at the shallower
sampling location, which was not significantly stratified, did not exhibit a similar plunge in
dissolved oxygen. Even though metalimnetic and hypolimnetic dissolved-oxygen concentrations
at the deeper sampling location were well below the 1-mg O2/L threshold at which sediment-
bound phosphorus typically begins to dissolve in earnest, no significant phosphorus mobilization
was detected.
Introduction
Thermal stratification is a natural process generally found in temperate water bodies that
are at least 5 m to 7 m in depth. It usually develops during the late spring and early summer,
when direct exposure to sunlight and contact with warm air raise the temperature of water at the
surface; meanwhile, bottom water receives little of this incoming heat. Because the density of
liquid water decreases with increasing temperature, the warm water remains at the top and the
cold water remains at the bottom. Thus, the reservoir stratifies into two distinct layers: the
Tomasik, Brian 3
warmer epilimnion near the surface, which typically ranges between 20°C and 25°C, and the
cooler hypolimnion near the bottom, which is usually between 4°C and 15°C. In between the
two layers is the metalimnion, a zone of rapid transition in which water temperature changes by
more than one degree Celsius per meter of depth; this section is generally in the temperature
range of 15°C to 20°C. The thermocline is the specific depth within the metalimnion of
maximum water-temperature change.
The mixing of water layers of different densities requires energy (usually wind energy),
and a greater difference in density requires more energy. Since the epilimnion is directly
exposed to the wind, it is thoroughly mixed and well oxygenated. However, when this mixing
energy reaches the metalimnion, it is effectively stopped by that layer’s sharp density gradients.
Because the hypolimnion is consequently unable to mix with the epilimnion, reoxygenation of
the former is largely precluded.
The impact of this condition upon hypolimnetic dissolved-oxygen levels is relatively
small in reservoirs that are oligotrophic, meaning that they have high water clarity and low algal
and plant productivity by virtue of poor nutrient content. The virtual absence of dead organic
matter in such waters translates into minimal oxygen consumption by decomposers of plant and
animal detritus. However, in eutrophic reservoirs—those with low water clarity and high algal
and plant productivity owing to rich nutrient content—the abundance of organic waste rapidly
depletes dissolved oxygen. Because it is unable to replenish its oxygen supply by contact with
air and because it is often too deep for sunlight to permit oxygen generation by photosynthesis,
the hypolimnion of a eutrophic reservoir soon becomes anoxic, meaning that dissolved oxygen
approaches 0.0 mg O2/L.
Tomasik, Brian 4
Hypolimnetic anoxia generally triggers the release of nutrients—especially phosphorus—
into the water column. Under oxic conditions, most of the PO43- in a water body is bound to
sediment by metal cations, particularly Fe3+. But when concentrations of dissolved oxygen in the
hypolimnion drop below 1 mg O2/L, some of this Fe3+ is reduced to Fe2+, and PO43- is thereby
released into the surrounding water.
Phosphorus is a macronutrient that plants must have in order to carry out a multiplicity of
cellular processes: genetic coding, cell division and growth, photosynthesis, respiration, and
energy storage. Because of its relative scarcity, phosphorus is the limiting nutrient in most fresh
water bodies. In other words, phosphorus availability is typically the sole factor restricting, or
permitting, further plant growth. Thence, when humans unnaturally augment levels of
phosphorus in a reservoir—such as by pulp and paper production, urban storm runoff, road
deicers, poorly sited and maintained septic systems, wastewater-treatment effluent, agricultural
and lawn fertilization, logging, and virtually any other form of land development—the result is
cultural eutrophication, the anthropogenic acceleration of the natural process of eutrophication
by which the productivity of water bodies increases over time. This occurs not only because
phosphorus is generally the growth-limiting factor in reservoirs; it also occurs because plants are
able to utilize more efficiently other types of nutrients when phosphorus is present. In view of
the close relationship between phosphorus and plant growth, Vollenweider (1975) proposed that
the general dividing line between mesotrophy and eutrophy is a mean total-phosphorus
concentration of 20 µg P/L for the epilimnion during the summer. The New York State
Department of Environmental Conservation uses this same number as its guidance value for
lakes and reservoirs in New York (Effler and Bader 1998, p. 129).
Tomasik, Brian 5
Because phosphorus is usually the limiting nutrient in a fresh water body, the
mobilization of iron-bound phosphorus by low levels of dissolved oxygen accelerates the growth
of algae and plants. Such growth creates more dead organic matter that must be decomposed,
and thus further depletes the remaining supply of dissolved oxygen. This, in turn, triggers the
release of even more phosphorus from the sediment. In this way, hypolimnetic oxygen depletion
is often a self-exacerbating phenomenon.
But excessive plant growth, spurred by elevated levels of phosphorus, results in other
harmful impacts, as well. The increased accumulation of dead organic matter accelerates the
decline of a reservoir’s water-retention capacity—the amount of water a reservoir can hold.
Heightened plant productivity may give drinking water undesirable tastes and smells that remain
even after treatment. It also creates higher levels of disinfection byproducts—chemicals that are
formed by the reaction of organic matter in source water with disinfectants added thereto. Two
of the most important groups of disinfection byproducts, trihalomethanes and haloacetic acids,
are created by the process of chlorination with either chlorine gas or hypochlorous acid.
Prolonged exposure to concentrations of trihalomethanes and haloacetic acids exceeding EPA’s
maximum-contaminant levels for those chemicals in drinking water may increase the risk of
cancer, as well as the possibility of damage to the liver, kidneys, and central nervous system.
These potential effects of disinfection byproducts have aroused concern among some
residents of the town of Guilderland, Albany County, New York, inasmuch as Guilderland
drinking water, disinfected with chlorine gas, regularly contains annual-average concentrations
of trihalomethanes and haloacetic acids that are close to, and sometimes above, EPA limits
(Guilderland Study Circles 2003, p. 18-19). Most of this drinking water comes from the
Watervliet Reservoir, which lies within the western section of Guilderland. The 2.55-square-
Tomasik, Brian 6
kilometer water body has a capacity of 5.3 billion liters and a safe yield of 45 million liters per
day. A previous study by this researcher found that the Watervliet Reservoir’s epilimnetic total-
phosphorus concentrations in August 2003 averaged 19 µg P/L, putting the reservoir at the upper
end of mesotrophy according to the Vollenweider (1975) classification.
Hypotheses and Experimental Design
The first hypothesis was that the Watervliet Reservoir, with a maximum depth of
approximately 9 m, would be thermally stratified during the late summer at depths of at least 5 m
to 7 m, the range at which thermal stratification generally begins to occur in temperate water
bodies. This was tested by observing trends of water temperature with depth to see how well
they matched the typical patterns of a thermally stratified temperate water body.
The second hypothesis was that the anticipated thermal stratification would have caused
hypolimnetic anoxia. This was evaluated by correlating trends in dissolved oxygen with
apparent thermal layers.
The final hypothesis was that sediment-bound phosphorus would have been discharged
into hypolimnetic waters by consequence of the expected anoxia. This was tested by measuring
concentrations of total dissolved phosphorus throughout the water column. The reason for
measuring total phosphorus was that all three of the differentiable phosphorus forms—inorganic
orthophosphate, inorganic polyphosphates, and organic phosphorus—have the potential to
dissolve. The water samples were filtered because only concentrations of dissolved phosphorus
can reveal whether or not more phosphorus is dissolving into the water; levels of suspended
phosphorus will not increase in the absence of oxygen and are hence unnecessary and potentially
misleading for this purpose.
Tomasik, Brian 7
Materials and Procedure
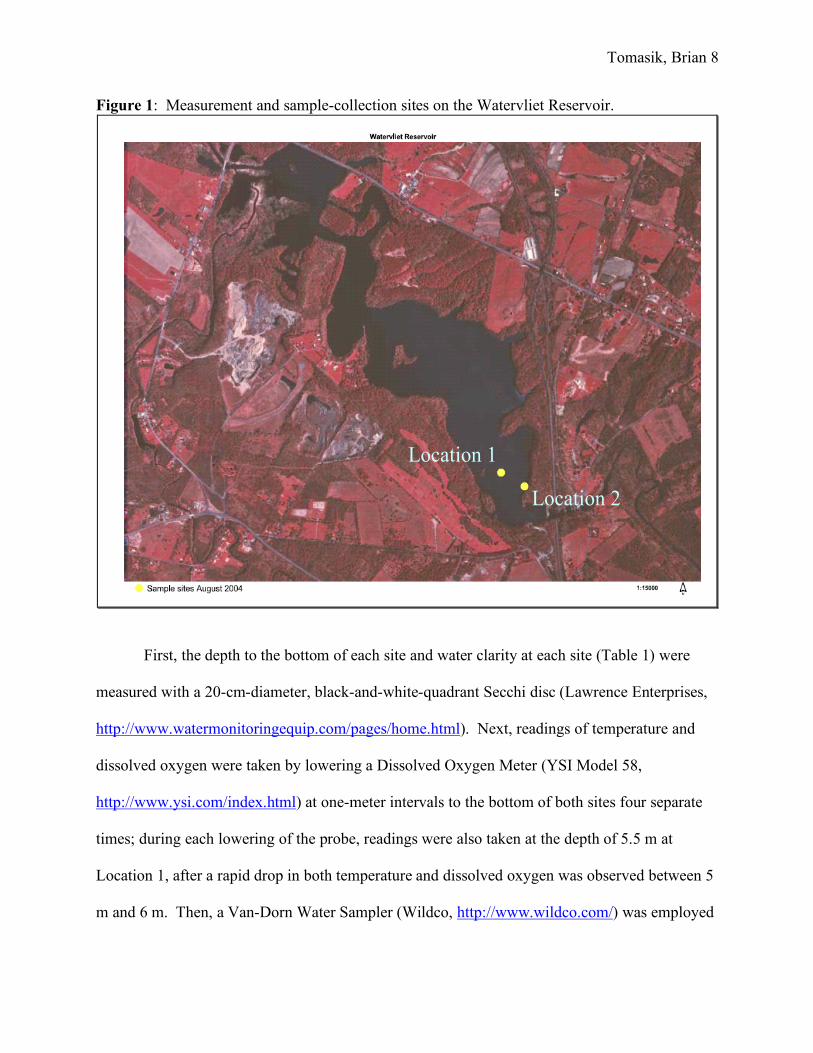
On 17 August 2004, measurement and sample collection were performed from a rowboat
at two sites on the Watervliet Reservoir, both of which were at its southeast end (Figure 1). The
purpose of Location 1 was to discover whether or not thermal stratification occurred in the
Watervliet Reservoir and, if so, how it affected concentrations of dissolved oxygen and dissolved
phosphorus; wherefore, Location 1 was chosen to be the deepest spot that could be found. In
order to make sure that any trends observed with increasing depth at Location 1 were in fact
results of thermal stratification and were not merely inherent properties of water closer to bottom
sediment, Location 2 was selected as a control site that appeared too shallow to stratify. The
proximity of the two sites was intended to maximize the likelihood that the ambient conditions of
each would be relatively similar.
Tomasik, Brian 8
Figure 1: Measurement and sample-collection sites on the Watervliet Reservoir.
Location 1
Location 2
First, the depth to the bottom of each site and water clarity at each site (Table 1) were
measured with a 20-cm-diameter, black-and-white-quadrant Secchi disc (Lawrence Enterprises,
http://www.watermonitoringequip.com/pages/home.html). Next, readings of temperature and
dissolved oxygen were taken by lowering a Dissolved Oxygen Meter (YSI Model 58,
http://www.ysi.com/index.html) at one-meter intervals to the bottom of both sites four separate
times; during each lowering of the probe, readings were also taken at the depth of 5.5 m at
Location 1, after a rapid drop in both temperature and dissolved oxygen was observed between 5
m and 6 m. Then, a Van-Dorn Water Sampler (Wildco, http://www.wildco.com/) was employed
Tomasik, Brian 9
at both locations for scooping up some surface sediment, so that its general characteristics could
be informally noted. The Van-Dorn bottle was also used to take water samples at one-meter
intervals at both sites; three separate samples were collected from each depth, for a total of 33
samples. The glass sampling bottles had previously been rinsed, once with 10% HCl and thrice
with deionized water. In the boat, the bottles were rinsed three times with sample water before
the actual sample was poured in. The bottles were then refrigerated until testing the next day.
Table 1: Physical Characteristics of the Two Sampling Locations Location 1 Location 2 Depth (m) 8.82 3.82 Mean Secchi-Disc Transparency (m)
1.53 1.49
Observations on Water Clarity
Sampling was performed one day after a large rainstorm, and the water itself appeared slightly more brown than usual. Therefore, recorded Secchi-disc-transparency depths probably underrepresent the typical water clarity of the reservoir.
Mean Air Temperature at the Time of Measurement (°C)
21.6 20.6
Weather Characteristics at the Time of Measurement
Sunny. Little wind. Sunny. Little wind.
Surface-Sediment Characteristics
Very dark brown. Clay and organic matter. Less sand. Slimy.
Dark brown. Clay and organic matter. More sand. Rough.
The water samples were analyzed for total dissolved phosphorus at the Keck Water
Quality Research Laboratory at Rensselaer Polytechnic Institute. First, they were filtered
through a 0.4-µm Polycarbonate filter (Osmonics, Inc., http://www.gewater.com/index.jsp) using
a Vacuum Pump (Welch, http://www.welchvacuum.com/) set to 15 in. Hg. These filtered
samples were refrigerated overnight. The samples were then analyzed according to USEPA
Method 365.2. Two 8.65-µg P/L quality-control standards were made from Spex Nut-2 (Table
5), and duplicates were made from three separate samples (Table 6).
Tomasik, Brian 10
Results and Discussion
Results were analyzed with a program called JMP IN. It was used to determine whether
or not the apparent differences of the measurements at various depths could actually be
considered statistically significant according to a 0.05-probability F-test ANOVA.
A. Temperature
Both locations exhibited a general decrease in temperature with depth (Figure 2).
Figure 2: Temperature with Depth. (Vertical bars represent ± 1 standard deviation from the mean.)
Tomasik, Brian 11
Coefficient of variation is a measure of the variability of a set of data, and a coefficient of
variation below 5 percent indicates good precision. Temperature measurements at all depths
except for the air were very precise, as coefficients of variation were consistently below 2
Table 3 utilizes changes in temperature per meter of depth to classify each interval
between measurement depths into an apparent thermal layer. Location 1 seems to be fully
stratified, with an epilimnion from 0.0 m to 5.0 m, a metalimnion between 5.0 m and 6.0 m, and
a hypolimnion from 6.0 m to the bottom; the thermocline lies between 5.0 m and 5.5 m.
Location 2 shows no signs of significant stratification.
Tomasik, Brian 12
Table 3: Intervallic Changes in Temperature Location Number
Interval Change in Mean Temperature per Change in Depth (°C/m)
Corresponding Water Layer
0.0 m to 1.0 m -2.1 Epilimnion 1.0 m to 2.0 m -0.6 Epilimnion 2.0 m to 3.0 m -0.4 Epilimnion 3.0 m to 4.0 m -0.4 Epilimnion 4.0 m to 5.0 m -0.3 Epilimnion 5.0 m to 5.5 m -1.6 Metalimnion (Thermocline) 5.5 m to 6.0 m -1.4 Metalimnion 6.0 m to 7.0 m -0.4 Hypolimnion
1
7.0 m to 8.0 m -0.3 Hypolimnion 0.0 m to 1.0 m -1.8 Not stratified 1.0 m to 2.0 m -0.7 Not stratified
2
2.0 m to 3.0 m -0.2 Not stratified
B. Dissolved Oxygen
Location 1’s dissolved-oxygen levels correlate very closely to its apparent thermal layers.
Dissolved oxygen was relatively stable throughout the epilimnion—discounting the surface
water, which was in nearly direct contact with the air—and concentrations consistently remained
between 4 and 6 mg O2/L (Figure 3). However, beginning at the metalimnion and continuing
through the hypolimnion, concentrations of dissolved oxygen fell close to zero (even far below
the 1-mg O2/L threshold at which sediment-bound phosphorus typically begins to dissolve in
earnest). The relationship between thermal stratification and dissolved-oxygen depletion is
reinforced by the fact that Location 2, which did not seem to stratify, did not experience a
statistically significant drop in dissolved-oxygen concentrations with depth, nor was the water
above the sediment anoxic as it was at Location 1.
Tomasik, Brian 13
Figure 3: Dissolved Oxygen with Depth. (Vertical bars represent ± 1 standard deviation from the mean.)
Precision throughout the epilimnion of Location 1 was fairly good, with coefficients of
variation consistently below 6 percent (Table 4). However, it worsened enormously at and
beyond the metalimnion, where dissolved-oxygen concentrations were too low for precise
readings by the electronic meter. Curiously, precision remained very poor at Location 2 even
though the measured dissolved-oxygen concentrations were close to those observed in the
epilimnion of Location 1. It should be noted that dissolved-oxygen concentrations of the water
below the surface at Location 2 seemed generally to decrease more from one trial to the next
than from one depth to the next. These measurements were taken just as the sun was setting, and
it appears plausible that the rapid decline in sunlight could have substantially slowed
Tomasik, Brian 14
photosynthesis and the attendant production of oxygen. Substantial machine drift is another
possible explanation.
Table 4: Dissolved Oxygen with Depth Location Number
Throughout the entire measurement process for the phosphorus samples, the absorbance
of deionized water changed only from 0.000 to –0.001, indicating that spectrophotometer drift
was negligible. The standard-curve equation—Concentration (µg P/L) = 166.426(Absorbance –
Blank) – 2.0656—had a coefficient of determination (r2 value) of 0.998197. Both my laboratory
accuracy, as measured by two equally concentrated quality-control standards made from Spex
Nut-2 (Table 5), and my laboratory precision, as measured by my duplicates (Table 6), were
quite good, with percents error and coefficients of variation all below 4 percent.
Tomasik, Brian 15
Table 5: Percent Error with Quality-Control Standards Made from Spex Nut-2 Measured Concentration
(µg P/L) Actual Concentration (µg P/L)
Percent Error (%)
Quality-Control Standard 1 8.4 8.65 -2.7 Quality-Control Standard 2 8.4 8.65 -2.7 Table 6: Precision of Laboratory Duplicates Location, Depth, and Trial Number of Sample
Absorbance of Trial 1 at 885 nm
Absorbance of Trial 2 at 885 nm
Standard Deviation
Coefficient of Variation (%)
Location 1, Depth of 1 m, Trial 3
0.107 0.113 0.00424 3.86
Location 1, Depth of 5 m, Trial 3
0.161 0.169 0.00566 3.43
Location 2, Depth of 1 m, Trial 3
0.077 0.078 0.00071 0.91
The precision of the three samples taken separately from each depth (Table 7) was generally
much worse than the precision of duplicates made from a single sample (Table 6), in part
because the former included field imprecision and laboratory imprecision while the latter
measured only laboratory imprecision.
Table 7: Total Dissolved Phosphorus with Depth Location Number
Location 1 showed a statistically significant increase in total dissolved phosphorus from
the top (1 m) to the bottom (5 m) of its epilimnion; similarly, total dissolved phosphorus at
Location 2 was statistically higher at 2 m and 3 m than at 1 m. Secchi-disc transparency (Table
1) revealed that sunlight penetrates at least 1.49 m into the water, so the reservoir’s photic zone
is probably just a few meters deep. Thence, it is possible that some dissolved phosphorus in the
upper epilimnion was consumed by photosynthetic organisms that were incapable of surviving in
the lower epilimnion.
Figure 4: Total Dissolved Phosphorus with Depth. (Vertical bars represent ± 1 standard deviation from the mean.)
Tomasik, Brian 17
Even though dissolved-oxygen concentrations in the hypolimnion were well below 1 mg
O2/L, significant internal phosphorus mobilization does not appear to have occurred. Although
there was a statistically significant increase in total dissolved phosphorus from 1 m and 2 m to 8
m, this increase did not even approach the jump of at least five times, and often more than ten
times, that is typically observed when phosphorus is released from the sediment (Kishbaugh
2004). Moreover, the other three depths in the epilimnion—3 m, 4 m, and 5 m—could not be
considered statistically different from the 8-m depth in total dissolved phosphorus (though the
conclusiveness of this fact is diminished by fairly poor precision at most depths).
The lack of significant phosphorus release during anoxia, while perhaps atypical, is not
unprecedented. Effler and Bader (1998) reported similar findings for New York’s eutrophic
Cannonsville Reservoir: despite the existence of deep-water anoxia through most of August and
early September 1995 (p. 131), total-dissolved-phosphorus concentrations measured on 29
August 1995 were virtually uniform throughout the water column (p. 136), and no major
discharge of phosphorus from the sediments was observed during that period (p. 134). To
explain this, the authors cited the findings of Froelich et al. (1979) and Kelly et al. (1988):
during anoxia, thermodynamic properties cause such electron acceptors as Mn4+ and NO3- to be
reduced before Fe3+. Since it is the reduction of Fe3+ that mobilizes iron-bound phosphate,
internal phosphorus loading should not be expected so long as the more thermodynamically
favored electron acceptors remain. This was indeed the case for the Cannonsville Reservoir,
whose hypolimnetic NOx supply was never fully depleted throughout the entire period of anoxia
in 1995 (Effler and Bader 1998, p. 134). Whether or not this explanation applies to the
Watervliet Reservoir, however, cannot be determined, inasmuch as its hypolimnetic Mn4+ and
NOx were not measured.
Tomasik, Brian 18
While no significant phosphorus release was detected in mid-August 2004, it is still
possible that internal phosphorus loading occurred later in the summer, after sampling was
completed, or will occur at some point in the future. For example, if the Cannonsville-Reservoir
conditions do in fact apply to the Watervliet Reservoir, phosphorus release could be triggered if
electron acceptors like NO3- decline in future years (Erickson and Auer 1998, p. 275).
In spite of these limited conclusions, it is hoped that this study will provide at least
tentative limnological information for citizens and local governments seeking to manage
excessive plant growth on and improve the water quality of the Watervliet Reservoir.
Conclusions
Measurements taken on the Watervliet Reservoir in August 2004 indicated the existence
of thermal stratification at depths of at least 5.0 m and the virtual absence of dissolved oxygen in
the hypolimnion, yet it did not appear that this anoxia triggered any significant liberation of
sediment-bound phosphorus. Unless a more extensive, long-term study is conducted, however,
the possibility that internal phosphorus loading might occur at some point in the future should
not be ruled out.
Acknowledgements
I would never have embarked on this project had it not been for Tom Mikulka, my tenth-
grade chemistry teacher, who, in addition to introducing me to the topic of phosphorus in the
Watervliet Reservoir, has provided invaluable guidance, insight, and encouragement throughout
the entire research process. This study was also made possible by Stephen Wilson, who let me
take his boat out onto the reservoir, Scott Kishbaugh, who provided me with measurement and
Tomasik, Brian 19
sampling equipment, and Dave Winkler, who allowed me to use his laboratory at RPI.
Additionally, I wish to thank Donald Aulenbach, Larry Eichler, and Art Holmer for their
contributions to my understanding of phosphorus ecology and analysis procedures, as well as
Tim Howard and Michelle Tomasik for their generous assistance with my research report.
References Addy K, Green L. 1996. Phosphorus and lake aging. University of Rhode Island. (Fact Sheet No.
96-2). http://www.uri.edu/ce/wq/ww/resources/p&aging.pdf (6 Aug. 2004). ---. 1997. Dissolved oxygen and temperature. University of Rhode Island. (Fact Sheet No. 96-3).
http://www.uri.edu/ce/wq/ww/resources/dotemp.pdf (6 Aug. 2004). Auer MT, Tomasoski KA, Babiera MJ, Needham ML, Effler SW, Owens EM, Hansen JM. 1998
September. Phosphorus bioavailability and P-cycling in Cannonsville Reservoir. Lake and Reserv Manage 14 (2-3): 278-289.
Aulenbach DB. Re: measuring phosphates. [personal email]. (16 Dec. 2002). ---. Re: phosphorus in sediment. [personal email]. (17 Feb. 2003). Capital District Regional Planning Commission [CDRPC]. Watervliet Reservoir watershed
protection study. Albany (NY): CDRPC. 147 p. CDRPC. http://www.cdrpc.org/Watervliet_Reservoir/Study.pdf (8 July 2004).
Curry K. 1994 spring. Phosphorus testing tips. The Volunteer Monitor. 1998. EPA. http://www.epa.gov/volunteer/spring94/ppresf22.htm (14 Oct. 2002).
Dates G. 1994 spring. Monitoring for phosphorus. The Volunteer Monitor. 1998. EPA. http://www.epa.gov/volunteer/spring94/ppresf19.htm (14 Oct. 2002).
Department of Ecology (WA) [Ecology]. 2002 July. Quality assurance project plan: Lake Whatcom TMDL study. Olympia: Ecology. 47 p. Ecology. (Publication Number 02-03-074) http://www.ecy.wa.gov/pubs/0203074.pdf (8 July 2004).
Eaton AD, Clesceri LS, Greenberg AE, editors. 1995. Standard methods for the examination of water and wastewater. 19th edition. Washington, DC: American Public Health Association, American Water Works Association, Water Environment Federation.
Effler SW, Bader AP. 1998 September. A limnological analysis of Cannonsville Reservoir, NY. Lake and Reserv Manage 14 (2-3): 125-39.
Eichler L. Re: phosphorus in sediment. [personal email]. (27 Feb. 2003). Erickson MJ, Auer MT. 1998 September. Chemical exchange at the sediment-water interface of
Cannonsville Reservoir. Lake and Reserv Manage 14 (2-3): 266-77. Fields CL, Houge AN, Bailey HJ, Iqbal MZ, Brown EJ. 2001. Vertical distribution of available
phosphorus in the bottom sediments of a biologically restricted lake [abstract]. In: Geological Society of America Annual Meeting; 2001 Nov. 8; Boston. Paper No. 175-0. http://gsa.confex.com/gsa/2001AM/finalprogram/abstract_25525.htm (18 Dec. 2002).
Fresh Water Institute [FWI]. 1971 Dec. The nitrogen and phosphorus balance of Lake George. Troy (NY): Rensselaer Polytechnic Institute. FWI Report No. 72-11B.
Tomasik, Brian 20
---. 1971 Dec. Nitrogen and phosphorus cycles in the Lake George ecosystem. Troy (NY): Rensselaer Polytechnic Institute. FWI Report No. 72-11A.
---. 1973 Apr. Sources of nitrogen and phosphorus in the Lake George drainage basin: a double lake. Troy (NY): Rensselaer Polytechnic Institute. FWI Report No. 73-1.
---. Sources and sinks of nitrogen and phosphorus: water quality management of Lake George (NY). Troy (NY): Rensselaer Polytechnic Institute. FWI Report No. 72-32.
Froelich PN, Klinkhammer GP, Bender ML, Luedtke NA, Heath GR, Cullen D, Dauphin P, Hammond D, Hartman B, Maynard V. 1979. Early oxidation of organic matter in pelagic sediments of the eastern equatorial Atlantic: suboxic diagenesis. Geochim Cosmochim Acta 43: 1075-90.
Geological Survey (US) [USGS]. 1998. Hydrology, water quality, and phosphorus loading of Kirby Lake, Barron County, Wisconsin. USGS. 4 p. USGS. (Fact Sheet 066-98). http://wi.water.usgs.gov/pubs/FS-066-98/fs-066-98.pdf (8 July 2004).
---. 1999 Oct. Phosphorus loads entering Long Pond, a small embayment of Lake Ontario near Rochester, New York. USGS. 4 p. USGS. (Fact Sheet 128-99). http://ny.water.usgs.gov/pubs/fs/fs12899/FS128-99.pdf (8 July 2004).
---. 2002. Sources and concentrations of phosphorus in the Cheney Reservoir watershed, south-central Kansas. USGS. 4 p. USGS. (Fact Sheet 010-02). http://ks.water.usgs.gov/Kansas/pubs/fact-sheets/fs.010-02.pdf (8 July 2004).
Green J, Sexton M. Comparative lake study in the Adirondack region. Rensselaer Polytechnic Institute. http://www.rpi.edu/dept/chem-eng/Biotech-Environ/Environmental/Lake/ (11 Aug. 2004).
Guilderland Study Circles. 2003. On water quality 2003. Guilderland: Guilderland Study Circles. 31 p.
Holdren C, Jones W, Taggart J. 2001. Managing lakes and reservoirs. Madison: N Am Lake Manage Soc and Terrene Inst. 382 p.
Kelly CA, Rudd JWM, Schindler DW. 1988. Carbon and electron flow via methanogenesis, reduction in anoxic hypolimnion of three lakes. Arch Hydrobiol Beih Ergebn Limnol 31: 333-44.
Kishbaugh S. Re: reservoir-sampling devices. [personal email]. (19 July 2004). Palladine RM. Comparison of phosphorus loading in the West Brook and Northwest Bay Brook
Watersheds, Lake George, NY [thesis]. Troy (NY): Rensselaer Polytechnic Institute. Pierzynski GM, editor. 2000. Methods of phosphorus analysis for soils, sediments, residuals, and
waters. North Carolina State University. 110 p. North Carolina State University. (Southern Cooperative Series Bulletin No. 396). http://www.soil.ncsu.edu/sera17/publications/sera17-2/p_methods2000.pdf (5 Nov. 2002).
Simpson JT. Volunteer lake monitoring. EPA. (EPA440-4-91-002). http://www.epa.gov/volunteer/lake/lakevolman.pdf (8 July 2004).
Tölgyessy J, editor. 1993. Chemistry and biology of water, air, and soil: environmental aspects. Amsterdam: Elsevier.
Vollenweider RA. 1975. Input-output models with special reference to the phosphorus loading concept in limnology. Schweiz J Hydrol 33: 53-83.
Wetzel RG. 2001. Limnology: lake and river ecosystems, third edition. San Diego: Academic Press. 1006 p.