Investigation of Keeper Erosion in the NSTAR Ion Thruster Matthew T. Domonkos, John E. Foster, and Michael J. Patterson NASA John H. Glenn Research Center Mail Stop 301-3 21000 Brookpark Road Cleveland, Ohio 44135 216-433-2164 [email protected]George J. Williams, Jr. Ohio Aerospace Institute Cleveland, Ohio IEPC-01-308 * Abstract The goal of the present investigation was to determine the cause for the difference in the observed discharge keeper erosion between the 8,200 hour wear test of a NASA Solar Electric Propulsion Technology Applications Readiness (NSTAR) engineering model thruster and the ongoing extended life test (ELT) of the NSTAR flight spare thruster. During the ELT, the NSTAR flight spare ion thruster experienced unanticipated erosion of the discharge cathode keeper. Photographs of the discharge keeper show that the orifice has enlarged to slightly more than twice the original diameter. Several differences between the ELT and the 8,200 hour wear test were initially identified to determine any effects which could lead to the erosion in the ELT. In order to identify the cause of the ELT erosion, emission spectra from an engineering model thruster were collected to assess the dependence of keeper erosion on operating conditions. Keeper ion current was measured to estimate wear. Additionally, post-test inspection of both a copper keeper-cap was conducted, and the results are presented. The analysis indicated that the bulk of the ion current was collected within 2-mm radially of the orifice. The estimated volumetric wear in the ELT was comparable to previous wear tests. Redistribution of the ion current on the discharge keeper was determined to be the most likely cause of the ELT erosion. The change in ion current distribution was hypothesized to caused by the modified magnetic field of the flight assemblies. * This paper is declared a work of the U.S. Government and is not subject to copyright protection in the United States. IEPC-01-308 27 th International Electric Propulsion Conference Nomenclature A ij = Einstein coefficient for spontaneous emission, s -1 C = 1.3 x 10 -5 atoms/ion for Mo D ko = keeper orifice diameter, m D kp = keeper plate diameter, m e = charge on the electron, 1.6 x 10 -19 C E B = energy of level B, eV E H = energy of level H, eV E i = ion energy, eV E th = threshold energy for sputtering (eV) (v f r = normalized velocity distribution function g i = statistical weight of ith level I d = discharge current, A J = angular momentum quantum number J k = total ion current to the keeper, A m = atomic mass, kg n x = number density of species x, m -3 N A = Avogadro’s number, 6.022 x 10 26 atoms/kmol r new = beginning of life keeper orifice radius, m r obs = observed keeper orifice radius, m R = ratio of double-to-single ion current
Transcript
Investigation of Keeper Erosion in the NSTAR Ion Thruster
Matthew T. Domonkos, John E. Foster, and Michael J. Patterson
NASA John H. Glenn Research Center Mail Stop 301-3
Abstract The goal of the present investigation was to determine the cause for the difference in the observed discharge keeper erosion between the 8,200 hour wear test of a NASA Solar Electric Propulsion Technology Applications Readiness (NSTAR) engineering model thruster and the ongoing extended life test (ELT) of the NSTAR flight spare thruster. During the ELT, the NSTAR flight spare ion thruster experienced unanticipated erosion of the discharge cathode keeper. Photographs of the discharge keeper show that the orifice has enlarged to slightly more than twice the original diameter. Several differences between the ELT and the 8,200 hour wear test were initially identified to determine any effects which could lead to the erosion in the ELT. In order to identify the cause of the ELT erosion, emission spectra from an engineering model thruster were collected to assess the dependence of keeper erosion on operating conditions. Keeper ion current was measured to estimate wear. Additionally, post-test inspection of both a copper keeper-cap was conducted, and the results are presented. The analysis indicated that the bulk of the ion current was collected within 2-mm radially of the orifice. The estimated volumetric wear in the ELT was comparable to previous wear tests. Redistribution of the ion current on the discharge keeper was determined to be the most likely cause of the ELT erosion. The change in ion current distribution was hypothesized to caused by the modified magnetic field of the flight assemblies.
* This paper is declared a work of the U.S. Government and is not subject to copyright protection in the United States. IEPC-01-308 27th International Electric Propulsion Conference
Nomenclature
Aij = Einstein coefficient for spontaneous emission, s-1
C = 1.3 x 10⁻⁵ atoms/ion for Mo Dko = keeper orifice diameter, m Dkp = keeper plate diameter, m e = charge on the electron, 1.6 x 10⁻¹⁹ C EB = energy of level B, eV EH = energy of level H, eV Ei = ion energy, eV Eth = threshold energy for sputtering (eV)
( )vfr
= normalized velocity distribution function gi = statistical weight of ith level Id = discharge current, A J = angular momentum quantum number Jk = total ion current to the keeper, A m = atomic mass, kg nx = number density of species x, m-3
NA = Avogadro’s number, 6.022 x 1026 atoms/kmol
rnew = beginning of life keeper orifice radius, m robs = observed keeper orifice radius, m R = ratio of double-to-single ion current
vsh = velocity acquired in the sheath, m/s vx, vy, vz= velocity components, m/s Va = density based volume of an atom, m3 Vd = discharge voltage, V V& = volumetric erosion rate, m3/s Y(Ei) = sputter yield, atoms/ion Y++(Ei) = sputter yield of double ions at energy Ei,
atoms/ion λy = stochastic yield factor ρ = mass density, kg/m3 Subscripts CuI = neutral copper CuI* = neutral copper in a low-lying excited state CuI** = neutral copper in a high-lying excited state e = electron XeI = neutral xenon XeII = singly ionized xenon XeIII = doubly ionized xenon
Introduction
The NASA Solar Electric Propulsion Technology Applications Readiness (NSTAR) 30-cm ion thruster on the Deep Space One spacecraft is the first ion engine deployed for primary propulsion and has operated longer than any other in-space thruster.[1] The successes of Deep Space One have led to efforts to develop more powerful thrusters capable of significantly increased propellant throughput.[2] The Jet Propulsion Laboratory (JPL) is conducting the ongoing Extended Life Test (ELT) of the NSTAR flight spare thruster.[3] In the ELT, the flight spare ion engine has experienced unanticipated erosion of the discharge cathode keeper. During a previous 8,200 hour wear test of an engineering model thruster, discharge cathode keeper erosion was limited to slight chamfering of the downstream face and orifice.[4] Evaluation of images of the discharge cathode keeper taken during the ongoing Extended Life Test has revealed extensive erosion. Images taken after 12,000 hours of testing show that the keeper orifice had enlarged significantly. Although the keeper electrode wear-rate appears high in the ELT, the engine continues to operate successfully after more than 18,000 hours. The experience of the 8,200 hour test led to the expectation that erosion in the ELT would be similar. The investigation reported here sought to determine the cause for the erosion observed during the ELT to facilitate management of the apparently high wear-rate condition.
Under the NSTAR program, the NASA 30-cm ion thruster design evolved into that used on the Deep Space One spacecraft. The 8,200 hour wear test engine (EMT2), the flight engine on Deep Space One (FT1), and the flight spare engine in the ELT (FT2) have processed 88, over 60, and over 153 kg of xenon, respectively. The longevity of the NASA 30-cm ion engine was established through so called derated operation and design modifications implemented following several wear tests. Derated operation refers to the limitation of the operating regime to low discharge voltage and low beam current density in order to extend component life. This approach failed to protect the discharge cathode sufficiently during a 2,000 hour wear test.[5] The engineering solution to this wear issue was to use a cathode keeper to protect the discharge cathode. Subsequent wear tests[4,6] demonstrated that the addition of the keeper mitigated the cathode erosion, and the keeper eroded sufficiently slowly to alleviate concerns for the Deep Space One mission. Based on this experience, the erosion observed in the ELT appeared anomalous. The investigation reported here sought to determine the cause for the discharge keeper wear. This report summarizes the investigation of the discharge cathode keeper wear during the ELT. First, the experiences with the ELT and the NSTAR wear test thrusters are compared, and the differences in the tests are listed. Next, several hypotheses are proposed to explain the ELT erosion. The experiments conducted at the NASA Glenn Research Center (GRC) are presented and discussed. Some of the results of the experimental investigation are used to model the volumetric erosion rate in the ELT, and a comparison with observations is made. Finally the major conclusions of the experiments are reported.
Background
Adoption of the derated approach for the NSTAR ion engine has enabled high-throughput and extended life. The successes of the NSTAR ion engine in the 8,200 hour wear test, on Deep Space One, and in the Extended Life Test have shifted the focus of ion thruster endurance research toward components in the discharge chamber which were previously considered to have substantial service life margin. The low discharge voltages (typically about 25-V) employed in the NSTAR program have enabled engine life well in excess of 10,000 hours, however the increased
discharge currents required for next-generation ion engines and the extended service life requirements necessitate greater control of component wear than demonstrated to date.
Ion Engine Operation The NSTAR ion engine is a ring-cusp design, as shown in Figure 1. The discharge hollow cathode creates an internal plasma which enables emission of an electron current in excess of space charge limitations. A magnetic circuit is created within the ion thruster using permanent magnets in a ring-cusp configuration, and the electrons emitted by the hollow cathode stream toward the anode along the magnetic field lines. Neutral xenon is also injected directly into the discharge chamber. Collisions between the electrons and neutrals create the ions in the discharge chamber. The magnetic circuit also acts to control the effective anode area and to contain the high-energy electrons for ionization while thermalized low temperature (a few eV) electrons conduct the current to the anode.[7] The ions are focused and accelerated by the grids, while the electrons are contained within the discharge chamber. The discharge hollow cathode is operated at relatively high-current to generate sufficient ions to sustain the beam current. Under ideal conditions, the bulk of the discharge can be thought of as quasineutral plasma consisting of various ion species, and primary and Maxwellian electrons. The steady-state potential in the quasineutral plasma has been measured to be 4 to 7-V above the anode.[8] Sheath regions bring the local space charge from plasma potential to the respective electrode potentials. Consequently the energy of ions which strike the keeper is expected to be the product of their charge state and the difference between the bulk plasma and keeper potentials. Real ring-cusp discharge chambers experience high frequency discharge voltage and current oscillations. The discharge voltage oscillations are dependent upon the power supply and the discharge and cathode flow rates. Typically increases in discharge voltage oscillations are coupled to reduced flow rate and increased discharge voltage. Consequently, the discharge voltage oscillations indicate the creation of high-energy ions capable of accelerating wear.
Discharge Chamber Erosion Two erosion processes occur within ion engine discharge chambers under the conditions of the Extended Life Test. Sputtering by xenon ions of the ion collecting surfaces is the primary erosion mechanism under normal thrusting operations. Erosion of discharge chamber components occurs at and slightly above sputtering threshold energies. Numerous works[9,10,11,12,13,14] have attempted to quantify low energy sputter yields with varied success, and attempts to improve the accuracy of the data are left to others. Reliable sputter yield data are only available above 100-eV, and several models have been proposed for the behavior of the yield curve below 100-eV.[9,10,11,12,13,14] Mantenieks[9] suggests the use of the theory by Wilhelm[11] which describes the yield as dependent upon the square of the ion energy for normal incidence
( )2thii EEC)E(Y −= (1)
Equation 1 will be used in the present investigation, and the dependency of molybdenum sputtering due to xenon is plotted in Figure 2. Small changes in discharge voltage or surface potential within the discharge chamber translate to large relative changes in the sputter yield. Consequently, sputtering of discharge chamber components is expected to scale strongly with discharge voltage and the potential of the component. Additionally, the sputter yield predicted by Equation 1 is assumed to be independent of the ion charge state. Singly charged ions incident at large angles will sputter surfaces at energies below that depicted in Figure 2.[13] Williams[15] measured singly charged ions flowing toward the discharge cathode keeper at large angles outside of the sheath. Nevertheless, erosion by single ions incident at large angles is expected to contribute weakly to the overall sputter rate since the fall voltage will provide most of the ion velocity, yielding near normal incidence. With sufficient experimental data, the erosion-rate of components due to sputtering can be calculated for arbitrary ion populations with normal incidence. The volumetric erosion rate is the product of the velocity, the yield, and the velocity distribution function integrated over the range of velocities above threshold in the direction of the component surface.
)v(f)vv(Y)vv(dvdvdvnVV shzshzvv zyxashth
r& ++= ∫ ∫∫∞
∞−
∞
−
∞
∞− (2)
The number density in Equation 2 may be estimated by measuring the ion current to the component and assuming the ions entering the component sheath have at least the Bohm velocity based on the electron temperature. The nature of the sputter yield near threshold suggests that double ions in the ion engine discharge chamber are responsible for the bulk of the sputtering provided they are on the order of ten percent of the ion current to a component. By assuming that the double ions are overwhelmingly responsible for erosion and the ion temperature is sufficiently low that a beam approximation is valid, Equation 2 may be simplified as follows.
( )ρ
λ
+= ++ A
yik mN
EY1R
Re2
JV& (3)
Note that λY is a stochastic yield correction factor which accounts for non-orthogonal angle of incidence sputtering, variations in ion sputtering energies, and re-deposition of sputtered material. While ion current can easily be measured for the keeper, the ratio of double-to-single ion current to the discharge cathode keeper and the low-energy sputter yield are poorly quantified at present, and the application of Equation 3 must acknowledge the uncertainties in the result. The cathode erosion in the 2,000-hour wear test[5] and the discharge keeper erosion in the 1,000-hour wear test[6] motivated the evaluation ion motion and erosion products in the 30-cm ion engine by Williams.[15,16,17,18] The objective of the investigation was to evaluate the role of the keeper in the reduction of discharge cathode assembly erosion. The erosion of the cathode in both keepered and un-keepered configurations was shown to be proportional to discharge current and to discharge voltage, however, the erosion of the keeper was significantly less than that of the unprotected cathode. Laser induced fluorescence velocimetry of Xe II near the exit of the cathode indicated that the singly ionized xenon would have sufficient energy to erode the surfaces if there existed a 20-V or 16-V drop across the cathode or keeper sheaths, respectively.[16,17] The plasma potential distribution within the NSTAR ion engine remains unknown, and the assumption of the fall voltage, though reasonable, requires verification. The investigation was completed before results of the extended life test were published, precluding thruster operation at the varied operating conditions experienced during the ELT. The investigation also indicated the erosion resulted from a
combination of singly and doubly ionized xenon ion impingement and that resolution of the relative contributions would require measurement of the relative number densities. Erosion of discharge chamber components can also occur when measuring the electron backstreaming limit. To measure the backstreaming limit in the ELT, the accelerator grid bias is increased toward zero volts until the discharge losses are observed to decrease by one percent.[3] The technique was adopted because the closed loop control of the discharge current maintains a nearly constant beam current. The decrease in discharge losses is caused by electrons from the beam plasma or neutralizer which are able to fall into the discharge chamber with the reduced accelerator grid bias. The backstreaming electron current allows the closed loop control to decrease the discharge power for a constant beam current, thereby reducing the losses. The technique employed in the ELT typically results in less negative accelerator grid voltages than the tests at constant discharge current.[19] Elevated accelerator grid potential results in increased backstreaming electron current. Electron backstreaming is expected to be most pronounced on centerline where the ion current density is greatest; the ions act to shield the centerline potential of the apertures from the full accelerator grid voltage, resulting in a reduced stopping potential for backstreaming electrons. Since this phenomenon is expected to follow the ion current density profiles, the discharge cathode and keeper are expected to collect a large fraction of the backstreaming electron current. The backstreaming electron beam can vaporize components provided sufficient current density and acceleration potential. In fact, monitoring of the discharge cathode keeper temperature provides the most conservative measure of the electron backstreaming limit.[19] Although the technique used to measure the electron backstreaming limit in the ELT results in increased electron backstreaming, the necessary data to rigorously evaluate the contribution of this phenomenon on keeper erosion were not taken for the ELT, and evaporation of molybdenum only becomes comparable to wear rates in the 8,200-hour wear test above 2000-K.[20]
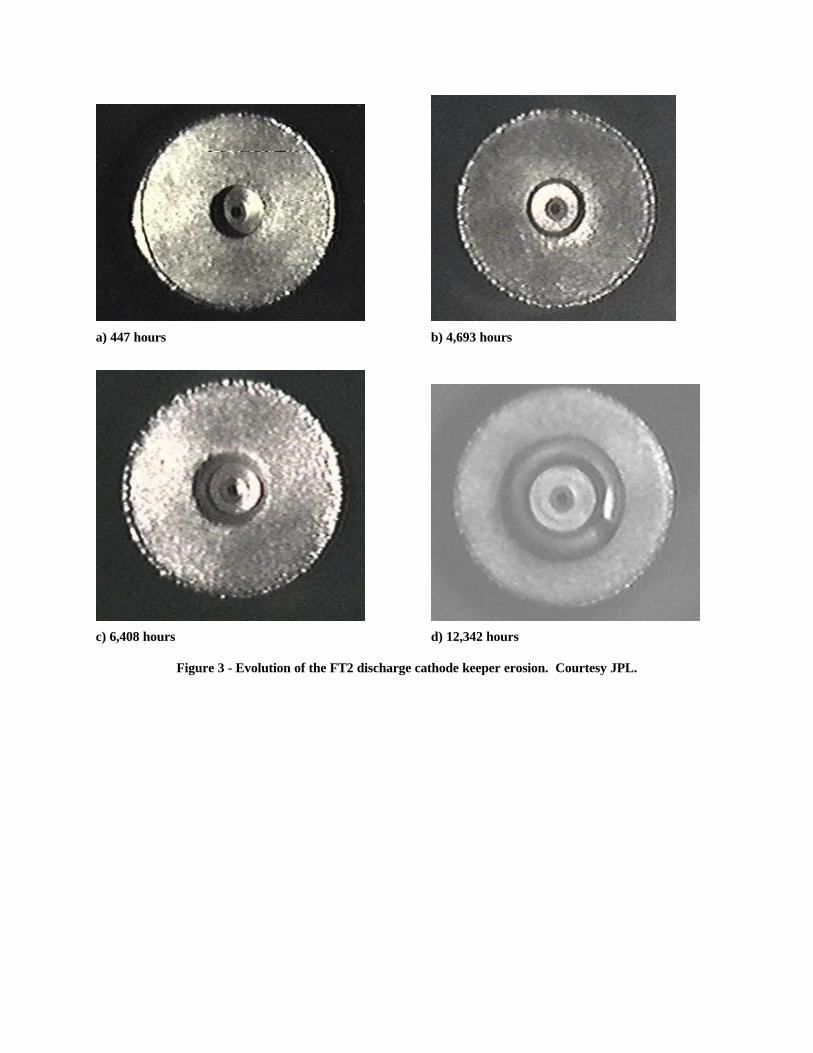
Extended Life-Test Erosion Photographs taken outside of the vacuum facility of the discharge cathode keeper on FT2 are shown in
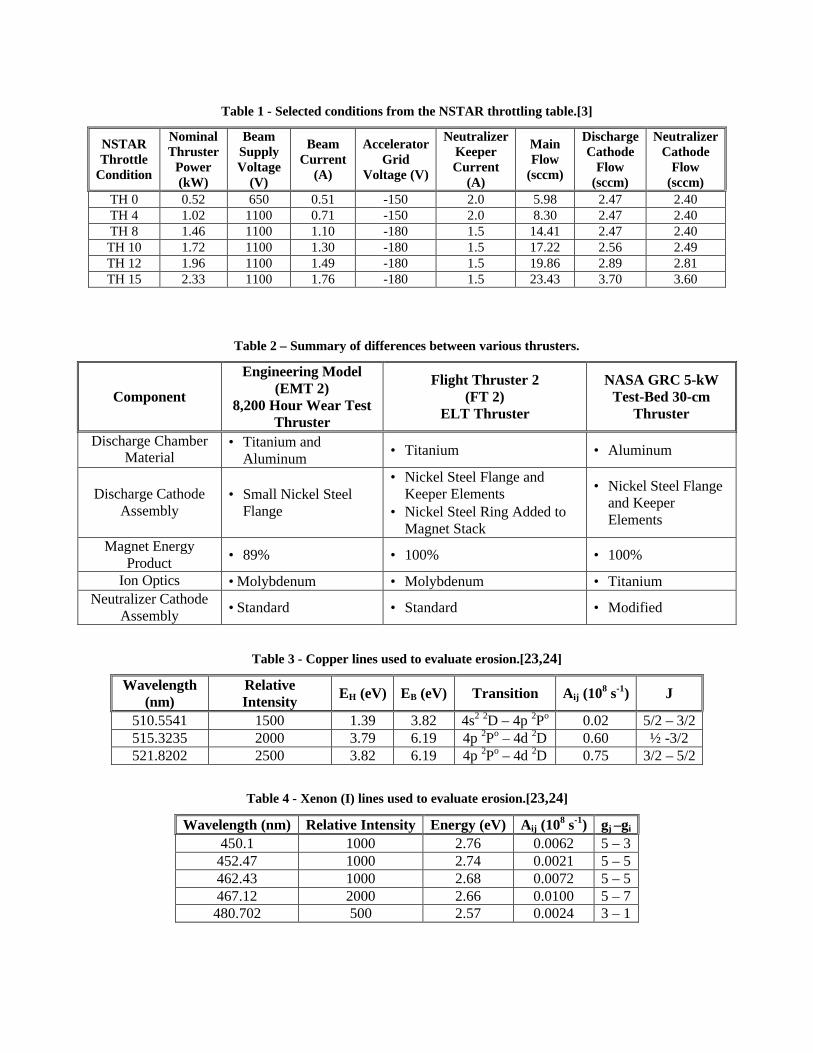
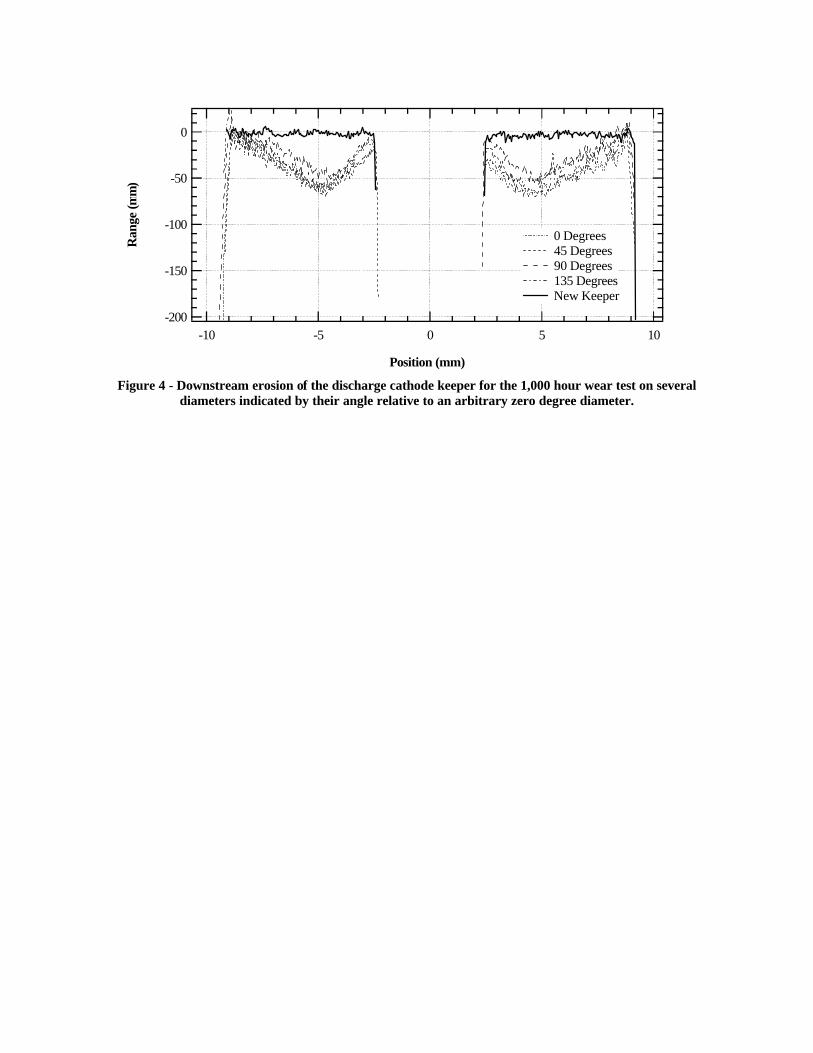
Figure 3. Photographs and data from the ELT were furnished courtesy of JPL. For reference purposes, the keeper orifice plate diameter is 1.91-cm. After 447 hours the keeper showed negligible wear. By 4,693 hours, a small chamfer was evident on the keeper orifice. The observed erosion accelerated between 4,693 and 6,408 hours as shown in Figure 3c. The rate of increase in the keeper orifice diameter appeared to be approximately constant through 12,342 hours. Since the ELT is ongoing, the photographs in Figure 3 constitute the best measurement of the keeper erosion currently available. Although post-test analysis will enable greater examination of the keeper, this investigation was limited to the information contained within the photographs. Subsequent to the 2,000 hour evaluation, wear tests of approximately 1,000 and 8,200 hours of thrusters with enclosed discharge cathode keepers suggested that the increase in keeper orifice diameter would be significantly less than that observed. In all of the tests with a discharge cathode keeper, it was tied to anode through a 1-kΩ resistor and consequently floated a few volts positive of cathode. The 1,000 hour wear test was conducted predominately at the maximum power condition (TH15).[6] The relevant conditions from the NSTAR throttling table are reproduced in Table 1 for convenience.[3] The keeper potential averaged 4.6-V ± 0.1-V above cathode and drew approximately 20-mA of current.[6] Figure 4 shows four profiles of the downstream face of the discharge cathode keeper from the 1,000-hour wear test. Since the initial condition of the keeper face was not measured, the profile of a new keeper fabricated to the same specifications was used as a reference. In the profiles, the outer edge of the keeper was assumed to be the reference point. The comparison, shown in Figure 4, indicates that the erosion was greatest at a radius of 5-mm without an observable chamfer on the orifice. The maximum wear rate observed in the 1000-hr test discharge keeper was approximately 70-µm/khr. Post-test destructive analysis from the 8,200-hour wear test also shows moderate discharge cathode keeper erosion with a pattern similar to that of the 1,000-hour test keeper.[4] The 8,200-hour wear test was also conducted primarily at the maximum throttle condition (TH15).[4] Although the orifice exhibited significant erosion, the maximum wear rate was observed on the downstream face, similar to the erosion of the 1,000-hour test. The maximum wear rate was approximately
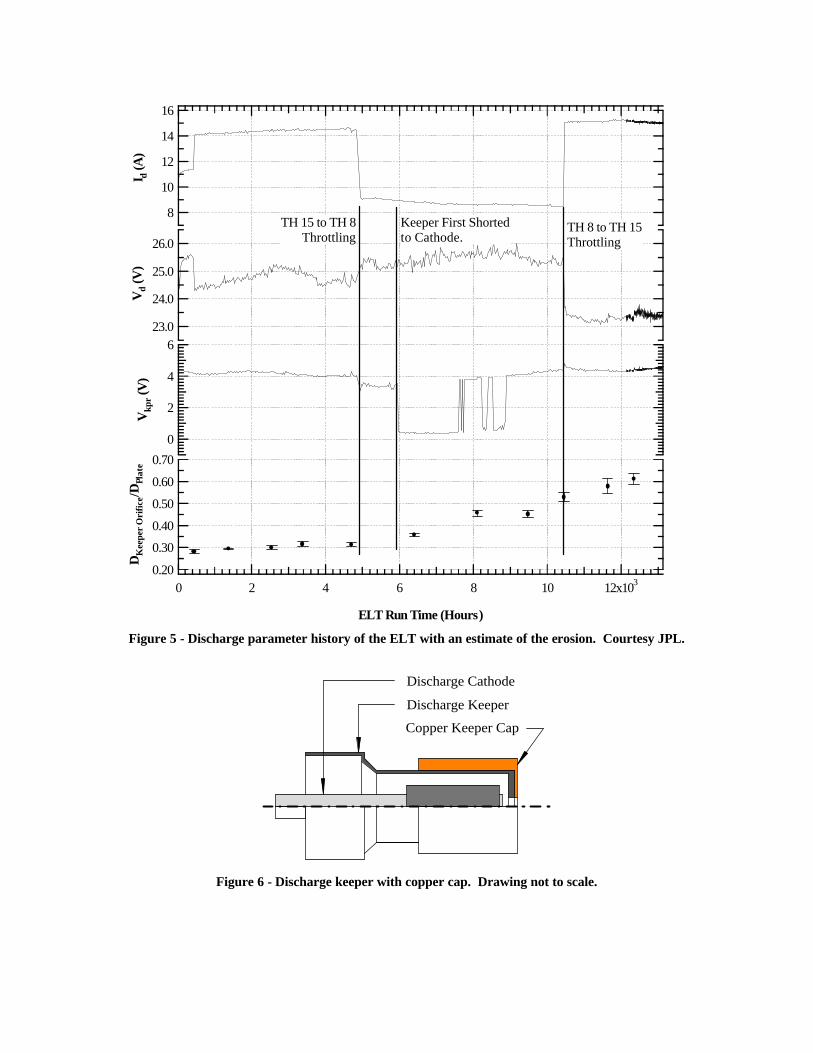
64-µm/khr at a radius of 5.3-mm. Since the two wear tests conducted with a discharge cathode keeper exhibited similar and modest wear, both the Flight Thruster 1 (FT1) on Deep Space One and FT2 were expected to erode at the same rate and pattern observed in the previous wear tests. The flight thrusters incorporated several design changes to enable survival of the launch vibration environment. One of the modifications involved the discharge cathode-keeper assembly. The flight thrusters incorporate more nickel-steel than the engineering models in the keeper and cathode flange. The additional magnetic nickel-steel acted subtly to shield the discharge chamber from the full strength of the magnet ring near the cathode. The field strength at the cathode tip was slightly below specification, and a cold steel ring was added to the magnet ring to boost the field strength at the tip.[21] A coarsely spaced direct measurement of the magnitude of the magnetic field in the flight thrusters and the engineering models revealed negligible differences.[21] The test conditions during the ELT differed from the previous wear tests, and thruster discharge current, discharge voltage, and keeper potential are presented in Figure 5. At approximately 450 hours, the thruster was set to TH 15 where it operated until 4,835 hours run time. Between 4,835 and 10,445 hours, the thruster was operated at TH 8. The thruster was then throttled to TH 15. Prior to the ELT, TH15 was thought to be the most demanding condition in terms of component wear. Since the ion flux to surfaces is a function of discharge current, TH 15 with the highest discharge current was expected to represent the harshest operating condition. The erosion was observed to increase only after an extended duration at TH 8. The estimated keeper orifice diameter, normalized to the keeper outer diameter, is also presented in Figure 5. The orifice diameter was estimated from the images provided by JPL. Between 5,935 and 5,961-hours, the discharge keeper potential suddenly dropped to very near cathode potential. The event occurred during a routine high-voltage resistance test.[3] The condition persisted until at least 7,604-hours. Several additional “shorting” events occurred over the next 1,300-hours. The total integrated time with the keeper at reduced potential to cathode was approximately 2,100-hours.
Despite the keeper erosion the ELT is ongoing. At approximately 15,623-hours, the ion engine was throttled to TH0. The ELT has currently run in excess of 18,420-hours. The investigation presented here deals only with the events prior to 13,133-hours.
Investigative Approach
Given the background on the ELT, several hypotheses to explain the ELT discharge keeper erosion were proposed, and this paper seeks to evaluate them. Since the initially observed increase in erosion occurred between 4,693 and 6,408 hours, changes in the operating conditions were suspect. • The shorting events where the discharge keeper
potential was very near cathode potential would increase bombarding ion energy and thereby the erosion rate.
• If TH8 produced a greater fraction of double ion current near the keeper than TH15, then increased erosion may result.
• The magnitude of discharge voltage oscillations induced by inadvertently low flow rates would yield some additional energetic ion current, increasing wear.
• The magnetic circuit of the EMTs and the FTs were known to be subtly different. If the divergence of the magnetic field at the cathode tip altered the ionization region downstream of the discharge keeper, the FTs may exhibit greater wear rates or altered wear patterns.
• The technique for measuring electron backstreaming is known to result in greater backstreaming currents than other methods. Sufficient backstreaming current density upon the keeper would result in local vaporization.
Emission of high-energy ions from the discharge cathode was also considered, however a keeper tends to confine high-energy ions along the centerline, resulting in low ion flux to the keeper.[22] This investigation evaluates the hypotheses of keeper potential, throttling condition, and discharge voltage oscillations experimentally. The effects of the differing magnetic circuits and electron backstreaming are discussed based on numerical results. The cumulative wear of the keeper is also calculated based on the ELT data and empirically determined parameters.
Experimental Evaluation At the time of this investigation, the only means to evaluate internal erosion in real-time at GRC was through the use of optical emission spectroscopy. Since the emission spectra of eroded material was expected to be weak in the low voltage discharge chamber of an NSTAR ion thruster, copper was chosen to increase the density of target atoms and thereby the intensity of the emission signal. Stuart and Wehner[9,10] reported the sputter thresholds of copper and molybdenum to be about 15-V and 27-V, respectively. This comparison suggests that a copper keeper in the NSTAR discharge chamber will be sputtered by single ions to a greater degree than a molybdenum keeper. Nevertheless the double ions, which for low voltage discharges are the primary contributors to molybdenum keeper erosion, play a strong role in copper keeper erosion as well; the shape of the sputter yield curve near threshold ensures that double ions yield several times as many sputtered atoms as single ions. The erosion of the copper keeper will more closely mimic the erosion of a molybdenum keeper at high double-to-single ion current ratio, or in the case of the NSTAR engine, high throttling condition. While the lack of detailed information about the low-energy sputter yield of copper or molybdenum precludes drawing a well-defined comparison between copper and molybdenum keeper erosion, the copper keeper is expected to be representative of the sputter trends of the molybdenum keeper.
Thruster The NASA GRC 5-kW test-bed thruster was operated in Vacuum Facility 11 (VF-11) for these tests. The thruster is an NSTAR derivative 30-cm thruster, and the significant differences between this thruster and the flight thrusters are listed in Table 2. Of the fabrication differences, only the magnetic field topography was considered capable of alteration of the erosion phenomenon at the discharge keeper. The test-bed thruster employed the same discharge cathode assembly used in the flight thrusters. Since the standard keeper assembly precluded replacement with a copper keeper, a copper sleeve was fabricated as illustrated in Figure 6. The thickness of the copper keeper plate was 0.5-mm and the orifice blended smoothly with the molybdenum keeper orifice. The use of a cap was expected to increase the ion current collected by the keeper in proportion to the increased
surface area, and the additional length altered the ionization region slightly. The keeper cap added 25 percent to the surface area of the keeper. Nevertheless, the performance of the thruster appeared unaffected by the keeper cap, suggesting that any change in the keeper ion current was negligible. Prior to testing, the machining marks were clearly visible on the downstream surface of the keeper. A thermocouple was attached to the side of the copper cap to monitor the temperature during the tests. Following examination of the copper cap installation, the titanium ion optics were mounted, and the thruster was placed in VF-11.
Test Conditions The primary goal of the experimental investigation was to determine the sensitivity of keeper erosion to throttling condition, keeper potential, and discharge voltage oscillations. The discharge voltage oscillations were increased by reducing the discharge cathode flow-rate. The increase in the voltage oscillations was coupled to a small discharge voltage increase. A test plan was developed both to determine the relative keeper erosion rate as a function of TH level and to evaluate the sensitivity to keeper potential and discharge oscillations relative to TH level. The emission spectra from the copper keeper were collected at TH 0, 4, 8, 10, 12, and 15 (see Table 1). Additionally, the sensitivity was evaluated using a two-level full-factorial test matrix consisting of the throttling condition, keeper bias, and discharge voltage oscillations.
Optical Diagnostics To obtain emission spectra of the eroded copper, direct optical access to the discharge chamber was required. All of the emission collection optics were external to VF-11, and optical access was through a 15-cm diameter window port, with a normal 20° off the thruster and tank axis. A 35-200 mm zoom lens was used to couple the incoming light into a 0.5-m spectrometer. The lens collected the light emitted within a volume including the discharge keeper. Consequently the results presented here represent an integrated value. The zoom lens assembly transmitted light from 400 to about 700-nm. A photomultiplier tube detected the light. The results presented in this report are the average of five spectrum scans. The response of the spectrometer was calibrated using a tungsten filament lamp to determine the spectral
response and a mercury Plucker tube for wavelength accuracy and repeatability. The targeted copper and xenon neutral lines are listed in Table 3 and Table 4, respectively.[23,24] The lines were chosen because of the availability of published transition data. The copper lines were used to evaluate the relative erosion rates, and the xenon lines were used to estimate the changes in the electronic state inside the discharge chamber. Since the emission intensity of the copper is partly dependent upon the electron temperature, the electronic temperature of neutral xenon was measured to assess the relative contribution of the electron energy on the intensity of copper emission.
Numerical Evaluation In order to quantify any disparity in the magnetic field topography between the EMTs and the FTs, the 2-D magnetic field simulation code MAXWELL was used to model the two engine geometries with greater spatial resolution than previous measurements.[21] MAXWELL uses finite element analysis to solve two-dimensional electromagnetic problems. The software automatically generates the required finite element mesh. To run a particular simulation, the software requires mechanical geometry and material magnetic property inputs. Cylindrical symmetry was assumed for both thruster cases run. Magnetic flux density contour plots were generated for the two cases to compare the effects that differences in keeper assembly construction and material-make-up had on the magnetic field profile near the keeper. In order to better visualize the field lines local to the region around the keeper, magnet flux line plots were also generated. The volumetric keeper erosion in the ELT was calculated based on empirically determined variables. Given the gross difference between the keeper erosion in the ELT and previous tests, the accuracy of Equation 3 was believed to be sufficient to indicate whether the ELT erosion could be predicted. The keeper ion current from the present investigation was used. Since the ratio of the double-to-single ion current collected by the keeper is unknown, the range of values measured in the plume of the ELT (0.05 to 0.20) was used to bound the problem. The plasma potential at the source of the ions was assumed to be either 0 or 4-V above anode.[8] Consequently, the ion energies used to determine the instantaneous sputter
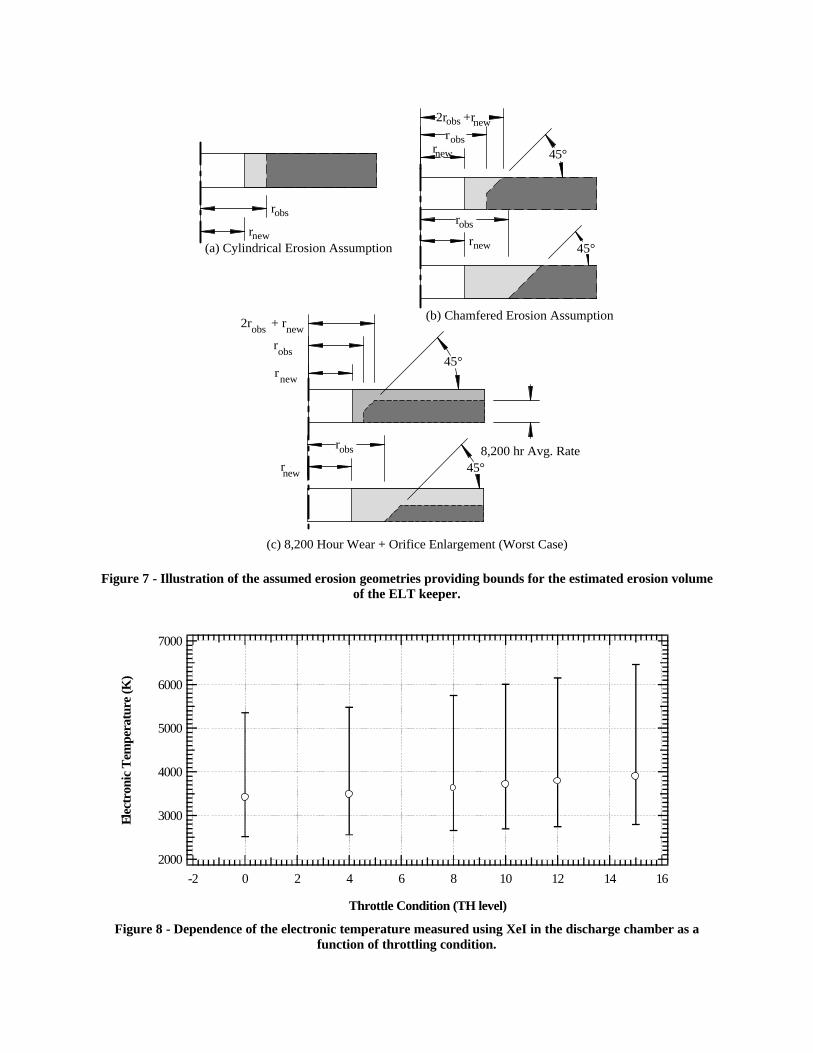
yield in Equation 3 were twice the difference between the plasma and keeper potentials. The stochastic yield factor accounting for non-normal collisions with the surface and for re-deposited material was allowed to vary from 0.80 to 1.00. Under the assumption of cold ions, the sheath provides all of the energy for sputtering. The consequence of the cold ion approximation is that the ions strike the keeper with normal incidence. The range for the stochastic yield factor was chosen to account for re-deposition of molybdenum from the discharge chamber on the keeper. The volumetric erosion rate was calculated using Equation 3 and the assumption that the discharge voltage was constant between ELT data points in Figure 5. From the calculated erosion rate, the volume of material eroded was calculated by numerically integrating Equation 3 over the first 12,342 hours of the ELT. The results were compared to calculated erosion volume based on the observed increases in orifice diameter reported in Figure 5. The ELT eroded volume was calculated assuming three geometries as shown in Figure 7. The most conservative estimate of the erosion was based simply on the orifice diameter increase, assuming uniform cylindrical wear. The images in Figure 3 indicate that the keeper orifice became chamfered, and an intermediate estimation of the ELT wear was evaluated by including chamfering of the orifice. Although the images of the discharge keeper lack depth information, the results of the 8,200-hour wear test can be used to estimate an average thickness of the keeper. By combining the average wear from the 8,200-hour wear test and the chamfered orifice assumption, the maximum estimated volumetric wear on the ELT keeper was calculated. This is expected to be a worst case because the ELT has been conducted at TH 8 for approximately 5,500 hours. Figure 7 illustrates the three wear assumptions, and the volumetric erosion represented by each case was calculated for comparison with the 8,200-hour result and the model predictions. Additionally, the magnitude of the heating due to electron backstreaming measurements was calculated from data by Soulas.[19] Although the heat load at TH15 is approximately 80-W, detailed calculations of the distribution of the backstreaming electron current are left to future work.
Experimental Results
Interpretation of emission spectroscopic data is complicated by the nature of the emission process. Although the discharge chamber plasma is expected to be non-equilibrium, a steady-state condition is believed to exist for the ions, neutrals, and many of their excited states.[25] Under this steady-state (detailed balance) assumption, application of a conservation condition to an excited state provides a means for correlating the density of a species to the intensity of the emitted light. Rock, Mantenieks, and Parsons[25] developed a kinetic steady state model to describe the population of excited atoms. The model balances collisional excitation with radiative and collisional decay for an electronic configuration. Rock, Mantenieks, and Parsons[25] established that the discharge chamber plasma met the conditions of the kinetic steady state for low-lying electron orbits. The assumption that collisional excitation, collisional decay, and radiative decay are the dominant mechanisms is predicated on the following picture for particle number densities:
*** CuICuICuIXeIIIXeIIeXeI nnnnnnn >>>>>>>>>>
The collisional processes depend on the electron temperature, electron number density, and copper state densities. The optical configuration limited the present investigation to upper-level transitions in copper and consequently collisional decay may be neglected. The copper line intensity is in part proportional to the density of the excited states of the eroded copper. The difficultly in interpretation arises when the electron temperature and number density are unknown as is the case here. For fixed electron temperature and number density, the emission intensity varies with the density of eroded material. The detailed balances in the electronic states of the atoms determine the precise relationship between emission intensity and number density. In the present work, the electron temperature and number density are assumed to be constant for a given throttling condition regardless of the perturbations to the discharge, such as keeper bias and cathode flow rate. The average electronic temperature was measured using the neutral xenon within the discharge chamber, and the results shown in Figure 8 indicate that it is nearly invariant over the range of throttling conditions. Since the plasma is optically thin, the line
intensity results from an integration through the discharge chamber. Although the electronic and electron temperatures in the low-density discharge chamber plasma are expected to be different, the invariance of the average electronic temperature suggests that the average electron temperature varies weakly with throttling condition. Additionally, Matossian and Beattie [26] reported that the Maxwellian electron temperature in a given ion engine was inversely proportional to the neutral number density raised to the 2/5 power. Assuming that the neutral number density in the discharge chamber is proportional to total flow rate (i.e. neglecting propellant efficiency), the volume averaged Maxwellian electron temperature is expected to vary over a factor of 1.6. The average electron number density in the discharge is expected to be a strong function of discharge current. The dependency of the emission intensity on electron number density clouds interpretation of the results relating emission intensity to erosion at varying throttle conditions. Nevertheless, Williams[15] observed that TH15 represented the highest wear-rate condition for the discharge cathode keeper.
Threshold Level The intensity of the spectra used in this investigation was statistically analyzed to assure that it was above the detection threshold of the photomultiplier tube. Comparisons with the zero signal condition were made to assess the validity of the data. During testing, the copper spectra gradually decayed to a point below the detection threshold while the xenon spectra remained strong. The cause was hypothesized to be either the manner in which the copper eroded or deposition of material from the discharge chamber on the copper. If the surface became pockmarked with microscopic spires, the sputtered atoms may redeposit before interacting with the plasma electrons, and the spectral intensity would then be diminished. Subsequent microscopic analysis of the face of the keeper at several radial locations supported the notion that the surface structure limited the emission of copper, and the results are presented later.
Discharge Conditions and Emission The variation of the discharge voltage, discharge current, keeper ion current, and copper line intensities is presented in Figure 9. The keeper was biased 20-V below cathode to measure the ion saturation current,
and the spectra were collected once the keeper was returned to the nominal bias through the 1-kΩ resistor to the anode. The discharge voltage varied from a peak of 25.4-V at TH 4 to a minimum of 24.7-V at TH 8. Additionally, the ion current to the keeper scaled similarly to the discharge current. Assuming the keeper face is the only collection surface, the average current density at TH 15 was 41 mA/cm2. If the plasma potential and the ratio of double-to-single ions in flux to the keeper varied little over this range of throttling, then the evidence indicates that the erosion of the keeper is more severe at TH 15 than TH 8. Figure 9 includes the spectra data for the copper lines. The 510 and 515-nm lines follow the ion current trends, while the 521-nm line appears to mirror the discharge voltage. The 521-nm copper line appeared to be less dependent upon discharge current than either of the other two emission lines.
Keeper Ion Current Saturation of the ion current to the keeper was verified by varying the keeper potential with respect to cathode, and the results are shown in Figure 10. The keeper ion current presented in Figure 9 was evaluated with the keeper biased 20-V below cathode potential, close to the saturation value. The results presented here are somewhat greater than would be expected in the flight thrusters due to the difference in surface area.
Sensitivity Analysis The relative sensitivity of keeper erosion to throttling condition, keeper potential, and discharge voltage oscillations is plotted in Figure 11. Lowering the cathode flow rate increased the discharge voltage oscillations from 5 to 10-V peak-to-peak. The slope of each line is indicative of the relative importance of that parameter, over its predetermined range, to the emission signal and, by extension, the erosion rate. The throttling condition sensitivity is plotted with the caveat that it is dependent upon electron temperature and number density. Nevertheless, the copper spectra indicated that the erosion rate was most sensitive to the throttling condition. The sensitivities to keeper potential and discharge oscillations are presented since they sample from each throttling condition equally and are therefore independent of the plasma conditions at TH 8 and TH 15. From this, the discharge oscillations contribute to erosion somewhat more than the keeper potential. This is consistent with the fact that the
oscillations were of the order of 10-V (high-wear condition) and 5-V (low-wear condition) peak-to-peak which leads to a slightly larger accelerating potential for ions than the keeper short (~3 to 3.5-V). The analysis showed also that the interactions of parameters are insignificant.
Post-Test Inspection Post-test visual analysis of the keeper, depicted in Figure 12, showed that the keeper face had become textured, and the machining marks were no longer visible. Detailed analysis was performed using a scanning electron microscope to inspect the downstream face of the keeper, and the results are presented in Figure 13. The surface modification to the keeper face appears to have been confined to within 2-mm of the keeper orifice. By contrast, Figure 4 indicates that the erosion of the keeper on the 1,000-hour test was greatest about 2.5-mm from the orifice.
Numerical Experiments
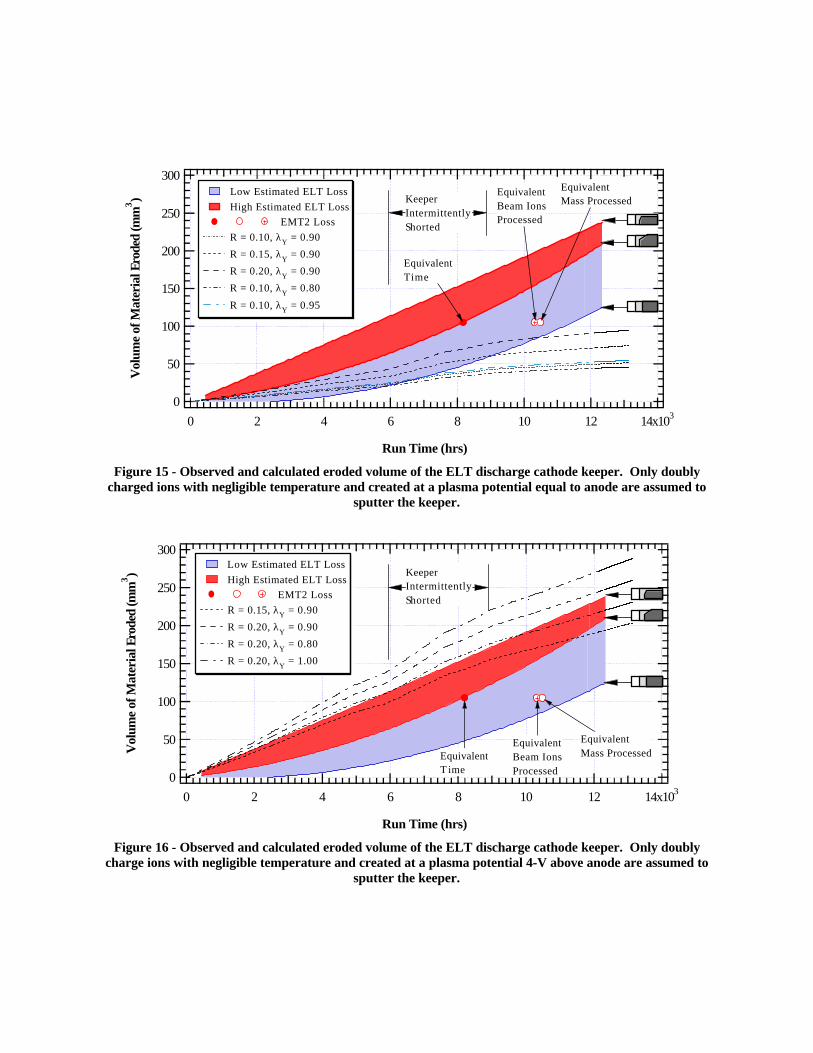
The results of the magnetic field mapping of the discharge chamber are presented in Figure 14. The magnitude of the magnetic flux density has been normalized to a constant value in Figure 14. The flight thruster configuration indicates slightly modified gradients in the near cathode region reflecting the tendency of the nickel-steel components to attenuate the centerline value of the magnetic flux density. The work by Beattie and Matossian [8] concluded that the ionization region was bounded by the magnetic flux lines between the magnet rings. While the perturbation to the flight magnetic field appears negligible, it may be sufficient to modify the ionization region near the cathode, and thereby influence the ion current distribution to the discharge cathode keeper. The results of the calculated volumetric erosion are presented in Figure 15 and Figure 16 for both 0 and 4-V plasma potentials, respectively. Also shown in Figure 15 and Figure 16 are both the total volume lost from the keeper face in the 8,200 hour test and the estimated ELT erosion based on the images in Figure 3 and the assumed geometries of Figure 7. The estimated range of volumetric erosion reported in Figures 16 and 17 was calculated by fitting the discrete values with a polynomial to yield a smoothly varying distribution. The volumetric erosion observed during the ELT appears to be consistent with the previous
tests, although the evolution was clearly different. The estimated volume of molybdenum removed from the ELT discharge keeper ranged from 128 to 238-mm3 in the first 12,342-hours. The calculated erosion based on the assumption that the plasma potential is equal to the anode potential underestimates the observed wear. Conversely, assuming the plasma potential to be 4-V greater than the anode results in estimates comparable to or greater than the observed erosion. In both cases, the greatest erosion rate was calculated when the keeper was near cathode potential, although the TH15 erosion rate with the positive plasma potential was comparable. The results also illustrate the importance of quantification of the ratio of double-to-single ion current to the cathode; the calculated erosion varied by as much as a factor of 2 depending on the assumed double-to-single ion current ratio and yield factor. Diagnostics to measure the content of the ion flux to the cathode keeper are under development at the NASA Glenn Research Center.[27] The similarity of the volumetric erosion in the 8,200 wear test and the ELT suggests that only the distribution of ion current on the discharge cathode keeper varies between the engineering model and flight thrusters. This conclusion is supported by the observed erosion on the downstream face of the copper keeper cap. A flight discharge cathode assembly was used in the present investigation, and most of the sputtering occurred within 2-mm of the orifice. The keeper erosion in the 1,000-hour and 8,200-hour wear tests indicated a broader distribution with the peak erosion occurring approximately 2.5-mm from the orifice. The gradients in the magnetic flux density may subtly alter the ionization region and thereby the distribution of ion current on the keeper. Additionally, increased ion current to the discharge keeper or increased ion energy, the alternative causes for the erosion, would result in greater discharge losses in the flight thruster compared to the engineering models. The evidence indicating that the ion current to the flight model discharge cathode keeper was weighted toward the orifice is considerable, but a conclusive determination must wait until a direct measurement of the distribution of the keeper ion current is made.
Conclusions
Tests were conducted at the NASA Glenn Research Center to identify the cause of unanticipated discharge cathode keeper erosion in the on-going Extended Life Test. Although the keeper orifice diameter increased relatively quickly, the ELT continues to run without incident, and the run time to date is in excess of 18,420-hours. Analysis of the ELT data was used to estimate the magnitude of the erosion. The estimates showed that between 128 and 238-mm3 of molybdenum had been removed from the keeper face by the discharge plasma in the first 12,342-hours of the test. Contrary to previous wear tests, the ELT was conducted at several different throttling conditions, and the wear was initially observed after significant operation at TH8, a moderate power condition. Additionally, the keeper potential fell to very close to cathode potential for a total of approximately 2,100 hours. The flight discharge cathode assembly caused a slight difference in the magnetic field topography between the flight thrusters and the engineering model thrusters. Tests were designed to determine the sensitivity of discharge keeper erosion to each of these effects. Using a copper keeper cap, emission spectra were collected at a range of operating conditions to assess wear rates. The spectra indicated the highest sensitivity to the throttling condition which alters both ion current to the keeper and the ion energy. Shorting the keeper to the discharge cathode and producing large discharge voltage oscillations each affected keeper wear nearly equally. Additionally, the keeper ion current was measured as a function of the throttling condition, and it was observed to scale proportionately to the discharge current. Using the results of the experimental investigation and the ELT data, the erosion in the ELT was calculated, and the results were compared to the estimated erosion based on photographic data. The volumetric erosion in the ELT was predicted assuming a 4-V plasma potential with respect to the anode. Although the orifice diameter increased dramatically throughout the ELT, the estimated volumetric erosion was comparable to the 8,200 hour wear-test. The results indicate that the ion current distribution on the keeper during the ELT caused increased wear in the orifice. Both direct measurement of the ion current distribution on the discharge cathode keeper and evaluation of the
flux of singly and doubly charged ions are necessary to conclusively demonstrate that the ELT erosion was the result of a peaked ion flux toward the orifice. While the disparate keeper wear mechanisms of the ELT and the previous wear tests reduce confidence in the service life estimations for the discharge keeper, several options are available to alleviate concern about keeper failure. As mentioned above, detailed measurements will facilitate the development of more accurate models of the keeper wear rate and pattern, which can be used to predict life. Alternatively, a keeper fabricated from graphite or carbon-carbon will yield greater service life due to the low sputter yield of carbon. Both of these options are left to future work.
References
[1] M. D. Rayman, “Setting Records in Deep Space,” Spacedaily, http://www.spacedaily.com/news/deep1-00j.html, accessed 22-July-01. [2] M. J. Patterson, et al., “Development Status of a 5-kW Class Ion Engine,” AIAA Paper No. 2001-3489, 37th AIAA / ASME / SAE / ASEE Joint Propulsion Conference, Salt Lake City, UT, July 2001. [3] J. R. Anderson, et al., “Performance Characteristics of the NSTAR Ion Thruster During and On-Going Long Duration Ground Test,” IEEE Paper No. 8.0303, IEEE Aerospace Conference, Big Sky, MT, Mar. 2000. [4] J. E. Polk, et al., “An Overview of the Results from an 8200 Hour Wear Test of the NSTAR Ion Thruster,” AIAA Paper No. 99-2446, 35th AIAA / ASME / SAE / ASEE Joint Propulsion Conference, Los Angeles, CA, June 1999. [5] M. J. Patterson, et al., “2.3 kW Ion Thruster Wear Test,” AIAA Paper No. 95-2516, 31st AIAA/ASME/SAE/ASEE Joint Propulsion Conference, San Diego, CA, July 1995. [6] J. E. Polk, et al., “A 1000-Hour Wear Test of the NASA NSTAR Ion Thruster,” AIAA Paper No. 96-2717, 32nd AIAA/ASME/SAE/ASEE Joint Propulsion Conference, Lake Buena Vista, FL, July 1996. [7] M. J. Patterson and V. K. Rawlin, “Derated Ion Thruster Design Issues,” IEPC Paper No. 91-150, AIDAA / AIAA / DGLR / JSASS 22nd International Electric Propulsion Conference, Viareggio, Italy, Oct. 1991. [8] J. R. Beattie and J. N. Matossian, “Mercury Ion Thruster Technology,” NASA CR 174974, Mar. 1989.
[9] M. A. Mantenieks, “Sputtering Threshold Energies of Heavy Ions,” NASA/TM—1999-209273, June 1999. [10] R. V. Stuart and G. K. Wehner, “Sputtering Yields at Very Low Bombarding Energies,” Journal of Applied Physics, Vol. 33, No. 7, pp. 2345-2352, 1962. [11] H. E. Wilhelm, “Theoretical Investigation of Plasma Processes in the Ion Bombardment Thruster,” NASA CR-13471, 1971. [12] D. Rosenburg and G. K. Wehner, “Sputtering Yields for Low Energy He+-, Kr+-, and Xe+-Ion Bombardment,” Journal of Applied Physics, Vol. 33, No. 5, pp. 1842-1845, 1962. [13] O. B. Duchemin, et al., “A Review of Low Energy Sputtering Theory and Experiments,” IEPC Paper No. 97-068, 25th International Electric Propulsion Conference, Cleveland, OH, Aug. 1997. [14] N. Matsunami, et al., “Energy Dependence of the Ion-Induced Sputtering Yields of Monatomic Solids,” Atomic Data and Nuclear Data Tables, Vol. 31, pp. 1-80, 1984. [15] G. J. Williams, The Use of Laser-Induced Fluorescence to Characterize Discharge Cathode Erosion in a 30 cm Ring-Cusp Ion Thruster, Ph.D. Dissertation, University of Michigan, 2000. [16] G. J. Williams, et al., “FMT-2 Discharge Cathode Erosion Rate Measurements via Laser-Induced Fluorescence,” AIAA Paper No. 2000-3663, 36th AIAA / ASME / SAE / ASEE Joint Propulsion Conference, Huntsville, AL, July 2000. [17] G. J. Williams, et al, “Characterization of the FMT-2 Discharge Cathode Plume,” IEPC Paper No. 99-104, 26th International Electric Propulsion Conference, Kitakiushu, Japan, Oct. 1999. [18] G. J. Williams, T. B. Smith, and A. D. Gallimore, “Discharge Cathode Erosion in a 30 cm Ion Engine,” IEPC Paper No. 01-308, 27th International Electric Propulsion Conference, Pasadena, CA, Oct. 2001. [19] G. C. Soulas, “Performance of Thick Accelerator Grid Optics for Enhanced Ion Engine Total Impulse,” Final Report, NASA Glenn Research Center, Feb. 2001. [20] M. T. Domonkos, R. E. Stevens, and G. J. Williams, “Absolute Density Calibration Cell for Laser Induced Fluorescence Erosion Rate Measurements,” IEPC Paper No. 01-300, 01-300, 27th International Electric Propulsion Conference, Pasadena, CA, Oct. 2001.
[21] J. S. Sovey, “Magnetic Field Documentation of Engineering Model and Flight Model Ion Engines,” NSTAR Report EDT 7a, August 2000. [22] I. Kameyama and P. J. Wilbur, “Characteristics of Ions Emitted from High-Current Hollow Cathodes,” IEPC Paper No. 93-023, 23rd International Electric Propulsion Conference, Seattle, WA, Sept. 1993. [23] A. R. Striganov and N. S. Sventitskii, Tables of Spectral Lines of Neutral and Ionized Atoms, IFI / Plenum Data Corporation, New York, 1968. [24] NIST Atomic Spectra Database, National Institute of Standards and Technology website, http://physics.nist.gov/cgi-bin/AtData/main_asd , accessed Oct. 2000. [25] B. A. Rock, M. A. Mantenieks, and M. L. Parsons, “Rapid Evaluation of Ion Thruster Lifetime Using Optical Emission Spectroscopy,” AIAA / DGLR / JSASS 18th International Electric Propulsion Conference, Alexandria, VA, Sept.-Oct. 1985. [26] J. N. Matossian and J. R. Beattie, “Plasma Properties in Electron Bombardment Ion Thruster,” AIAA Paper No. 87-1076, 19th AIAA / DGLR / JSASS International Electric Propulsion Conference, Colorado Springs, CO, May 1987. [27] M. T. Domonkos and G. J. Williams, “Status of Laser-Based Ion Engine Diagnostics at NASA Glenn Research Center,” IEPC 2001-304, 27th International Electric Propulsion Conference, Pasadena, CA, Oct. 2001.
Table 1 - Selected conditions from the NSTAR throttling table.[3]