Page 1
INVESTIGATION OF O2(C3, v=2) BY NOVEL LASER PHOTOIONIZATION
TECHNIQUE IN AIR AT ATMOSPHERIC PRESSURE
Jonathan D. Umbel,Dr. Steven F. Adams,
Dr. Charles A. DeJoseph, Jr.
Air Force Research LaboratoryWright Patterson AFB, OH
18 Jun 07
Page 2
Laser Diagnostics Facility for Plasma Studies AFRL Propulsion Directorate , Wright Patterson AFB, OH
Building 450, WPAFB, OH
Page 3
Introduction
• Resonant-Enhanced Multiphoton Ionization (REMPI) in dry atmospheric pressure air studied for possible low-jitter laser triggering of air spark gap switch
• Interesting REMPI phenomena observed in dry air at 1 atm
– Strong REMPI signal with O2(C3) Rydberg resonance
– Strong N2+ fluorescence at all REMPI transitions
• In this work, we characterize the O2(C3, v=2) state using both fluorescence and traditional REMPI spectra.
Page 4
150,000
100,000
50,000
0
En
erg
y (
cm
-1)
2.42.22.01.81.61.41.21.0Internuclear Separation (Å)
150,000
100,000
50,000
0
En
erg
y (c
m-1)
2.42.22.01.81.61.41.21.0Internuclear Separation (Å)
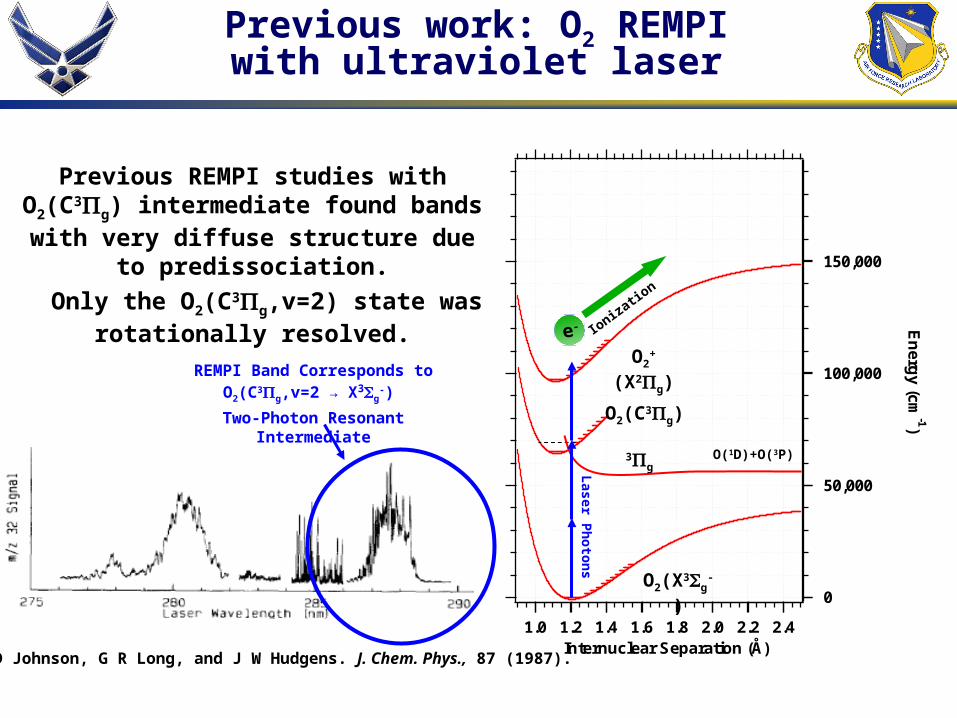
Previous work: O2 REMPIwith ultraviolet laser
Laser P
ho
ton
s
O2(X3g-)
O2+(X2g)
O2(C3g)
e- Ionizatio
n
O(1D)+O(3P)3g
REMPI Band Corresponds to O2(C3g,v=2 → X3g
-)
Two-Photon Resonant Intermediate
R D Johnson, G R Long, and J W Hudgens. J. Chem. Phys., 87 (1987).
Previous REMPI studies with O2(C3g) intermediate found bands with very
diffuse structure due to predissociation.
Only the O2(C3g,v=2) state was rotationally resolved.
Page 5
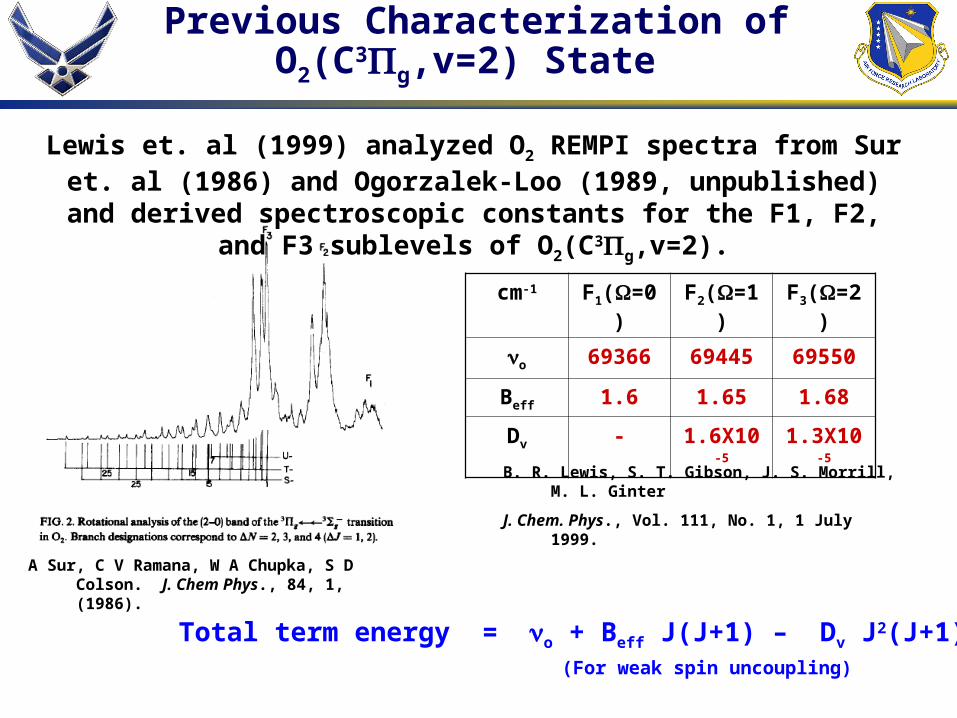
Previous Characterization of O2(C3g,v=2) State
Lewis et. al (1999) analyzed O2 REMPI spectra from Sur et. al (1986) and Ogorzalek-Loo (1989, unpublished) and derived spectroscopic
constants for the F1, F2, and F3 sublevels of O2(C3g,v=2).
Total term energy = o + Beff J(J+1) – Dv J2(J+1)2
(For weak spin uncoupling)
cm-1 F1(=0) F2(=1) F3(=2)
o 69366 69445 69550
Beff 1.6 1.65 1.68
Dv - 1.6X10⁻⁵ 1.3X10⁻⁵
B. R. Lewis, S. T. Gibson, J. S. Morrill, M. L. Ginter
J. Chem. Phys., Vol. 111, No. 1, 1 July 1999.
A Sur, C V Ramana, W A Chupka, S D Colson. J. Chem Phys., 84, 1, (1986).
Page 6
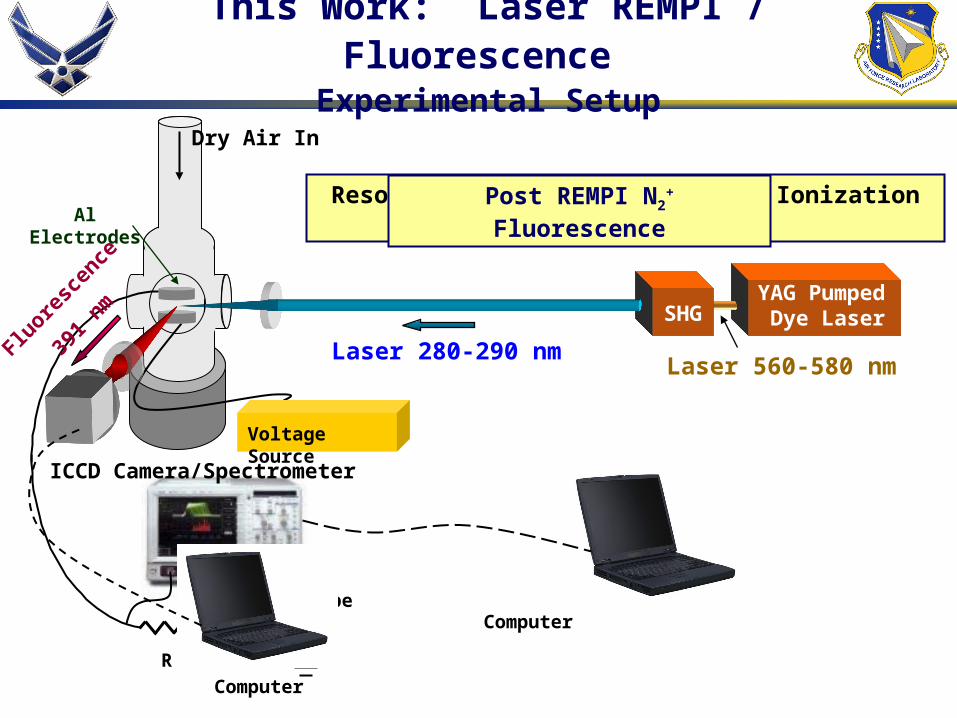
This Work: Laser REMPI / Fluorescence Experimental Setup
YAG Pumped Dye Laser
Laser 280-290 nmLaser 560-580 nm
SHG
Dry Air In
Resonant Enhanced Multi-Photon Ionization (REMPI)
Computer
Al Electrodes
Voltage Source
R
Digital O-scope
ICCD Camera/Spectrometer
391
nm
Fluore
scen
ce
Computer
Post REMPI N2+ Fluorescence
Page 7
N2+ Fluorescence Signal
in Dry Air at Atmospheric Pressure
10000
8000
6000
4000
2000
0
Flu
ores
cenc
e In
tens
ity (
arb)
290288286284282280Laser Wavelength (nm)
10000
8000
6000
4000
2000
0
Flu
ores
cenc
e In
tens
ity (
arb)
290288286284282280Laser Wavelength (nm)
Dry Air at
Atmospheric Pressure
Strong N2+ Fluorescence Band
Corresponding to O2(C,v=2) Resonant Intermediate
40x103
30
20
10
0
Inte
nsi
ty (
arb
un
its)
394392390388386Fluorescence Wavelength (nm)
N2+(B 2u
+→ X 2u-)
Laser Excitation Spectrum
Typical Spectrum of N2+ Fluorescence
Coinciding with REMPI Transitions in Dry Air at Atmospheric Pressure
Page 8
150,000
100,000
50,000
0
En
erg
y (
cm
-1)
2.42.22.01.81.61.41.21.0Internuclear Separation (Å)
150,000
100,000
50,000
0
En
erg
y (c
m-1)
2.42.22.01.81.61.41.21.0Internuclear Separation (Å)
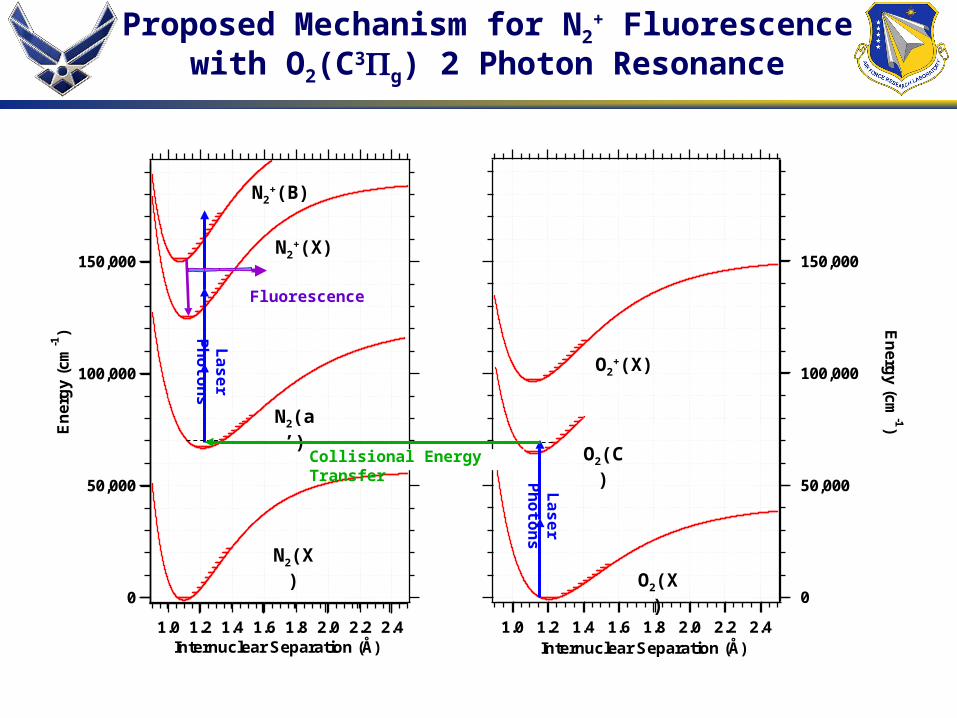
Proposed Mechanism for N2+ Fluorescence with
O2(C3g) 2 Photon Resonance
N2(X)
N2+(X)
La
se
r Ph
oto
ns
O2(X)
O2+(X)
O2(C)
N2+(B)
Fluorescence
N2(a’)
Collisional Energy Transfer
La
se
r Ph
oto
ns
Page 9
Experiment:
• Experiment:
–Compare N2+ fluorescence spectrum in air
with traditional O2 REMPI.
–Analyze both spectra for O2(C3g) spectroscopic constants.
Page 10
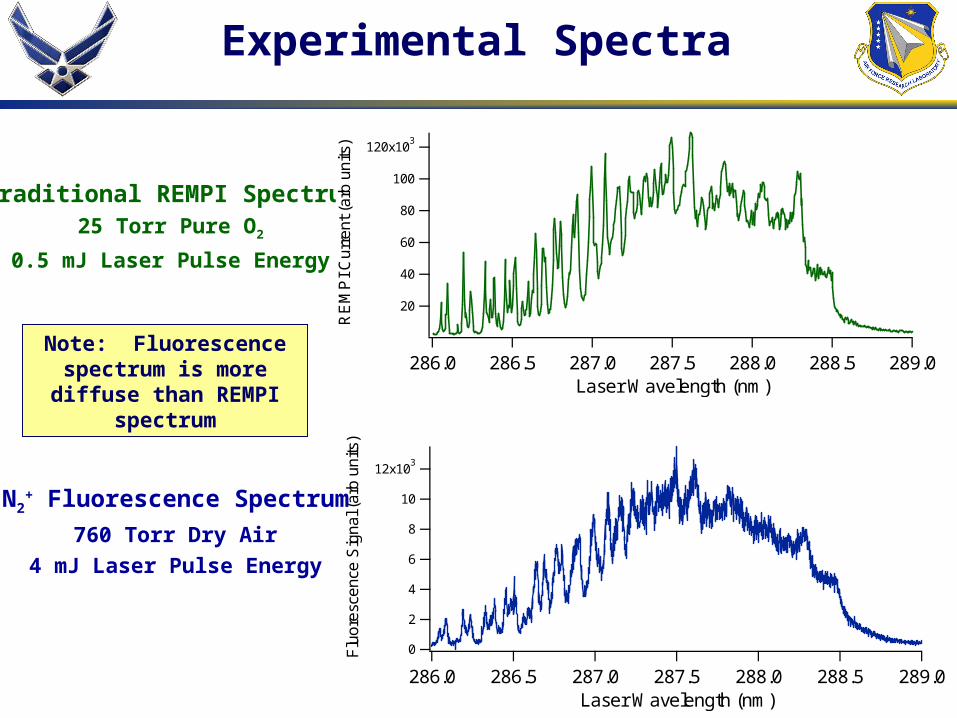
Experimental Spectra
12x103
10
8
6
4
2
0Flu
ores
cenc
e S
igna
l (ar
b un
its)
289.0288.5288.0287.5287.0286.5286.0Laser Wavelength (nm)
N2+ Fluorescence Spectrum
760 Torr Dry Air
4 mJ Laser Pulse Energy
Traditional REMPI Spectrum25 Torr Pure O2
0.5 mJ Laser Pulse Energy
Note: Fluorescence spectrum is more diffuse
than REMPI spectrum
120x103
100
80
60
40
20
RE
MP
I C
urre
nt (
arb
units
)289.0288.5288.0287.5287.0286.5286.0
Laser Wavelength (nm)
Page 11
Term Energy Equations Applied to Fit Our Spectral Data
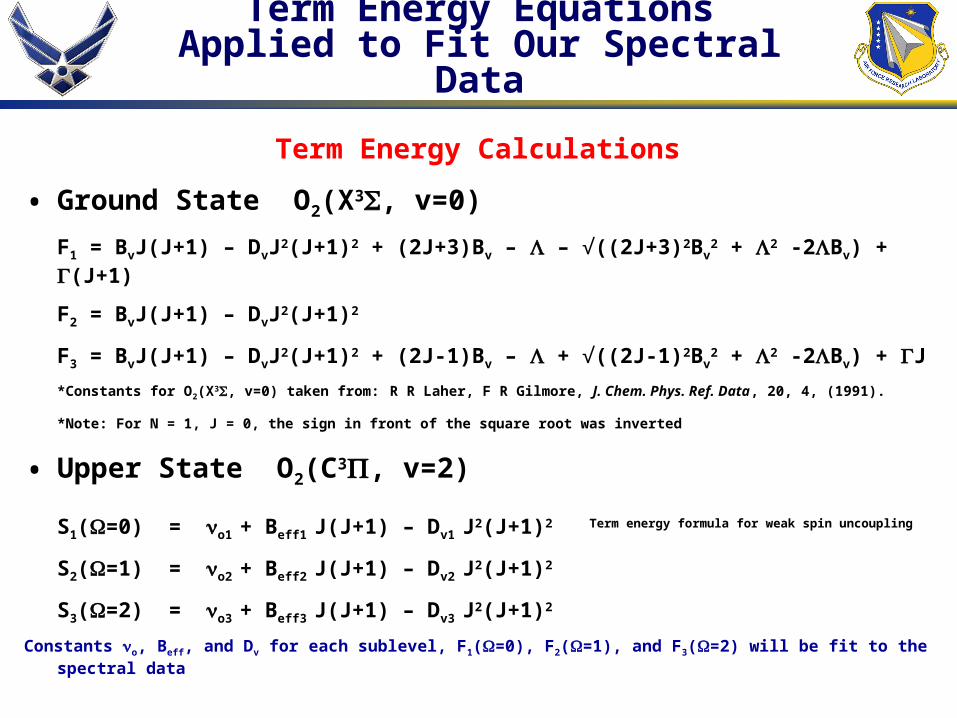
Term Energy Calculations
• Ground State O2(X3, v=0)
F1 = BvJ(J+1) – DvJ2(J+1)2 + (2J+3)Bv – – √((2J+3)2Bv2 + 2 -2Bv) + (J+1)
F2 = BvJ(J+1) – DvJ2(J+1)2
F3 = BvJ(J+1) – DvJ2(J+1)2 + (2J-1)Bv – + √((2J-1)2Bv2 + 2 -2Bv) + J
*Constants for O2(X3, v=0) taken from: R R Laher, F R Gilmore, J. Chem. Phys. Ref. Data, 20, 4, (1991).
*Note: For N = 1, J = 0, the sign in front of the square root was inverted
• Upper State O2(C3, v=2)
S1(=0) = o1 + Beff1 J(J+1) – Dv1 J2(J+1)2 Term energy formula for weak spin uncoupling
S2(=1) = o2 + Beff2 J(J+1) – Dv2 J2(J+1)2
S3(=2) = o3 + Beff3 J(J+1) – Dv3 J2(J+1)2
Constants o, Beff, and Dv for each sublevel, F1(=0), F2(=1), and F3(=2) will be fit to the spectral data
Page 12
Line Intensities Applied to Generate Simulated Spectrum
Relative Line Intensities for 2-Photon Transitions R G Bray, R M Hochstrasser. Mol. Phys. 31, (1976).
)12)(1(15
))(2)()(1(
JJJ
JJJJ
P branch*
)1)(1(30
)12)()(1( 2
JJJ
JJJ
Q branch
)32)(12)(1(10
))(12()12)(1( 2
JJJJ
JJJ
R branch
)2)(1(30
)2)(2)(1( 2
JJJ
JJJ
S branch
)32)(2)(1(15
)1)(3)(2)(1(
JJJ
JJJJ
*Note: The P branch equation was modified through a change in sign to correspond with symmetry seen in the models. However, there is no current published acclimation of this error.
O branch
Page 13
Theoretical Linewidth Effect Due to O2(C3, v=2) Pre-Dissociation
150,000
100,000
50,000
0
En
erg
y (
cm
-1)
2.42.22.01.81.61.41.21.0Internuclear Separation (Å)
150,000
100,000
50,000
0
En
erg
y (c
m-1)
2.42.22.01.81.61.41.21.0Internuclear Separation (Å)
Laser P
ho
ton
s
O2(X3g-)
O2+(X2g)
O2(C3g)
O(1D)+O(3P)3g
N2+(X)
Fluorescence
N2(a’)
La
se
r Ph
oto
ns
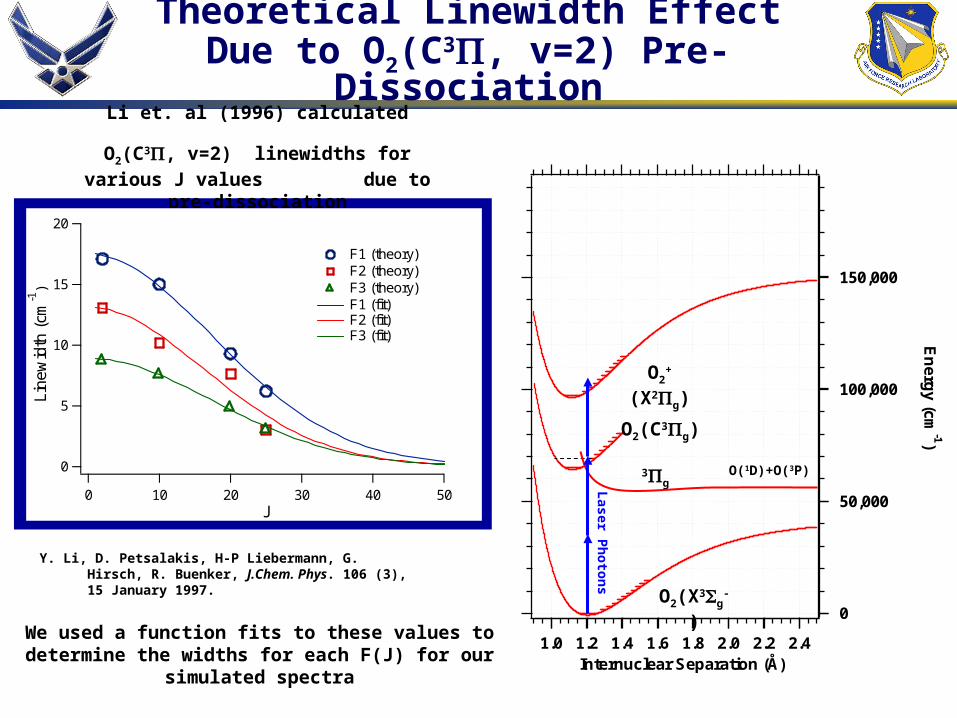
Li et. al (1996) calculated O2(C3, v=2) linewidths for various J values
due to pre-dissociation
Y. Li, D. Petsalakis, H-P Liebermann, G. Hirsch, R. Buenker, J.Chem. Phys. 106 (3), 15 January 1997.
We used a function fits to these values to determine the widths for each F(J) for our simulated spectra
20
15
10
5
0
Lin
ewid
th (
cm-1
)
50403020100J
F1 (theory) F2 (theory) F3 (theory) F1 (fit) F2 (fit) F3 (fit)
Page 14
Simulated SpectrumUsing Constants and Linewidths from Literature
100x103
80
60
40
20
0Flu
ores
cenc
e In
t.(a
rb u
nits
)
289288287286Laser Wavelength (nm)
12
10
8
6
4
2
0
x103
140x103
120
100
80
60
40
20
0RE
MP
I S
igna
l (a
rb u
nits
)
289288287286Laser Wavelength (nm)
100
80
60
40
20
0
x103
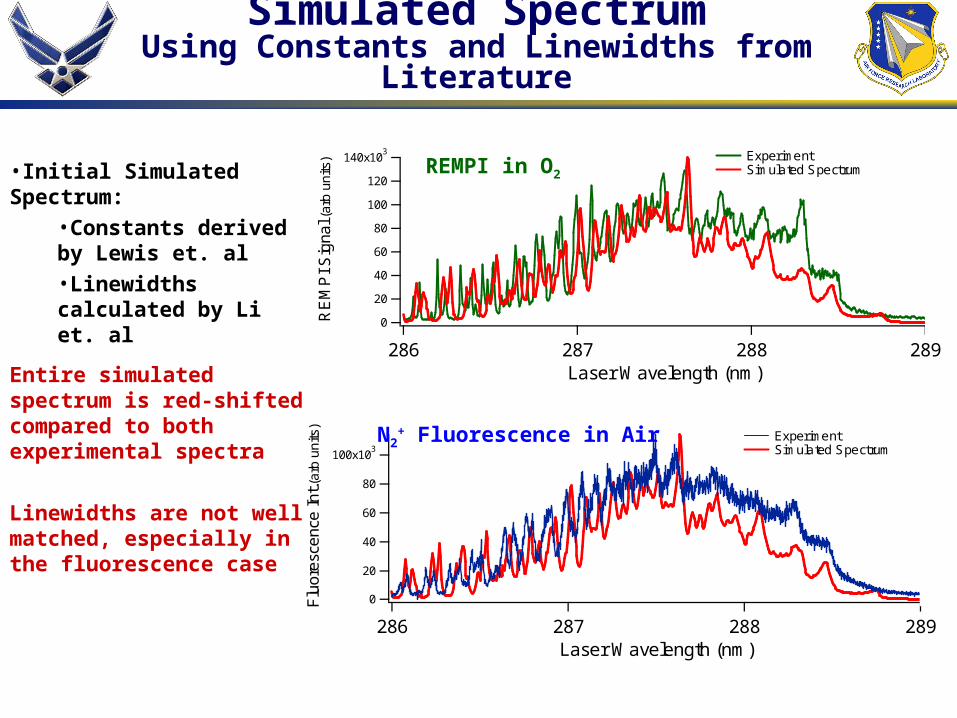
Experiment Simulated Spectrum
Experiment Simulated Spectrum•Initial Simulated Spectrum:
•Constants derived by Lewis et. al•Linewidths calculated by Li et. al
Entire simulated spectrum is red-shifted compared to both experimental spectra
Linewidths are not well matched, especially in the fluorescence case
REMPI in O2
N2+ Fluorescence in Air
Page 15
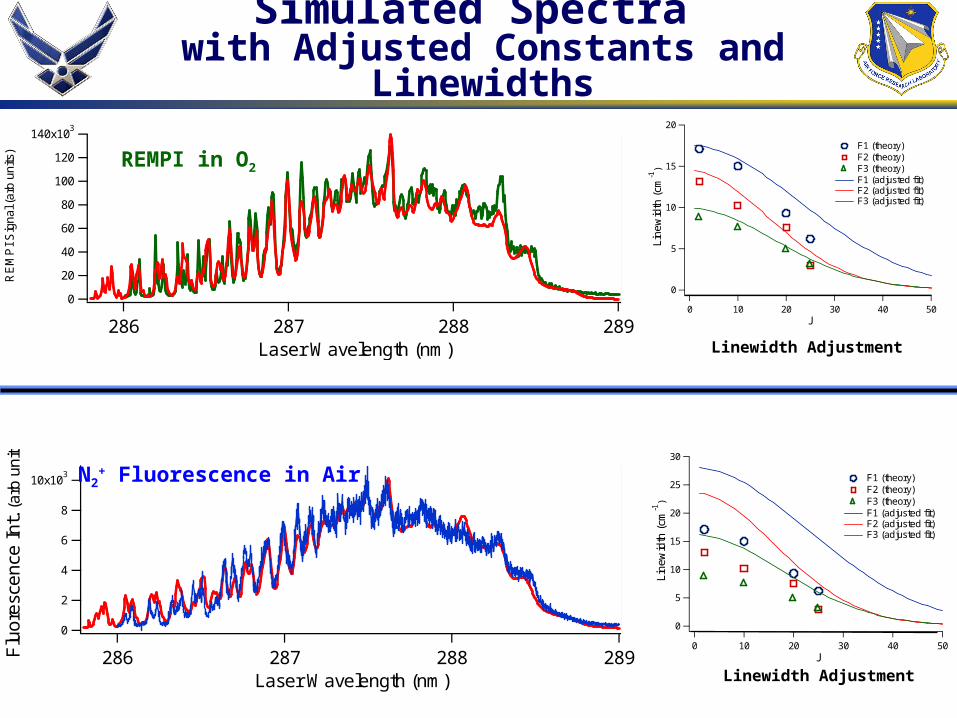
Simulated Spectra with Adjusted Constants and Linewidths
140x103
120
100
80
60
40
20
0
RE
MP
I S
igna
l (ar
b un
its)
289288287286Laser Wavelength (nm)
20
15
10
5
x103
Linewidth Adjustment
20
15
10
5
0
Line
wid
th (
cm-1
)
50403020100J
F1 (theory) F2 (theory) F3 (theory) F1 (adjusted fit) F2 (adjusted fit) F3 (adjusted fit)
10x103
8
6
4
2
0
Flu
ores
cenc
e In
t. (a
rb u
nits
)
289288287286Laser Wavelength (nm)
12
10
8
6
4
2
0
x103
30
25
20
15
10
5
0
Lin
ewid
th (
cm-1
)
50403020100J
F1 (theory) F2 (theory) F3 (theory) F1 (adjusted fit) F2 (adjusted fit) F3 (adjusted fit)
Linewidth Adjustment
REMPI in O2
N2+ Fluorescence in Air
Page 16
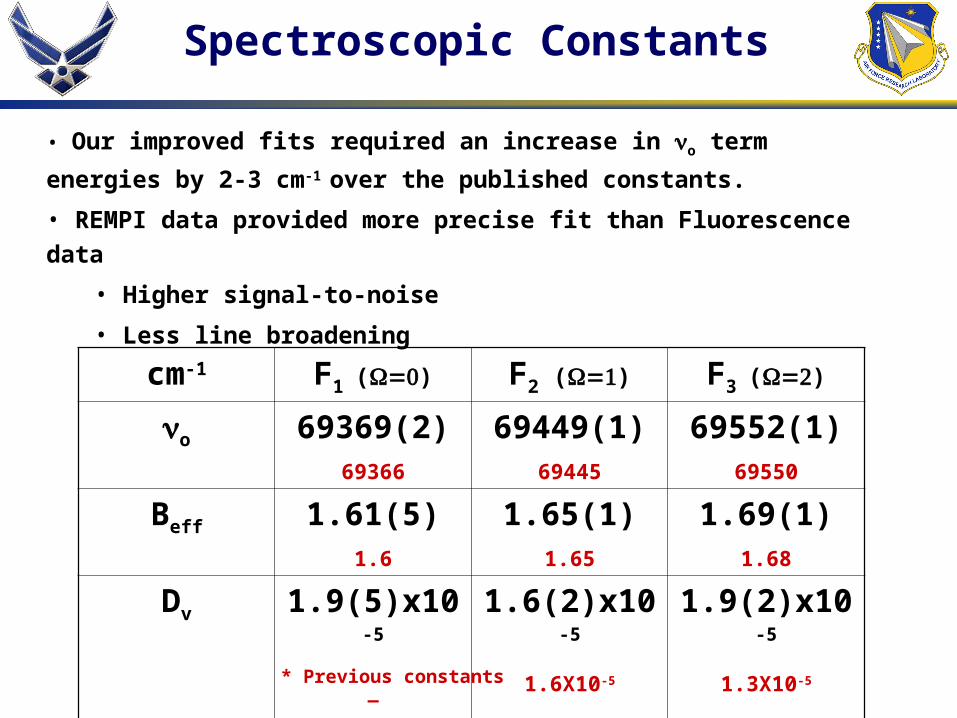
Spectroscopic Constants
cm-1 F1 () F2 () F3 ()
o 69369(2)69366
69449(1)69445
69552(1)69550
Beff 1.61(5)1.6
1.65(1)1.65
1.69(1)1.68
Dv 1.9(5)x10-5
_
1.6(2)x10-5
1.6X10⁻⁵
1.9(2)x10-5
1.3X10⁻⁵
• Our improved fits required an increase in o term energies by 2-3 cm-1
over the published constants.
• REMPI data provided more precise fit than Fluorescence data
• Higher signal-to-noise
• Less line broadening
* Previous constants
Page 17
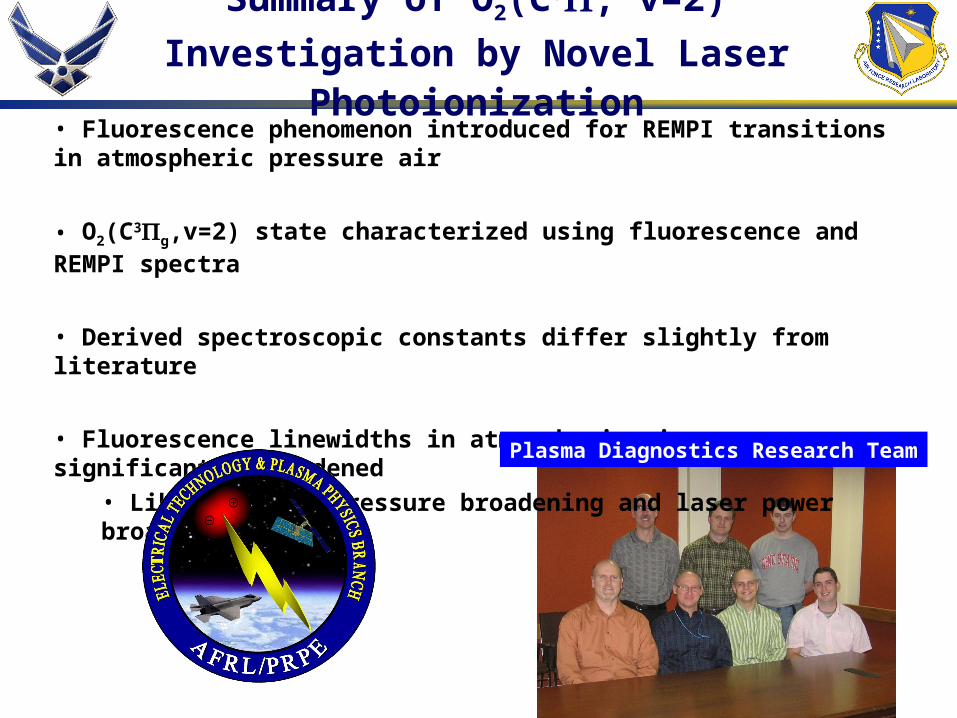
Summary of O2(C3, v=2) Investigation
by Novel Laser Photoionization• Fluorescence phenomenon introduced for REMPI transitions in atmospheric pressure air
• O2(C3g,v=2) state characterized using fluorescence and REMPI spectra
• Derived spectroscopic constants differ slightly from literature
• Fluorescence linewidths in atmospheric air are significantly broadened
• Likely due to pressure broadening and laser power broadening
Plasma Diagnostics Research Team
Page 18
Back-up Slide References
1) M Aldén, W Wendt. Optics Communications, 69, 1, (1988).
2) A Sur, L Nguyen, N Nikoi. J. Chem. Phys., 96, 9, (1992).
3) A Sur, C V Ramana, W A Chupka, S D Colson. J. Chem Phys., 84, 1, (1986).
4) P H Krupenie. J. Chem. Phys. Ref. Data, 1, 2, (1972).
5) G. Herzberg. Molecular Spectra and Molecular Structure, Krieger Publishing: Malabar, Florida. (1989).
6) W Demtroder. Laser Spectroscopy, Springer-Verlag: Berlin, Germany. (1982).
7) Y Li, I D Petsalakis, H Liebermann, G Hirsch, R Buenker. J. Chem. Phys., 106, 3, (1997).
8) R R Laher, F R Gilmore. J. Chem. Phys. Ref. Data, 20, 4, (1991).
9) National Institute of Standards and Technology. “Diatomic Spectral Database.” http://physics.nist.gov/PhysRefData/MolSpec/Diatomic/Html/sec3
10) Kwok, S., and Volk, K.: 1985, `On the Energetics of High-Velocity Molecular Flows', Astrophys.J.Lett., 299, L191. http://www.iras.ucalgary.ca/~volk/o2lev.gif
11) R D Johnson, G R Long, and J W Hudgens. J. Chem. Phys., 87 (1987).
12) I N Levine. Quantum Chemistry, 4th Ed., Prentice Hall: Englewood Cliffs, NJ. (1991).
13) R G Bray, R M Hochstrasser. Mol. Phys. 31, (1976).
14) W Kaiser, C G Garrett. Phys. Rev. Lett., 7, 6, (1961).
Page 19
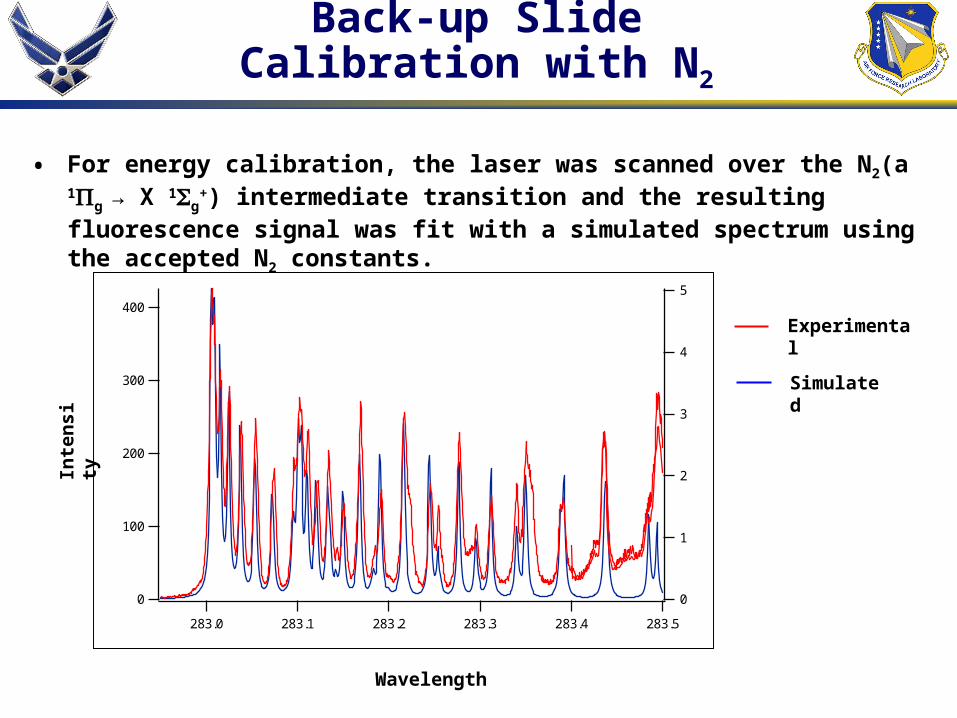
Back-up SlideCalibration with N2
• For energy calibration, the laser was scanned over the N2(a 1g → X 1g+)
intermediate transition and the resulting fluorescence signal was fit with a simulated spectrum using the accepted N2 constants.
N2(a1400
300
200
100
0
283.5283.4283.3283.2283.1283.0
5
4
3
2
1
0
Wavelength
Inte
nsi
ty
Simulated
Experimental
Page 20
Back-up SlideCollisional O2 - N2 Energy Exchange
72000
71000
70000
69000
Mol
ecul
ar E
nerg
y (c
m-1
)
403020100J
O2(C32g,v=2)
O2(C31g,v=2)
O2(C30g,v=2)
N2(a'1u
-,v=1)
Term Energies of O2(C3g) and N2(a’ 1u-) are nearly coincident
N2
O2*
O2(C3g) + N2(X) → O2(X) + N2(a’ 1u-)
is energetically probable