This content has been downloaded from IOPscience. Please scroll down to see the full text. Download details: IP Address: 138.37.211.113 This content was downloaded on 17/07/2014 at 17:18 Please note that terms and conditions apply. Investigation of positive and negative modes of nanosecond pulsed discharge in water and electrostriction model of initiation View the table of contents for this issue, or go to the journal homepage for more 2013 J. Phys. D: Appl. Phys. 46 355201 (http://iopscience.iop.org/0022-3727/46/35/355201) Home Search Collections Journals About Contact us My IOPscience
Transcript
This content has been downloaded from IOPscience. Please scroll down to see the full text.
Download details:
IP Address: 138.37.211.113
This content was downloaded on 17/07/2014 at 17:18
Please note that terms and conditions apply.
Investigation of positive and negative modes of nanosecond pulsed discharge in water and
electrostriction model of initiation
View the table of contents for this issue, or go to the journal homepage for more
IOP PUBLISHING JOURNAL OF PHYSICS D: APPLIED PHYSICS
J. Phys. D: Appl. Phys. 46 (2013) 355201 (12pp) doi:10.1088/0022-3727/46/35/355201
Investigation of positive and negativemodes of nanosecond pulsed dischargein water and electrostriction modelof initiationYohan Seepersad1,2, Mikhail Pekker1, Mikhail N Shneider3,Alexander Fridman1,4 and Danil Dobrynin1
1 A. J. Drexel Plasma Institute, Drexel University, Camden, NJ 08103, USA2 Electrical and Computer Engineering Department, Drexel University, Philadelphia, PA 19104, USA3 Mechanical and Aerospace Engineering Department, Princeton University, Princeton, NJ 08544, USA4 Mechanical Engineering and Mechanics Department, Drexel University, Philadelphia, PA 19104, USA
Received 27 May 2013, in final form 15 July 2013Published 14 August 2013Online at stacks.iop.org/JPhysD/46/355201
AbstractThis work investigates the development of nanosecond pulsed discharges in water ignited withthe application of both positive and negative polarity pulses to submerged pin-to-planeelectrodes. Optical diagnostics are used to study two main aspects of these discharges: theinitiation phase, and the development phase. Nanosecond pulses up to 24 kV with 4 ns risetime, 10 ns duration and 5 ns fall time are used to ignite discharges in a 1.5 mm gap between acopper plate and a tungsten needle with radius of curvature of 25 µm. Fast ICCD imaging isused to trace the discharge development over varying applied pulse amplitudes for bothpositively and negatively applied pulses to the pin electrode. The discharge is found toprogress similar to that of discharges in long gaps—long sparks—in gases, both in structureand development. The more important initiation phase is investigated via schlierentransmission imaging. The region near the tip of the electrode is investigated for slightlyunder-breakdown conditions, and changes in the liquid’s refractive index and density areobserved over the duration of the applied pulse. An attempt to explain the results is madebased on the electrostriction model of discharge initiation.
(Some figures may appear in colour only in the online journal)
1. Introduction
The topic of high-voltage interaction with liquids has heldsignificant interest amongst the scientific community for anumber of years, as per the work cited in the reviews [1–4].In particular, [4] provides a more recent account of someof the applications employing plasma discharges in liquidswith emphasis on its impact on the field of nanoscience.Much attention has also been placed on trying to identify thefundamental processes leading to the formation of plasma inliquid media. Until recently, the favoured theory was thatplasma generation in liquids was enabled via the formation ofbubbles near the electrodes produced by various effects (Jouleheating, electrostatic expansion of pre-existing micro-bubbles,
electrochemical effects); these low-density cavities effectivelyfacilitate electron avalanche sufficient to initiate breakdown[1, 3]. More intriguing work in the last couple of years hasshown the possibility of plasma formation in liquids withoutthe initial bubble growth stage [5, 6]. Plasma generationin water, produced by applied electric fields lower than thepredicted thresholds for the direct ionization of condensedmedia was shown, and some attempt has been made to explainthe mechanisms leading to these observations on a fundamentallevel [6–9]. Paramount to the conjectured mechanisms inthese publications is the requirement of applied electric fieldswith extremely fast voltage rise times (<5 ns)—much like theconditions under which direct plasma formation in liquid phasewithout bubbles was observed in [5].
J. Phys. D: Appl. Phys. 46 (2013) 355201 Y Seepersad et al
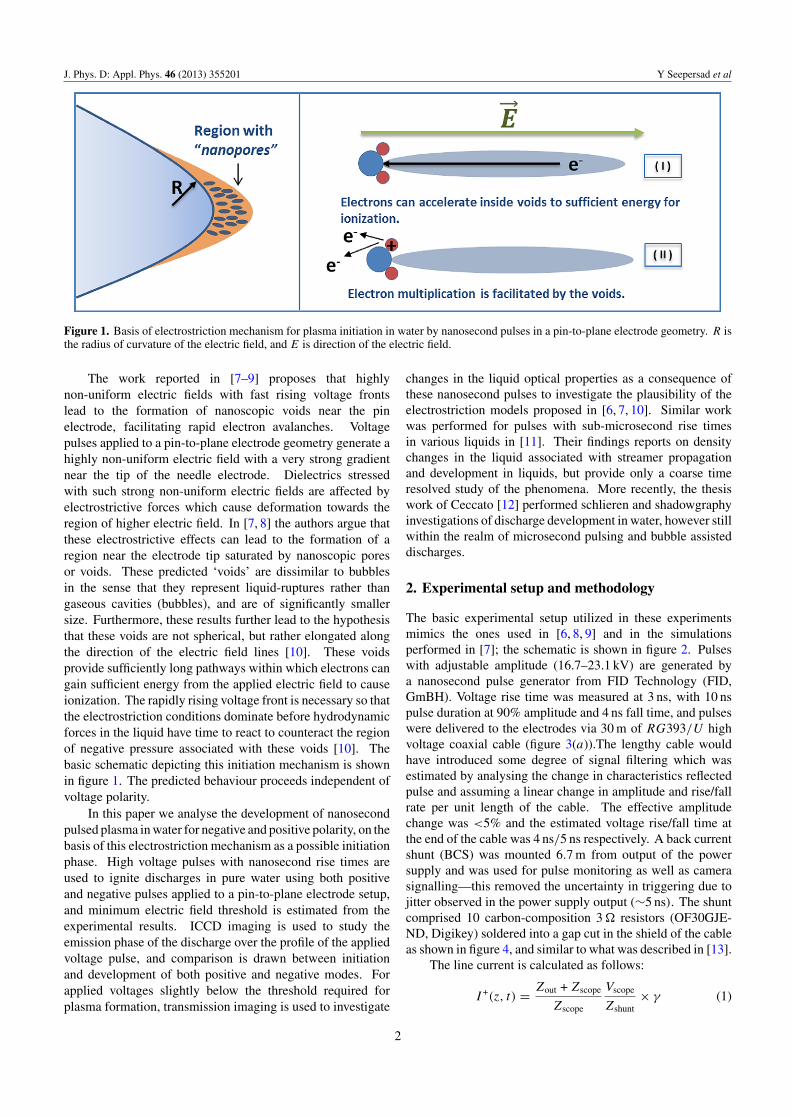
Figure 1. Basis of electrostriction mechanism for plasma initiation in water by nanosecond pulses in a pin-to-plane electrode geometry. R isthe radius of curvature of the electric field, and E is direction of the electric field.
The work reported in [7–9] proposes that highlynon-uniform electric fields with fast rising voltage frontslead to the formation of nanoscopic voids near the pinelectrode, facilitating rapid electron avalanches. Voltagepulses applied to a pin-to-plane electrode geometry generate ahighly non-uniform electric field with a very strong gradientnear the tip of the needle electrode. Dielectrics stressedwith such strong non-uniform electric fields are affected byelectrostrictive forces which cause deformation towards theregion of higher electric field. In [7, 8] the authors argue thatthese electrostrictive effects can lead to the formation of aregion near the electrode tip saturated by nanoscopic poresor voids. These predicted ‘voids’ are dissimilar to bubblesin the sense that they represent liquid-ruptures rather thangaseous cavities (bubbles), and are of significantly smallersize. Furthermore, these results further lead to the hypothesisthat these voids are not spherical, but rather elongated alongthe direction of the electric field lines [10]. These voidsprovide sufficiently long pathways within which electrons cangain sufficient energy from the applied electric field to causeionization. The rapidly rising voltage front is necessary so thatthe electrostriction conditions dominate before hydrodynamicforces in the liquid have time to react to counteract the regionof negative pressure associated with these voids [10]. Thebasic schematic depicting this initiation mechanism is shownin figure 1. The predicted behaviour proceeds independent ofvoltage polarity.
In this paper we analyse the development of nanosecondpulsed plasma in water for negative and positive polarity, on thebasis of this electrostriction mechanism as a possible initiationphase. High voltage pulses with nanosecond rise times areused to ignite discharges in pure water using both positiveand negative pulses applied to a pin-to-plane electrode setup,and minimum electric field threshold is estimated from theexperimental results. ICCD imaging is used to study theemission phase of the discharge over the profile of the appliedvoltage pulse, and comparison is drawn between initiationand development of both positive and negative modes. Forapplied voltages slightly below the threshold required forplasma formation, transmission imaging is used to investigate
changes in the liquid optical properties as a consequence ofthese nanosecond pulses to investigate the plausibility of theelectrostriction models proposed in [6, 7, 10]. Similar workwas performed for pulses with sub-microsecond rise timesin various liquids in [11]. Their findings reports on densitychanges in the liquid associated with streamer propagationand development in liquids, but provide only a coarse timeresolved study of the phenomena. More recently, the thesiswork of Ceccato [12] performed schlieren and shadowgraphyinvestigations of discharge development in water, however stillwithin the realm of microsecond pulsing and bubble assisteddischarges.
2. Experimental setup and methodology
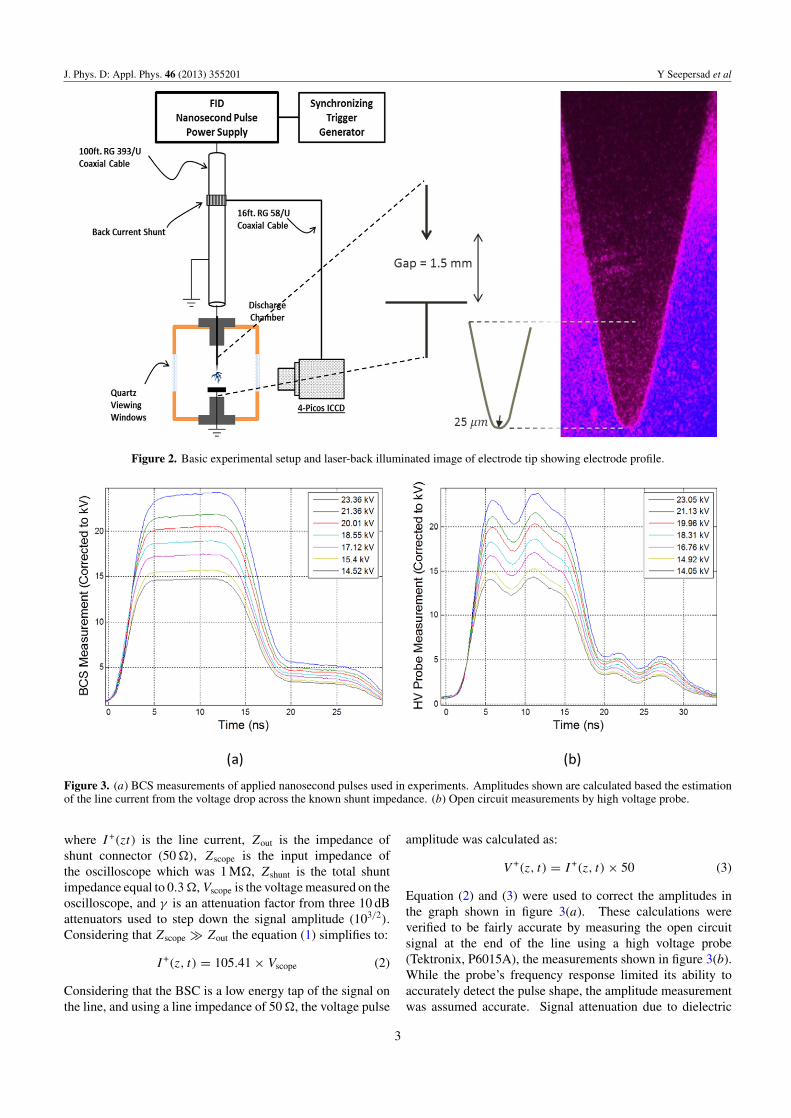
The basic experimental setup utilized in these experimentsmimics the ones used in [6, 8, 9] and in the simulationsperformed in [7]; the schematic is shown in figure 2. Pulseswith adjustable amplitude (16.7–23.1 kV) are generated bya nanosecond pulse generator from FID Technology (FID,GmBH). Voltage rise time was measured at 3 ns, with 10 nspulse duration at 90% amplitude and 4 ns fall time, and pulseswere delivered to the electrodes via 30 m of RG393/U highvoltage coaxial cable (figure 3(a)).The lengthy cable wouldhave introduced some degree of signal filtering which wasestimated by analysing the change in characteristics reflectedpulse and assuming a linear change in amplitude and rise/fallrate per unit length of the cable. The effective amplitudechange was <5% and the estimated voltage rise/fall time atthe end of the cable was 4 ns/5 ns respectively. A back currentshunt (BCS) was mounted 6.7 m from output of the powersupply and was used for pulse monitoring as well as camerasignalling—this removed the uncertainty in triggering due tojitter observed in the power supply output (∼5 ns). The shuntcomprised 10 carbon-composition 3 � resistors (OF30GJE-ND, Digikey) soldered into a gap cut in the shield of the cableas shown in figure 4, and similar to what was described in [13].
The line current is calculated as follows:
I +(z, t) = Zout + Zscope
Zscope
Vscope
Zshunt× γ (1)
2
J. Phys. D: Appl. Phys. 46 (2013) 355201 Y Seepersad et al
Figure 2. Basic experimental setup and laser-back illuminated image of electrode tip showing electrode profile.
Figure 3. (a) BCS measurements of applied nanosecond pulses used in experiments. Amplitudes shown are calculated based the estimationof the line current from the voltage drop across the known shunt impedance. (b) Open circuit measurements by high voltage probe.
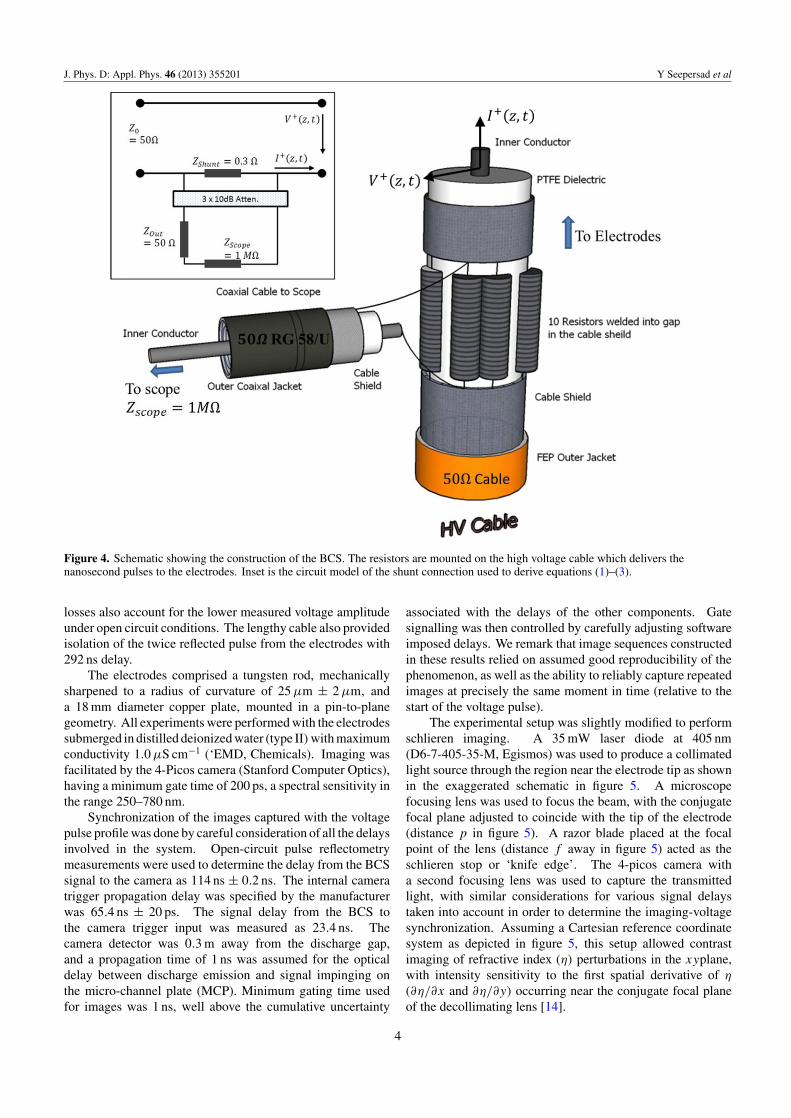
where I +(zt) is the line current, Zout is the impedance ofshunt connector (50 �), Zscope is the input impedance ofthe oscilloscope which was 1 M�, Zshunt is the total shuntimpedance equal to 0.3 �, Vscope is the voltage measured on theoscilloscope, and γ is an attenuation factor from three 10 dBattenuators used to step down the signal amplitude (103/2).Considering that Zscope � Zout the equation (1) simplifies to:
I +(z, t) = 105.41 × Vscope (2)
Considering that the BSC is a low energy tap of the signal onthe line, and using a line impedance of 50 �, the voltage pulse
amplitude was calculated as:
V +(z, t) = I +(z, t) × 50 (3)
Equation (2) and (3) were used to correct the amplitudes inthe graph shown in figure 3(a). These calculations wereverified to be fairly accurate by measuring the open circuitsignal at the end of the line using a high voltage probe(Tektronix, P6015A), the measurements shown in figure 3(b).While the probe’s frequency response limited its ability toaccurately detect the pulse shape, the amplitude measurementwas assumed accurate. Signal attenuation due to dielectric
3
J. Phys. D: Appl. Phys. 46 (2013) 355201 Y Seepersad et al
Figure 4. Schematic showing the construction of the BCS. The resistors are mounted on the high voltage cable which delivers thenanosecond pulses to the electrodes. Inset is the circuit model of the shunt connection used to derive equations (1)–(3).
losses also account for the lower measured voltage amplitudeunder open circuit conditions. The lengthy cable also providedisolation of the twice reflected pulse from the electrodes with292 ns delay.
The electrodes comprised a tungsten rod, mechanicallysharpened to a radius of curvature of 25 µm ± 2 µm, anda 18 mm diameter copper plate, mounted in a pin-to-planegeometry. All experiments were performed with the electrodessubmerged in distilled deionized water (type II) with maximumconductivity 1.0 µS cm−1 (‘EMD, Chemicals). Imaging wasfacilitated by the 4-Picos camera (Stanford Computer Optics),having a minimum gate time of 200 ps, a spectral sensitivity inthe range 250–780 nm.
Synchronization of the images captured with the voltagepulse profile was done by careful consideration of all the delaysinvolved in the system. Open-circuit pulse reflectometrymeasurements were used to determine the delay from the BCSsignal to the camera as 114 ns ± 0.2 ns. The internal cameratrigger propagation delay was specified by the manufacturerwas 65.4 ns ± 20 ps. The signal delay from the BCS tothe camera trigger input was measured as 23.4 ns. Thecamera detector was 0.3 m away from the discharge gap,and a propagation time of 1 ns was assumed for the opticaldelay between discharge emission and signal impinging onthe micro-channel plate (MCP). Minimum gating time usedfor images was 1 ns, well above the cumulative uncertainty
associated with the delays of the other components. Gatesignalling was then controlled by carefully adjusting softwareimposed delays. We remark that image sequences constructedin these results relied on assumed good reproducibility of thephenomenon, as well as the ability to reliably capture repeatedimages at precisely the same moment in time (relative to thestart of the voltage pulse).
The experimental setup was slightly modified to performschlieren imaging. A 35 mW laser diode at 405 nm(D6-7-405-35-M, Egismos) was used to produce a collimatedlight source through the region near the electrode tip as shownin the exaggerated schematic in figure 5. A microscopefocusing lens was used to focus the beam, with the conjugatefocal plane adjusted to coincide with the tip of the electrode(distance p in figure 5). A razor blade placed at the focalpoint of the lens (distance f away in figure 5) acted as theschlieren stop or ‘knife edge’. The 4-picos camera witha second focusing lens was used to capture the transmittedlight, with similar considerations for various signal delaystaken into account in order to determine the imaging-voltagesynchronization. Assuming a Cartesian reference coordinatesystem as depicted in figure 5, this setup allowed contrastimaging of refractive index (η) perturbations in the xyplane,with intensity sensitivity to the first spatial derivative of η
(∂η/∂x and ∂η/∂y) occurring near the conjugate focal planeof the decollimating lens [14].
4
J. Phys. D: Appl. Phys. 46 (2013) 355201 Y Seepersad et al
Figure 5. Schematic showing the principle of operation of the basic laser schlieren setup.
Figure 6. Background image used to correct schlieren images. Theoutline in the image shows the diffraction halo commonly observedaround opaque objects in schlieren systems.
The schlieren images taken were all post processed usingbackground-subtraction, the background image captured withno voltage applied to the electrodes, and a typical imageis shown in figure 6. A diffuse glow or halo outlines theprofile of the electrode, and is a result of diffraction of lightaround the edges of opaque objects commonly observed inschlieren systems [14]. Automatic image processing wasperformed within the camera software, 4SpecE, and furtherpost processing was done using ImageJ.
Changes in refractive index occurring in conjugate focalplane of the schlieren setup can manifest themselves in 2 ways.Light rays through these regions will be bent off the z-axis insome direction normal to the xy plane by some small angle.Deflections occurring in the plane parallel to the knife edge
will not be seen in this setup. Deflections occurring in theplane perpendicular to the knife edge can either deflect raysinto the knife edge (dashed blue line) or away from the knifeedge (dashed red line). Thus, in the imaging plane, brighterareas will correspond to refracted light that has been displacedabove the knife edge. It is worth noting that light deflectedinto the knife edge (dashed blue line) will appear as a darkerregion, relative to what the background image would look likefor homogeneous media. This is because the spot size ofthe condensed beam at the focal point has a finite size [14].This explains why the background image shown in figure 6 isnot completely dark in the areas besides the diffraction halo.Furthermore, considering that light bends towards regionsof higher refractive index and away from regions of lowerrefractive index, proper positioning of the knife edge will allowregions of the higher density and regions of lower density tobe distinguished using a background subtraction scheme.
3. Results
The results presented in this section are mostly ICCDimages and image-analysis based on the different experimentsconcerned. The images have been assigned an artificial colourmap which represents the intensity distribution of light overthe image. Brighter areas represent regions of intense incidentlight in that region, and darker areas the lack thereof.
3.1. Breakdown conditions: ICCD imaging
Previous studies have been done investigating the developmentof nanosecond pulses in liquids [5, 6]. The results includedhere are consistent with the findings of the previous works, but
5
J. Phys. D: Appl. Phys. 46 (2013) 355201 Y Seepersad et al
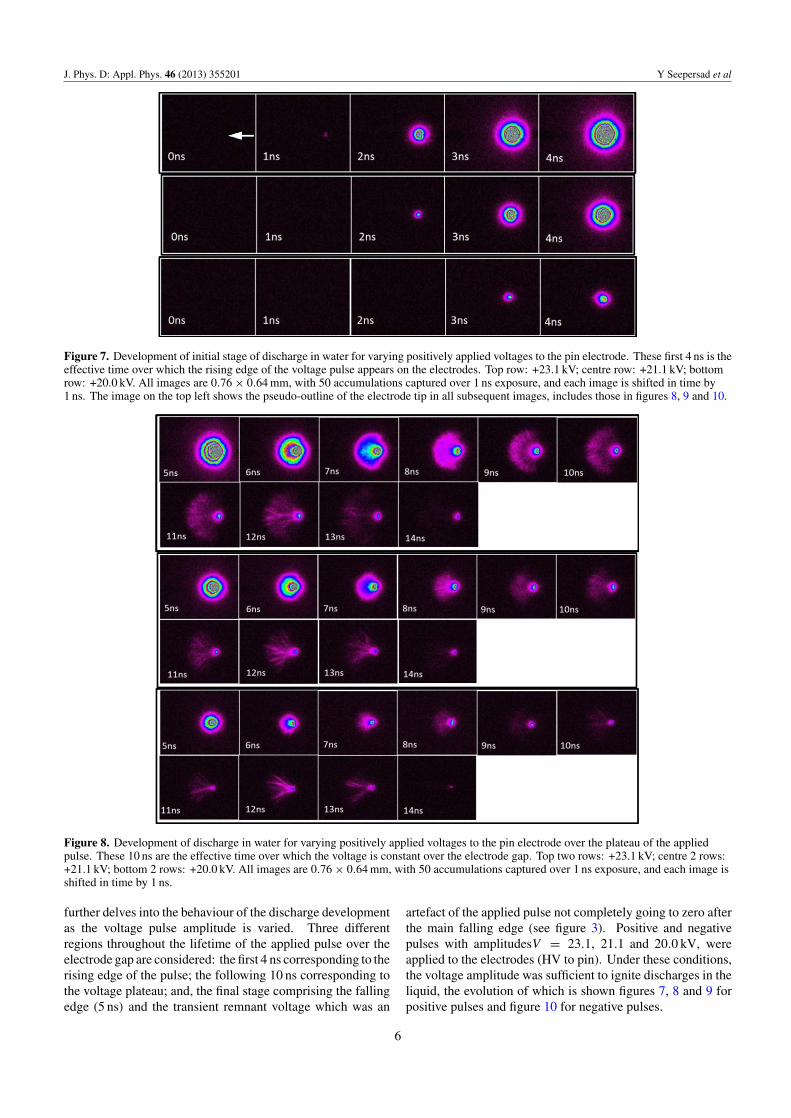
Figure 7. Development of initial stage of discharge in water for varying positively applied voltages to the pin electrode. These first 4 ns is theeffective time over which the rising edge of the voltage pulse appears on the electrodes. Top row: +23.1 kV; centre row: +21.1 kV; bottomrow: +20.0 kV. All images are 0.76 × 0.64 mm, with 50 accumulations captured over 1 ns exposure, and each image is shifted in time by1 ns. The image on the top left shows the pseudo-outline of the electrode tip in all subsequent images, includes those in figures 8, 9 and 10.
Figure 8. Development of discharge in water for varying positively applied voltages to the pin electrode over the plateau of the appliedpulse. These 10 ns are the effective time over which the voltage is constant over the electrode gap. Top two rows: +23.1 kV; centre 2 rows:+21.1 kV; bottom 2 rows: +20.0 kV. All images are 0.76 × 0.64 mm, with 50 accumulations captured over 1 ns exposure, and each image isshifted in time by 1 ns.
further delves into the behaviour of the discharge developmentas the voltage pulse amplitude is varied. Three differentregions throughout the lifetime of the applied pulse over theelectrode gap are considered: the first 4 ns corresponding to therising edge of the pulse; the following 10 ns corresponding tothe voltage plateau; and, the final stage comprising the fallingedge (5 ns) and the transient remnant voltage which was an
artefact of the applied pulse not completely going to zero afterthe main falling edge (see figure 3). Positive and negativepulses with amplitudesV = 23.1, 21.1 and 20.0 kV, wereapplied to the electrodes (HV to pin). Under these conditions,the voltage amplitude was sufficient to ignite discharges in theliquid, the evolution of which is shown figures 7, 8 and 9 forpositive pulses and figure 10 for negative pulses.
6
J. Phys. D: Appl. Phys. 46 (2013) 355201 Y Seepersad et al
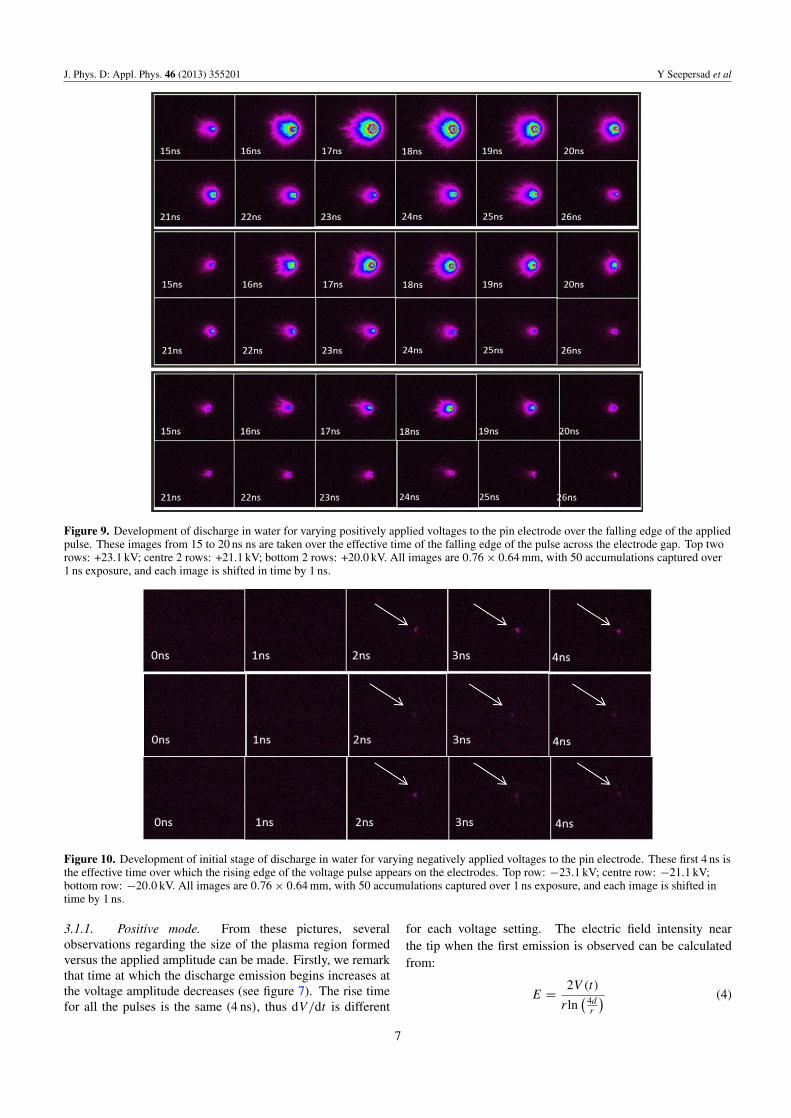
Figure 9. Development of discharge in water for varying positively applied voltages to the pin electrode over the falling edge of the appliedpulse. These images from 15 to 20 ns ns are taken over the effective time of the falling edge of the pulse across the electrode gap. Top tworows: +23.1 kV; centre 2 rows: +21.1 kV; bottom 2 rows: +20.0 kV. All images are 0.76 × 0.64 mm, with 50 accumulations captured over1 ns exposure, and each image is shifted in time by 1 ns.
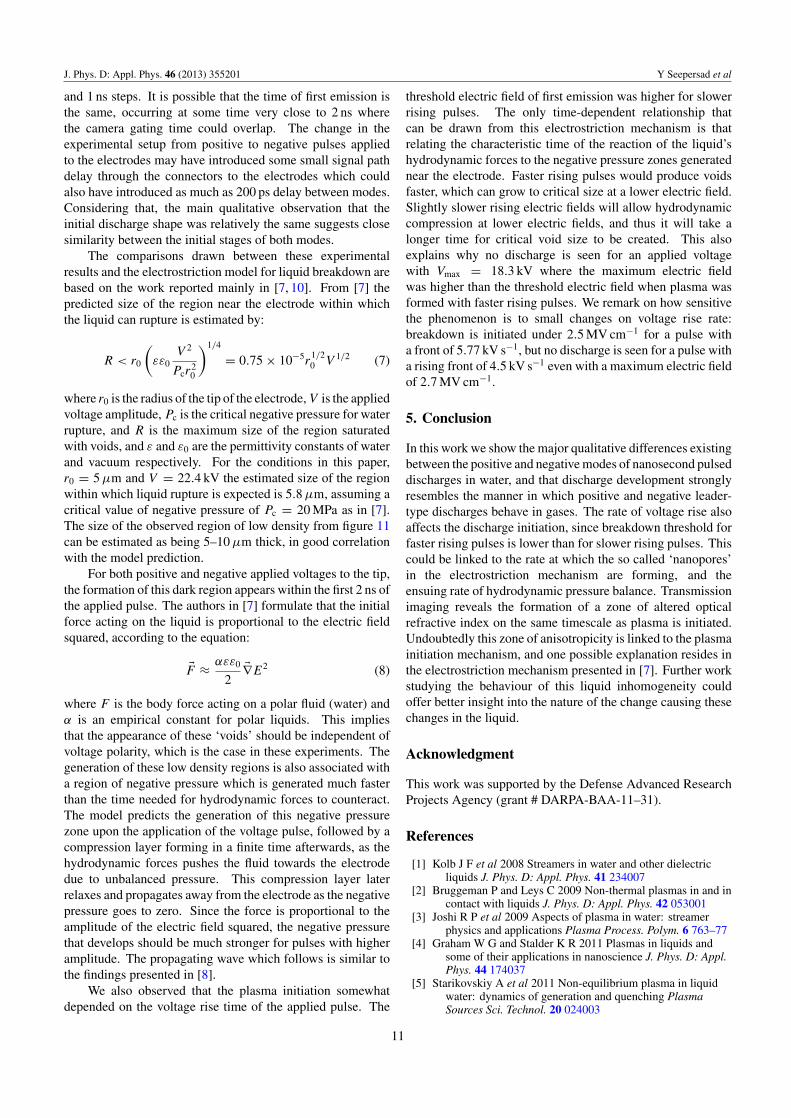
Figure 10. Development of initial stage of discharge in water for varying negatively applied voltages to the pin electrode. These first 4 ns isthe effective time over which the rising edge of the voltage pulse appears on the electrodes. Top row: −23.1 kV; centre row: −21.1 kV;bottom row: −20.0 kV. All images are 0.76 × 0.64 mm, with 50 accumulations captured over 1 ns exposure, and each image is shifted intime by 1 ns.
3.1.1. Positive mode. From these pictures, severalobservations regarding the size of the plasma region formedversus the applied amplitude can be made. Firstly, we remarkthat time at which the discharge emission begins increases atthe voltage amplitude decreases (see figure 7). The rise timefor all the pulses is the same (4 ns), thus dV/dt is different
for each voltage setting. The electric field intensity nearthe tip when the first emission is observed can be calculatedfrom:
E = 2V (t)
rln(
4dr
) (4)
7
J. Phys. D: Appl. Phys. 46 (2013) 355201 Y Seepersad et al
Figure 11. Time resolved schlieren images taken for a +16.8 kV pulse. Images are 365 × 233 µm, 100 accumulations and 1 ns step and 1 nscamera exposure.
where V (t) is the voltage across the gap at the time, t ,calculated from V (t) = t × Vmax/τrise, were Vmax is the peakamplitude, τrise = 4 ns. Also, r = 25 µm and d = 1.5 mmare the radius of curvature of the needle and electrode gaprespectively. Considering that the gating time for the camerawas 1 ns we estimate rather the range of the electric fieldintensity that exists over the gating window for which emissionwas first observed. For instance, the first emission observedat time t = 1 ns for an applied voltage of 23.1 kV as seenin figure 7 represents a gating window over the pulse fromt = 1 ns to t = 2 ns, the times relevant to the voltage pulseshown in figure 3(a). We found that for pulse amplitude of23.1 kV, first emission appeared when the electric field was0.84–1.69 MV cm−1, for pulse amplitude of 21.1 kV the fieldwas 1.54–2.31 MV cm−1 and for a pulse amplitude of 20.0 kVand field was 2.19–2.92 MV cm−1. Thus, as dV/dt increased,the threshold electric field at which emission was first seendecreased. This explains why no discharge was seen forapplied voltages of 18.3 kV where the maximum electric fieldon the tip was 2.7 MV cm−1 but the rate of change of voltageincrease was lower.
Secondly, the size of the emitting region grows only withthe rising edge of the pulse, with a maximum size attainedat the transition between the rising edge of the pulse and thevoltage plateau (compare figure 7 at 4 ns and figure 8 at 5 ns).When dV/dt fell to zero throughout the middle of the pulse, adistinct phase where the plasma was extinguished was clearlyapparent. This is consistent with the dark phase observedin [5, 6], although the emission does not completely disappearimmediately. Rather, the appearance changes to a morefilamentary structure (9 ns–13 ns), eventually diminishing toa small glow (14 ns).
Finally, the emitting region size grows on the fallingedge of the pulse, with a peak size occurring at 18 ns (seefigure 9). In the final 8 ns of the discharge lifetime, theplasma extinguished uniformly, in a ball-like structure, ratherthan the observed filamentary disappearance when the voltageamplitude was high.
3.1.2. Negative mode. Work involving nanoseconddischarges in water with negatively applied pulses to theneedle in a pin-to-plane electrode configuration has alsobeen performed in [15], although the development of thedischarge was not reported on. Similar time-resolved imaging
development as reported on for the positive mode wereconducted for negatively applied pulses to the pin electrode,with amplitudes −23.1, −21.2 and −20.0 kV.
First emission always occurs 2 ns after the start of thepulse, and the estimated electric field intensity ranges at whichthe emission is first seen can be estimated as done for thepositive mode. For an applied pulse of −23.1 kV the firstemission was seen when the electric field near the tip was1.7–2.5 MV cm−1; for a pulse of −21.1 kV the field was1.5–2.31 MV cm−1; and, for a pulse of −20.0 kV the fieldwas 1.5–2.2 MV cm−1. As was the case for positive modeof discharge, no emission was seen when a pulse of −18.3 kVwas applied.
In stark contrast to the emission size and patterns seen inthe positive mode, the discharge in the negative mode appearsas only a faint glowing ball, the size of which is not largerthan the diameter of the electrode tip (∼45–50 µm), as shownin figure 10. The faint emission appears to start at the sametime (2 ns) for all applied voltages, and the maximum size ofthe emitting region corresponds to the time where the risingedge transitions to the voltage plateau. It should be noted thatthe size of the emitting region also relatively constant, with noappreciable variation as observed for positive pulses. Similarto the positive mode, no emission is seen when dV/dt falls tozero and the emission phase only reappears on the falling edgeof the pulse.
For applied voltages which initiate breakdown, dischargeemission was too intense to allow proper utilization of schlierenimaging for observing density changes during the formationof plasma. Thus, the liquid surrounding the electrode tip wasstudied for under-voltage conditions, not sufficient for plasmato be initiated.
Figure 11 shows the schlieren imaging results for the initialstage of an applied pulse voltage of +16.8 kV. The label −1 nson the first picture annotates what the region near the tip of theelectrode is imaged as, 1 ns before the pulse is applied to theelectrodes. We notice that the only changes in the transmissioncharacteristics of the liquid near the electrode tip must be as aresult of the applied voltage. Since this picture is background-subtraction processed, the uniformly coloured image confirmsthat there is no difference between the background image (withno pulse applied), and the image immediately before the pulse
8
J. Phys. D: Appl. Phys. 46 (2013) 355201 Y Seepersad et al
Figure 12. Time resolved schlieren images taken for a −18.3 kV pulse. Images are 365 × 233 µm, 100 accumulations and 1 ns step and 1 nscamera exposure.
reaches the electrode. When the voltage beings to rise onthe electrode gap however the results show the growth of adark region near electrode tip. Considering the orientation ofthe knife edge in the schlieren setup, this can be interpretedin two ways. Firstly, this dark region could be seen as anarea of reduced refractive index from the surrounding liquid.This would lead to light refraction into the path of the knifeedge, and as a result a region of lower light intensity wouldappear in the image plane. Another interpretation is that adispersive region which scatters light is formed, reducing thetransmitted light to the image plane. The exact mechanismdoes not distract form the observation that some distinct changein the optical properties of the liquid is taking place as a resultof the application of these pulses. Moreover, these changesmanifest themselves on a nanosecond timescale
Similar results also exists for negatively applied voltages,as shown in figure 12 where a pulse of −18.3 kV was applied tothe pin electrode. Variations in intensities and clarity betweenfigures 11 and 12 were due to slight changes made to thealignment of the optics when switching between experiments.The behaviour of the fluid near the electrode upon applicationof the pulse was essentially the same however.
4. Discussion
In this section we will address the development of the dischargein both the positive and negative modes in the first section,assuming that initiation has already occurred. The secondsection will discuss the possible mechanism of initiation whichwe propose occurs independently of the voltage polarity.
4.1. Positive and negative mode of discharge development
These results show that plasma generated by nanosecondpulses exhibit behaviour very similar to that of dischargesin long gaps—long sparks—in gases, both in structure anddevelopment. In the case of microsecond pulses reported in[16], the authors showed that both positive and negative pulsesproduced plasma with branching filamentary structure whenthe initiation mechanism was clearly identified as being relatedto bubble growth at the electrode tip. In these experimentshowever, filamentary discharge structure only exists forpositively applied pulses. Positive discharge initiationis associated with cathode directed streamer propagation
and is governed by the generalized Meek criterion forbreakdown [17]:
xmax∫0
[α(x) − β(x)] dx � 20 (5)
On the other hand, negative discharge initiation is governed bysecondary emission from the cathode, and discharge developssimilar to a Townsend breakdown mechanism governed by thecriteria [17]:
xmax∫0
[α(x) − β(x)] dx = ln
(1 +
1
γ
)(6)
where α, β and γ are the first, second and third Townsendcoefficients respectively. In these equations, xmax representsthe length where the ionization rate and recombination rate areequal, or α(xmax) = β(xmax), and corresponds to the maximumsize of the visible glowing region for negative corona.
Positive discharge develops via a leader mechanism wherethe local electric field in the head of the streamer drives itspropagation, thus it is possible for the discharge to grow muchlarger the initial region where the primary avalanche takesplace. A continuously rising electric field sustains propagationof the leader and discharge growth which halts when dV/dt
falls to zero: as the leader propagates further away fromthe electrode and positive charge of the discharge columnincreases, a reverse radial electric field appears in order tocompensate this excessive positive charge by radial electroncurrent. This decreases axial electron current in the channel,resulting in decrease of the leader head potential leading toextinguishment of the discharge. Thus, as in the case ofleader discharge development in long gaps, constant increaseof electric field is essential to the discharge development [18].On the falling edge of the pulse, the electric field as a resultof the positive space charge generated during the first strikeis strong enough to re-ignite the plasma, thus the emittingregion again grows on the falling edge of the pulse. Sincethe medium already contains pre-ionized channels from theinitial streamers, the plasma reignites more easily. Positivemode development is pictorially represented in figure 13.
The negative mode discharge results in weak corona-type glow appearance without leader formation and does notpropagate since electrons are being repelled by the electrode
9
J. Phys. D: Appl. Phys. 46 (2013) 355201 Y Seepersad et al
Figure 13. Development of positive mode nanosecond pulsed plasma in water: (I) initiation, (II) propagation, (III) extinguishing on thevoltage plateau and then (IV) reilluminations on the falling edge. Inset is the voltage pulse showing the relative times at which the phasesoccur.
and get rapidly solvated by water molecules further away fromthe electrode. Similar to gases, breakdown electric field inthe case of negative polarity of the needle is greater than thatof positive discharge and is related to the differences in theavalanche and streamer development conditions [18]. In thevicinity of needle anode, avalanches are directed towards theelectrode and experience the effect of greater electric field asthey approach it. In contrast, cathode-initiated avalanches aredirected away from the electrode—in the direction of lowerelectric field. Secondary emission is able to sustain dischargenear the region of the electrode tip where the electric field ishighest and liberated electrons from collision processes andsecondary emission can continue to participate in ionization.At a distance xmax away from the electrode, attachmentbecome significant, and ionization cannot continue. Solvatedelectrons which are trapped lead to electric field screening andsubsequent extinguishing of the plasma when dV/dt goes tozero on the voltage plateau. As with the positive mode, theplasma reignites on the falling edge, but again the structureis that of a relatively small corona glow. We have offered anexplanation regarding the discharge development over time, aswell as the major qualitative differences in structure and sizebetween the positive and negative modes of discharge. Themajor question in these experiments still remains as to whatfacilitate the initiating electron avalanche in the liquid. Theresults from the schlieren experiments however might offersome insight into this initial phase.
4.2. Discharge initiation mechanism
Changes in refractive index have been previously studied fornanosecond pulsed electric fields applied to submerged pin-
to-plane electrodes in water, in which the authors attributethe well-known Kerr effect as the main process takingplace [19, 20]. Diploe alignment results in changes in thepermittivity of the water in the vicinity of the electrode. Thisdipole alignment with the electric field contributes to theponderomotive forces which lead to dielectric deformationas discussed in [7–10] and references therein. The schlierenresults presented in this report clearly depict some noticeablechange in optical properties of the water layers close to theelectrode tip where the electric field is highest, see: figures 11and 12. This effect is insensitive to the polarity of the appliedelectric field, as the observed refractive index anisotropicity isseen for both positive and negative voltages. We remark thatthe appearance of the discharge emission under breakdownconditions coincides with the same time that these anisotropicregions are observed to be formed for under-breakdownconditions. It is quite obvious that the processes taking place inthis region must lead to the initiation of the discharge in bothmodes. If we assume that the model presented in [7, 8, 10]holds true, then a possible explanation of the results willproceed in the manner which follows.
After 1–2 ns we observe the formation of the regionpresumably saturated with nanopores for under-breakdownconditions, and we assume that at higher voltages, this regionsupports electron avalanche that initially forms a ‘seed’ plasmaregion. This process should take place irrespective of thevoltage polarity, since the electron acceleration occurs withinthe elongated voids produced near the tip. This could explainwhy the initial stages of the positive and negative modes ofdischarge appear the same (compare figure 7, top row at 1 nsand figure 8, top row at 2 ns). We remark that these imagesrepresent a relatively coarse time evolution −1 ns exposures
10
J. Phys. D: Appl. Phys. 46 (2013) 355201 Y Seepersad et al
and 1 ns steps. It is possible that the time of first emission isthe same, occurring at some time very close to 2 ns wherethe camera gating time could overlap. The change in theexperimental setup from positive to negative pulses appliedto the electrodes may have introduced some small signal pathdelay through the connectors to the electrodes which couldalso have introduced as much as 200 ps delay between modes.Considering that, the main qualitative observation that theinitial discharge shape was relatively the same suggests closesimilarity between the initial stages of both modes.
The comparisons drawn between these experimentalresults and the electrostriction model for liquid breakdown arebased on the work reported mainly in [7, 10]. From [7] thepredicted size of the region near the electrode within whichthe liquid can rupture is estimated by:
R < r0
(εε0
V 2
Pcr20
)1/4
= 0.75 × 10⁻⁵r1/20 V 1/2 (7)
where r0 is the radius of the tip of the electrode, V is the appliedvoltage amplitude, Pc is the critical negative pressure for waterrupture, and R is the maximum size of the region saturatedwith voids, and ε and ε0 are the permittivity constants of waterand vacuum respectively. For the conditions in this paper,r0 = 5 µm and V = 22.4 kV the estimated size of the regionwithin which liquid rupture is expected is 5.8 µm, assuming acritical value of negative pressure of Pc = 20 MPa as in [7].The size of the observed region of low density from figure 11can be estimated as being 5–10 µm thick, in good correlationwith the model prediction.
For both positive and negative applied voltages to the tip,the formation of this dark region appears within the first 2 ns ofthe applied pulse. The authors in [7] formulate that the initialforce acting on the liquid is proportional to the electric fieldsquared, according to the equation:
�F ≈ αεε0
2�∇E2 (8)
where F is the body force acting on a polar fluid (water) andα is an empirical constant for polar liquids. This impliesthat the appearance of these ‘voids’ should be independent ofvoltage polarity, which is the case in these experiments. Thegeneration of these low density regions is also associated witha region of negative pressure which is generated much fasterthan the time needed for hydrodynamic forces to counteract.The model predicts the generation of this negative pressurezone upon the application of the voltage pulse, followed by acompression layer forming in a finite time afterwards, as thehydrodynamic forces pushes the fluid towards the electrodedue to unbalanced pressure. This compression layer laterrelaxes and propagates away from the electrode as the negativepressure goes to zero. Since the force is proportional to theamplitude of the electric field squared, the negative pressurethat develops should be much stronger for pulses with higheramplitude. The propagating wave which follows is similar tothe findings presented in [8].
We also observed that the plasma initiation somewhatdepended on the voltage rise time of the applied pulse. The
threshold electric field of first emission was higher for slowerrising pulses. The only time-dependent relationship thatcan be drawn from this electrostriction mechanism is thatrelating the characteristic time of the reaction of the liquid’shydrodynamic forces to the negative pressure zones generatednear the electrode. Faster rising pulses would produce voidsfaster, which can grow to critical size at a lower electric field.Slightly slower rising electric fields will allow hydrodynamiccompression at lower electric fields, and thus it will take alonger time for critical void size to be created. This alsoexplains why no discharge is seen for an applied voltagewith Vmax = 18.3 kV where the maximum electric fieldwas higher than the threshold electric field when plasma wasformed with faster rising pulses. We remark on how sensitivethe phenomenon is to small changes on voltage rise rate:breakdown is initiated under 2.5 MV cm−1 for a pulse witha front of 5.77 kV s−1, but no discharge is seen for a pulse witha rising front of 4.5 kV s−1 even with a maximum electric fieldof 2.7 MV cm−1.
5. Conclusion
In this work we show the major qualitative differences existingbetween the positive and negative modes of nanosecond pulseddischarges in water, and that discharge development stronglyresembles the manner in which positive and negative leader-type discharges behave in gases. The rate of voltage rise alsoaffects the discharge initiation, since breakdown threshold forfaster rising pulses is lower than for slower rising pulses. Thiscould be linked to the rate at which the so called ‘nanopores’in the electrostriction mechanism are forming, and theensuing rate of hydrodynamic pressure balance. Transmissionimaging reveals the formation of a zone of altered opticalrefractive index on the same timescale as plasma is initiated.Undoubtedly this zone of anisotropicity is linked to the plasmainitiation mechanism, and one possible explanation resides inthe electrostriction mechanism presented in [7]. Further workstudying the behaviour of this liquid inhomogeneity couldoffer better insight into the nature of the change causing thesechanges in the liquid.
Acknowledgment
This work was supported by the Defense Advanced ResearchProjects Agency (grant # DARPA-BAA-11–31).
References
[1] Kolb J F et al 2008 Streamers in water and other dielectricliquids J. Phys. D: Appl. Phys. 41 234007
[2] Bruggeman P and Leys C 2009 Non-thermal plasmas in and incontact with liquids J. Phys. D: Appl. Phys. 42 053001
[3] Joshi R P et al 2009 Aspects of plasma in water: streamerphysics and applications Plasma Process. Polym. 6 763–77
[4] Graham W G and Stalder K R 2011 Plasmas in liquids andsome of their applications in nanoscience J. Phys. D: Appl.Phys. 44 174037
[5] Starikovskiy A et al 2011 Non-equilibrium plasma in liquidwater: dynamics of generation and quenching PlasmaSources Sci. Technol. 20 024003
J. Phys. D: Appl. Phys. 46 (2013) 355201 Y Seepersad et al
[6] Dobrynin D et al 2013 Non-equilibrium nanosecond-pulsedplasma generation in the liquid phase (water, PDMS)without bubbles: fast imaging, spectroscopy andleader-type model J. Phys. D: Appl. Phys. 46 105201
[7] Shneider M N, Pekker M and Fridman A 2012 Theoreticalstudy of the initial stage of sub-nanosecond pulsedbreakdown in liquid dielectrics IEEE Trans. Dielectr. Electr.Insul. 19 1597–82
[8] Seepersad Y et al 2013 On the electrostrictive mechanism ofnanosecond-pulsed breakdown in liquid phase J. Phys. D:Appl. Phys. 46 162001
[9] Starikovskiy A 2013 Pulsed nanosecond dischargedevelopment in liquids with various dielectric permittivityconstants Plasma Sources Sci. Technol. 22 012001
[10] Shneider M N and Pekker M 2013 Dielectric fluid ininhomogeneous pulsed electric field Phys. Rev. E87 043004
[11] Devins J C, Rzad S J and Schwabe R J 1981 Breakdown andprebreakdown phenomena in liquids J. Appl. Phys.52 4531–45
[12] Ceccato P 2009 Filamentary Plasma discharger inside water:initiation and propagation of a plasma in a dense mediumPhD Thesis Ecole Polytecnique Palaiseau
[13] Keisuke Udagawa S G, Pliavaka F, Nishihara M andAdamovich I 2008 Experimental study of a fast ionization
wave discharge at high pulse repetition rates AerospaceSciences Meeting and Exhibit 2008 (Reno, NV) AmericanInstitute of Aeronautics and Astronautics
[14] Settles G S 2001 Schlieren and Shadowgraph Techniques:Visualizing Phenomena in Transparent Media(Experimental fluid mechanics) (Berlin: Springer) xviii,p 376
[15] Staack D, Fridman A, Gutsol A, Gogotsi Y and Friedman G2008 Nanoscale corona in liquid, enabling nanosecondoptical emission spectroscopy Angew. Chem. 120 8140–4
[16] Ceccato P et al 2009 Time resolved imaging of a pulsedplasma discharge in water Pulsed Power Conf., 2009. PPC‘09 (Washington, DC) IEEE
[17] Fridman A A 2008 Plasma Chemistry (Cambridge:Cambridge University Press) xlii, p 978
[18] Raizer Y P, Allen J E and Kisin V I 2012 Gas DischargePhysics (London: Springer)
[19] Minamitani Y et al 2004 Nanosecond interferometricmeasurements of the electric field distribution in pulsecharged water gaps Power Modulator Symp., 2004 and2004 High-Voltage Workshop. Conf. Record of the 26th Int.(San Francisco, CA)
[20] Kolb J et al 2005 The permittivity of water under highdielectric stress Pulsed Power Conf., 2005 (Monterey, CA)IEEE