Investigation of Tendon Ducts by Means of Ultrasonic Echo Methods: A Comparative Study Martin KRAUSE, Boris MILMANN, BAM, Berlin, Germany Martin SCHICKERT, MFPA Bauhausuniversität, Weimar, Germany Klaus MAYER, University of Kassel, Germany Abstract. Post-tensioned tendon ducts in test specimens were investigated with scanning ultrasonic echo methods. For the same arrangement the propagation of elastic waves was calculated with 3D-EFIT in order to understand the wave propagation in such a multilayer system and for the interpretation of the results. The results are compared with the aim to improve the reliability of localising tendon ducts in prestressed concrete structures and to indicate grouting faults inside. The experiments and modelling were performed in the frame of the FOR 384 research group funded by the Deutsche Forschungsgemeinschaft (German Research Council). Introduction The investigation of post-tensioned tendon ducts is one of the most important and interesting testing problems for concrete constructions. Because of the complicated structure of those objects (several interfaces between concrete, tendon tube, strands, and grouting mortar), the interpretation of ultrasonic echo data is normally not possible with single point measurement but demands the combination of several measuring points. The most established way to do that is the synthetic aperture approach. The data is measured along a line or a 2D-area, respectively, and the reflected signals are imaged as B-scans and C-scans. Alternatively, the data is evaluated by a 2D or 3D reconstruction calculation (SAFT, Synthetic Aperture Focusing Technique) and FT-SAFT (Fourier Transform- SAFT). In order to understand the wave propagation and scattering in concrete (taking into account aggregates and air pores) and the reflection at different interfaces, modelling with Elastodynamic Finit Integration Technique (EFIT) is performed and compared to the experimental results. The comparative study was carried out at two test specimens containing artificial grouting faults in tendon ducts. The progress in producing ultrasonic transducers in the low frequency area (100 kHz to 400 kHz) for pressure waves and shear waves (30 kHz to 120 kHz) allow to compare the advantage of several arrangements: - Pressure waves in pulse echo technique (single transducer, impulse-echo mode) - Shear waves with dry point contact transducer (S/T-Transducer), bi-static set up - Shear waves with point contact transducers, multistatic array (not reported in the paper). ECNDT 2006 - Tu.3.2.1 1
Transcript
Investigation of Tendon Ducts by Means of Ultrasonic Echo Methods: A Comparative
Study
Martin KRAUSE, Boris MILMANN, BAM, Berlin, Germany Martin SCHICKERT, MFPA Bauhausuniversität, Weimar, Germany
Klaus MAYER, University of Kassel, Germany
Abstract. Post-tensioned tendon ducts in test specimens were investigated with scanning ultrasonic echo methods. For the same arrangement the propagation of elastic waves was calculated with 3D-EFIT in order to understand the wave propagation in such a multilayer system and for the interpretation of the results. The results are compared with the aim to improve the reliability of localising tendon ducts in prestressed concrete structures and to indicate grouting faults inside. The experiments and modelling were performed in the frame of the FOR 384 research group funded by the Deutsche Forschungsgemeinschaft (German Research Council).
Introduction
The investigation of post-tensioned tendon ducts is one of the most important and interesting testing problems for concrete constructions. Because of the complicated structure of those objects (several interfaces between concrete, tendon tube, strands, and grouting mortar), the interpretation of ultrasonic echo data is normally not possible with single point measurement but demands the combination of several measuring points. The most established way to do that is the synthetic aperture approach. The data is measured along a line or a 2D-area, respectively, and the reflected signals are imaged as B-scans and C-scans. Alternatively, the data is evaluated by a 2D or 3D reconstruction calculation (SAFT, Synthetic Aperture Focusing Technique) and FT-SAFT (Fourier Transform-SAFT).
In order to understand the wave propagation and scattering in concrete (taking into account aggregates and air pores) and the reflection at different interfaces, modelling with Elastodynamic Finit Integration Technique (EFIT) is performed and compared to the experimental results.
The comparative study was carried out at two test specimens containing artificial grouting faults in tendon ducts. The progress in producing ultrasonic transducers in the low frequency area (100 kHz to 400 kHz) for pressure waves and shear waves (30 kHz to 120 kHz) allow to compare the advantage of several arrangements: - Pressure waves in pulse echo technique (single transducer, impulse-echo mode) - Shear waves with dry point contact transducer (S/T-Transducer), bi-static set up - Shear waves with point contact transducers, multistatic array (not reported in the paper).
ECNDT 2006 - Tu.3.2.1
1
The experiments were partly carried out using automatic scanning systems, fabricated at BAM and MFPA. The experiments are evaluated discussing the following aspects: - Measuring the concrete cover - Localising grouting faults
Test specimens
For the investigation of tendon ducts a specimen was produced in 2002, which allowed localising artificially and unintentionally placed grouting faults [1]. A professional method was used for grouting the tendon duct pumping the mortar with overpressure of several bars. In this way a good acoustic contact between all elements was realised. That means that the ultrasonic propagation through the concrete, tendon sheet, grouting mortar and strands was not significantly hindered by air inclusions, besides the grouting faults. Figure 1 shows the construction plan of the specimen, the location of the void was verified using γ-radiography. The first part of the comparative study is carried out on the tendon duct and the grouting fault placed in the centre position.
Figure 1 Construction plan of test specimen BAM.NB.FBS.1, containing artificial voids in a tendon duct and styrodur balls. The location of the void in the duct was localised using γ-radiography. Green rectangle: Area of
pressure wave measurement MFPA; red arrows: area of presented shear wave measurement BAM.
In 2002 a Large Concrete Slab (LCS) was designed and constructed at BAM in order to realise typical testing tasks for the comparison of different NDT methods and their validation [2]. One part of this concrete slab contains 11 tendon ducts in the diameter range from 40 mm to 120 mm having concrete cover between 80 mm and 200 mm with artificial grouting faults produced in the same way as for the specimen described above. In figures 2 and 3 the process of grouting and one of the side positioned grouting defects are shown. For the study described in this paper tendon ducts with diameters of 40 mm and 80 mm
2
containing several grouting defects were chosen. First results of applying Radar, Impact-Echo and ultrasonics are described in [3].
The slab has been founded on a basement with PVC ducts. These ducts allow positioning of a radiation source below the slab and to carry out γ-radiography all over the slab. In this way it was possible to verify the location of the grouting faults.
Ultrasonic Methods
Transducers and scanning equipment
For the measurements carried out by MFPA a single transducer connected to a special low-frequency ultrasonic instrument was used. The transducer, working in impulse-echo mode and excited by single square pulses of 250 V amplitude, transmits pressure waves of about 200 kHz center frequency in concrete. The scanning process with 10 mm step size was automated using a 2-dimensional scanner (figure 4). Sound transmission was established using water coupling. The ultrasonic echo measurements of BAM were carried out using a dry contact ultrasonic transducers and BAM laboratory equipment. It transmits and receives shear waves with a centre frequency of 55 kHz, corresponding to about 45 mm wavelength in concrete. The transducer consists of 12 transmitting and 12 receiving dry contact point transducers [4]. The polarization axis of the shear waves can be changed in turning the measuring head by 90 degrees. For the automated measuring system, the exciting pulse is a rectangular signal with a magnitude of ± 300 V.
The measuring technique works automatically applying a scanning system described elsewhere (figure 5) [6]. The step width is typically 20 mm across the surface; the data is stored in the HF-oscillating mode.
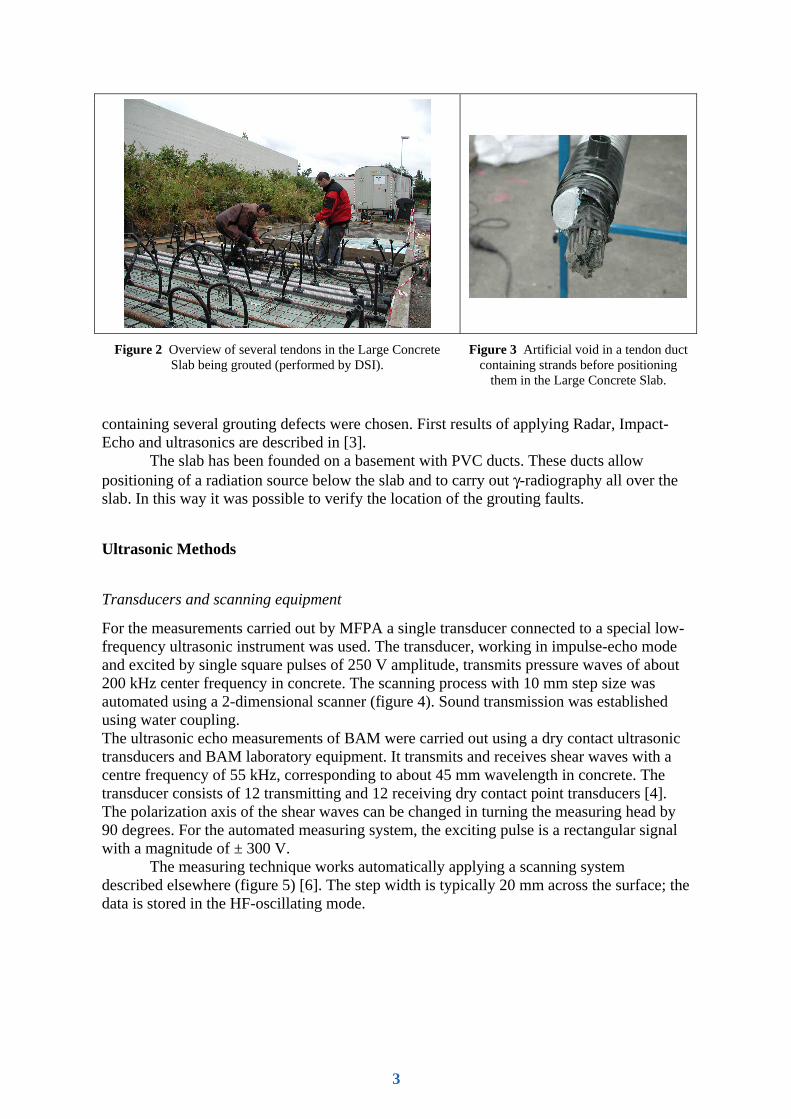
Figure 2 Overview of several tendons in the Large Concrete Slab being grouted (performed by DSI).
Figure 3 Artificial void in a tendon duct containing strands before positioning
them in the Large Concrete Slab.
3
Reconstruction calculation
From the stored data fields a three-dimensional reconstruction calculation is performed (3D-SAFT, Synthetic Aperture Focusing Technique) [7]. It results in a three dimensional representation of the reflections from the inside of the investigated volume. To interpret the data, they are plotted in projection planes or 3D visualisations. The cross section along a selectable axis shows the depth resolved reflection intensity, also called SAFT-B-scan. The reflection intensity parallel to surface in a adjustable depth is also called C-scan and shows the position of the reflectors and scatterers in a x/y representation for a given depth range.
Modelling
As simulation software we are using the 2D- and 3D-EFIT – Code (Elastodynamic Finite Integration Technique) [5]. It is an implementation of a finite difference time domain formalism and uses a discretization of the elastic properties of the material and the vector field quantities in a range of 1/10 of the wavelength. Therefore at least for 3D simulation huge computational memory is necessary which is realised by parallel computing on the base of MPI.
Experiments and results including modelling
Specimen with one tendon duct (FBS 1)
For the scanning measurement each group used its own scanner equipment as described above. The origin of the coordinates was identical for both measuring systems.
Results with shear waves
The specimen FBS1 (figure 1) was measured with a step width of 2 cm using the shear wave point contact transducer in both orientations of polarization, as described above. In figure 6 a B-scan from 3D-SAFT reconstruction is presented for the polarization parallel to the x-axis. It shows the reflection from the tendon duct, resulting from a projection line above the tendon duct parallel to the x axis. Apart from the back wall reflection at
Figure 4 Ultrasonic measuring head for pressure waves mounted in a 2D scanner working in impulse echo mode
with water coupling (MFPA).
Figure 5 2D scanner working with linear drives and a pneumatic system to press the point contact
transducers without coupling agent (BAM).
4
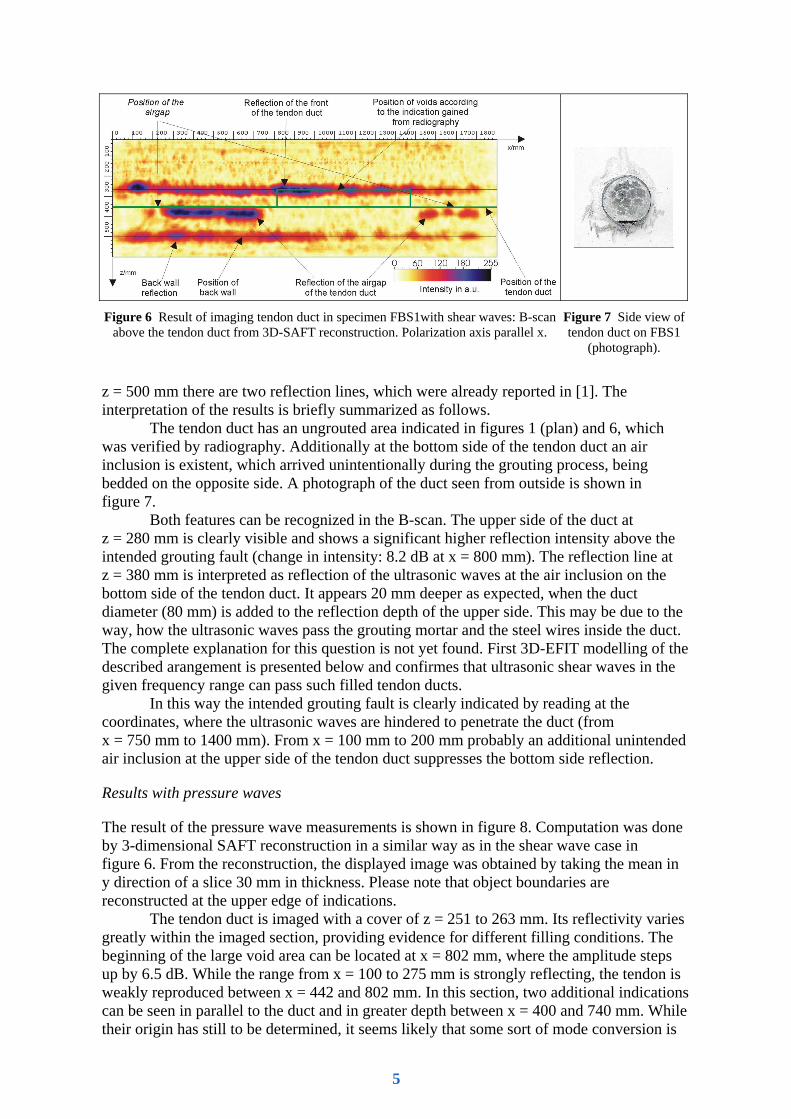
z = 500 mm there are two reflection lines, which were already reported in [1]. The interpretation of the results is briefly summarized as follows.
The tendon duct has an ungrouted area indicated in figures 1 (plan) and 6, which was verified by radiography. Additionally at the bottom side of the tendon duct an air inclusion is existent, which arrived unintentionally during the grouting process, being bedded on the opposite side. A photograph of the duct seen from outside is shown in figure 7.
Both features can be recognized in the B-scan. The upper side of the duct at z = 280 mm is clearly visible and shows a significant higher reflection intensity above the intended grouting fault (change in intensity: 8.2 dB at x = 800 mm). The reflection line at z = 380 mm is interpreted as reflection of the ultrasonic waves at the air inclusion on the bottom side of the tendon duct. It appears 20 mm deeper as expected, when the duct diameter (80 mm) is added to the reflection depth of the upper side. This may be due to the way, how the ultrasonic waves pass the grouting mortar and the steel wires inside the duct. The complete explanation for this question is not yet found. First 3D-EFIT modelling of the described arangement is presented below and confirmes that ultrasonic shear waves in the given frequency range can pass such filled tendon ducts.
In this way the intended grouting fault is clearly indicated by reading at the coordinates, where the ultrasonic waves are hindered to penetrate the duct (from x = 750 mm to 1400 mm). From x = 100 mm to 200 mm probably an additional unintended air inclusion at the upper side of the tendon duct suppresses the bottom side reflection.
Results with pressure waves
The result of the pressure wave measurements is shown in figure 8. Computation was done by 3-dimensional SAFT reconstruction in a similar way as in the shear wave case in figure 6. From the reconstruction, the displayed image was obtained by taking the mean in y direction of a slice 30 mm in thickness. Please note that object boundaries are reconstructed at the upper edge of indications.
The tendon duct is imaged with a cover of z = 251 to 263 mm. Its reflectivity varies greatly within the imaged section, providing evidence for different filling conditions. The beginning of the large void area can be located at x = 802 mm, where the amplitude steps up by 6.5 dB. While the range from x = 100 to 275 mm is strongly reflecting, the tendon is weakly reproduced between x = 442 and 802 mm. In this section, two additional indications can be seen in parallel to the duct and in greater depth between x = 400 and 740 mm. While their origin has still to be determined, it seems likely that some sort of mode conversion is
Figure 6 Result of imaging tendon duct in specimen FBS1with shear waves: B-scan above the tendon duct from 3D-SAFT reconstruction. Polarization axis parallel x.
Figure 7 Side view of tendon duct on FBS1
(photograph).
5
involved (see modelling, next paragraph). The back wall is shadowed by the tendon duct and is thus not very clear in this image. Modelling For the interpretation of ultrasonic echo results at tendon ducts, an understanding of reflection and transmission in multilayer systems is necessary. A first step was done with metal plates embedded in concrete covering the thickness range of 0.5 to 40 mm [8].
With 3D-EFIT the elastic wave field of the reflection from grouted and ungrouted ducts for a given arrangement can be calculated. For an example here the propagation of elastic waves is shown in the case of a tendon duct as integrated in specimen FBS1 for two cases: Completely grouted and containing a small air void.
Figure 9 shows snapshots of the wave filed of the 55 kHz point contact transducer, as it is was used for the experiments. The transmitting position is at the bottom of the graphic. The polarization is orientated in the x-axis parallel to the duct. Because the presented section plane is perpendicular to the duct directly above the transducer, a local SH-polarization occurs and no pressure waves and mode conversion appear. Two cases are presented: A profiled tendon duct, diameter 80 mm, containing 12 steel wires with (left) and without (right) air inclusion.
Figure 8 Result of imaging tendon duct in specimen FBS1with pressure
waves: B-scan above the tendon duct from 2D-SAFT reconstruction.
Figure 9 3D-EFIT modelling of ultrasonic scattering on a tendon duct as used for specimen FBS1
(diameter 80 mm, 12 steel wires). Excitation with shear wave transducer as used for the experiment
(55°kHz, polarization parallel to the duct), excitation from the bottom side. Snapshot of wave field for
t =°72 µs. a): Duct with air inclusion as shown; b) Fully grouted
duct; c) Comparison of A-scans for t = 72 µs.
6
The magnitude of the first significant echo is 4 times more intense in the case of the air inclusion. The onset of the reflection signal is about 10 μs later in the case of the grouted duct corresponding to the location of the steel cables.
Comparing the magnitude of the received signal at the same time - as for practical applications - the relatively small air inclusion only lead to a magnitude, which is about 5 dB more intense than in case of the grouted duct. The reflection from the bottom side of the duct is apparent around 140 μs, it is attenuated 17 dB in the case of the air inclusion and only 5 dB in the case of the completely grouted duct.
Tendon ducts in Large Concrete Slab
For the actual comparative study three tendons of the LCS were chosen. In this contribution the results for the 40 mm duct (named D1) are briefly summarised. For the scanning measurement each group used its own scanner equipment as described above. The origin of the coordinates was identical for both measuring systems. Some differences arrived from the fact that the origin was in a distance of about 5 to 10 m from the measuring areas, so the uncertainty for x and y is estimated to 20 mm.
Tendon D1 (Diameter 40 mm)
The tendon duct D1 has a diameter of 40 mm and was intended to be placed with a concrete cover of 110 mm. It contains only one steel wire (diameter 16 mm) centered in the middle of the duct. This arrangement was chosen because of research reasons.
Results with pressure waves
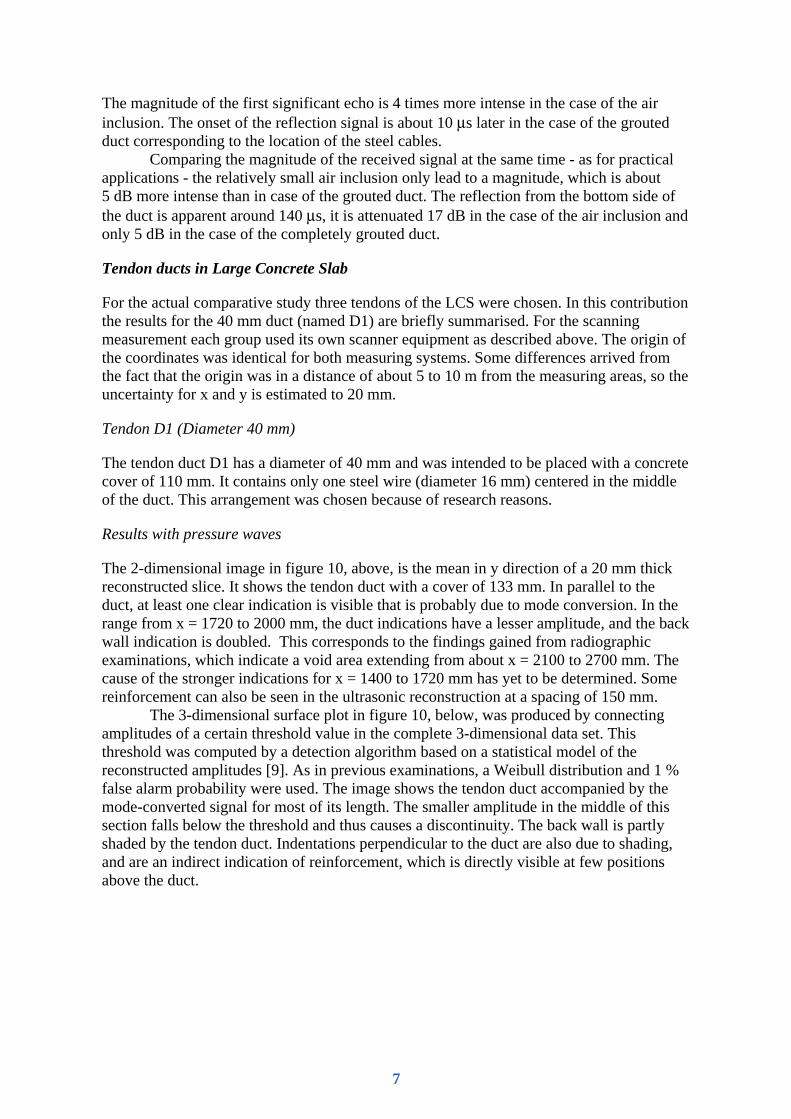
The 2-dimensional image in figure 10, above, is the mean in y direction of a 20 mm thick reconstructed slice. It shows the tendon duct with a cover of 133 mm. In parallel to the duct, at least one clear indication is visible that is probably due to mode conversion. In the range from x = 1720 to 2000 mm, the duct indications have a lesser amplitude, and the back wall indication is doubled. This corresponds to the findings gained from radiographic examinations, which indicate a void area extending from about x = 2100 to 2700 mm. The cause of the stronger indications for x = 1400 to 1720 mm has yet to be determined. Some reinforcement can also be seen in the ultrasonic reconstruction at a spacing of 150 mm.
The 3-dimensional surface plot in figure 10, below, was produced by connecting amplitudes of a certain threshold value in the complete 3-dimensional data set. This threshold was computed by a detection algorithm based on a statistical model of the reconstructed amplitudes [9]. As in previous examinations, a Weibull distribution and 1 % false alarm probability were used. The image shows the tendon duct accompanied by the mode-converted signal for most of its length. The smaller amplitude in the middle of this section falls below the threshold and thus causes a discontinuity. The back wall is partly shaded by the tendon duct. Indentations perpendicular to the duct are also due to shading, and are an indirect indication of reinforcement, which is directly visible at few positions above the duct.
7
Results with shear waves
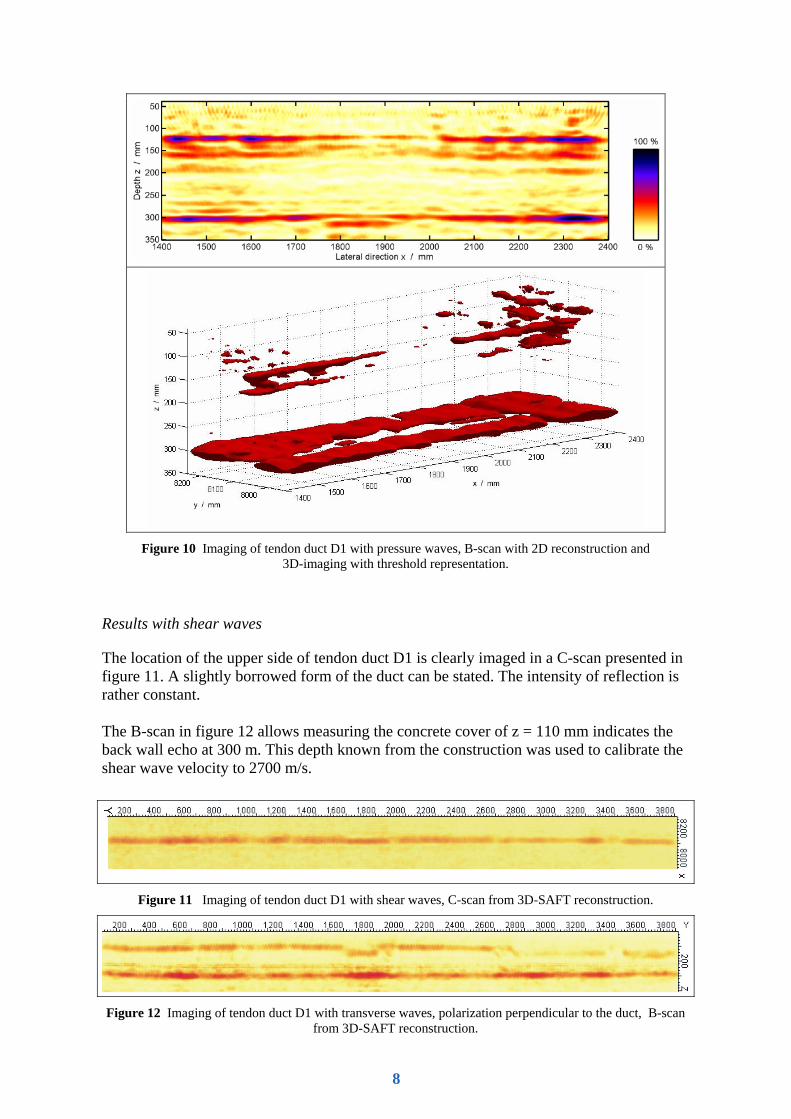
The location of the upper side of tendon duct D1 is clearly imaged in a C-scan presented in figure 11. A slightly borrowed form of the duct can be stated. The intensity of reflection is rather constant. The B-scan in figure 12 allows measuring the concrete cover of z = 110 mm indicates the back wall echo at 300 m. This depth known from the construction was used to calibrate the shear wave velocity to 2700 m/s.
Figure 10 Imaging of tendon duct D1 with pressure waves, B-scan with 2D reconstruction and
3D-imaging with threshold representation.
Figure 11 Imaging of tendon duct D1 with shear waves, C-scan from 3D-SAFT reconstruction.
Figure 12 Imaging of tendon duct D1 with transverse waves, polarization perpendicular to the duct, B-scan from 3D-SAFT reconstruction.
8
Regarding the intended grouting regions in this duct, grouting faults (voids) were planed and verified by radiography from y = 1100 mm to 1400 mm, 2050 mm to 2700 mm and partly grouted from 3600 to 4000 mm. The other areas were intended to be grouted in good quality, additionally the steel wire is only present from y = 1000 mm to the end at 4000 mm. Regarding the criterion that ungrouted regions should lead to a higher reflection intensity of the ultrasonic waves than grouted areas no significant difference can be stated either in the B-scan shown in figure 11 and the B-scan in figure 12.
However, there is another feature indicating a difference between ungrouted and grouted areas. From y = 1700 mm to 1900 mm and y = 2800 mm to 3900 mm the upper part of the duct is not imaged but a reflection at a greater depth (z = 140 mm) appears. The first area corresponds to the indication of less reflection amplitude found with pressure waves (figure 10) and covers only a part of the well-grouted region. The second area corresponds to a well and partly grouted area from x = 2700 mm to the end of the duct.
The deeper indication is probably due to reflection and scattering from the inner part of the duct, because the ultrasonic waves can penetrate the steel sheet of the duct (0,5 mm thick). For this also compare the results described above for specimen FBS 1 and experiments carried out at steelplates placed in concrete described elsewhere [8].
As shown below by EFIT modelling the steel wire centred in the duct causes this reflection. The reflection / backscattering from the interior of the duct cannot be observed all over the planed areas with beeing well grouted. This has further to be investigated and can be caused by unintended air inclusions or voids at the upper side of the duct.
Modelling
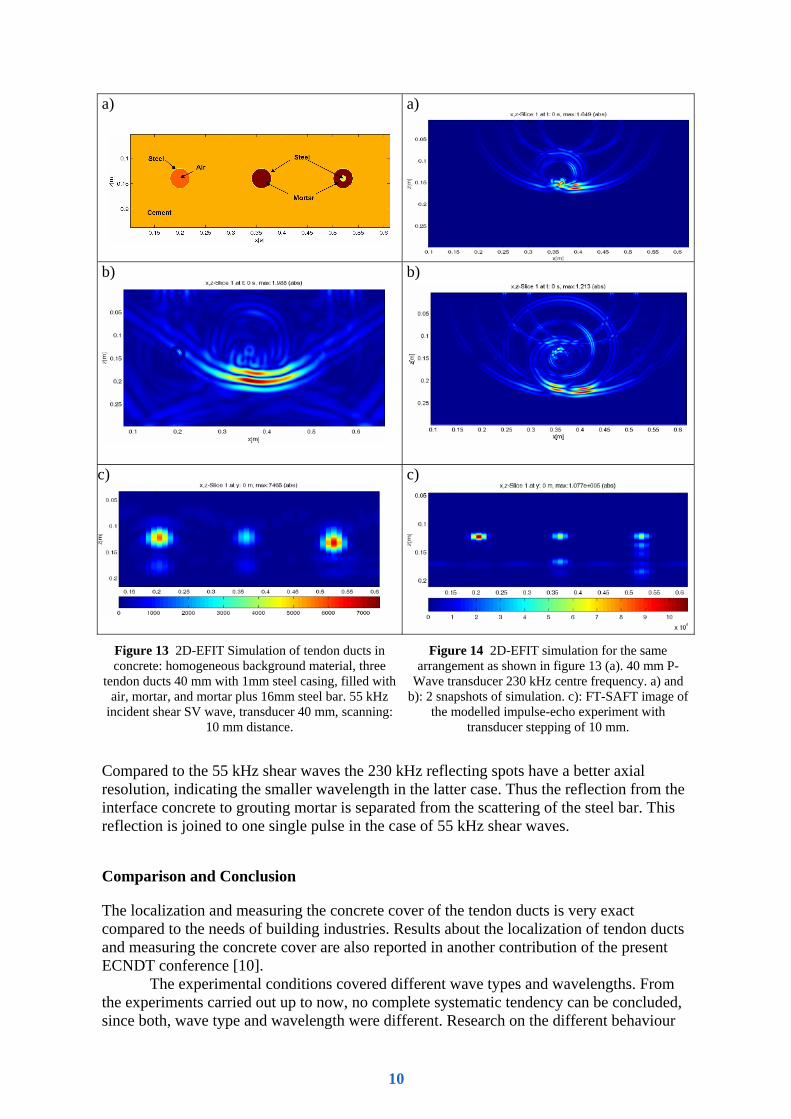
The geometry of the tendon duct D1 was modelled by 2D EFIT (figure 13). Part a) shows the geometry and the three modelled conditions of the duct with a diameter of 40 mm: completely filled with air, completely filled by grouting mortar and grouted with a steel wire in centre position. The snapshot of the shear wave front (figure13 b) shows the complete penetration of the grouted duct without steel wire, as expected from the experiments and modelling [8]. The B-scan from FT-SAFT reconstruction of the simulated data in figure 13 c) shows the different reflecting intensities and depths of the three cases: reflection depth of z = 120 mm for the empty duct and for the grouted duct without steel wire. In the latter the reflection is small because of the similar acoustic properties of concrete and grouting mortar. Finally the reflection depth of z = 130 mm for the steel wire in the grouted duct can be read. For the grouted ducts even a weak reflection intensity at z = 160 mm is visible, corresponding to the bottom depth of the duct.
Figure 14 presents the result of modelling the propagation of pressure waves with the centre frequency used in the experiment (see figure 10). Here also the waves easily penetrate the grouted duct and are reflected at the top of the duct and at the bottom of the duct. In the case of the duct with centred steel wire the reflection at the strand is indicated, but the reflection at the bottom side of the tendon does not appear.
This result of modelling shear wave propagation shows that the experimental results presented in figure 12 can be explained by the fact that the waves penetrate into the duct, when it is well grouted and are backscattered at the steel wire in the centre of the duct.
9
Compared to the 55 kHz shear waves the 230 kHz reflecting spots have a better axial resolution, indicating the smaller wavelength in the latter case. Thus the reflection from the interface concrete to grouting mortar is separated from the scattering of the steel bar. This reflection is joined to one single pulse in the case of 55 kHz shear waves.
Comparison and Conclusion
The localization and measuring the concrete cover of the tendon ducts is very exact compared to the needs of building industries. Results about the localization of tendon ducts and measuring the concrete cover are also reported in another contribution of the present ECNDT conference [10].
The experimental conditions covered different wave types and wavelengths. From the experiments carried out up to now, no complete systematic tendency can be concluded, since both, wave type and wavelength were different. Research on the different behaviour
a)
a)
b)
b)
c)
c)
Figure 13 2D-EFIT Simulation of tendon ducts in concrete: homogeneous background material, three
tendon ducts 40 mm with 1mm steel casing, filled with air, mortar, and mortar plus 16mm steel bar. 55 kHz
incident shear SV wave, transducer 40 mm, scanning: 10 mm distance.
Figure 14 2D-EFIT simulation for the same arrangement as shown in figure 13 (a). 40 mm P-
Wave transducer 230 kHz centre frequency. a) and b): 2 snapshots of simulation. c): FT-SAFT image of
the modelled impulse-echo experiment with transducer stepping of 10 mm.
10
of elastic waves at interfaces in concrete is still in progess. Nevertheless, some trends can carefully be summarized. There are several indications of grouting faults:
The first criterion is the reflection intensity. In the examples described in this comparative study, this criterion is applicable. It seems that it is more sensitive applying pressure waves arround 200 kHz. This is shown in the experiments for the specimen FBS 1 and tendon D1 (diameter 40 mm) and follows from modelling calculations. It can be assumed that the difference is mainly caused by the smaller wavelength than by the wave type.
Well grouted areas are indicated by a low reflection intensity. This means that the ultrasonic waves have passed the interface between concrete, tendon sheet and grouting mortar. This leads to the second criterion for indicating grouting faults:
Both, pressure and shear waves can be used for the investigation of the interior of tendon ducts, since they penetrate thin metal sheets as used for the tendon ducts. This is deduced from the experiments at the specimen FBS 1 for both, shear and pressure waves shown in figures 6 and 8 as well as the corresponding EFIT modelling shown in figures 9, 13 and 14. Elastic waves easily penetrate through thin steel sheets and they can be used to image details behind. This is described more detailed in [8].
The reflections from the inner structure of the tendon ducts and/or the backside reflection from the duct are rather different for the two applied wave types and frequency ranges. Other wave types (e.g. creeping waves) and mode conversion have to be taken into account.
Up to now there is no way to give an absolute indication for grouting defects. The interpretation of the data is only feasible in comparison to neighboured areas. In the tendon ducts realised in the large concrete slab several grouting faults clearly indicated by γ-radiography are not indicated by the ultrasonic imaging method. Possible reasons for that can be unintended air inclusions at the top of the tendon ducts and shrinking of grouting mortar. Such small air layers are not visible by γ-radiography.
An open question for the practical application of the methods is that the indications for grouting faults are not yet reliable enough. Practical applications show that the described effects like the change in reflection intensity, bottom side reflection from the tendon duct in case of good grouting etc. appear, but not systematically [11, 12]. It seems that other effects, which are not yet completely understood, overlay the indications. The diversity of the tendon systems and ways of realising a structure play an important role here (eg. diameter range of tendon ducts; quantity, diameter and arrangement of strands; diameters and arrangement of rebars). Research and development has to be continued here. One point is the promising approach of considering the phase information in the SAFT reconstruction in order to distinguish between steel and air reflection [13].
Acknowledgement
The support of this study by the Deutsche Forschungsgemeinschaft (german Science Foundation) via grant number FOR 384 in the frame of the Forschergruppe (research initiative) “Non-destructive evaluation of concrete structures using acoustic and electro-magnetic echo-methods” is gratefully acknowledged. Please refer to the websites of this project at http://www.for384.uni-stuttgart.de/ for additional information.
Dywidag Systems International grouted the ducts (DSI, Dipl.-Ing. H. Iven). BAM VIII.3 (B. Redmer and colaborators) verified the location of the voids in the ducts using γ-radiography. All support is gratefully acknowledged.
11
References
[1] Krause, M., Mielentz, F., Milmann, B., Streicher, D., Müller, W.: Ultrasonic imaging of concrete elements: State of the art using 2D synthetic aperture. In: DGZfP (Ed.); International Symposium Non-Destructive Testing in Civil Engineering (NDT-CE) in Berlin, Germany, September 16-19, 2003, Proceedings on BB 85-CD, V51, Berlin (2003)
[2] Taffe, A., Borchardt, K., Wiggenhauser, H.: Specimen for the improvement of NDT-methods - Design and construction of a Large Concrete Slab for NDT methods at BAM. In: DGZfP (Ed.); International Symposium Non-Destructive Testing in Civil Engineering (NDT-CE) in Berlin, Germany, September 16-19, 2003, Proceedings on BB 85-CD, P11, Berlin (2003)
[3] Maierhofer, Ch., Krause, M., Mielentz, F., Streicher, D., Milmann, B., Gardei, A., Kohl, Ch. and H. Wiggenhauser: Complementary application of radar, impact-echo and ultrasonics for testing concrete structures and metallic tendon ducts. In: Proceedings of 83rd Annual Meeting Transportation Research Board of the National Academies, 11.-15. January 2004, Washington, D.C., USA, Paper 04-2651 on CDROM
[4] Shevaldykin, V., Samokrutov, A. and V. Kozlov: Ultrasonic Low-Frequency Short-Pulse Transducers with Dry Point Contact. Development and Application. In: DGZfP (Ed.); International Symposium Non-Destructive Testing in Civil Engineering (NDT-CE) in Berlin, Germany, September 16-19, 2003, Proceedings on BB 85-CD, V66, Berlin (2003)
[5] Marklein, R.: The Finite Integration Technique as a general tool to compute acoustic, electromagnetic, elastodynamic and coupled wave fields. In: Review of Radio Science 1999-2002. Ed.: W.R. Stone. IEEE Press, Piscataway 2002
[6] Wiggenhauser, H.: Duct inspection using scanning impact-echo. In: DGZfP (Ed.); International Symposium Non-Destructive Testing in Civil Engineering (NDT-CE) in Berlin, Germany, September 16-19, 2003, Proceedings on BB 85-CD, V101, Berlin (2003)
[7] Schickert, M., Krause, M. and W. Müller: Ultrasonic Imaging of Concrete Elements Using Reconstruction by Synthetic Aperture Focusing Technique. Journal of Materials in Civil Engineering (JMCE), ASCE Vol. 15 (2003) 3, pp. 235-246
[8] Krause, M., Mielentz, F., Milmann, B., Streicher, D. and K. Mayer: Ultrasonic reflection properties at interfaces between concrete, steel and air: imaging and modelling. In: Proceedings of the 2006 NDE Conference on Civil Engineering, 14.-18. August 2006, St. Louis, MO, USA
[9] Schickert, M., Schnapp, J. D., Kroggel, O. und R. Jansohn: Ultraschallprüfung von Beton: Verbesserte Objekterkennung durch stochastische Methoden. In: DGZfP-Jahrestagung 2001 in Berlin, 21.–23.5.2001. Berlin: Deutsche Gesellschaft für Zerstörungsfreie Prüfung (DGZfP), 2001, CD-ROM, V44
[10] Beutel, R., Reinhardt, H.-W., Grosse, Ch., Glaubitt, A., Krause, M., Maierhofer, Ch., Algernon, D. and M. Schickert: Performance demonstration of non-destructive testing methods. In: DGZfP (Ed.); Proceedings of the 9th European Conference of Non-Destructive Testing (ECNDT) in Berlin, Germany, September 25-29, 2003, Proceedings on CD-ROM
[11] Streicher, D., Kohl, Ch., Wiggenhauser, H. und A. Taffe: Automatisierte zerstörungsfreie Zustandsuntersuchungen von Brückenbauwerken , Beton- und Stahlbeton 101 (2006) 5, S. 330-342
[12] Streicher, D., Algernon, D., Wöstmann, J., Behrens, M. and H. Wiggenhauser: Automated NDE of Post-Tensioned Concrete Bridges using Radar, Impact-Echo and Ultrasonic Echo. In: DGZfP (Ed.); Proceedings of the 9th European Conference of Non-Destructive Testing (ECNDT) in Berlin, Germany, September 25-29, 2003, Proceedings on CD-ROM
[13] Mayer, K., Langenberg, K.-J., Krause, M., Maierhofer, Ch., Milmann, B. and Ch. Kohl: Characterization of ultrasonic and radar reflector types in concrete by phase evaluation of the signal and the reconstructed image. In: DGZfP (Ed.); Proceedings of the 9th European Conference of Non-Destructive Testing (ECNDT) in Berlin, Germany, September 25-29, 2003, Proceedings on CD-ROM