Final Report Investigation of the Ability of Filters to Stop Erosion through Cracks in Dams Subcontract Number: DEN33411 Performance Period: January 1, 2001 to December 31, 2003 Prepared by Youngjin Park Thomas L. Brandon J. Michael Duncan Department of Civil and Environmental Engineering 200 Patton Hall Virginia Tech Blacksburg, VA 24061
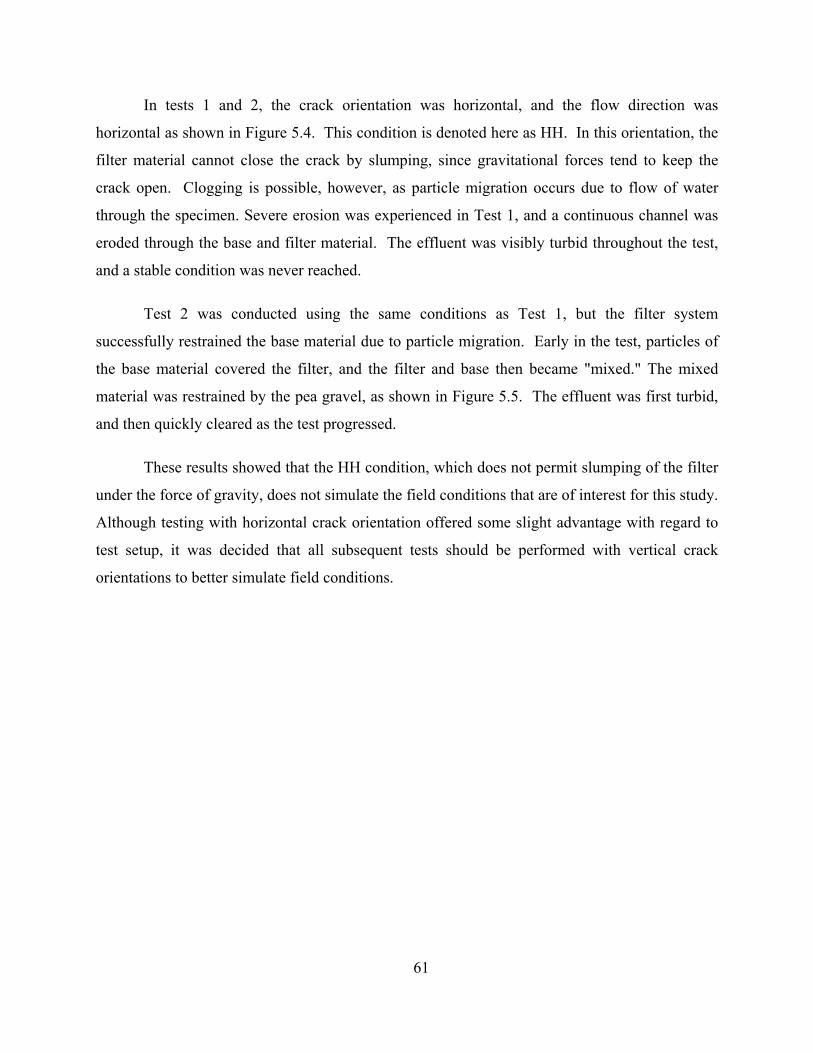
Transcript
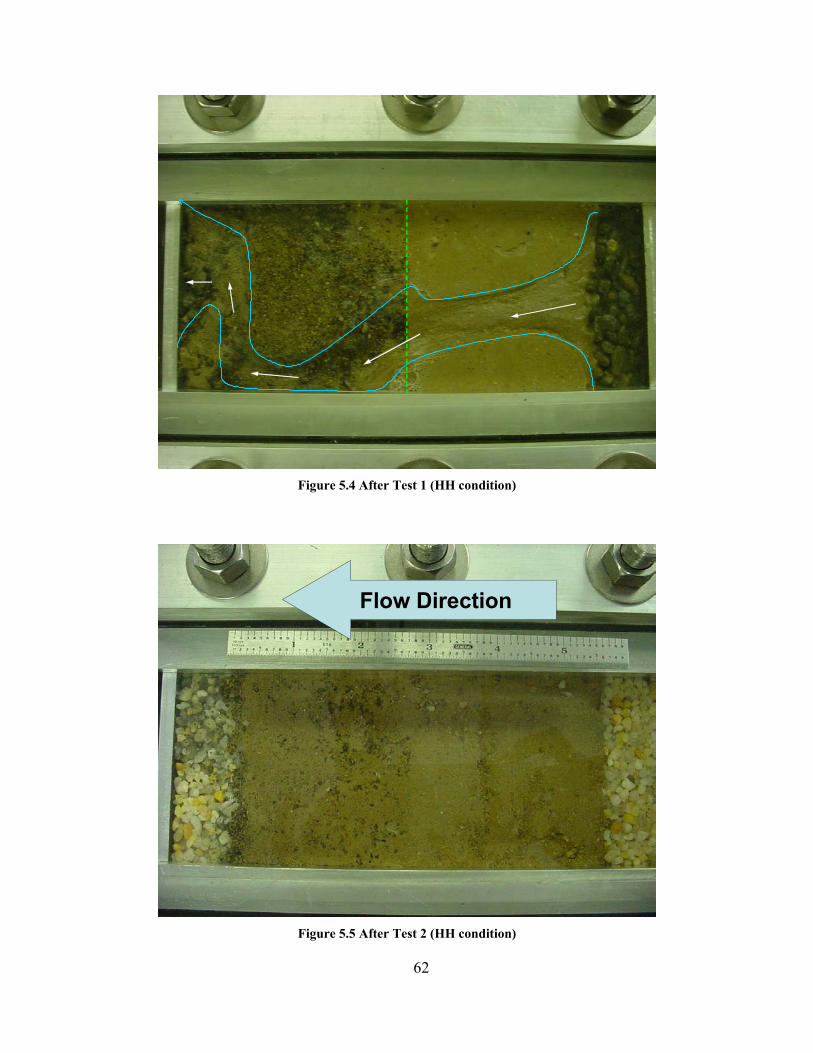
Final Report
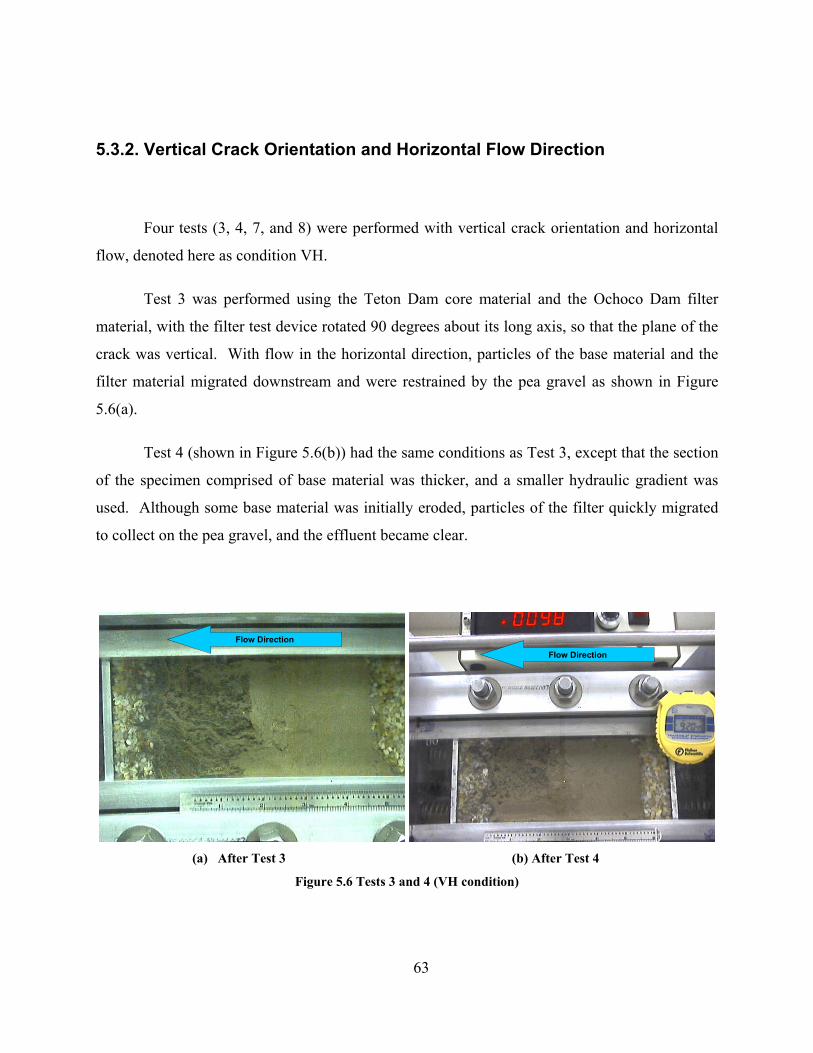
Investigation of the Ability of Filters to Stop Erosion through Cracks in Dams
Subcontract Number: DEN33411
Performance Period: January 1, 2001 to December 31, 2003
Prepared by
Youngjin Park Thomas L. Brandon J. Michael Duncan
Department of Civil and Environmental Engineering 200 Patton Hall Virginia Tech Blacksburg, VA 24061
1
Chapter 1. Introduction
1.1. Background
Since Terzaghi (1922) developed grain size criteria for granular soils in dam filters,
many researchers have studied embankment dam filters. The major function of the filter is
to prevent erosion and piping. In order to have this ability, filters must restrain the particles
of the protected soil (the base soil) and allow water to pass freely out of the base soil.
Sherard et al. (1984) modified these criteria for cohesive soils, and developed the concept
of “critical filters,” that can prevent erosion even under the severe condition where the base
soil is cracked, and where concentrated flow occurs through the crack.
In addition to grain size criteria that ensure restraint of the base soil while allowing
free passage of water, a filter must also be graded so that the filter itself will not crack. To
ensure that filters will not support cracks, most current filter gradation criteria require that
no more than 5% of the filter material should be finer than the #200 sieve, and that the fines
within the filter should be non-plastic. However, it is not clear that this criterion is
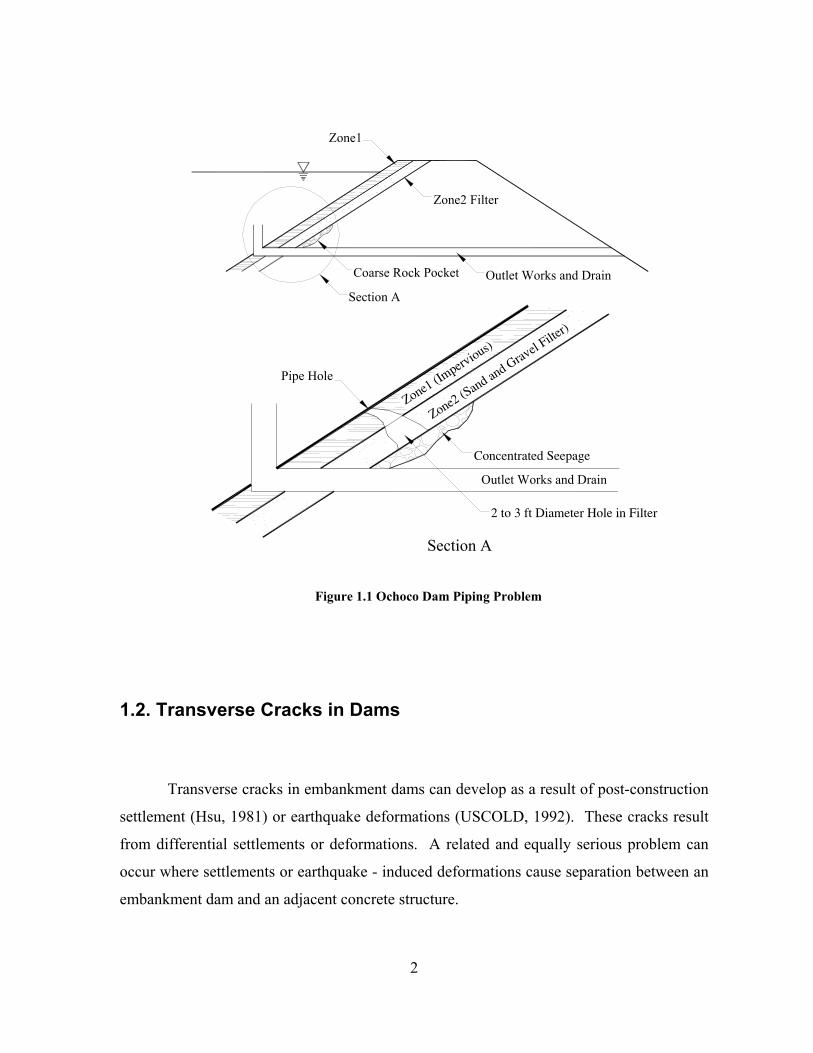
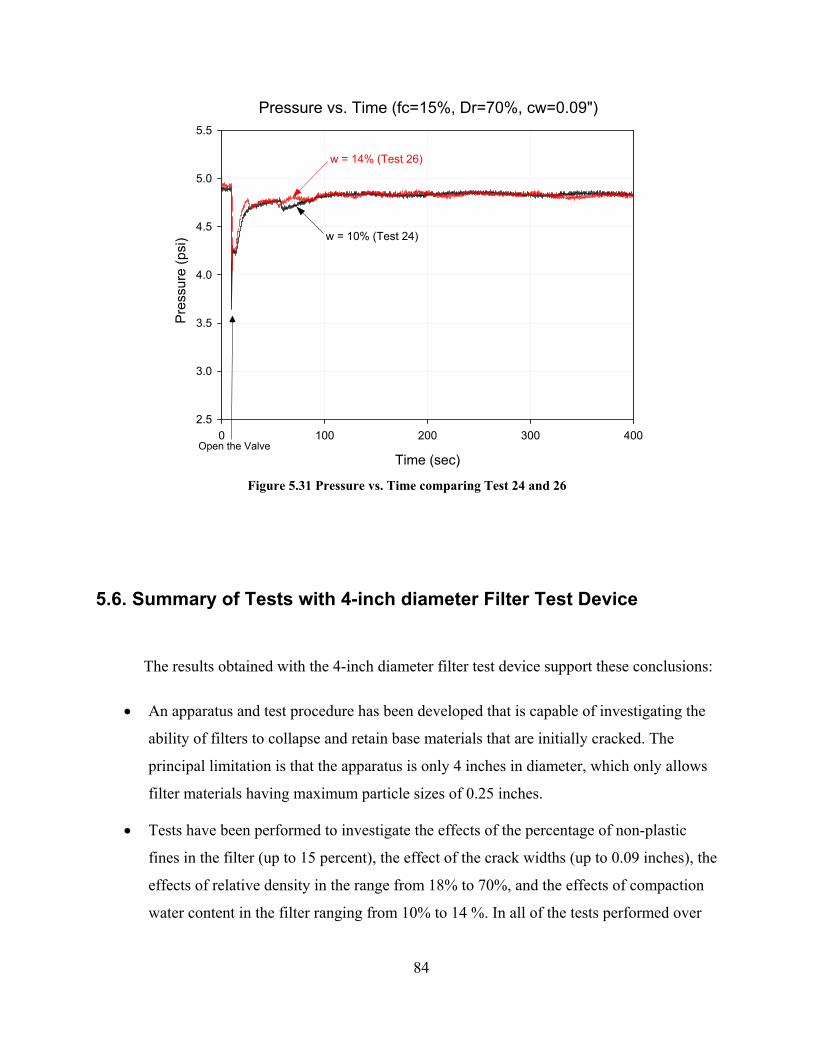
sufficient. At Ochoco Dam shown in Figure 1.1, a sinkhole developed in a filter that was
designed to have a maximum of 3% passing the #200 sieve. This incident at Ochoco Dam
gave rise to renewed interest in filter criteria, and resulted in sponsorship of the research
described in this dissertation. This research was designed to investigate the crack-
preventing and crack-stopping abilities of filters, and to develop criteria that can be relied
upon to ensure that a filter will perform its essential function even when subjected to
deformations that cause cracks in the adjacent core.
2
Zone1
Zone2 Filter
Outlet Works and DrainCoarse Rock Pocket
Section A
Pipe Hole
Zone1 (Imperv
ious)
Zone2 (Sand an
d Gravel F
ilter)
Outlet Works and Drain
2 to 3 ft Diameter Hole in Filter
Concentrated Seepage
Section A
Figure 1.1 Ochoco Dam Piping Problem
1.2. Transverse Cracks in Dams
Transverse cracks in embankment dams can develop as a result of post-construction
settlement (Hsu, 1981) or earthquake deformations (USCOLD, 1992). These cracks result
from differential settlements or deformations. A related and equally serious problem can
occur where settlements or earthquake - induced deformations cause separation between an
embankment dam and an adjacent concrete structure.
3
Hsu (1981) reported that piping through settlement−induced transverse cracks has
occurred in Apishapa Dam (1923), Stockton Dam (1950), Cougar Dam (1963), Round
Butte Dam (1964), Yard's Creek Dam (1963), Matahina Dam (1966), and Viddalsvatn Dam
(1971). In Yard's Creek Dam, Matahina Dam, and Viddalsvatn Dam, the cracks extended
through the filters as well as the core, because the filters contained excessive amounts of
fines (Hsu, 1981).
USCOLD (1992) reported two instances of transverse cracks in dams resulting from
earthquake deformations. Matahina Dam (New Zealand) suffered settlements and cracking
as a result of the Magnitude 6.3 Edgecumbe Earthquake on May 2, 1987. Trenching
showed that the cracks were shallow, and that they did not extend across the core. The
trenching exposed a large cavity which was thought to be related to earlier core cracking,
seepage and internal erosion. The rate of seepage through the dam increased as a result of
the earthquake. Austrian Dam (California) suffered deformations and cracking as a result
of the Magnitude 7.1 Loma Prieta Earthquake on October 17, 1989. A transverse crack was
traced 30 ft down the left abutment, and transverse cracking and separation of the
embankment from the spillway occurred to a depth of 23 ft on the right abutment. Water
levels in the embankment, measured in open well piezometers, increased as a result of the
earthquake.
1.3. Filters and Crack-Stoppers
It is commonly assumed that filters downstream of the cores in dams will prevent
erosion and piping through transverse cracks in dams (Sherard and Dunnigan, 1989). This
assumption is based on the concept that the filter will be cohesionless, and that it will not
support a crack. However, as shown by observations at Yard's Creek, Matahina, and
Viddalsvatn Dams, this is not always the case.
The ability of a filter to provide a reliable line of defense against erosion and piping
depends on the cohesionless nature of the filter material, and its own inability to support a
4
crack. The same is true of upstream crack-stoppers − zones of sand upstream from the core,
designed to wash into and fill cracks. If they crack and do not wash into the crack in the
core, they will not perform their intended function.
1.4. Objectives of the Research
This research to investigate the ability of filters to stop cracks has four principal
elements:
• A review of the literature concerned with filters, and particularly the crack-stopping
ability of filters.
• Development of a laboratory filter test device for testing composite specimens with
cracks formed through both the filter and the base coarse material.
• Development of procedures for processing base and filter materials, in order to have
precise control over their grain-size distribution.
• Performing tests on composite specimen to explore (1) the effect of the compaction
water content, (2) the effects of the density to which the filter material is compacted,
(3) the effect of the width of the crack that extends through the base and filter material,
and (4) the effects of the percentage of fines in the filter material.
5
Chapter 2. Literature Review
2.1. Introduction
In this chapter, previous laboratory research, theoretical studies, and discussions are
summarized and reviewed. Table 2.1 shows summary of references that are related with this
research. The most significant finding from these previous studies are described in Section
2.2.1 - 2.2.12.
2.2. Significant finding from previous studies
2.2.1. Sherard (1979)
In several cases, sinkholes have formed in dams as a result of piping of well-graded
core soils. These broadly-graded cores were glacial in origin with nearly linear gradations.
The filtration of the silt-sized fraction is critical when these soils are used for dam cores.
The filter should be fine sand to medium fine sand. In order to assess the stability of the
broadly graded soils, Sherard suggests splitting the gradation curve at the 1.0 mm particle
size and analyzing it as two separate gradations.
6
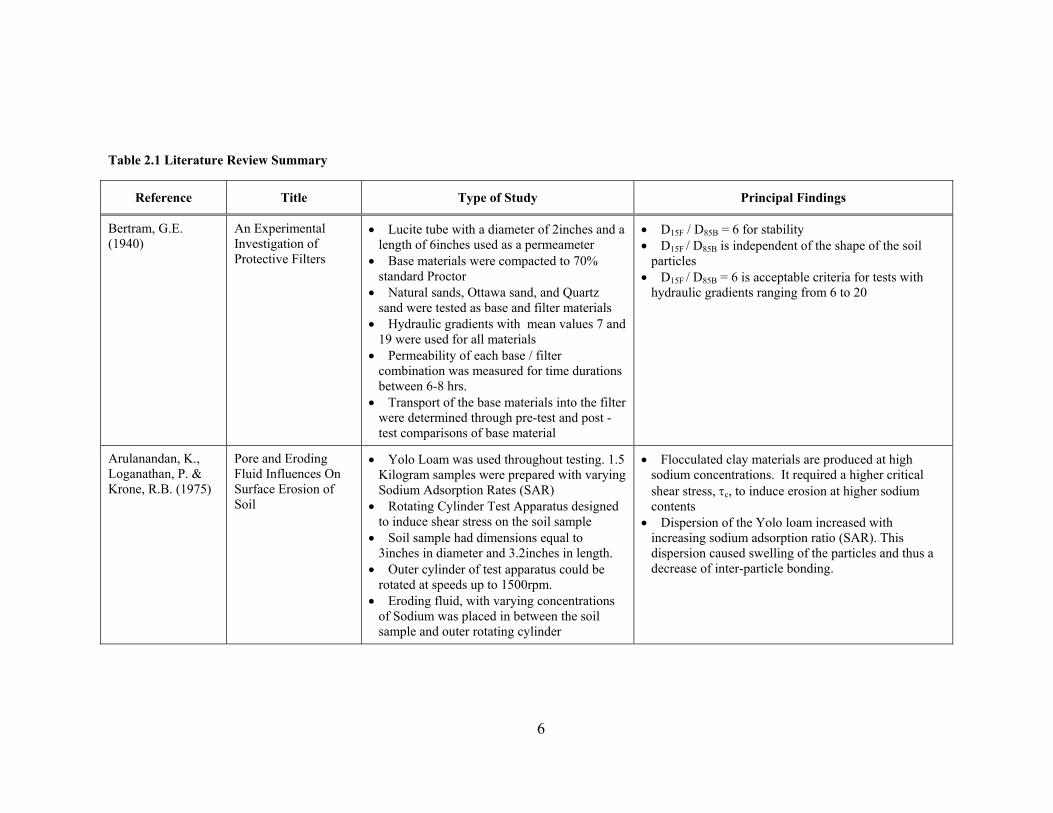
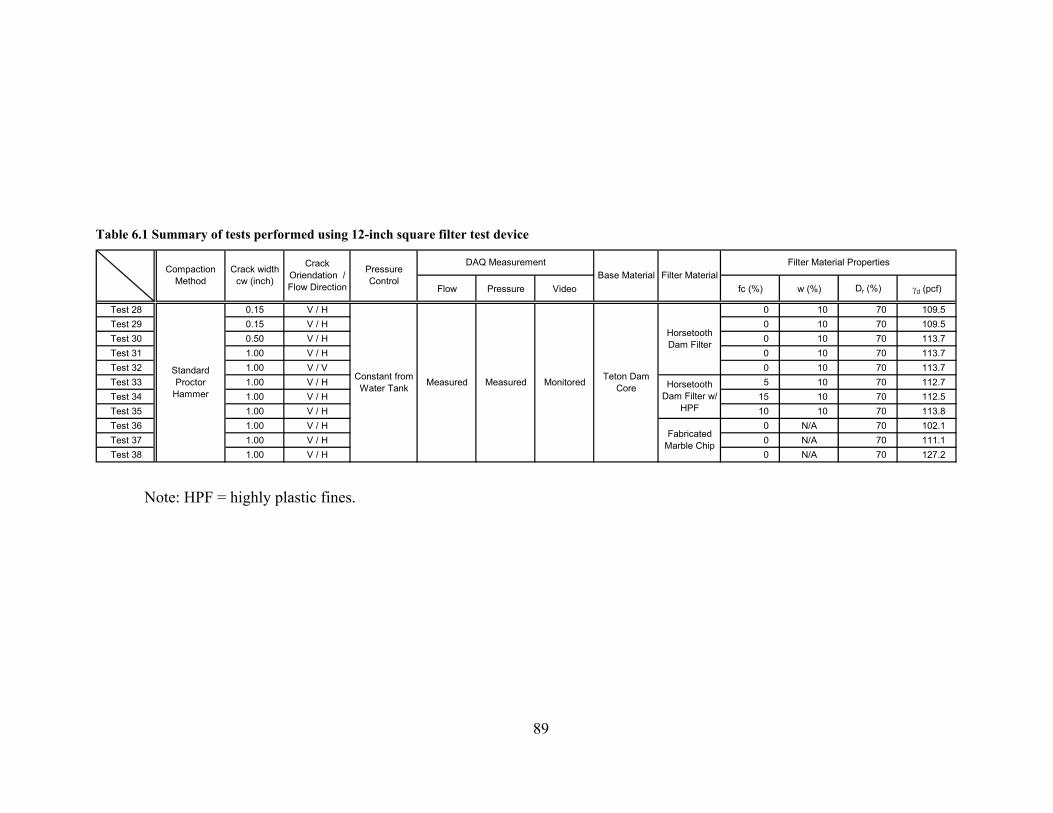
Table 2.1 Literature Review Summary (cont.)
Reference Title Type of Study Principal Findings
Bertram, G.E. (1940)
An Experimental Investigation of Protective Filters
• Lucite tube with a diameter of 2inches and a length of 6inches used as a permeameter
• Base materials were compacted to 70% standard Proctor
• Natural sands, Ottawa sand, and Quartz sand were tested as base and filter materials
• Hydraulic gradients with mean values 7 and 19 were used for all materials
• Permeability of each base / filter combination was measured for time durations between 6-8 hrs.
• Transport of the base materials into the filter were determined through pre-test and post -test comparisons of base material
• D15F / D85B = 6 for stability • D15F / D85B is independent of the shape of the soil
particles • D15F / D85B = 6 is acceptable criteria for tests with
hydraulic gradients ranging from 6 to 20
Arulanandan, K., Loganathan, P. & Krone, R.B. (1975)
Pore and Eroding Fluid Influences On Surface Erosion of Soil
• Yolo Loam was used throughout testing. 1.5 Kilogram samples were prepared with varying Sodium Adsorption Rates (SAR)
• Rotating Cylinder Test Apparatus designed to induce shear stress on the soil sample
• Soil sample had dimensions equal to 3inches in diameter and 3.2inches in length.
• Outer cylinder of test apparatus could be rotated at speeds up to 1500rpm.
• Eroding fluid, with varying concentrations of Sodium was placed in between the soil sample and outer rotating cylinder
• Flocculated clay materials are produced at high sodium concentrations. It required a higher critical shear stress, τc, to induce erosion at higher sodium contents
• Dispersion of the Yolo loam increased with increasing sodium adsorption ratio (SAR). This dispersion caused swelling of the particles and thus a decrease of inter-particle bonding.
7
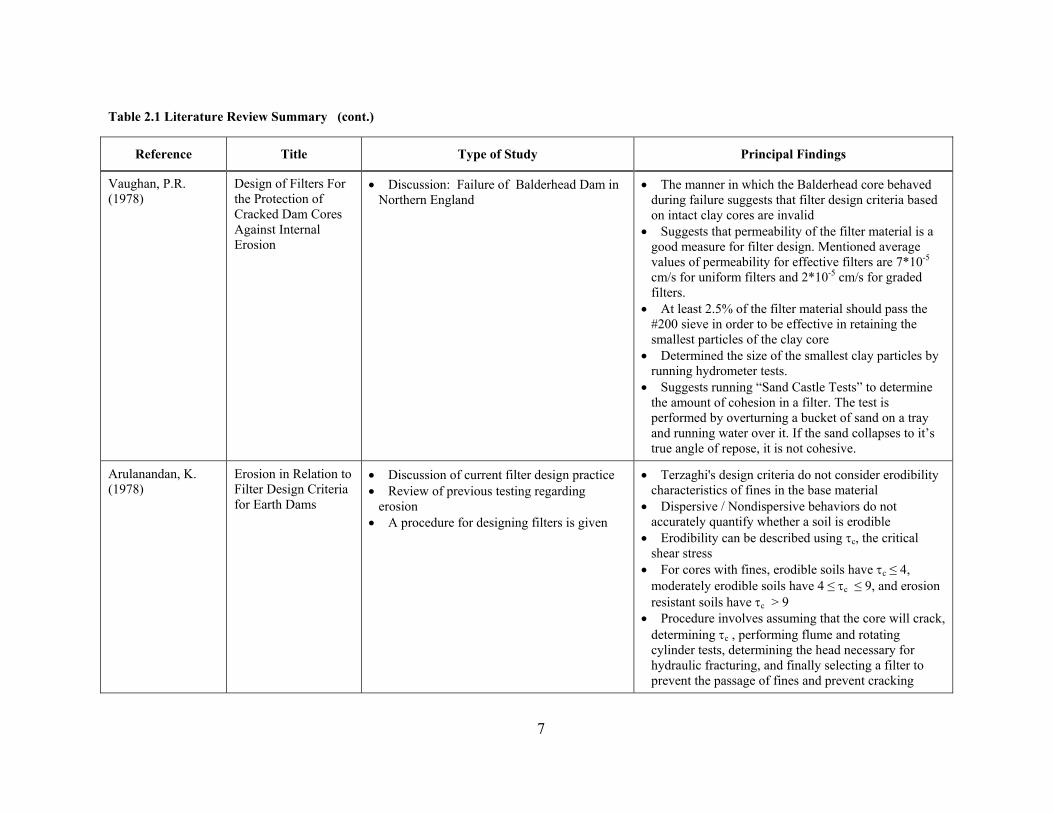
Table 2.1 Literature Review Summary (cont.)
Reference Title Type of Study Principal Findings
Vaughan, P.R. (1978)
Design of Filters For the Protection of Cracked Dam Cores Against Internal Erosion
• Discussion: Failure of Balderhead Dam in Northern England
• The manner in which the Balderhead core behaved during failure suggests that filter design criteria based on intact clay cores are invalid
• Suggests that permeability of the filter material is a good measure for filter design. Mentioned average values of permeability for effective filters are 7*10-5 cm/s for uniform filters and 2*10-5 cm/s for graded filters.
• At least 2.5% of the filter material should pass the #200 sieve in order to be effective in retaining the smallest particles of the clay core
• Determined the size of the smallest clay particles by running hydrometer tests.
• Suggests running “Sand Castle Tests” to determine the amount of cohesion in a filter. The test is performed by overturning a bucket of sand on a tray and running water over it. If the sand collapses to it’s true angle of repose, it is not cohesive.
Arulanandan, K. (1978)
Erosion in Relation to Filter Design Criteria for Earth Dams
• Discussion of current filter design practice • Review of previous testing regarding
erosion • A procedure for designing filters is given
• Terzaghi's design criteria do not consider erodibility characteristics of fines in the base material
• Dispersive / Nondispersive behaviors do not accurately quantify whether a soil is erodible
• Erodibility can be described using τc, the critical shear stress
• For cores with fines, erodible soils have τc ≤ 4, moderately erodible soils have 4 ≤ τc ≤ 9, and erosion resistant soils have τc > 9
• Procedure involves assuming that the core will crack, determining τc , performing flume and rotating cylinder tests, determining the head necessary for hydraulic fracturing, and finally selecting a filter to prevent the passage of fines and prevent cracking
8
Table 2.1 Literature Review Summary (cont.)
Reference Title Type of Study Principal Findings
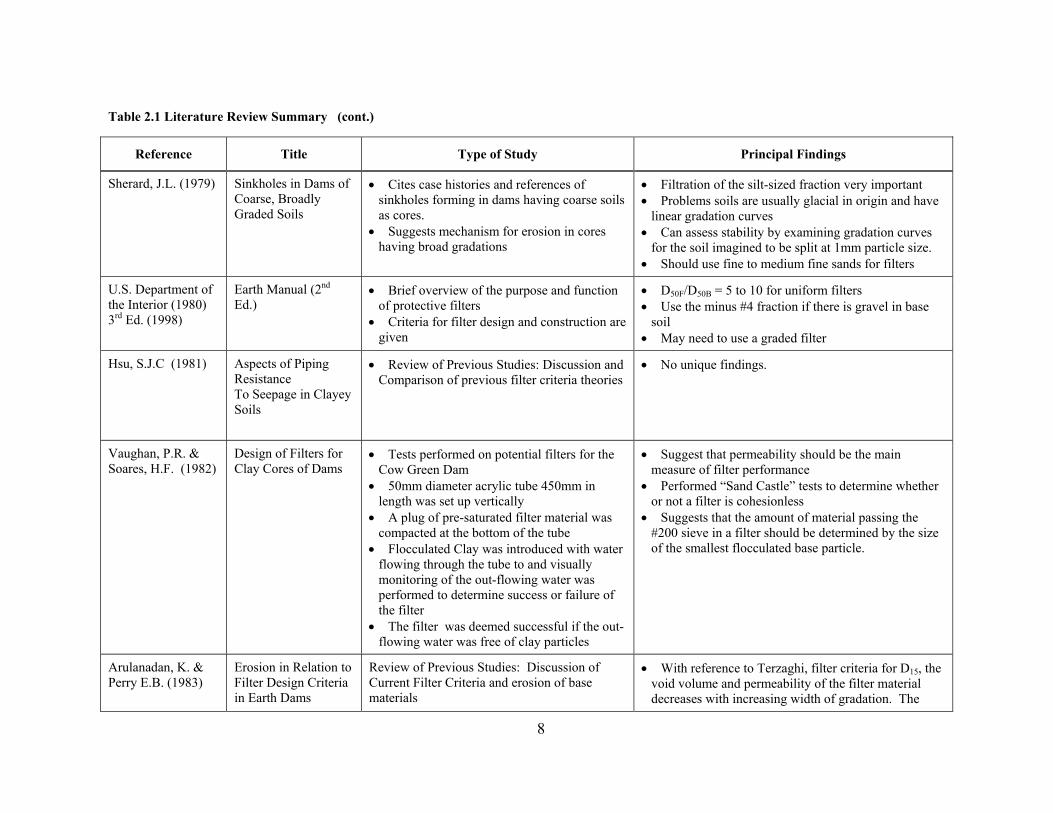
Sherard, J.L. (1979) Sinkholes in Dams of Coarse, Broadly Graded Soils
• Cites case histories and references of sinkholes forming in dams having coarse soils as cores.
• Suggests mechanism for erosion in cores having broad gradations
• Filtration of the silt-sized fraction very important • Problems soils are usually glacial in origin and have
linear gradation curves • Can assess stability by examining gradation curves
for the soil imagined to be split at 1mm particle size. • Should use fine to medium fine sands for filters
U.S. Department of the Interior (1980) 3rd Ed. (1998)
Earth Manual (2nd Ed.)
• Brief overview of the purpose and function of protective filters
• Criteria for filter design and construction are given
• D50F/D50B = 5 to 10 for uniform filters • Use the minus #4 fraction if there is gravel in base
soil • May need to use a graded filter
Hsu, S.J.C (1981) Aspects of Piping Resistance To Seepage in Clayey Soils
• Review of Previous Studies: Discussion and Comparison of previous filter criteria theories
• No unique findings.
Vaughan, P.R. & Soares, H.F. (1982)
Design of Filters for Clay Cores of Dams
• Tests performed on potential filters for the Cow Green Dam
• 50mm diameter acrylic tube 450mm in length was set up vertically
• A plug of pre-saturated filter material was compacted at the bottom of the tube
• Flocculated Clay was introduced with water flowing through the tube to and visually monitoring of the out-flowing water was performed to determine success or failure of the filter
• The filter was deemed successful if the out-flowing water was free of clay particles
• Suggest that permeability should be the main measure of filter performance
• Performed “Sand Castle” tests to determine whether or not a filter is cohesionless
• Suggests that the amount of material passing the #200 sieve in a filter should be determined by the size of the smallest flocculated base particle.
Arulanadan, K. & Perry E.B. (1983)
Erosion in Relation to Filter Design Criteria in Earth Dams
Review of Previous Studies: Discussion of Current Filter Criteria and erosion of base materials
• With reference to Terzaghi, filter criteria for D15, the void volume and permeability of the filter material decreases with increasing width of gradation. The
9
Table 2.1 Literature Review Summary (cont.)
Reference Title Type of Study Principal Findings
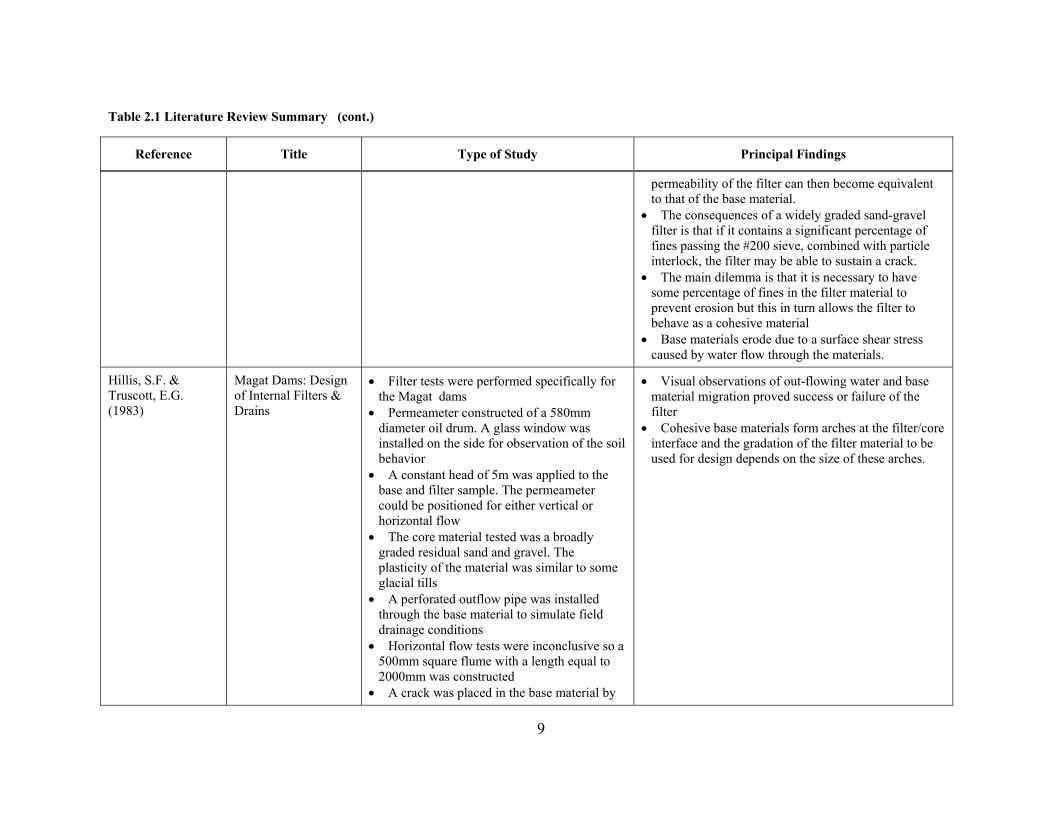
permeability of the filter can then become equivalent to that of the base material.
• The consequences of a widely graded sand-gravel filter is that if it contains a significant percentage of fines passing the #200 sieve, combined with particle interlock, the filter may be able to sustain a crack.
• The main dilemma is that it is necessary to have some percentage of fines in the filter material to prevent erosion but this in turn allows the filter to behave as a cohesive material
• Base materials erode due to a surface shear stress caused by water flow through the materials.
Hillis, S.F. & Truscott, E.G. (1983)
Magat Dams: Design of Internal Filters & Drains
• Filter tests were performed specifically for the Magat dams
• Permeameter constructed of a 580mm diameter oil drum. A glass window was installed on the side for observation of the soil behavior
• A constant head of 5m was applied to the base and filter sample. The permeameter could be positioned for either vertical or horizontal flow
• The core material tested was a broadly graded residual sand and gravel. The plasticity of the material was similar to some glacial tills
• A perforated outflow pipe was installed through the base material to simulate field drainage conditions
• Horizontal flow tests were inconclusive so a 500mm square flume with a length equal to 2000mm was constructed
• A crack was placed in the base material by
• Visual observations of out-flowing water and base material migration proved success or failure of the filter
• Cohesive base materials form arches at the filter/core interface and the gradation of the filter material to be used for design depends on the size of these arches.
10
Table 2.1 Literature Review Summary (cont.)
Reference Title Type of Study Principal Findings
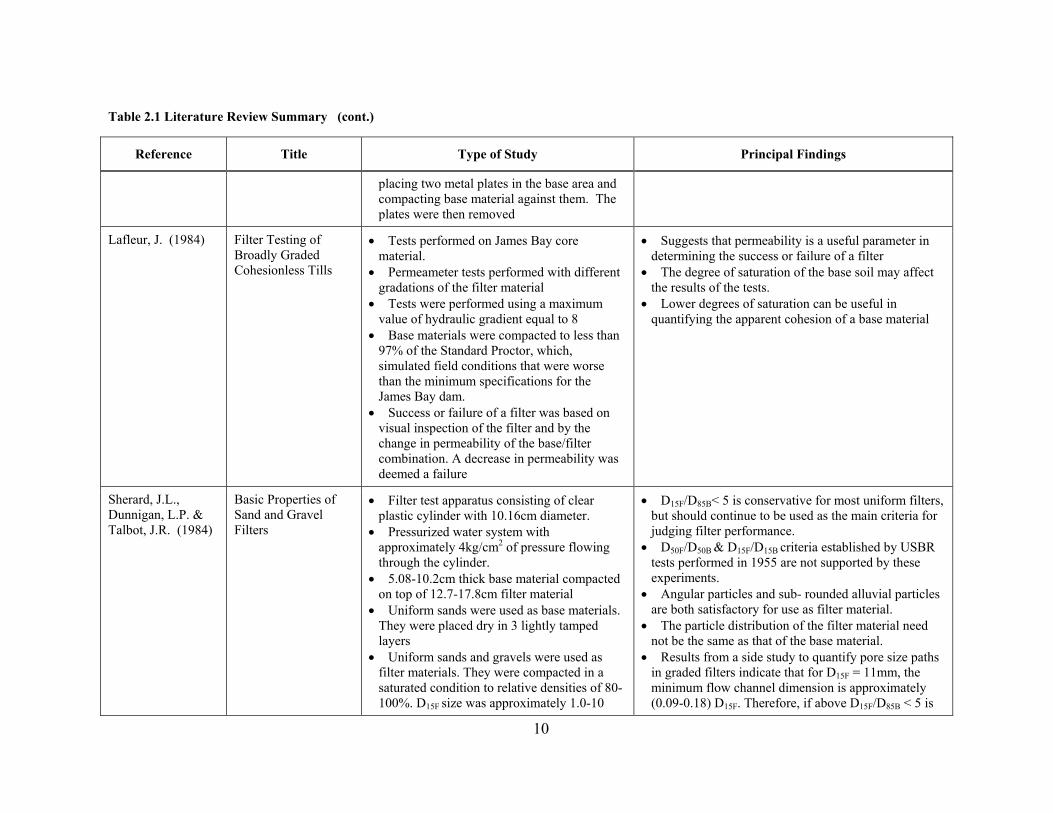
placing two metal plates in the base area and compacting base material against them. The plates were then removed
Lafleur, J. (1984) Filter Testing of Broadly Graded Cohesionless Tills
• Tests performed on James Bay core material.
• Permeameter tests performed with different gradations of the filter material
• Tests were performed using a maximum value of hydraulic gradient equal to 8
• Base materials were compacted to less than 97% of the Standard Proctor, which, simulated field conditions that were worse than the minimum specifications for the James Bay dam.
• Success or failure of a filter was based on visual inspection of the filter and by the change in permeability of the base/filter combination. A decrease in permeability was deemed a failure
• Suggests that permeability is a useful parameter in determining the success or failure of a filter
• The degree of saturation of the base soil may affect the results of the tests.
• Lower degrees of saturation can be useful in quantifying the apparent cohesion of a base material
• Filter test apparatus consisting of clear plastic cylinder with 10.16cm diameter.
• Pressurized water system with approximately 4kg/cm2 of pressure flowing through the cylinder.
• 5.08-10.2cm thick base material compacted on top of 12.7-17.8cm filter material
• Uniform sands were used as base materials. They were placed dry in 3 lightly tamped layers
• Uniform sands and gravels were used as filter materials. They were compacted in a saturated condition to relative densities of 80-100%. D15F
size was approximately 1.0-10
• D15F/D85B< 5 is conservative for most uniform filters, but should continue to be used as the main criteria for judging filter performance.
• D50F/D50B & D15F/D15B criteria established by USBR tests performed in 1955 are not supported by these experiments.
• Angular particles and sub- rounded alluvial particles are both satisfactory for use as filter material.
• The particle distribution of the filter material need not be the same as that of the base material.
• Results from a side study to quantify pore size paths in graded filters indicate that for D15F = 11mm, the minimum flow channel dimension is approximately (0.09-0.18) D15F. Therefore, if above D15F/D85B < 5 is
11
Table 2.1 Literature Review Summary (cont.)
Reference Title Type of Study Principal Findings
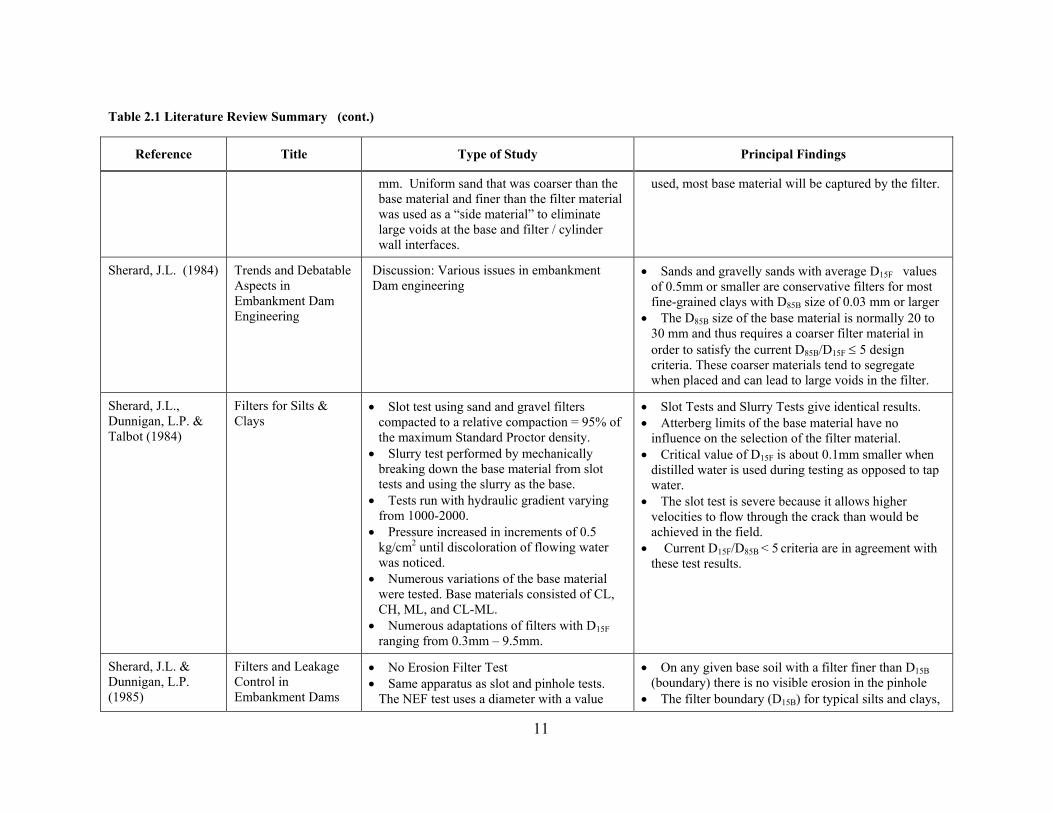
mm. Uniform sand that was coarser than the base material and finer than the filter material was used as a “side material” to eliminate large voids at the base and filter / cylinder wall interfaces.
used, most base material will be captured by the filter.
Sherard, J.L. (1984) Trends and Debatable Aspects in Embankment Dam Engineering
Discussion: Various issues in embankment Dam engineering
• Sands and gravelly sands with average D15F values of 0.5mm or smaller are conservative filters for most fine-grained clays with D85B size of 0.03 mm or larger
• The D85B size of the base material is normally 20 to 30 mm and thus requires a coarser filter material in order to satisfy the current D85B/D15F ≤ 5 design criteria. These coarser materials tend to segregate when placed and can lead to large voids in the filter.
Sherard, J.L., Dunnigan, L.P. & Talbot (1984)
Filters for Silts & Clays
• Slot test using sand and gravel filters compacted to a relative compaction = 95% of the maximum Standard Proctor density.
• Slurry test performed by mechanically breaking down the base material from slot tests and using the slurry as the base.
• Tests run with hydraulic gradient varying from 1000-2000.
• Pressure increased in increments of 0.5 kg/cm2 until discoloration of flowing water was noticed.
• Numerous variations of the base material were tested. Base materials consisted of CL, CH, ML, and CL-ML.
• Numerous adaptations of filters with D15F ranging from 0.3mm – 9.5mm.
• Slot Tests and Slurry Tests give identical results. • Atterberg limits of the base material have no
influence on the selection of the filter material. • Critical value of D15F is about 0.1mm smaller when
distilled water is used during testing as opposed to tap water.
• The slot test is severe because it allows higher velocities to flow through the crack than would be achieved in the field.
• Current D15F/D85B < 5 criteria are in agreement with these test results.
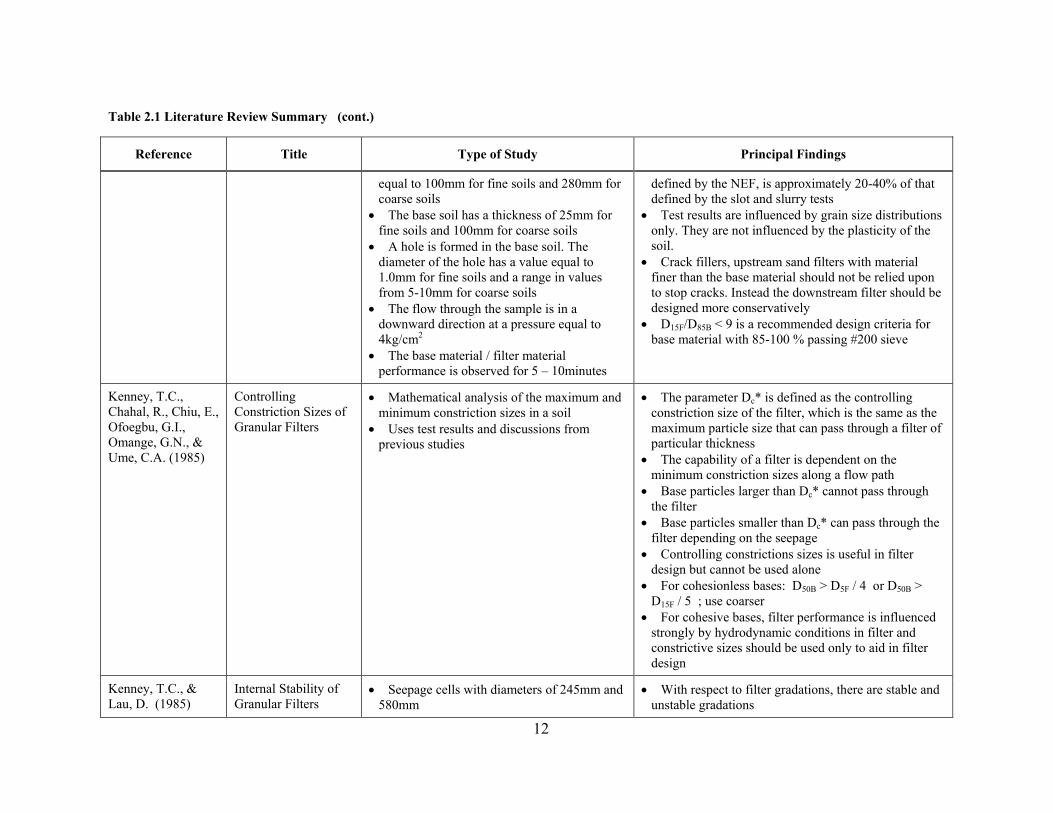
Sherard, J.L. & Dunnigan, L.P. (1985)
Filters and Leakage Control in Embankment Dams
• No Erosion Filter Test • Same apparatus as slot and pinhole tests.
The NEF test uses a diameter with a value
• On any given base soil with a filter finer than D15B (boundary) there is no visible erosion in the pinhole
• The filter boundary (D15B) for typical silts and clays,
12
Table 2.1 Literature Review Summary (cont.)
Reference Title Type of Study Principal Findings
equal to 100mm for fine soils and 280mm for coarse soils
• The base soil has a thickness of 25mm for fine soils and 100mm for coarse soils
• A hole is formed in the base soil. The diameter of the hole has a value equal to 1.0mm for fine soils and a range in values from 5-10mm for coarse soils
• The flow through the sample is in a downward direction at a pressure equal to 4kg/cm2
• The base material / filter material performance is observed for 5 – 10minutes
defined by the NEF, is approximately 20-40% of that defined by the slot and slurry tests
• Test results are influenced by grain size distributions only. They are not influenced by the plasticity of the soil.
• Crack fillers, upstream sand filters with material finer than the base material should not be relied upon to stop cracks. Instead the downstream filter should be designed more conservatively
• D15F/D85B < 9 is a recommended design criteria for base material with 85-100 % passing #200 sieve
Kenney, T.C., Chahal, R., Chiu, E., Ofoegbu, G.I., Omange, G.N., & Ume, C.A. (1985)
Controlling Constriction Sizes of Granular Filters
• Mathematical analysis of the maximum and minimum constriction sizes in a soil
• Uses test results and discussions from previous studies
• The parameter Dc* is defined as the controlling constriction size of the filter, which is the same as the maximum particle size that can pass through a filter of particular thickness
• The capability of a filter is dependent on the minimum constriction sizes along a flow path
• Base particles larger than Dc* cannot pass through the filter
• Base particles smaller than Dc* can pass through the filter depending on the seepage
• Controlling constrictions sizes is useful in filter design but cannot be used alone
• For cohesionless bases: D50B > D5F / 4 or D50B > D15F / 5 ; use coarser
• For cohesive bases, filter performance is influenced strongly by hydrodynamic conditions in filter and constrictive sizes should be used only to aid in filter design
Kenney, T.C., & Lau, D. (1985)
Internal Stability of Granular Filters
• Seepage cells with diameters of 245mm and 580mm
• With respect to filter gradations, there are stable and unstable gradations
13
Table 2.1 Literature Review Summary (cont.)
Reference Title Type of Study Principal Findings
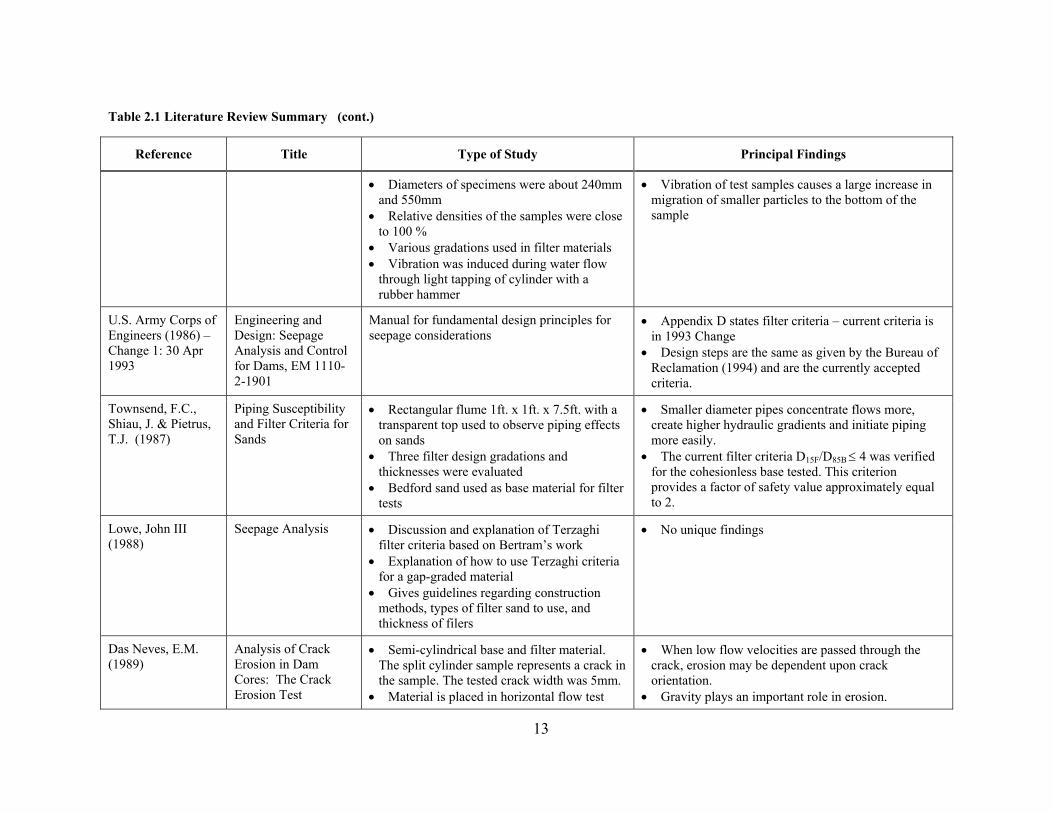
• Diameters of specimens were about 240mm and 550mm
• Relative densities of the samples were close to 100 %
• Various gradations used in filter materials • Vibration was induced during water flow
through light tapping of cylinder with a rubber hammer
• Vibration of test samples causes a large increase in migration of smaller particles to the bottom of the sample
U.S. Army Corps of Engineers (1986) – Change 1: 30 Apr 1993
Engineering and Design: Seepage Analysis and Control for Dams, EM 1110-2-1901
Manual for fundamental design principles for seepage considerations
• Appendix D states filter criteria – current criteria is in 1993 Change
• Design steps are the same as given by the Bureau of Reclamation (1994) and are the currently accepted criteria.
Townsend, F.C., Shiau, J. & Pietrus, T.J. (1987)
Piping Susceptibility and Filter Criteria for Sands
• Rectangular flume 1ft. x 1ft. x 7.5ft. with a transparent top used to observe piping effects on sands
• Three filter design gradations and thicknesses were evaluated
• Bedford sand used as base material for filter tests
• Smaller diameter pipes concentrate flows more, create higher hydraulic gradients and initiate piping more easily.
• The current filter criteria D15F/D85B ≤ 4 was verified for the cohesionless base tested. This criterion provides a factor of safety value approximately equal to 2.
Lowe, John III (1988)
Seepage Analysis • Discussion and explanation of Terzaghi filter criteria based on Bertram’s work
• Explanation of how to use Terzaghi criteria for a gap-graded material
• Gives guidelines regarding construction methods, types of filter sand to use, and thickness of filers
• No unique findings
Das Neves, E.M. (1989)
Analysis of Crack Erosion in Dam Cores: The Crack Erosion Test
• Semi-cylindrical base and filter material. The split cylinder sample represents a crack in the sample. The tested crack width was 5mm.
• Material is placed in horizontal flow test
• When low flow velocities are passed through the crack, erosion may be dependent upon crack orientation.
• Gravity plays an important role in erosion.
14
Table 2.1 Literature Review Summary (cont.)
Reference Title Type of Study Principal Findings
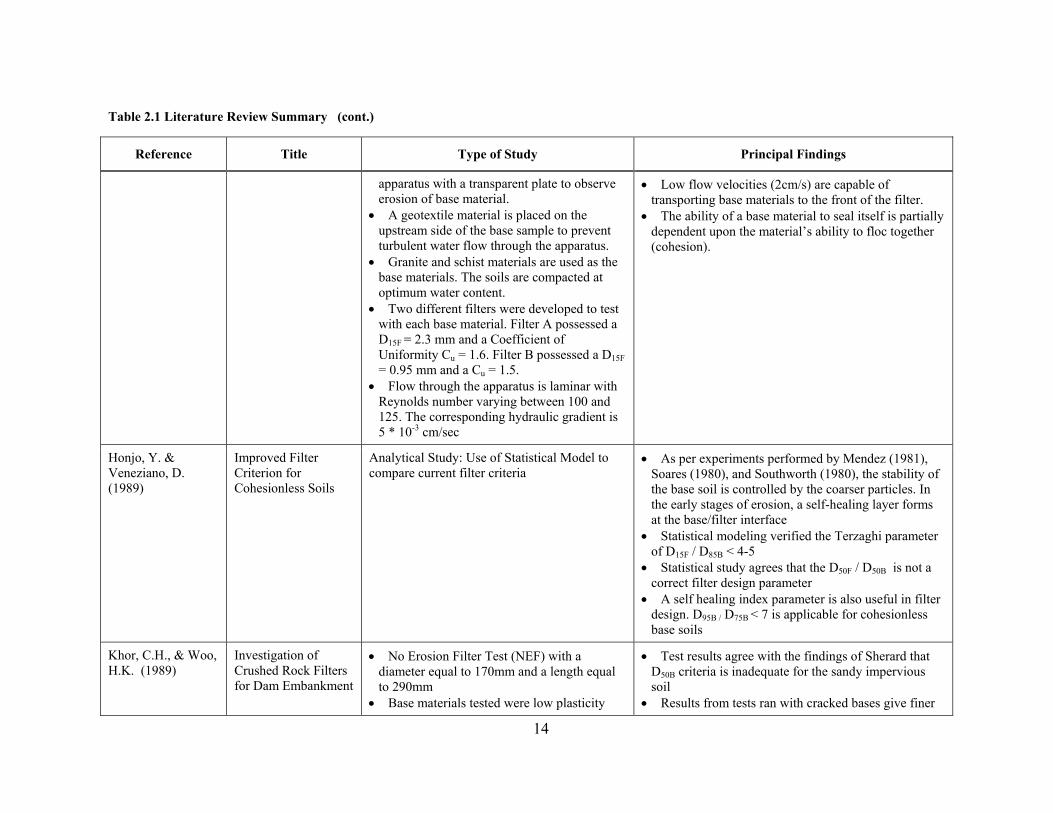
apparatus with a transparent plate to observe erosion of base material.
• A geotextile material is placed on the upstream side of the base sample to prevent turbulent water flow through the apparatus.
• Granite and schist materials are used as the base materials. The soils are compacted at optimum water content.
• Two different filters were developed to test with each base material. Filter A possessed a D15F = 2.3 mm and a Coefficient of Uniformity Cu = 1.6. Filter B possessed a D15F = 0.95 mm and a Cu = 1.5.
• Flow through the apparatus is laminar with Reynolds number varying between 100 and 125. The corresponding hydraulic gradient is 5 * 10-3 cm/sec
• Low flow velocities (2cm/s) are capable of transporting base materials to the front of the filter.
• The ability of a base material to seal itself is partially dependent upon the material’s ability to floc together (cohesion).
Honjo, Y. & Veneziano, D. (1989)
Improved Filter Criterion for Cohesionless Soils
Analytical Study: Use of Statistical Model to compare current filter criteria
• As per experiments performed by Mendez (1981), Soares (1980), and Southworth (1980), the stability of the base soil is controlled by the coarser particles. In the early stages of erosion, a self-healing layer forms at the base/filter interface
• Statistical modeling verified the Terzaghi parameter of D15F / D85B < 4-5
• Statistical study agrees that the D50F / D50B is not a correct filter design parameter
• A self healing index parameter is also useful in filter design. D95B / D75B < 7 is applicable for cohesionless base soils
Khor, C.H., & Woo, H.K. (1989)
Investigation of Crushed Rock Filters for Dam Embankment
• No Erosion Filter Test (NEF) with a diameter equal to 170mm and a length equal to 290mm
• Base materials tested were low plasticity
• Test results agree with the findings of Sherard that D50B criteria is inadequate for the sandy impervious soil
• Results from tests ran with cracked bases give finer
15
Table 2.1 Literature Review Summary (cont.)
Reference Title Type of Study Principal Findings
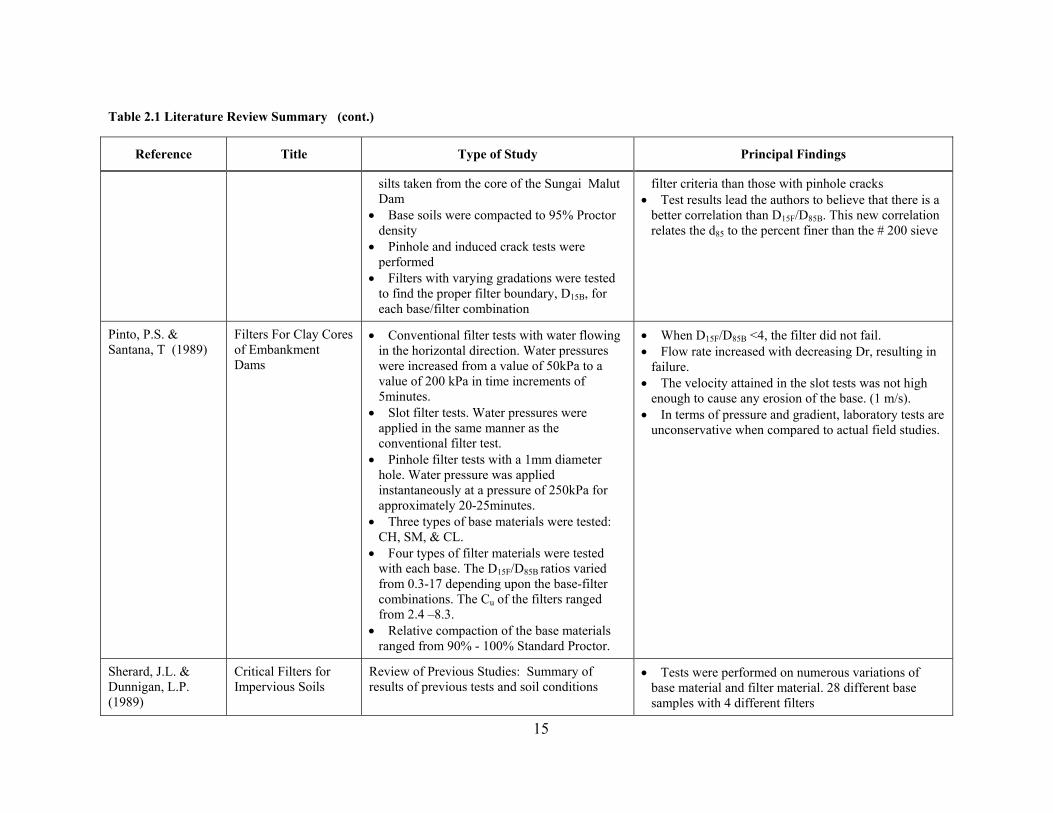
silts taken from the core of the Sungai Malut Dam
• Base soils were compacted to 95% Proctor density
• Pinhole and induced crack tests were performed
• Filters with varying gradations were tested to find the proper filter boundary, D15B, for each base/filter combination
filter criteria than those with pinhole cracks • Test results lead the authors to believe that there is a
better correlation than D15F/D85B. This new correlation relates the d85 to the percent finer than the # 200 sieve
Pinto, P.S. & Santana, T (1989)
Filters For Clay Cores of Embankment Dams
• Conventional filter tests with water flowing in the horizontal direction. Water pressures were increased from a value of 50kPa to a value of 200 kPa in time increments of 5minutes.
• Slot filter tests. Water pressures were applied in the same manner as the conventional filter test.
• Pinhole filter tests with a 1mm diameter hole. Water pressure was applied instantaneously at a pressure of 250kPa for approximately 20-25minutes.
• Three types of base materials were tested: CH, SM, & CL.
• Four types of filter materials were tested with each base. The D15F/D85B ratios varied from 0.3-17 depending upon the base-filter combinations. The Cu of the filters ranged from 2.4 –8.3.
• Relative compaction of the base materials ranged from 90% - 100% Standard Proctor.
• When D15F/D85B <4, the filter did not fail. • Flow rate increased with decreasing Dr, resulting in
failure. • The velocity attained in the slot tests was not high
enough to cause any erosion of the base. (1 m/s). • In terms of pressure and gradient, laboratory tests are
unconservative when compared to actual field studies.
Sherard, J.L. & Dunnigan, L.P. (1989)
Critical Filters for Impervious Soils
Review of Previous Studies: Summary of results of previous tests and soil conditions
• Tests were performed on numerous variations of base material and filter material. 28 different base samples with 4 different filters
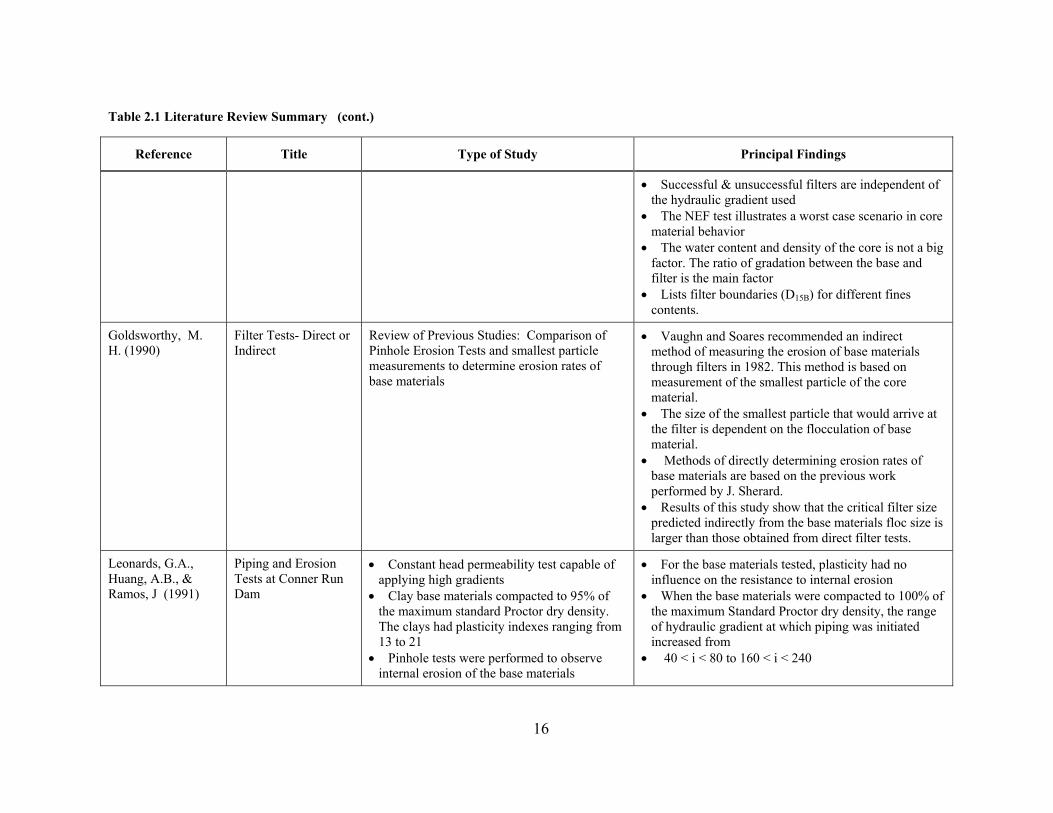
16
Table 2.1 Literature Review Summary (cont.)
Reference Title Type of Study Principal Findings
• Successful & unsuccessful filters are independent of the hydraulic gradient used
• The NEF test illustrates a worst case scenario in core material behavior
• The water content and density of the core is not a big factor. The ratio of gradation between the base and filter is the main factor
• Lists filter boundaries (D15B) for different fines contents.
Goldsworthy, M. H. (1990)
Filter Tests- Direct or Indirect
Review of Previous Studies: Comparison of Pinhole Erosion Tests and smallest particle measurements to determine erosion rates of base materials
• Vaughn and Soares recommended an indirect method of measuring the erosion of base materials through filters in 1982. This method is based on measurement of the smallest particle of the core material.
• The size of the smallest particle that would arrive at the filter is dependent on the flocculation of base material.
• Methods of directly determining erosion rates of base materials are based on the previous work performed by J. Sherard.
• Results of this study show that the critical filter size predicted indirectly from the base materials floc size is larger than those obtained from direct filter tests.
Leonards, G.A., Huang, A.B., & Ramos, J (1991)
Piping and Erosion Tests at Conner Run Dam
• Constant head permeability test capable of applying high gradients
• Clay base materials compacted to 95% of the maximum standard Proctor dry density. The clays had plasticity indexes ranging from 13 to 21
• Pinhole tests were performed to observe internal erosion of the base materials
• For the base materials tested, plasticity had no influence on the resistance to internal erosion
• When the base materials were compacted to 100% of the maximum Standard Proctor dry density, the range of hydraulic gradient at which piping was initiated increased from
• 40 < i < 80 to 160 < i < 240
17
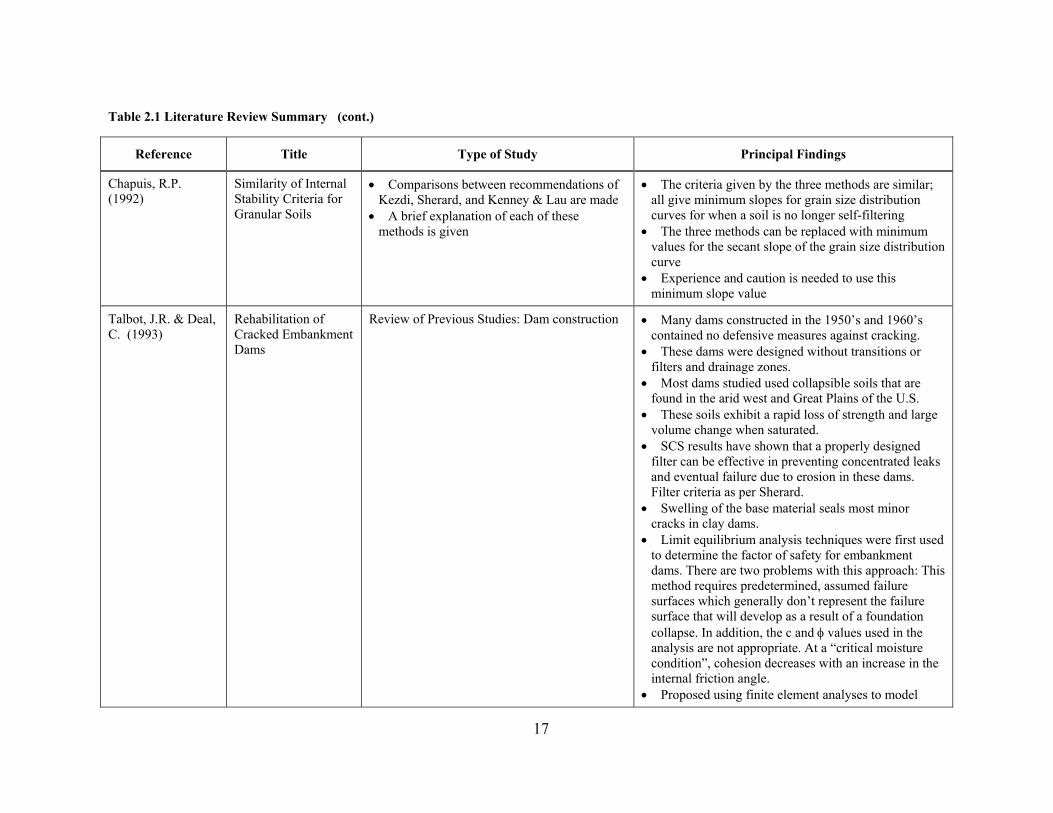
Table 2.1 Literature Review Summary (cont.)
Reference Title Type of Study Principal Findings
Chapuis, R.P. (1992)
Similarity of Internal Stability Criteria for Granular Soils
• Comparisons between recommendations of Kezdi, Sherard, and Kenney & Lau are made
• A brief explanation of each of these methods is given
• The criteria given by the three methods are similar; all give minimum slopes for grain size distribution curves for when a soil is no longer self-filtering
• The three methods can be replaced with minimum values for the secant slope of the grain size distribution curve
• Experience and caution is needed to use this minimum slope value
Talbot, J.R. & Deal, C. (1993)
Rehabilitation of Cracked Embankment Dams
Review of Previous Studies: Dam construction • Many dams constructed in the 1950’s and 1960’s contained no defensive measures against cracking.
• These dams were designed without transitions or filters and drainage zones.
• Most dams studied used collapsible soils that are found in the arid west and Great Plains of the U.S.
• These soils exhibit a rapid loss of strength and large volume change when saturated.
• SCS results have shown that a properly designed filter can be effective in preventing concentrated leaks and eventual failure due to erosion in these dams. Filter criteria as per Sherard.
• Swelling of the base material seals most minor cracks in clay dams.
• Limit equilibrium analysis techniques were first used to determine the factor of safety for embankment dams. There are two problems with this approach: This method requires predetermined, assumed failure surfaces which generally don’t represent the failure surface that will develop as a result of a foundation collapse. In addition, the c and φ values used in the analysis are not appropriate. At a “critical moisture condition”, cohesion decreases with an increase in the internal friction angle.
• Proposed using finite element analyses to model
18
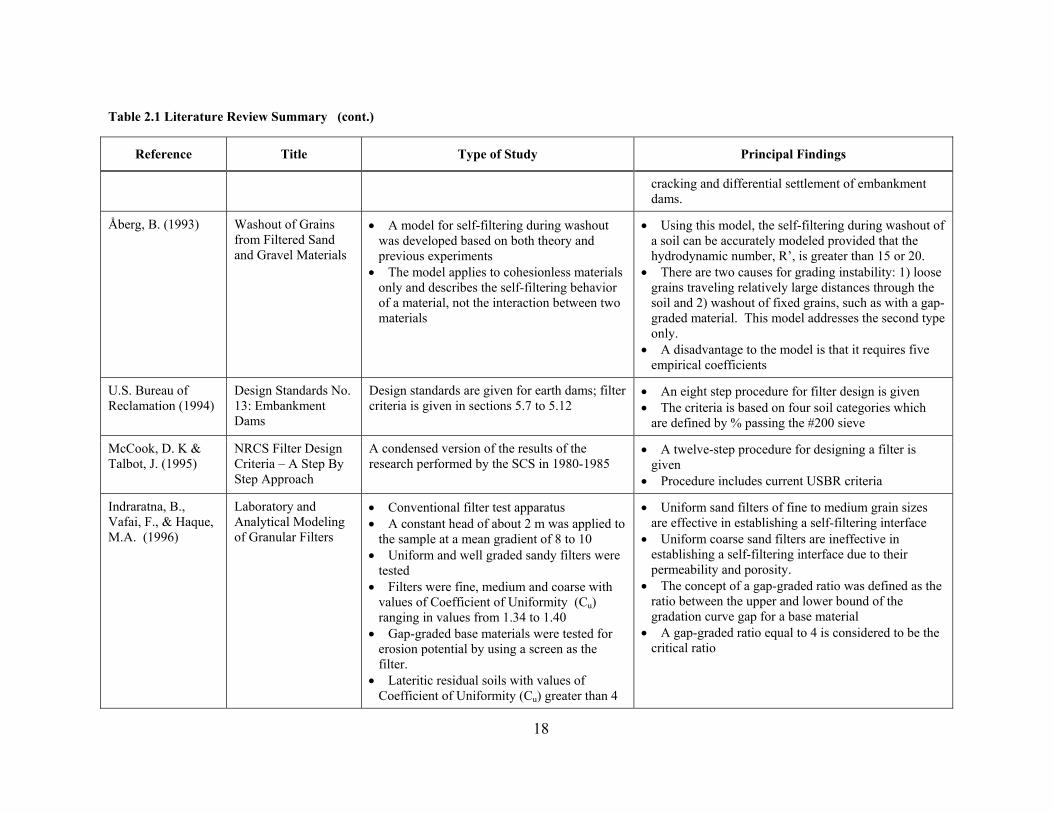
Table 2.1 Literature Review Summary (cont.)
Reference Title Type of Study Principal Findings
cracking and differential settlement of embankment dams.
Åberg, B. (1993) Washout of Grains from Filtered Sand and Gravel Materials
• A model for self-filtering during washout was developed based on both theory and previous experiments
• The model applies to cohesionless materials only and describes the self-filtering behavior of a material, not the interaction between two materials
• Using this model, the self-filtering during washout of a soil can be accurately modeled provided that the hydrodynamic number, R’, is greater than 15 or 20.
• There are two causes for grading instability: 1) loose grains traveling relatively large distances through the soil and 2) washout of fixed grains, such as with a gap-graded material. This model addresses the second type only.
• A disadvantage to the model is that it requires five empirical coefficients
U.S. Bureau of Reclamation (1994)
Design Standards No. 13: Embankment Dams
Design standards are given for earth dams; filter criteria is given in sections 5.7 to 5.12
• An eight step procedure for filter design is given • The criteria is based on four soil categories which
are defined by % passing the #200 sieve
McCook, D. K & Talbot, J. (1995)
NRCS Filter Design Criteria – A Step By Step Approach
A condensed version of the results of the research performed by the SCS in 1980-1985
• A twelve-step procedure for designing a filter is given
• Procedure includes current USBR criteria
Indraratna, B., Vafai, F., & Haque, M.A. (1996)
Laboratory and Analytical Modeling of Granular Filters
• Conventional filter test apparatus • A constant head of about 2 m was applied to
the sample at a mean gradient of 8 to 10 • Uniform and well graded sandy filters were
tested • Filters were fine, medium and coarse with
values of Coefficient of Uniformity (Cu) ranging in values from 1.34 to 1.40
• Gap-graded base materials were tested for erosion potential by using a screen as the filter.
• Lateritic residual soils with values of Coefficient of Uniformity (Cu) greater than 4
• Uniform sand filters of fine to medium grain sizes are effective in establishing a self-filtering interface
• Uniform coarse sand filters are ineffective in establishing a self-filtering interface due to their permeability and porosity.
• The concept of a gap-graded ratio was defined as the ratio between the upper and lower bound of the gradation curve gap for a base material
• A gap-graded ratio equal to 4 is considered to be the critical ratio
19
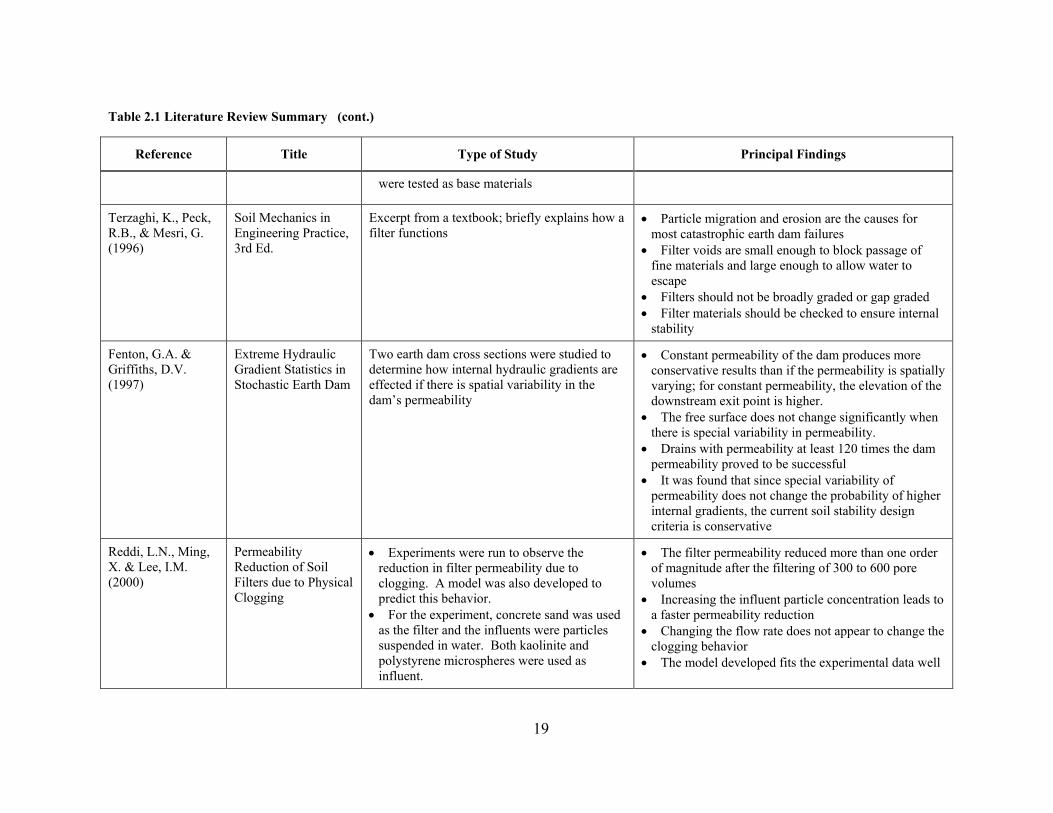
Table 2.1 Literature Review Summary (cont.)
Reference Title Type of Study Principal Findings
were tested as base materials
Terzaghi, K., Peck, R.B., & Mesri, G. (1996)
Soil Mechanics in Engineering Practice, 3rd Ed.
Excerpt from a textbook; briefly explains how a filter functions
• Particle migration and erosion are the causes for most catastrophic earth dam failures
• Filter voids are small enough to block passage of fine materials and large enough to allow water to escape
• Filters should not be broadly graded or gap graded • Filter materials should be checked to ensure internal
stability
Fenton, G.A. & Griffiths, D.V. (1997)
Extreme Hydraulic Gradient Statistics in Stochastic Earth Dam
Two earth dam cross sections were studied to determine how internal hydraulic gradients are effected if there is spatial variability in the dam’s permeability
• Constant permeability of the dam produces more conservative results than if the permeability is spatially varying; for constant permeability, the elevation of the downstream exit point is higher.
• The free surface does not change significantly when there is special variability in permeability.
• Drains with permeability at least 120 times the dam permeability proved to be successful
• It was found that since special variability of permeability does not change the probability of higher internal gradients, the current soil stability design criteria is conservative
Reddi, L.N., Ming, X. & Lee, I.M. (2000)
Permeability Reduction of Soil Filters due to Physical Clogging
• Experiments were run to observe the reduction in filter permeability due to clogging. A model was also developed to predict this behavior.
• For the experiment, concrete sand was used as the filter and the influents were particles suspended in water. Both kaolinite and polystyrene microspheres were used as influent.
• The filter permeability reduced more than one order of magnitude after the filtering of 300 to 600 pore volumes
• Increasing the influent particle concentration leads to a faster permeability reduction
• Changing the flow rate does not appear to change the clogging behavior
• The model developed fits the experimental data well
20
Table 2.1 Literature Review Summary (cont.)
Reference Title Type of Study Principal Findings
Locke, M., Indraratna, B. & Adikari, G. (2000)
Erosion and Filtration of Cohesive Soils
• Permeameter with a diameter equal to 150 mm
• Soil sample is compacted in five, 40 cm thick layers with a 90% Standard Proctor density. The sample is 150mm in diameter and 200mm long
• Pinhole with a diameter equal to 3 mm is pushed through the sample
• Modified pinhole test • Water supply producing flow velocities
through the samples with values ranging from 0.7 to 3.5 m/s
• Out-flowing water is collected on an aluminum foil sheet and oven dried. The remaining sediment is scraped from the sheet
• Particle size diameters of the scraped sediment are determined using a Melvern Particle Size Analyzer (PSA)
• The resistance to surface erosion of a cohesive soil is dependent primarily on the inter-particle bonding forces
• Erosion is strongly influenced by the Sodium Adsorption Ratio (SAR) of the soil
• It requires approximately 2-3 days after the pinhole is made for the sample to gain full strength and be ready for an erosion test
• The modified pinhole test provides a reasonable method to model erosion in base materials
• Before dispersion, eroded particles are significantly larger than the primary particles of the soil. This indicates that erosion occurs as aggregates of materials
Ramos, F.D. & Locke, M (2000)
Design of granular filters: Guidelines & Recommendations
• Comparison of empirical data, mathematical models, and Test procedures to predict filter performance
• Description of common problems associated with the NEF test and recommendations to alleviate these problems
• Empirical methods can quickly determine safe filters during project investigation and development. However there are some limitations in application and these methods are not conservative
• Mathematical models are adequate for predicting erosion within the filter materials as a function of time and their seepage rates
• Increasing the fines content in a filter greatly improves the filter effectiveness.
• Removal of the fines in a filter produces more conservative testing.
• Compaction of the filter material can lead to breakage and thus more fines. This leads to a deviation in the gradation curve and therefore can produce false results
21
Table 2.1 Literature Review Summary (cont.)
Reference Title Type of Study Principal Findings
• Materials finer than those in the filter particle size distribution should not be used as a “side” material in the NEF test. These materials can be washed into the filter and produce false results
• The authors recommend the use of modeling clay as a side material to prevent the above conditions from occurring
• The base material should only contain the fraction passing the 4.75mm sieve, as the coarser fraction has no influence on filtration
• Both standard sieve analysis and hydrometer tests should be performed on the base material to determine the tendency for the base to form flocs.
• Distilled water should be used if the base material is determined to be dispersive
• Coarse filter materials should not be present at the base / filter interface. These materials may clog the pinhole and produce false results
• Erosion of the base soil usually occurs within the first 20 minutes of testing, therefore tests of longer duration are not necessary
• The NEF test is very sensitive. The border between success and failure can be detected to within a filter size of 0.1mm.
Foster, M & Fell, R. (2000)
Use of Event Trees to Estimate the Probability of Failure of Embankment Dams by Internal Erosion and Piping
• The paper provides a summary of relevant literature on event trees and includes analysis of 17 dams that experienced either accidents or failure.
• Qualitative guidance is given about the effect of certain factors on the likelihood of three events: the initiation of internal erosion, piping, and breaching.
• Embankments studied are assumed to be
• For a detailed study of estimating the probability of failure by piping, event trees should be used. Historical performance methods can be limited.
• Several tables (4 through 14) were developed to show the influence of certain factors on the likelihood of a particular event.
• When assessing the likely performance of a filter, three branches should be used to represent the three possible filter behaviors: 1) seal without erosion, 2)
22
Table 2.1 Literature Review Summary (cont.)
Reference Title Type of Study Principal Findings
functioning under normal conditions (no seismicity).
• The intent of the paper is to give guidance to experts when assigning conditional probabilities to their event trees.
seal with some erosion, and 3) excessive or continuing erosion.
• Table 15 gives the relative importance of design and construction details on the likelihood of internal erosion and piping in terms of low, medium, and high importance.
• Table 16 provides a linkage between verbal description of a risk and a numerical value for probability.
• Historical trends are explained; for example, historically dams with good filters have very low likelihood of failure by piping.
Hurcomb, D. (2001)
Petrographic Examination of Exhumed Filter Sand-Horsetooth Dam Modifications-Colorado-Big Thompson Project, Colorado
Review of Study: Cementation Effects on Granular Materials
• The clay minerals that are present in sand filters cement together due to lack of water and are able to form bridges that capture sand particles.
• The cemented sand and clay minerals collapse when they come into contact with water
• Petrographic analysis was used to observe the structure of the cemented particle bridges
• Semctite, illite/mica, and kaolinite minerals were present in the cemented samples
Foster, M & Fell, R. (2001)
Assessing Dam Filters That Do Not Satisfy Design Criteria
• A method is proposed to assess existing filters that do not satisfy current Sherard and Dunnigan criteria.
• The study was based on lab test results performed by Sherard and Dunnigan and others as well as dams that experienced piping but not failure.
• The proposed method can be used to define three boundaries: no-erosion, excessive-erosion, and continuing-erosion.
• This method is intended for existing dams only; for new filter design, the modern
• Many existing dams have filters that are either too coarse by modern standards or became segregated during construction. It is possible for these filters to perform satisfactorily in some cases.
• Dams with poor filter performance in general have broadly-graded cores (15% - 85% fines in base; D95B > 2mm) and filters with D15F > 1.0mm on average.
• Dams with good filter performance in soil group 2 had on average D15F ≤ 0.5mm.
• The proposed criteria are given in Table 6; criteria are given for each of the three boundaries for each of the four soil types. Factors of safety are not included,
23
Table 2.1 Literature Review Summary (cont.)
Reference Title Type of Study Principal Findings
Sherard and Dunnigan criteria should be used as this is only a method to assess existing filters.
Indratatna, B. & Radampola, S. (2002)
Analysis of Critical Hydraulic Gradient for Particle Movement in Filtration
• Analytic and laboratory study to determine the critical gradient for movement of a base particle through a filter.
• Solution considered gravity, viscous drag, and frictional resistance between particle and pore channel.
• Conventional laboratory filter tests were conducted.
• Specimen diameter. = 15.5cm and ht = 24.5cm
• Filter thickness = 6cm • Sand used as base material and gravel used
as filter
• Critical hydraulic gradient function of minimum pore diameter, length of pore channel (filter), grain-to-grain friction angle, base material particle diameter, density of base material, and orientation of flow.
24
2.2.2. Vaughan and Soares (1982)
Filter experiments were run to test potential filters for the Cow Green Dam.
Information from the failure at Balderhead Dam was used since the cores were made of
similar clay. Also, lab tests in a 50 mm diameter by 450 mm long tube were run; a pre-
saturated filter was first compacted in the tube and then clay flocs were introduced with
flowing water. The amount of clay in the outflow was observed. Successful tests had
outflow without clay particles. The authors suggest that permeability is the main measure
of filter performance. The filter design for the percent passing the #200 sieve is governed
by the size of the smallest flocculated base particle. Also, filters should be cohesionless to
ensure that the filter itself cannot sustain a crack. A simple "sand castle" test was suggested
for testing the cohesion of the filter material.
2.2.3.Sherard, Dunnigan, and Talbot (1984a)
Sand and gravel filters were tested in the lab to analyze the effectiveness of current
filter criteria. A 10.16 cm diameter permeameter was used with a 13 cm to 18 cm thick
filter beneath a 5 cm to 10 cm thick base. Results indicate that the criteria D15F1 /D85B < 5 is
conservative and should be the main criteria in judging filter performance. Upper case D
refers to grain size of the filter. Numerical subscription indicates the percentage of the
material that is finer than the indicated size. Subscription F and B means filter and base
material. Criteria for D50F/D50B and D15F/D15B established by the USBR were not supported
1 The USBR (1994) uses the following notation:
D15F where 15 is the % passing and F indicates filter (capital B indicates base) The USACE (1993) uses the following notation:
d85 where lower case d represents the base particle size and 85 indicates the % passing
D15 where upper case D represents the filter particle size and 15 represents the % passing To avoid confusion, this dissertation uses the following notation consistently throughout:
D15F for a filter particle size of 15% passing D85B for a base particle size of 85% passing
25
by these experiments. Both angular and sub-rounded particles behaved well as filters. It
was also seen that the shape of the filter gradation curve does not need to be the same as
that for the base soil.
2.2.4. Sherard, Dunnigan, and Talbot (1984b)
In order to test the effectiveness of current criteria on silt and clay bases, slot and
slurry tests were performed. Sand and gravel filters were used in the experiments. The
slurry tests used base material from the slot tests to form the slurry base. Base materials
consisted of CL, CH, ML, and CL-ML. The D15F of the filters ranged from 0.3 mm to 9.5
mm. The results from both types of tests were identical. The slot test represents a more
severe case such that velocities are higher through the crack than achieved in the field. A
difference in critical value of D15F was observed depending on the type of water used;
distilled water caused the value to be about 0.1 mm smaller than when tap water is used. It
was also found that the Atterberg limits of the base material did not influence the filter
selection. The criteria, D15F / D85B < 5, agree with the results of these tests.
2.2.5. Sherard and Dunnigan (1985)
A "No Erosion Filter" test (NEF test) was developed to test the effectiveness of
filters. It uses the same apparatus as the pinhole test and the slot test; the permeameter
diameter is 100 mm for fine soils and 280 mm for coarse soils. The hole formed through
the base soil is 1.0 mm for fine soils and 5 to 10 mm for coarse soils. Flow due to a water
pressure of 4 kg/cm2 was observed for 5 to 10 minutes. It was observed that for a base soil
with a filter finer than D15B, no visible erosion took place. For the NEF test, the largest
successful D15B was approximately 20% to 40% of the value defined by slot and slurry tests.
It was also found that only the soil gradation influenced test results and not the plasticity of
the soil. A main conclusion was that upstream sand filters should not be relied upon to stop
cracks; instead, the downstream filter should be designed more conservatively. The
26
recommended criterion is D15F / D85B < 9 when 85% to 100% of the base soil passes the
#200 sieve.
2.2.6. Kenney, Chahal, Chiu, Ofoegbu, Omange, and Ume (1985)
Mathematical analysis of the maximum and minimum constriction sizes in a soil is
useful when designing granular filters. The capability of a filter depends on the minimum
constriction sizes along a flow path. A parameter called Dc* is defined as the controlling
constriction size of the filter. In other words, Dc* is the maximum particle size that can
pass through a filter of a particular thickness. Base particles larger than Dc* cannot pass
through the filter, and base particles smaller than Dc* can pass through the filter depending
on the seepage conditions. For cohesionless bases, Dc* is the coarser of (D50B > D5F / 4)
and (D50B > D15F / 5). Controlling constriction sizes in this way is useful in filter design but
cannot be used alone. Especially in the case of cohesive bases, controlling constriction
sizes is only an aid to filter design since filter performance for cohesive bases is strongly
influenced by hydrodynamic conditions in the filter.
2.2.7. Das Neves (1989)
A crack erosion test was developed to test filters. Experiments were run using base
materials of granite and schist and two filters, A and B. Filter A had D15F = 2.3 mm and Cu2
= 1.6 while filter B had D15F = 0.95 mm and Cu = 1.5. The apparatus consisted of a
cylindrical permeameter with a transparent plate for observation. The split cylinder
represents a crack of width 5 mm. The material is placed so that flow is horizontal through
the apparatus. A geotextile is placed on top of the base to prevent turbulent flow. With low
velocities through the crack, erosion is dependent on the crack orientation. Also, gravity
plays an important role in erosion. It was found that low velocities (2 cm/s) are capable of
2 Cu: Coefficient of uniformity,
10
60
DD
Cu =
27
transporting material to the filter interface. The ability of the base material to be self-
healing is partly dependent on the cohesion of the soil or its ability to flocculate.
2.2.8. Honjo and Veneziano (1989)
An analytical study was conducted to compare various filter criteria.
Experimentation by Mendez (1981), Soares (1980), and Southworth (1980) confirmed that
the stability of the base soil is controlled by the coarser particles. Also, this
experimentation show that in the early stages of erosion, a self-healing layer forms at the
interface of the base and filter. Statistical modeling was used to confirm the Terzaghi
criterion (D15F / D85B < 4 to 5). The statistical analysis also supports the conclusion that the
D50F / D50B criteria are not useful in filter design. In filter design, a useful parameter is the
self-healing index; for cohesionless bases, D95B / D75B < 7 indicates that material will be
self-healing.
2.2.9. Khor and Woo (1989)
In order to investigate crushed rock filters, no erosion filter tests (NEF) were run.
The base material used was low plasticity silts obtained from the core of the Sungai Malut
Dam. Both pinhole and induced crack tests were run. A variety of filters were used to
determine the proper filter boundary, D15B, for each combination of filter and base. It was
found that the D50B criteria are inadequate, which is consistent with other results. Those
samples with cracked bases required a finer filter than those with a pinhole. A conclusion
made as a result of this testing was that there exists a better correlation than D15F / D85B. A
better correlation relates the D85B to the percent passing the #200 sieve.
28
2.2.10. Sherard and Dunnigan (1989)
Tests were performed on 28 different base samples and 4 filters. By comparing the
data, it can be seen that success or failure of a filter is independent of the hydraulic gradient.
The no erosion filter test (NEF) is a worst-case scenario of core material behavior. The
water content and the density of the core are not controlling factors in filter success. The
main factor is the ratio of filter gradation to base gradation.
2.2.11. Indraratna, Vafai, and Haque (1996)
Laboratory testing and analytical modeling were performed to assess the behavior of
gap-graded base materials. In the testing, both uniform and well-graded sandy filters were
used. The coefficient of uniformity, Cu, of the filters ranged from 1.34 to 1.40. The base
materials used were gap-graded lateritic residual soils with Cu values greater than 4. It was
found that uniform sand filters of fine to medium sands are effective in establishing a self-
filtering interface. This was not the case with coarse sand filters; their inability to form a
self-filtering interface is due to the permeability and porosity. A gap-graded ratio was
defined as the ratio between the upper and lower bound of the gradation curve gap of the
base material. The critical gap-graded ratio is considered to be equal to 4.
2.2.12. Locke, Indraratna and Adikari (2000)
A modified pinhole test was used to study erosion of base materials. The
permeameter for this investigation had a diameter of 150 mm and a length of 200 mm. Soil
was compacted in five each 40 cm thick layers. The pinhole diameter was 3 mm. After the
pinhole was pushed through the soil, approximately 2 to 3 days were required for the
sample to return to its original strength and be ready for testing. The outflowing water was
collected and oven dried. The diameters of the sediment particles were then determined
using a Melvern Particle Size Analyzer (PSA). This modified pinhole test provides a
reasonable model of erosion in base materials. It was found that the resistance to surface
29
erosion of a cohesive soil is mainly dependent on inter-particle bonding forces. Also,
erosion is influenced strongly by the sodium adsorption ratio (SAR) of the soil. It was
determined that erosion occurs as aggregates of materials since before dispersion, eroded
particles are significantly larger than the primary soil particles.
2.3. Current Filter Criteria
2.3.1. Gradation-based Filter Criteria
The history of research conducted on filter criteria for earth dams extends back
almost 100 years. Design parameters for filters were published as early as 1910 (Hsu, 1981).
However, the basis of the current form of filter design criteria can be attributed to work
done by Terzaghi in the 1920’s and Casagrande in the 1930’s (Arulanandan and Perry,
1983; Hsu, 1981). It was recognized at that time that a filter must perform two separate
tasks:
• It must prevent the migration of the core or base material into other zones of the
dam, and
• It must possess a large enough hydraulic conductivity so that excess pore pressures
are not developed in the dam and flow is channeled to the appropriate locations of
the dam.
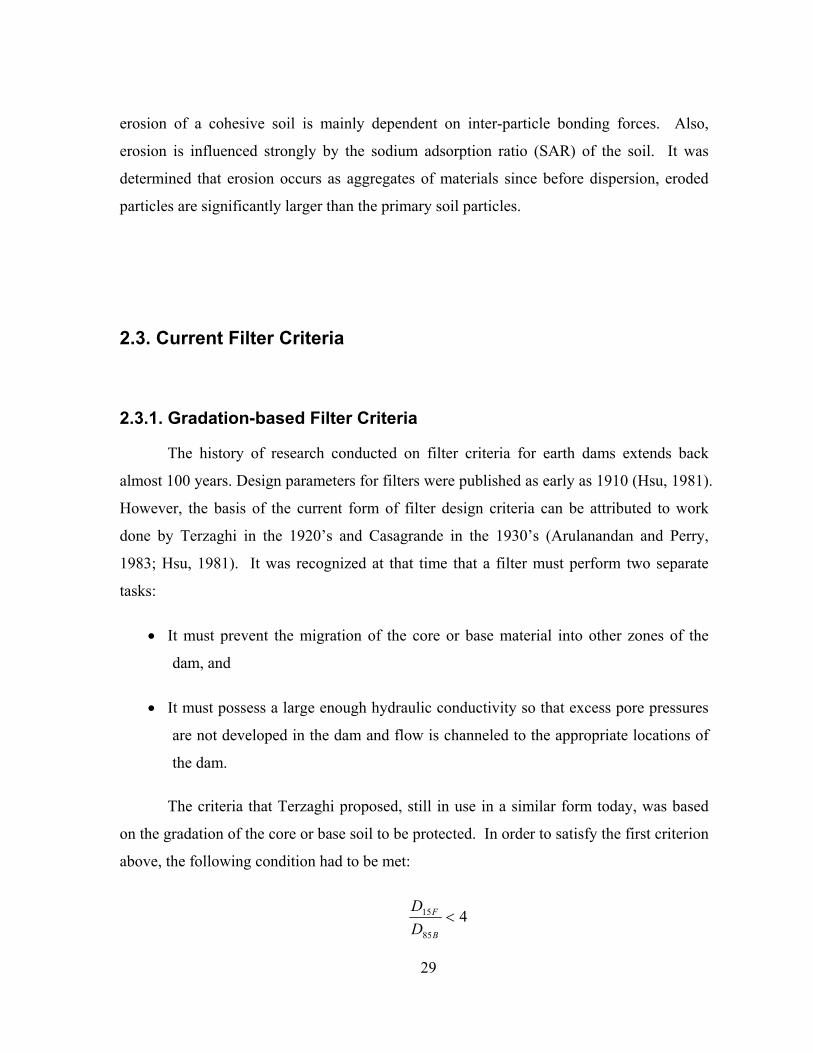
The criteria that Terzaghi proposed, still in use in a similar form today, was based
on the gradation of the core or base soil to be protected. In order to satisfy the first criterion
above, the following condition had to be met:
485
15 <B
F
DD
30
where D15F = grain size diameter of the filter where 15% by weight of the soil
particles are smaller in diameter, and D85B = the grain size diameter where 85% of the base
or filter soil is smaller in diameter. In order to satisfy the second criterion, Terzaghi
suggested that:
415
15 >B
F
DD
where D15B = the grain size diameter of the base or core where 15% by weight of the
soil particles are smaller in diameter.
The first criterion provides a point on the gradation curve representing the coarsest
allowable filter, and the second criterion provides a point on the gradation curve of the
finest allowable filter.
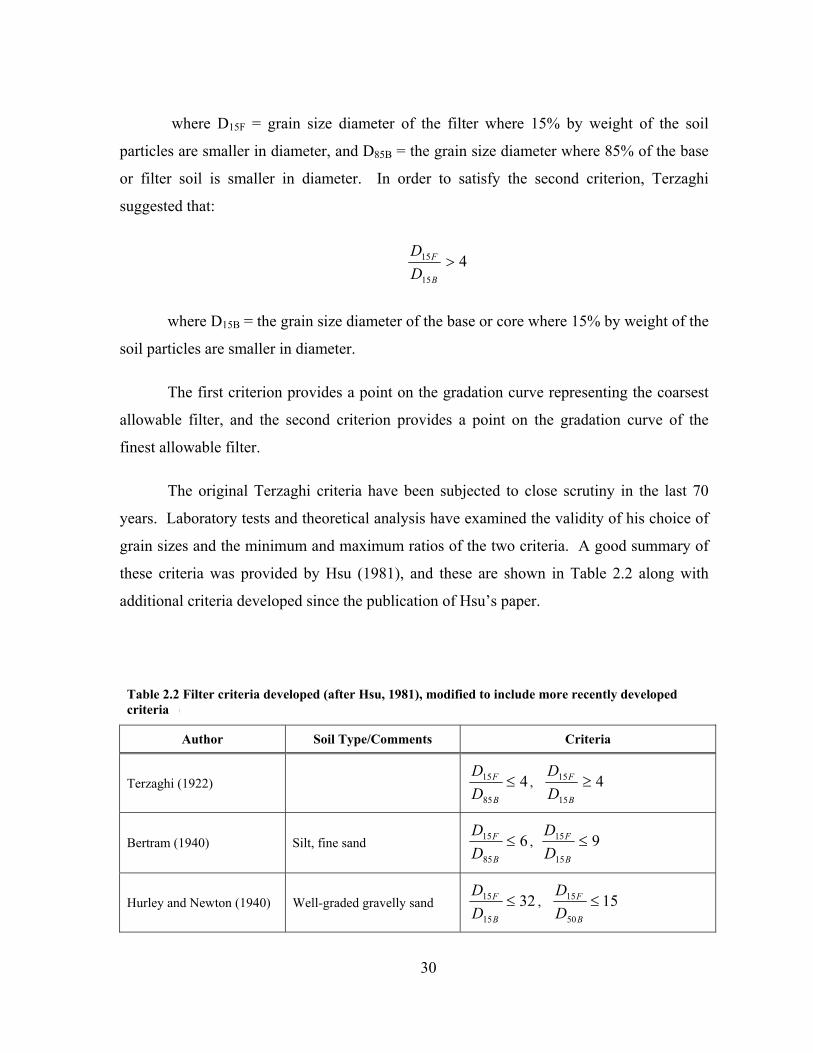
The original Terzaghi criteria have been subjected to close scrutiny in the last 70
years. Laboratory tests and theoretical analysis have examined the validity of his choice of
grain sizes and the minimum and maximum ratios of the two criteria. A good summary of
these criteria was provided by Hsu (1981), and these are shown in Table 2.2 along with
additional criteria developed since the publication of Hsu’s paper.
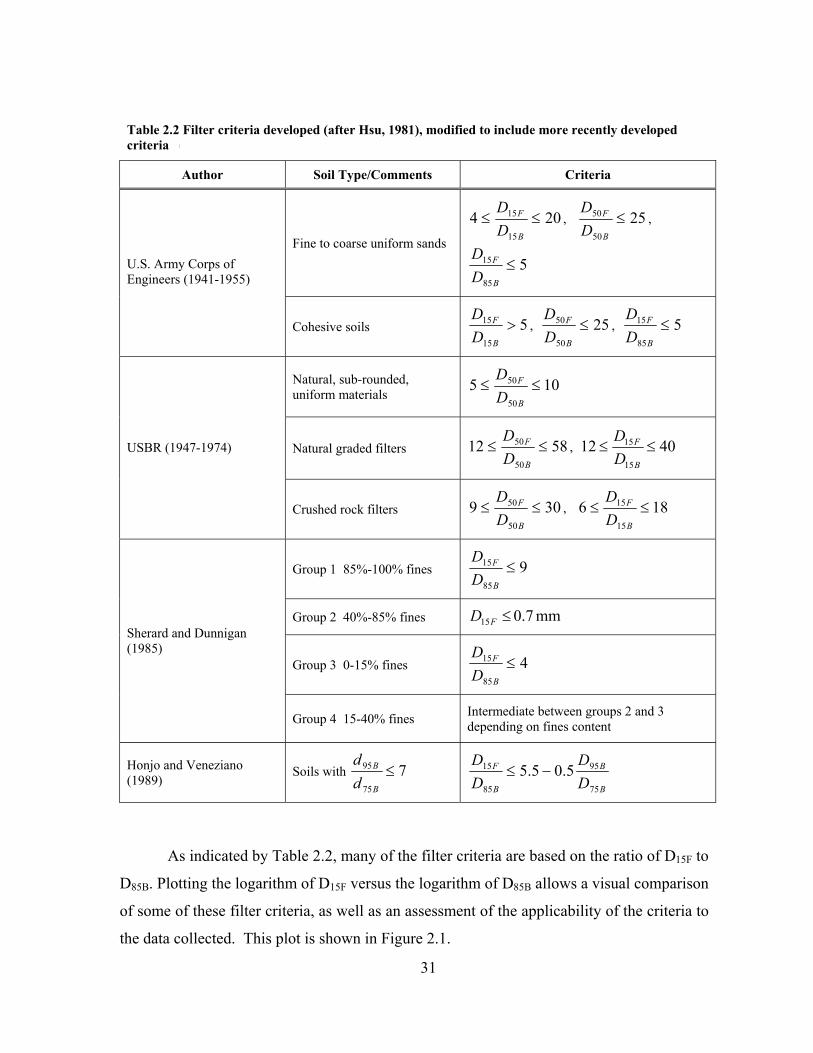
Table 2.2 Filter criteria developed (after Hsu, 1981), modified to include more recently developed criteria (cont')
Author Soil Type/Comments Criteria
Terzaghi (1922) 485
15 ≤B
F
DD
, 415
15 ≥B
F
DD
Bertram (1940) Silt, fine sand 685
15 ≤B
F
DD
, 915
15 ≤B
F
DD
Hurley and Newton (1940) Well-graded gravelly sand 3215
15 ≤B
F
DD
, 1550
15 ≤B
F
DD
31
Table 2.2 Filter criteria developed (after Hsu, 1981), modified to include more recently developed criteria (cont')
Author Soil Type/Comments Criteria
Fine to coarse uniform sands
20415
15 ≤≤B
F
DD
, 2550
50 ≤B
F
DD
,
585
15 ≤B
F
DD
U.S. Army Corps of Engineers (1941-1955)
Cohesive soils 515
15 >B
F
DD
, 2550
50 ≤B
F
DD
, 585
15 ≤B
F
DD
Natural, sub-rounded, uniform materials
10550
50 ≤≤B
F
DD
Natural graded filters 581250
50 ≤≤B
F
DD
, 401215
15 ≤≤B
F
DD
USBR (1947-1974)
Crushed rock filters 30950
50 ≤≤B
F
DD
, 18615
15 ≤≤B
F
DD
Group 1 85%-100% fines 985
15 ≤B
F
DD
Group 2 40%-85% fines mm7.015 ≤FD
Group 3 0-15% fines 485
15 ≤B
F
DD
Sherard and Dunnigan (1985)
Group 4 15-40% fines Intermediate between groups 2 and 3 depending on fines content
Honjo and Veneziano (1989)
Soils with 775
95 ≤B
B
dd
B
B
B
F
DD
DD
75
95
85
15 5.05.5 −≤
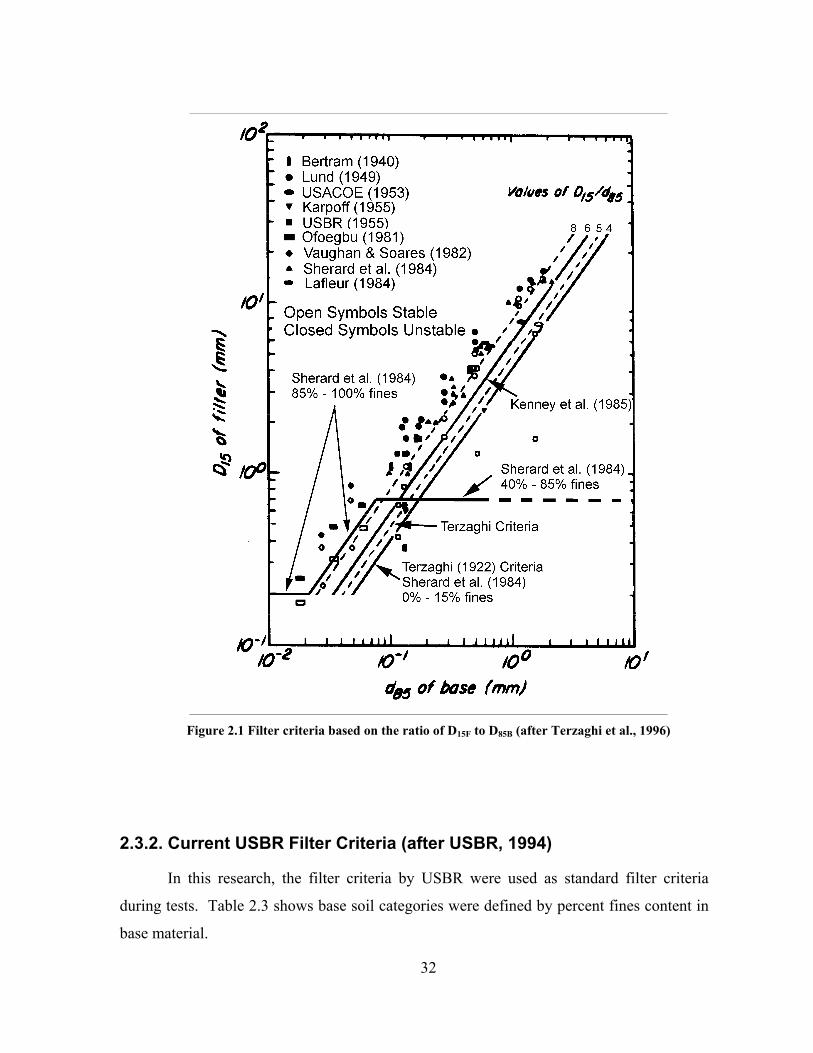
As indicated by Table 2.2, many of the filter criteria are based on the ratio of D15F to
D85B. Plotting the logarithm of D15F versus the logarithm of D85B allows a visual comparison
of some of these filter criteria, as well as an assessment of the applicability of the criteria to
the data collected. This plot is shown in Figure 2.1.
32
Figure 2.1 Filter criteria based on the ratio of D15F to D85B (after Terzaghi et al., 1996)
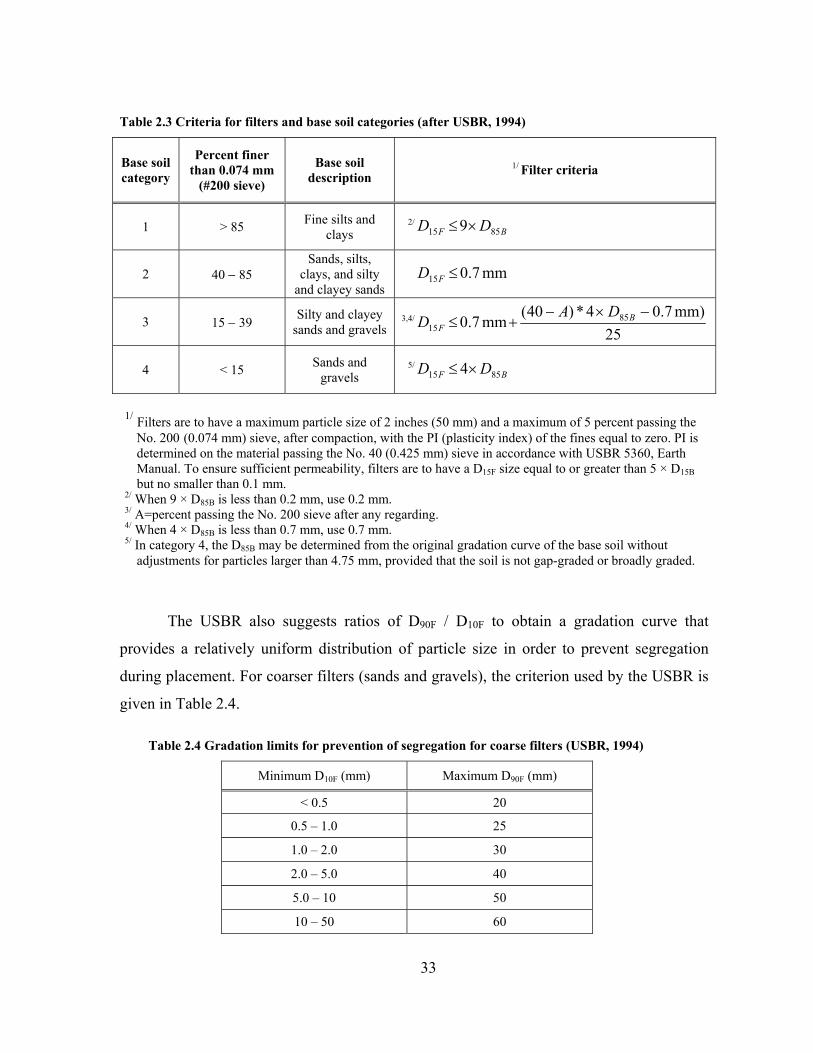
2.3.2. Current USBR Filter Criteria (after USBR, 1994)
In this research, the filter criteria by USBR were used as standard filter criteria
during tests. Table 2.3 shows base soil categories were defined by percent fines content in
base material.
33
Table 2.3 Criteria for filters and base soil categories (after USBR, 1994)
Base soil category
Percent finer than 0.074 mm
(#200 sieve)
Base soil description
1/ Filter criteria
1 > 85 Fine silts and clays
2/BF DD 8515 9×≤
2 40 − 85 Sands, silts,
clays, and silty and clayey sands
mm7.015 ≤FD
3 15 − 39 Silty and clayey sands and gravels
3,4/
25)mm7.04*)40(
mm7.0 8515
−×−+≤ B
FDA
D
4 < 15 Sands and gravels
5/BF DD 8515 4×≤
The USBR also suggests ratios of D90F / D10F to obtain a gradation curve that
provides a relatively uniform distribution of particle size in order to prevent segregation
during placement. For coarser filters (sands and gravels), the criterion used by the USBR is
given in Table 2.4.
Table 2.4 Gradation limits for prevention of segregation for coarse filters (USBR, 1994)
Minimum D10F (mm) Maximum D90F (mm)
< 0.5 20
0.5 – 1.0 25
1.0 – 2.0 30
2.0 – 5.0 40
5.0 – 10 50
10 – 50 60
1/ Filters are to have a maximum particle size of 2 inches (50 mm) and a maximum of 5 percent passing the No. 200 (0.074 mm) sieve, after compaction, with the PI (plasticity index) of the fines equal to zero. PI is determined on the material passing the No. 40 (0.425 mm) sieve in accordance with USBR 5360, Earth Manual. To ensure sufficient permeability, filters are to have a D15F size equal to or greater than 5 × D15B but no smaller than 0.1 mm.
2/ When 9 × D85B is less than 0.2 mm, use 0.2 mm. 3/ A=percent passing the No. 200 sieve after any regarding. 4/ When 4 × D85B is less than 0.7 mm, use 0.7 mm. 5/ In category 4, the D85B may be determined from the original gradation curve of the base soil without
adjustments for particles larger than 4.75 mm, provided that the soil is not gap-graded or broadly graded.
34
Chapter 3. Filter Test Concept
3.1. Introduction
The objective of this research was to determine under what conditions distressed
filters will be able to prevent erosion of base materials. The major focus of the investigation
was development of test equipment and procedures to investigate the ability of filters to
prevent erosion of cracked base materials, even if the filter initially contains a crack.
Sherard and his colleagues performed pinhole tests to investigate a similar phenomenon.
The major differences between this research and Sherard's studies were (1) cracks rather
than pinholes were used to simulate more closely what may occur in the field, and (2) the
cracks extended through the filter as well as the base. The test specimens were compacted
in filter test devices of two sizes, with pre-formed cracks between the soil and the wall of
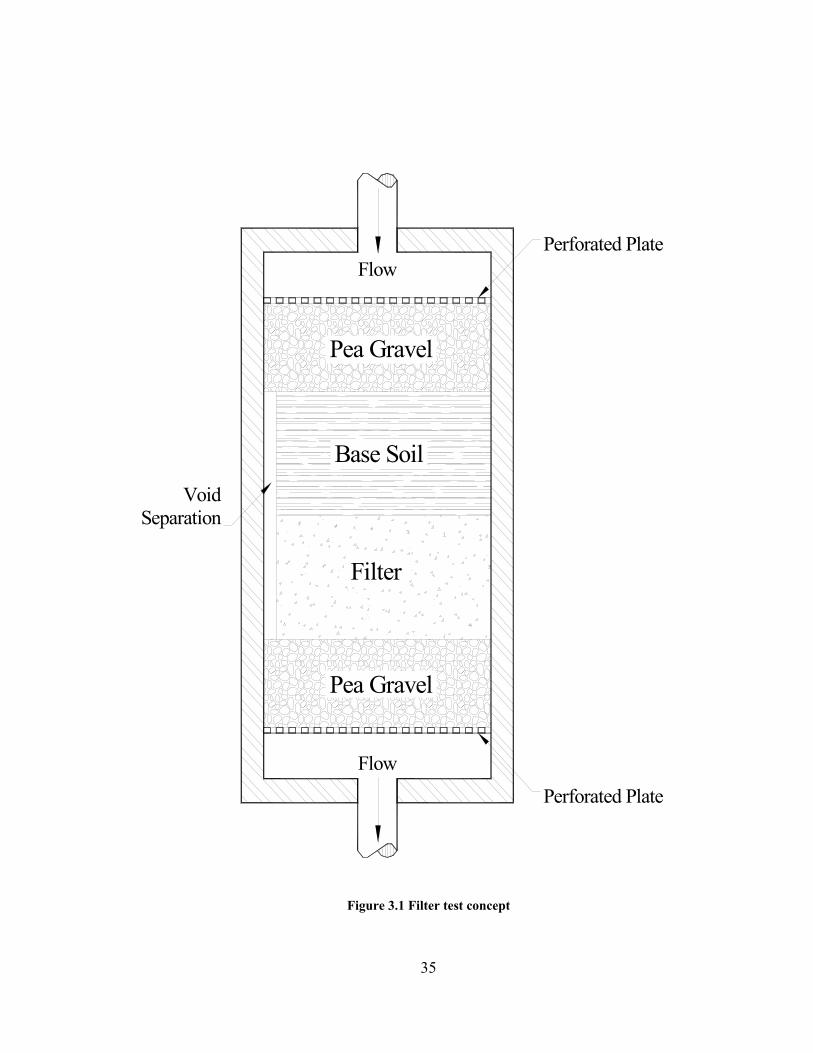
the test devices, as shown in Figure 3.1. The basic technique employed in these tests was to
perform experiments wherein the specimens were subjected to flow of water through the
pre-formed cracks, and to determine by observation whether the filter was able to collapse,
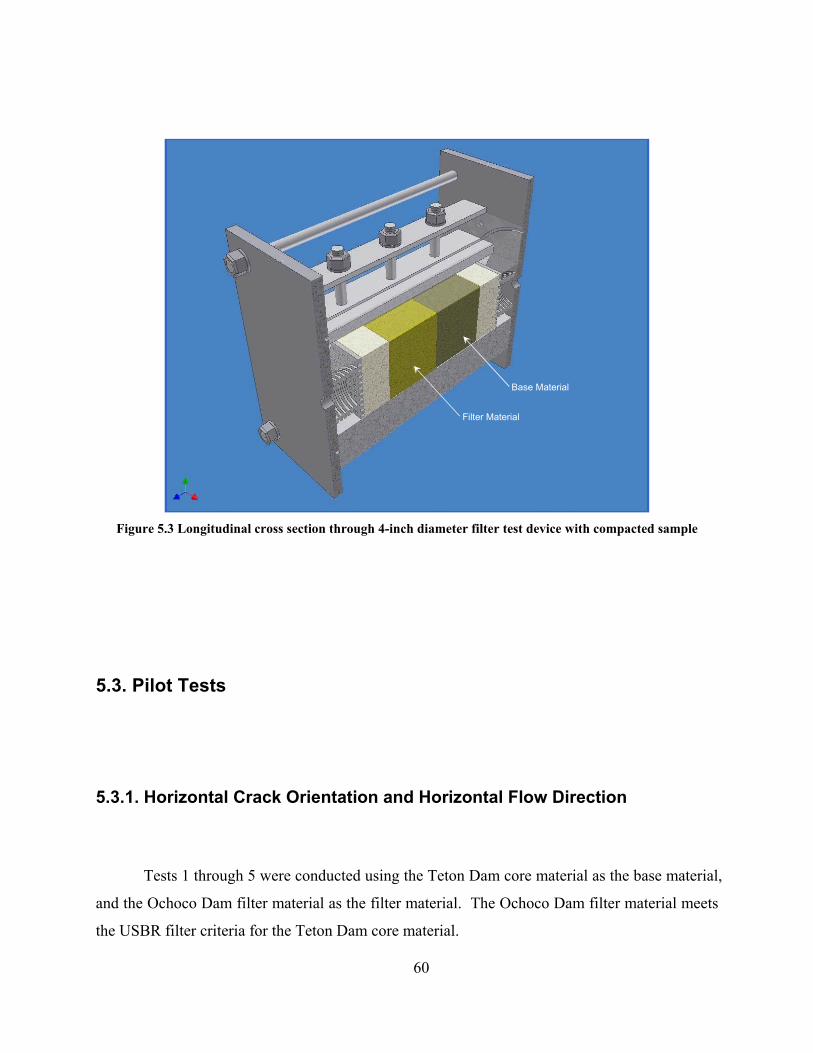
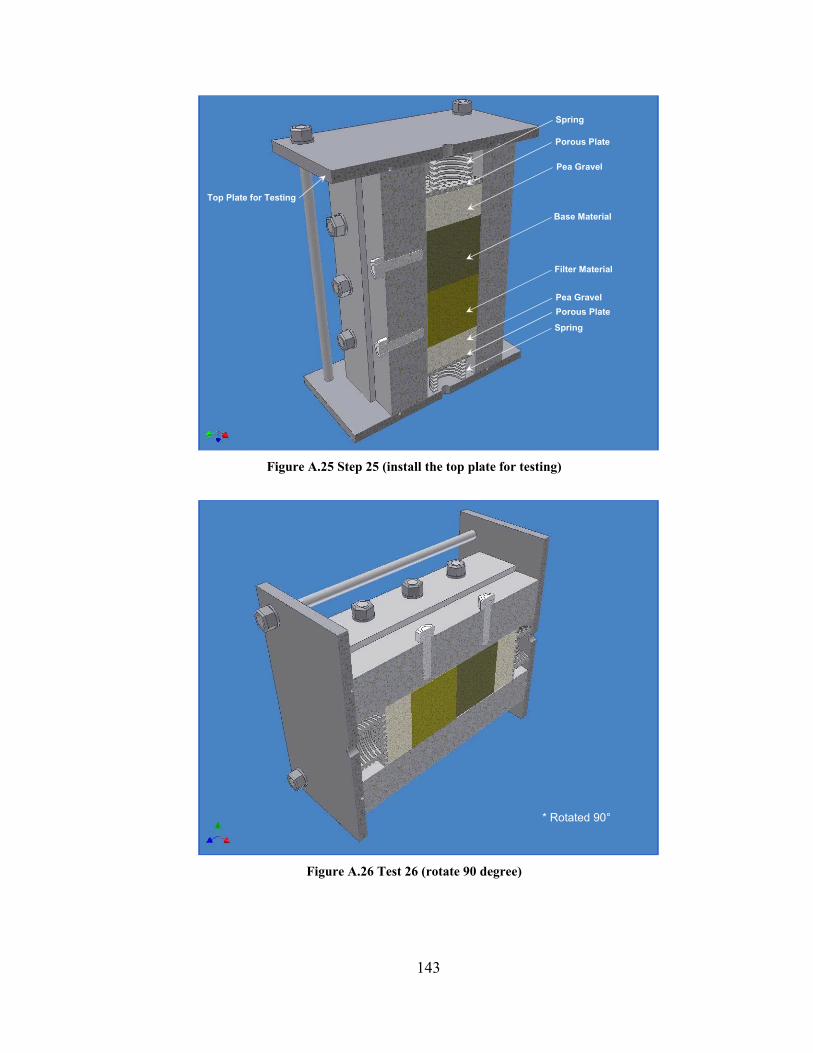
close the crack, and retain the base soil.
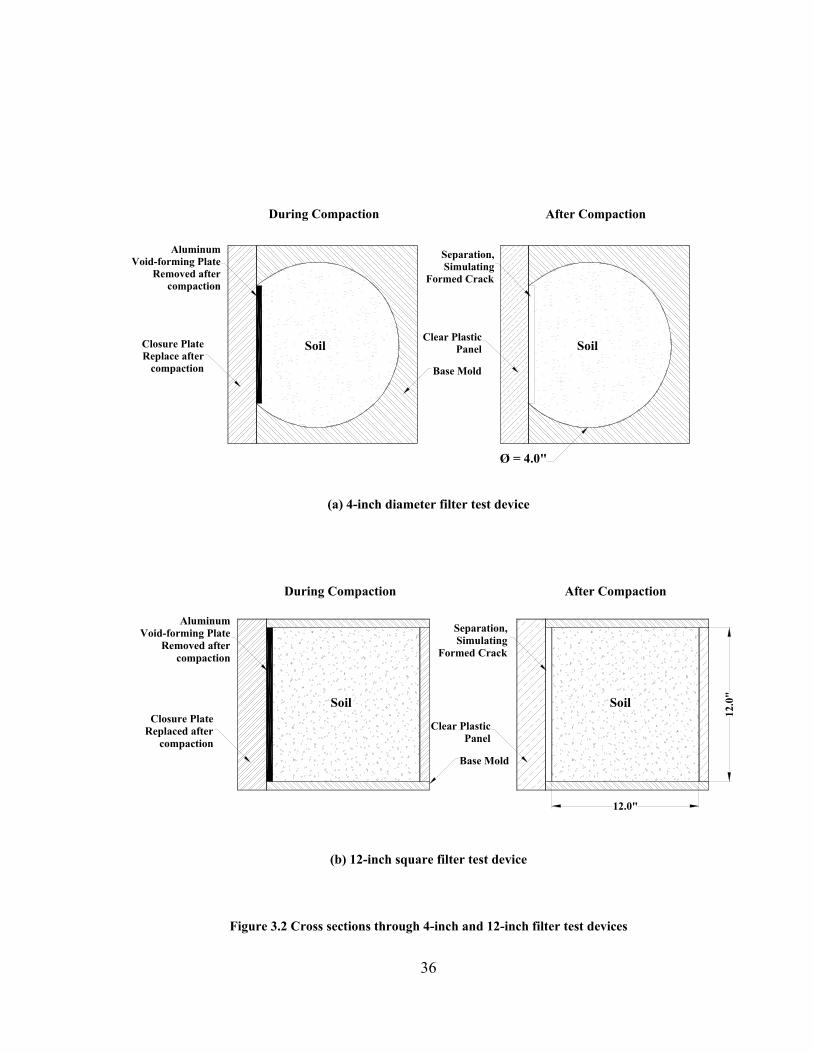
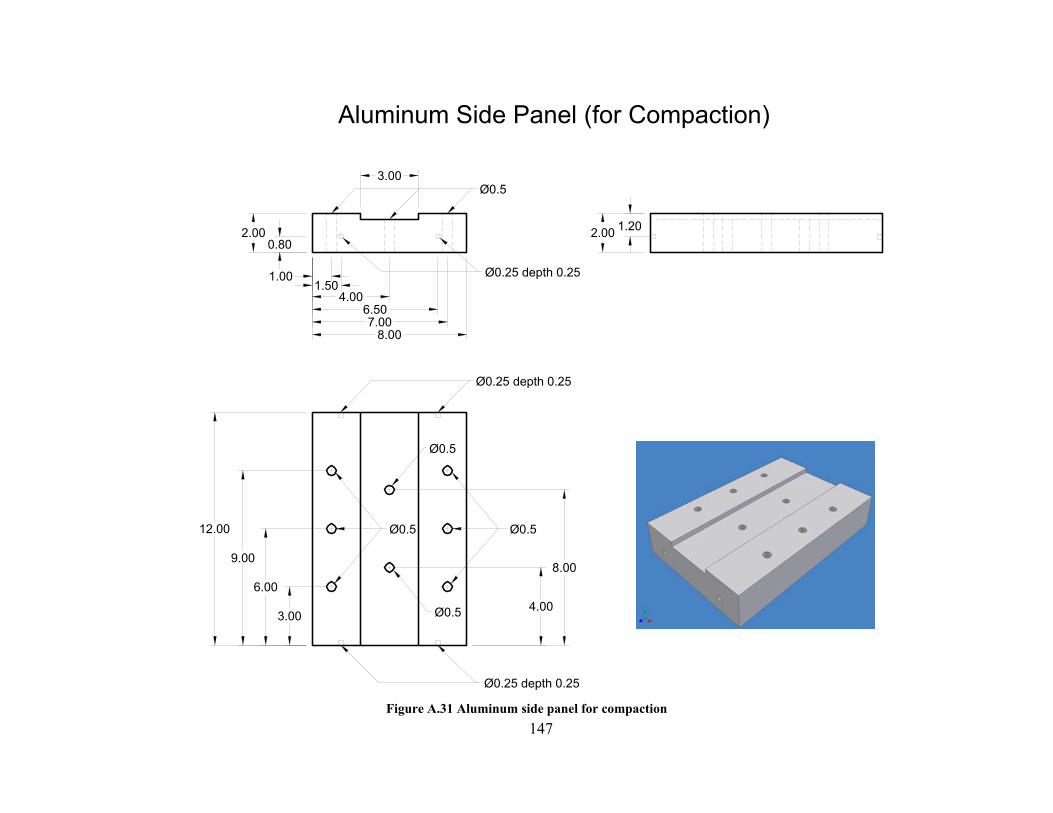
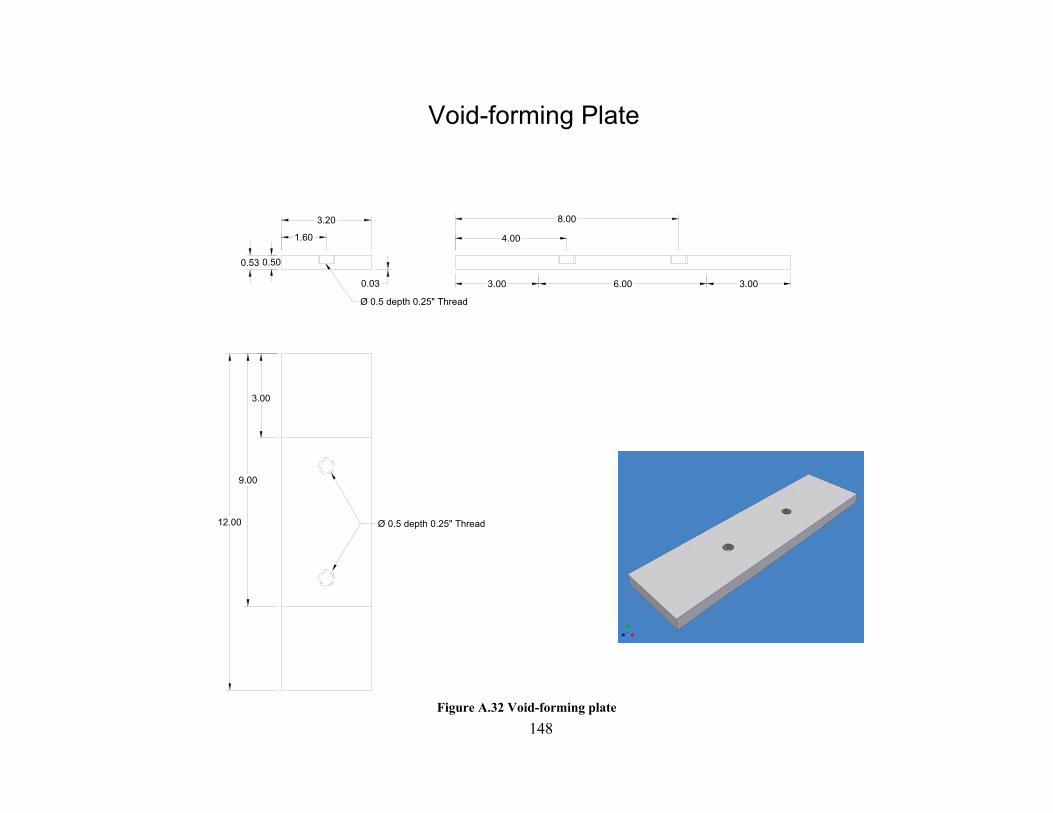
Cross sections through the filter test devices used in this investigation are shown in
Figure 3.2(a) and (b). The aluminum void-forming plates shown in the figures were
removed after compaction to leave a "crack" or void through the base and the filter. Tests of
this type were performed with void-forming plates of various thicknesses with filter
materials containing various quantities of fines, which were compacted to various densities.
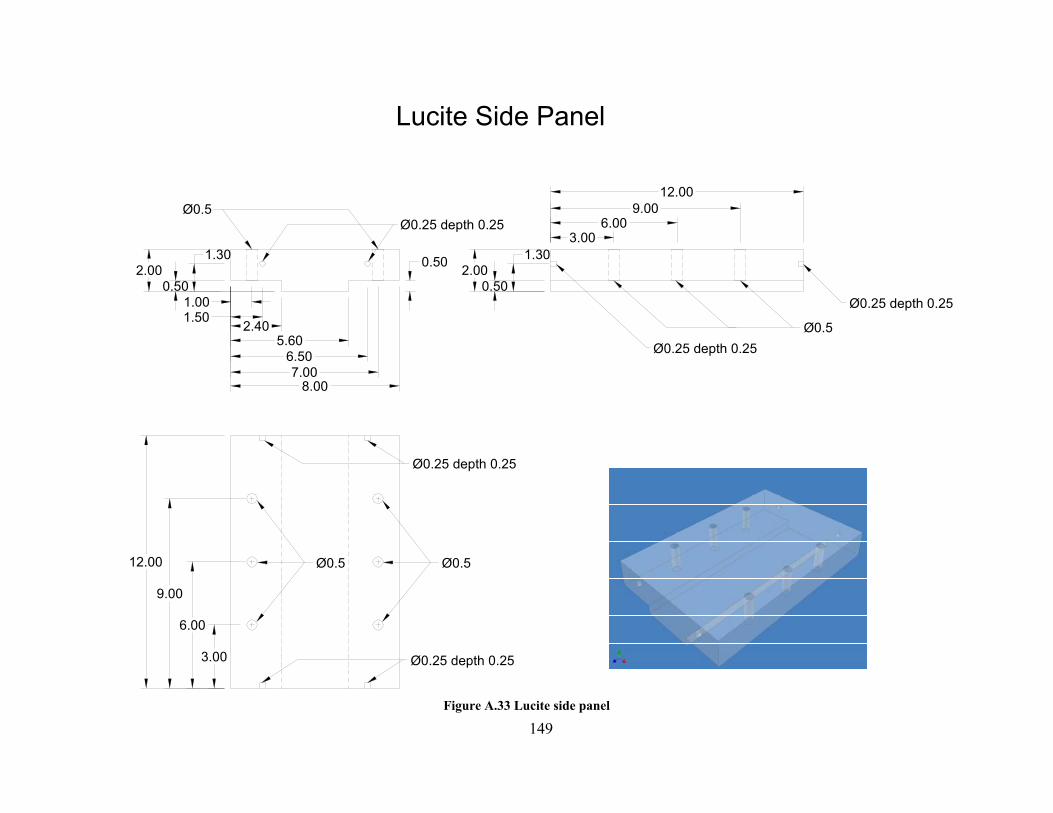
The closure plates were replaced with clear plastic panels after compaction so that
movements of soil particles could be observed.
35
Pea Gravel
Base Soil
Filter
Perforated Plate
Perforated Plate
VoidSeparation
Flow
Flow
Pea Gravel
Figure 3.1 Filter test concept
36
Ø = 4.0"
Closure PlateReplace after
compaction
Soil
During Compaction
Soil
Base Mold
After Compaction
Separation,Simulating
Formed Crack
Clear PlasticPanel
AluminumVoid-forming Plate
Removed aftercompaction
(a) 4-inch diameter filter test device
12.0"
12.0
"
AluminumVoid-forming Plate
Removed aftercompaction
Closure PlateReplaced after
compactionBase Mold
Soil
Separation,Simulating
Formed Crack
Clear PlasticPanel
During Compaction After Compaction
Soil
(b) 12-inch square filter test device
Figure 3.2 Cross sections through 4-inch and 12-inch filter test devices
37
3.2. Water Supply and Data Acquisition Systems
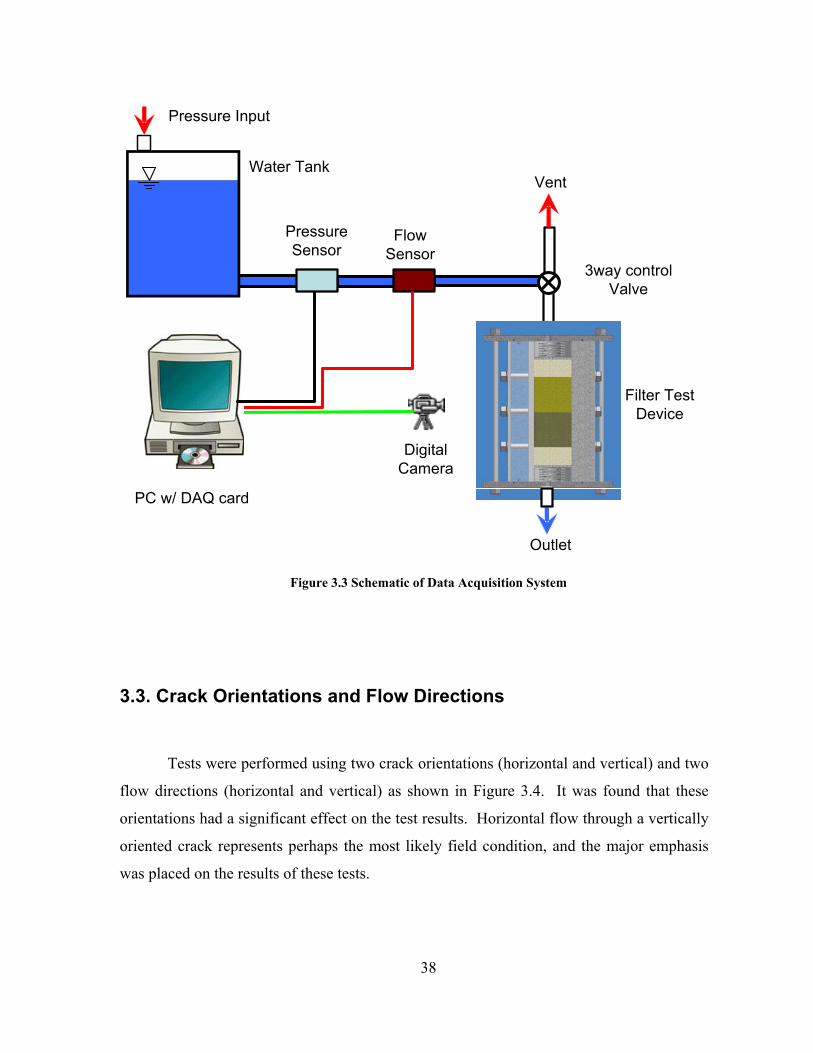
Figure 3.3 shows the water supply and data acquisition systems that were used in
the tests. The measurements made during the tests included pressure, flow, and visual
records in digital movie files. For pressure measurement, a pressure transducer was used. It
was located in the water supply line upstream of the filter device. A turbine type sensor
was used for flow measurement.
Pressurized water was introduced at the upstream ends of the filter test devices
through a three-way control valve. Initial tests were performed using the tap water in the
laboratory as the source of water, controlling the pressure using a water pressure regulator.
However, it proved not to be possible to maintain a constant pressure in this way. To
overcome this difficulty, a water tank pressurized with regulated air pressure was used for
subsequent tests. The pressure at the upstream end of the specimen was maintained at about
5 psi, which corresponds to hydraulic gradients through the base material varying from 39
to 46. The pressure transducer and flow rate sensor were connected to a data acquisition
card in a personal computer. Observations of particle movements and the cloudiness or
clarity of the effluent during the tests were recorded using a digital camera.
38
PressureSensor
FlowSensor
Water Tank
Pressure Input
PC w/ DAQ card
DigitalCamera
Outlet
Filter TestDevice
3way controlValve
Vent
Figure 3.3 Schematic of Data Acquisition System
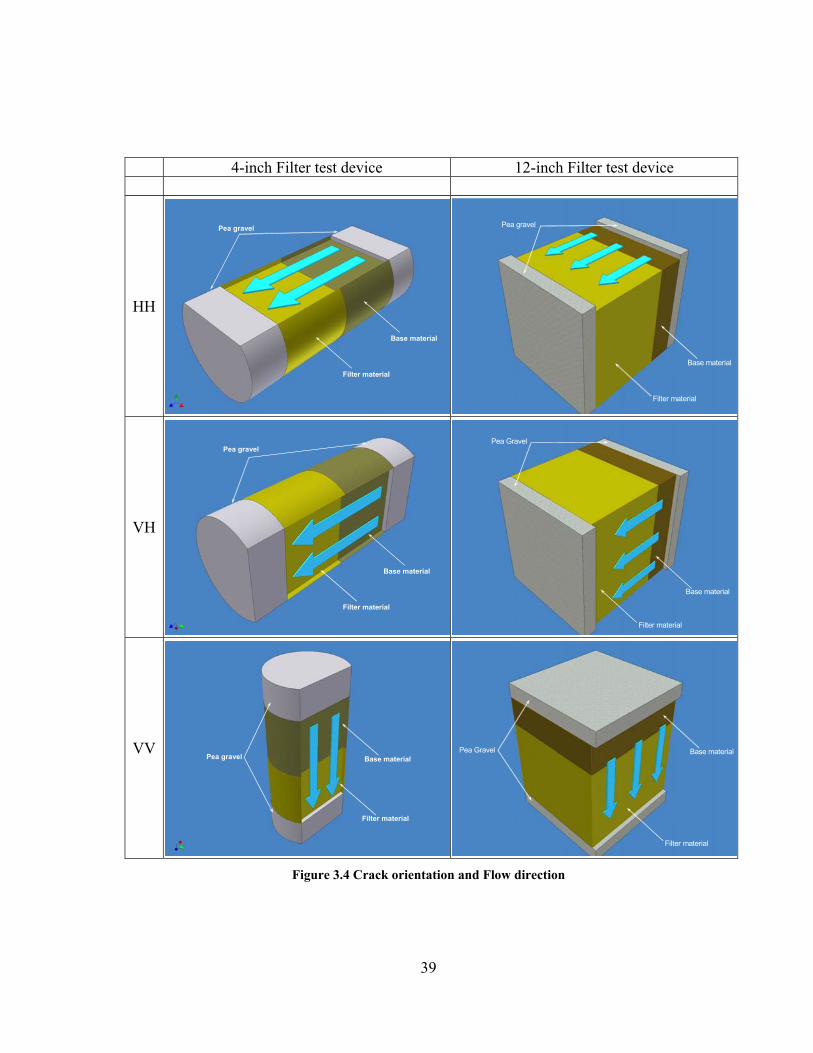
3.3. Crack Orientations and Flow Directions
Tests were performed using two crack orientations (horizontal and vertical) and two
flow directions (horizontal and vertical) as shown in Figure 3.4. It was found that these
orientations had a significant effect on the test results. Horizontal flow through a vertically
oriented crack represents perhaps the most likely field condition, and the major emphasis
was placed on the results of these tests.
39
4-inch Filter test device 12-inch Filter test device
HH
Pea gravel
Filter material
Base material
Pea gravel
Filter material
Base material
VH
Pea gravel
Filter material
Base material
Side material
Filter material
Base material
Pea Gravel
Filter material
Base material
VV Pea gravel
Filter material
Base material
Side material
Filter material
Base material
Pea Gravel
Filter material
Base material
Figure 3.4 Crack orientation and Flow direction
40
3.4. Clogging Mechanism
By observing particle movements through the Lucite side panels during the tests, it
was possible to understand the clogging mechanism through which an initially cracked
filter is able to collapse and stop erosion of a cracked base. The mechanism is illustrated in
Figures 3.5(a) through 3.5(d).
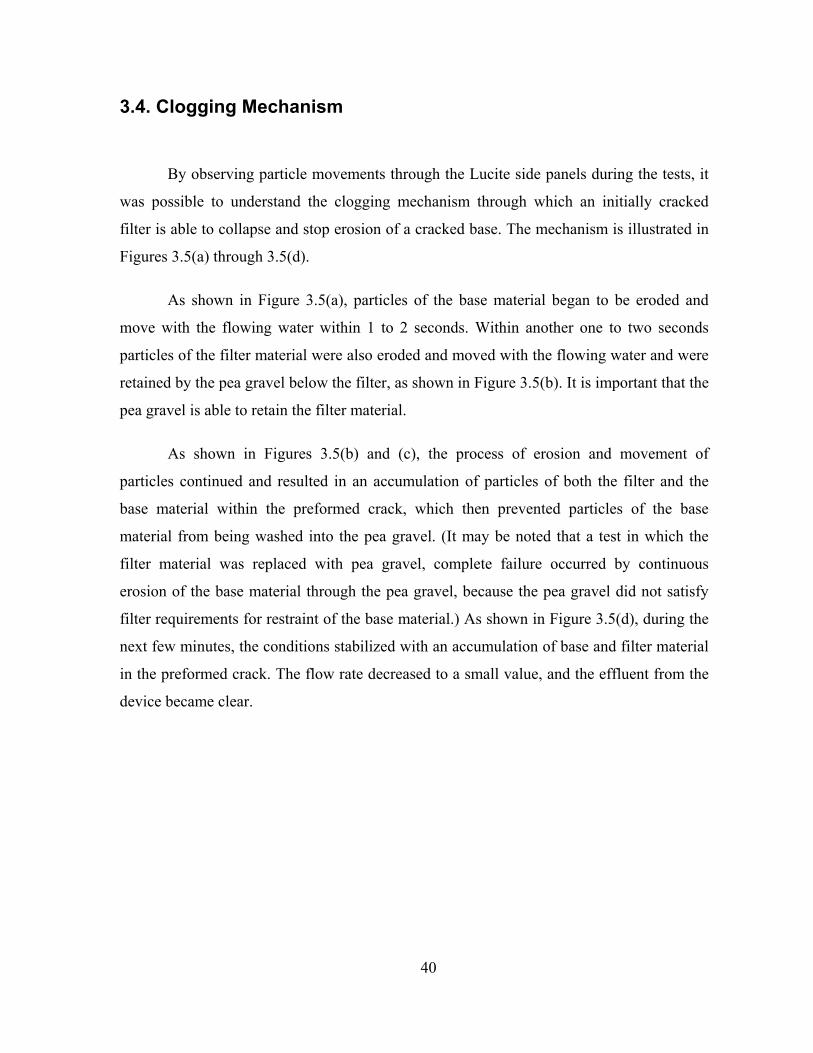
As shown in Figure 3.5(a), particles of the base material began to be eroded and
move with the flowing water within 1 to 2 seconds. Within another one to two seconds
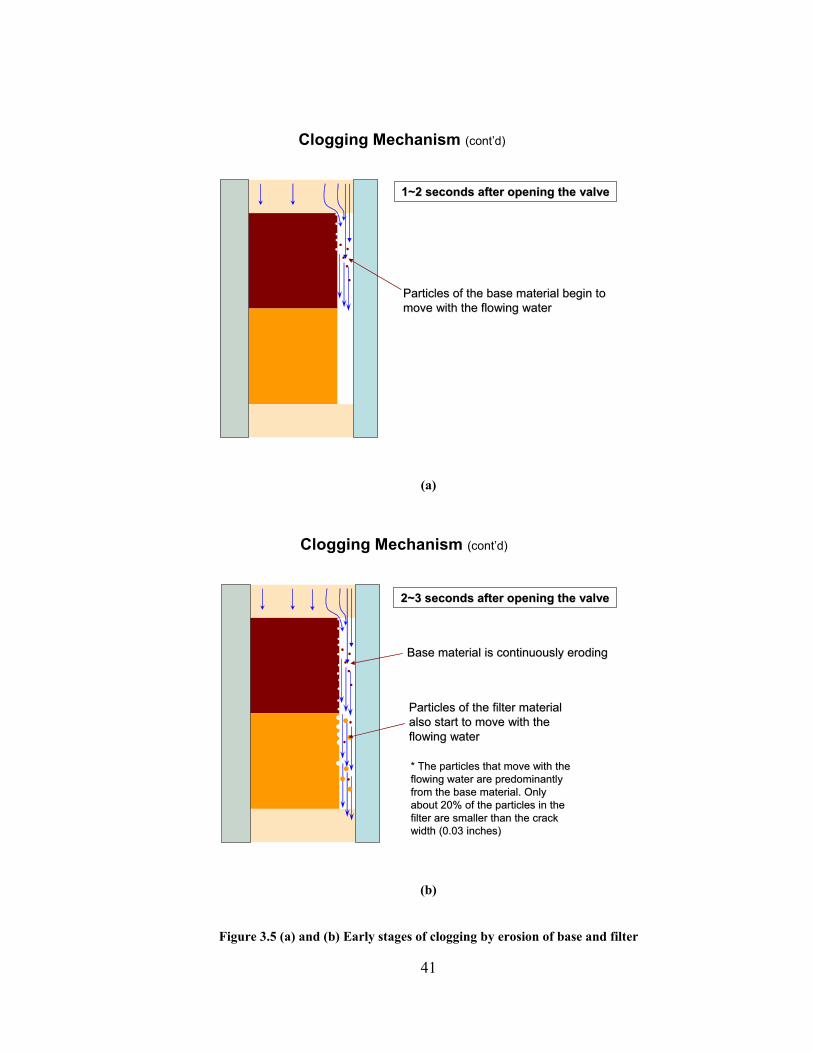
particles of the filter material were also eroded and moved with the flowing water and were
retained by the pea gravel below the filter, as shown in Figure 3.5(b). It is important that the
pea gravel is able to retain the filter material.
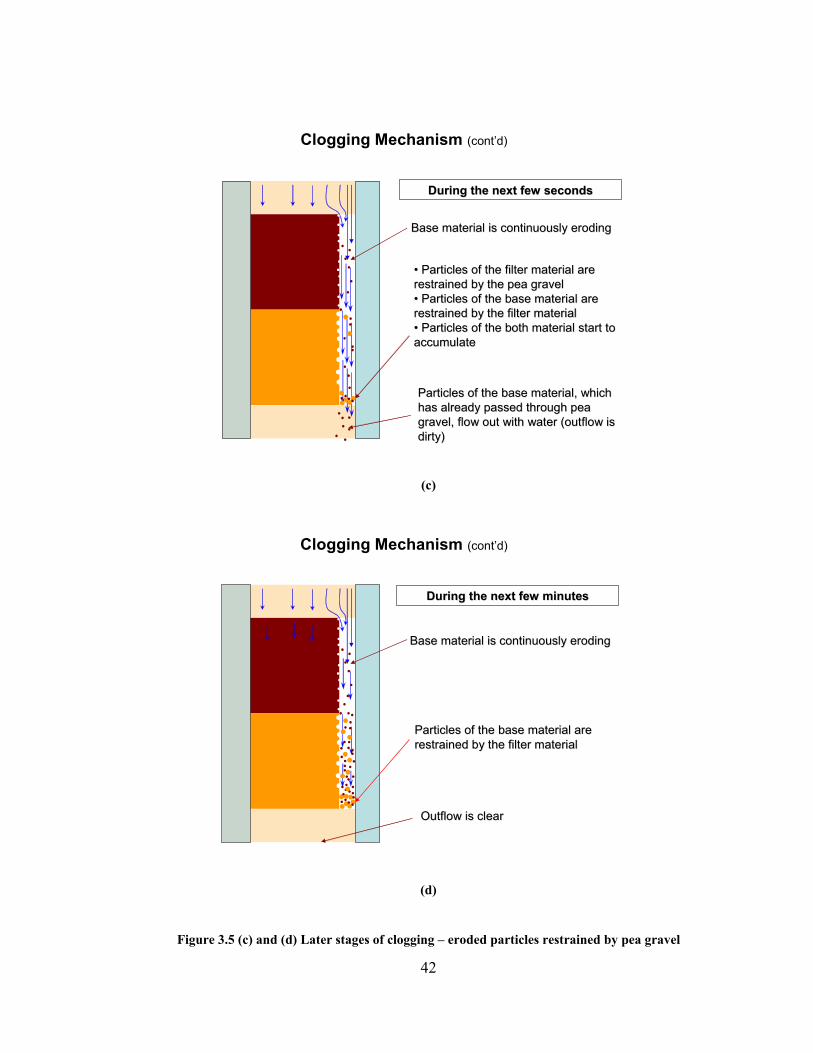
As shown in Figures 3.5(b) and (c), the process of erosion and movement of
particles continued and resulted in an accumulation of particles of both the filter and the
base material within the preformed crack, which then prevented particles of the base
material from being washed into the pea gravel. (It may be noted that a test in which the
filter material was replaced with pea gravel, complete failure occurred by continuous
erosion of the base material through the pea gravel, because the pea gravel did not satisfy
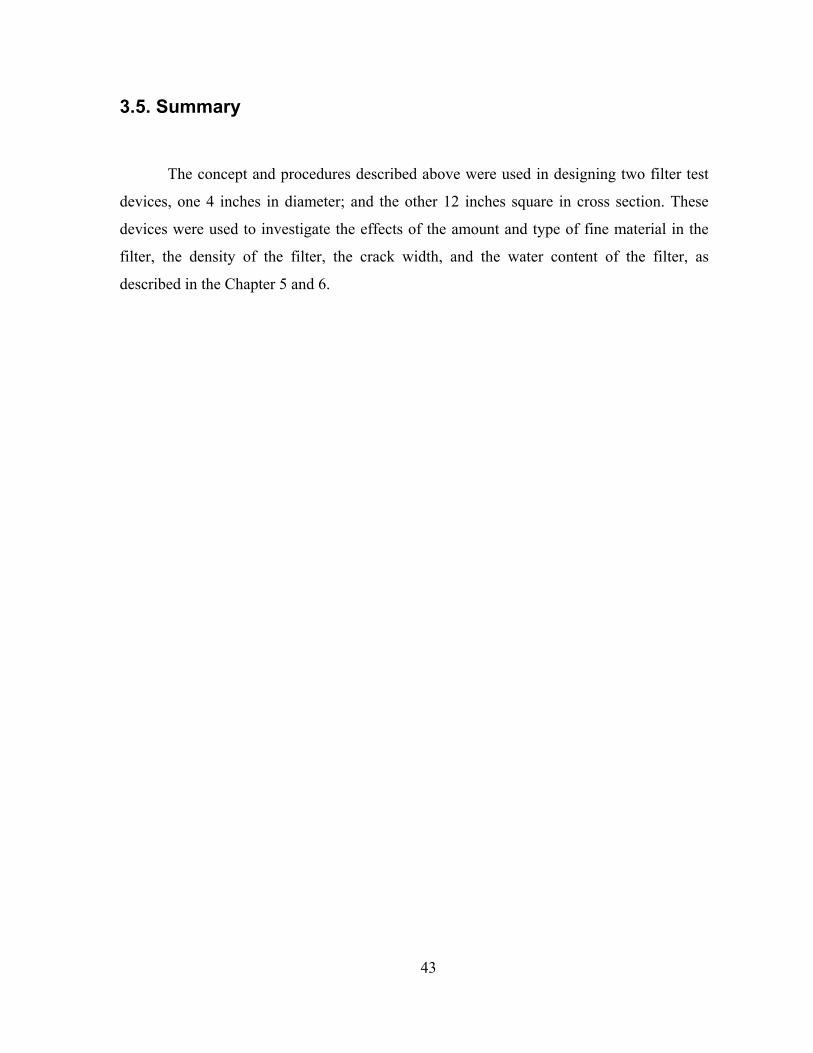
filter requirements for restraint of the base material.) As shown in Figure 3.5(d), during the
next few minutes, the conditions stabilized with an accumulation of base and filter material
in the preformed crack. The flow rate decreased to a small value, and the effluent from the
device became clear.
41
Clogging Mechanism (cont’d)
1~2 seconds after opening the valve1~2 seconds after opening the valve
Particles of the base material begin to Particles of the base material begin to move with the flowing watermove with the flowing water
(a)
Clogging Mechanism (cont’d)
2~3 seconds after opening the valve2~3 seconds after opening the valve
Base material is continuously erodingBase material is continuously eroding
Particles of the filter material Particles of the filter material also start to move with the also start to move with the flowing waterflowing water
* The particles that move with the * The particles that move with the flowing water are predominantly flowing water are predominantly from the base material. Only from the base material. Only about 20% of the particles in the about 20% of the particles in the filter are smaller than the crack filter are smaller than the crack width (0.03 inches)width (0.03 inches)
(b)
Figure 3.5 (a) and (b) Early stages of clogging by erosion of base and filter
42
Clogging Mechanism (cont’d)
During the next few secondsDuring the next few seconds
Base material is continuously erodingBase material is continuously eroding
•• Particles of the filter material are Particles of the filter material are restrained by the pea gravelrestrained by the pea gravel•• Particles of the base material are Particles of the base material are restrained by the filter materialrestrained by the filter material•• Particles of the both material start to Particles of the both material start to accumulate accumulate
Particles of the base material, which Particles of the base material, which has already passed through pea has already passed through pea gravel, flow out with water (outflow is gravel, flow out with water (outflow is dirty)dirty)
(c)
Clogging Mechanism (cont’d)
During the next few minutesDuring the next few minutes
Base material is continuously erodingBase material is continuously eroding
Particles of the base material are Particles of the base material are restrained by the filter materialrestrained by the filter material
Outflow is clearOutflow is clear
(d)
Figure 3.5 (c) and (d) Later stages of clogging – eroded particles restrained by pea gravel
43
3.5. Summary
The concept and procedures described above were used in designing two filter test
devices, one 4 inches in diameter; and the other 12 inches square in cross section. These
devices were used to investigate the effects of the amount and type of fine material in the
filter, the density of the filter, the crack width, and the water content of the filter, as
described in the Chapter 5 and 6.
44
Chapter 4. Materials Tested
4.1. Introduction
Index and property tests were conducted on the base and filter materials used in the
filter tests. These tests included the following:
• Specific Gravity
• Grain size distribution (sieve and hydrometer)
• Atterberg Limits
• Standard Proctor compaction test
• Consolidated-Undrained triaxial tests
• Flexible wall permeability tests
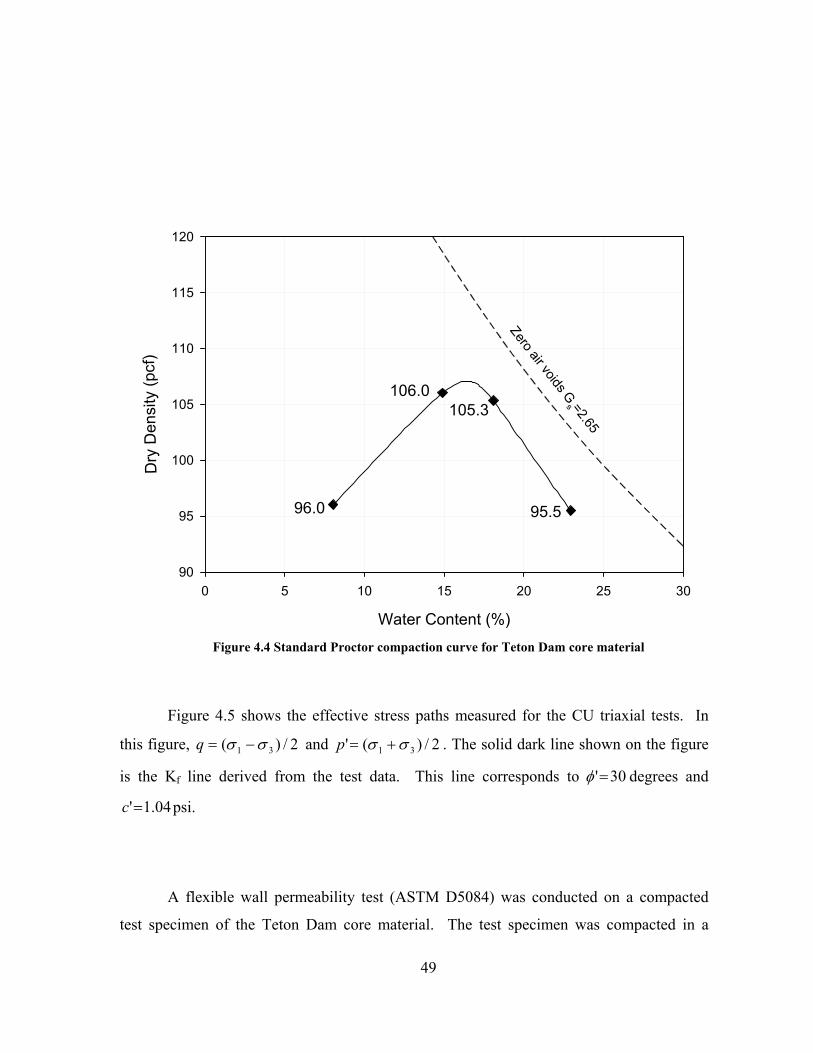
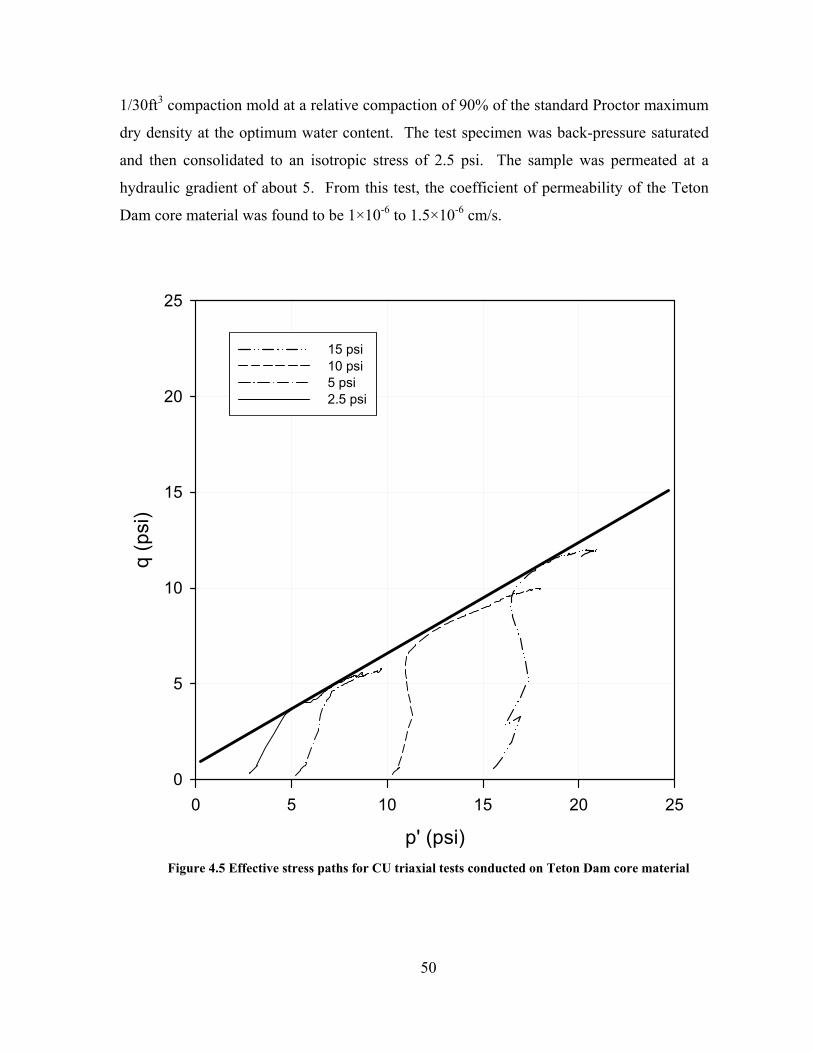
4.2. Tests on Teton Dam Core Material (Base Material)
Specific gravity tests were conducted in accordance with ASTM D854. A value of
specific gravity, Gs, equal to 2.699 was determined for the Teton Dam core material. The
value of specific gravity was required in order to reduce the hydrometer test data.
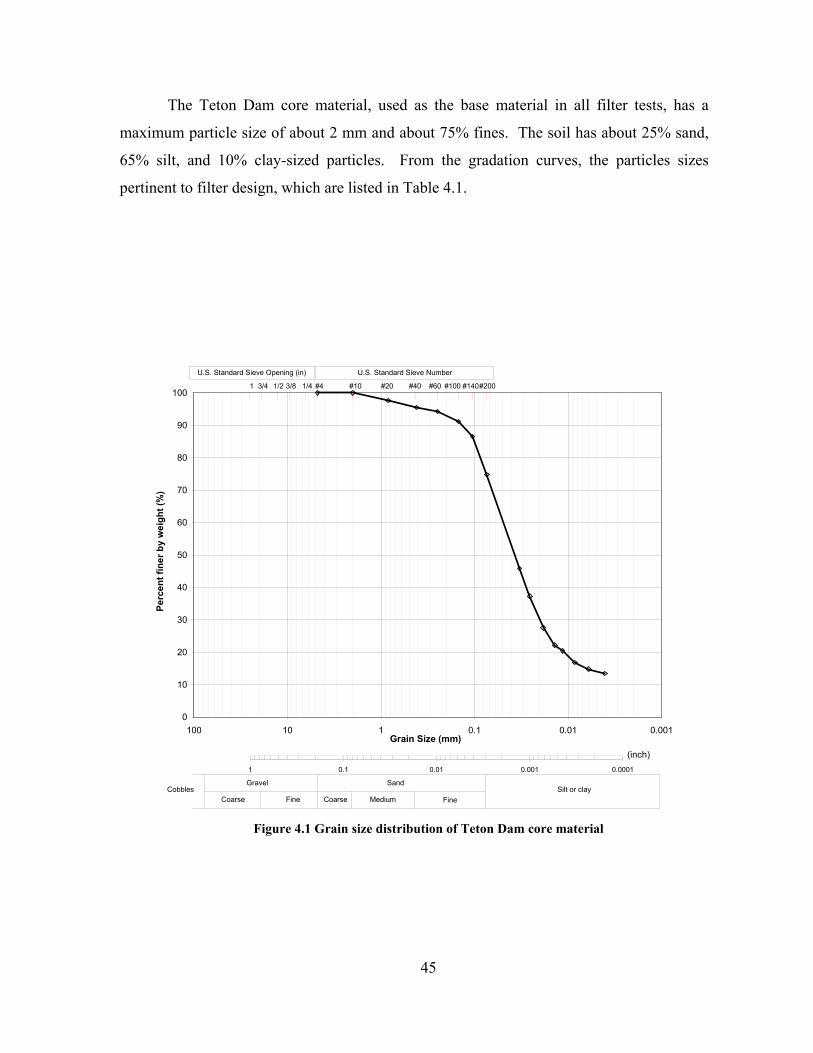
The grain size distribution was determined using sieve and hydrometer tests in
accordance with ASTM D422. The test specimen was first passed through at #10 sieve,
and the material passing was subjected to a hydrometer analysis. After the hydrometer test
was concluded, the entire test specimen was washed over a #200 sieve, and a sieve analysis
was conducted on the material that was retained after the washing process. The grain size
distribution of the Teton Dam core material is shown in Figure 4.1.
45
The Teton Dam core material, used as the base material in all filter tests, has a
maximum particle size of about 2 mm and about 75% fines. The soil has about 25% sand,
65% silt, and 10% clay-sized particles. From the gradation curves, the particles sizes
pertinent to filter design, which are listed in Table 4.1.
0
10
20
30
40
50
60
70
80
90
100
0.0010.010.1110100Grain Size (mm)
Perc
ent f
iner
by
wei
ght (
%)
0.00010.0010.010.11
Gravel
Coarse Fine Coarse FineMedium
SandSilt or clayCobbles
#10 #20 #40 #60 #100 #140#200#4
U.S. Standard Sieve Number
1/43/81/23/41
U.S. Standard Sieve Opening (in)
(inch)
Figure 4.1 Grain size distribution of Teton Dam core material
46
Table 4.1 Particle size diameters corresponding to different size fractions for Teton Dam core material
Percent passing Diameter (mm)
90 0.140
60 0.033
30 0.020
15 0.006
10 ≈0.001
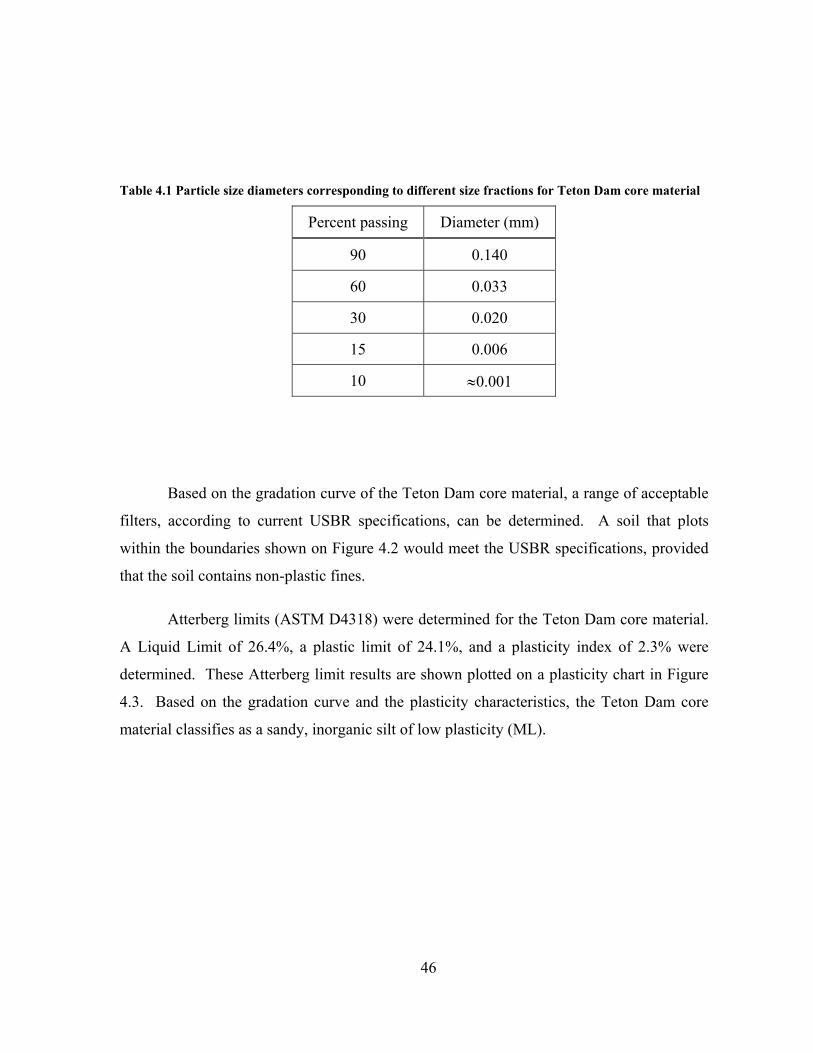
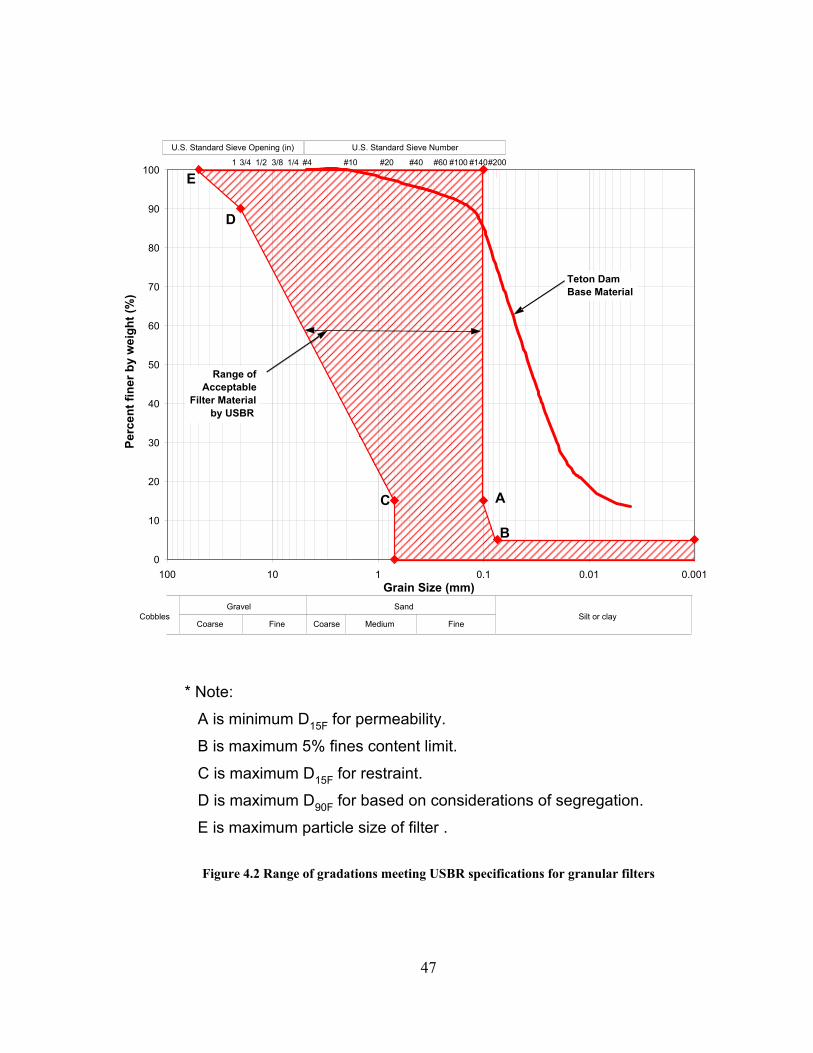
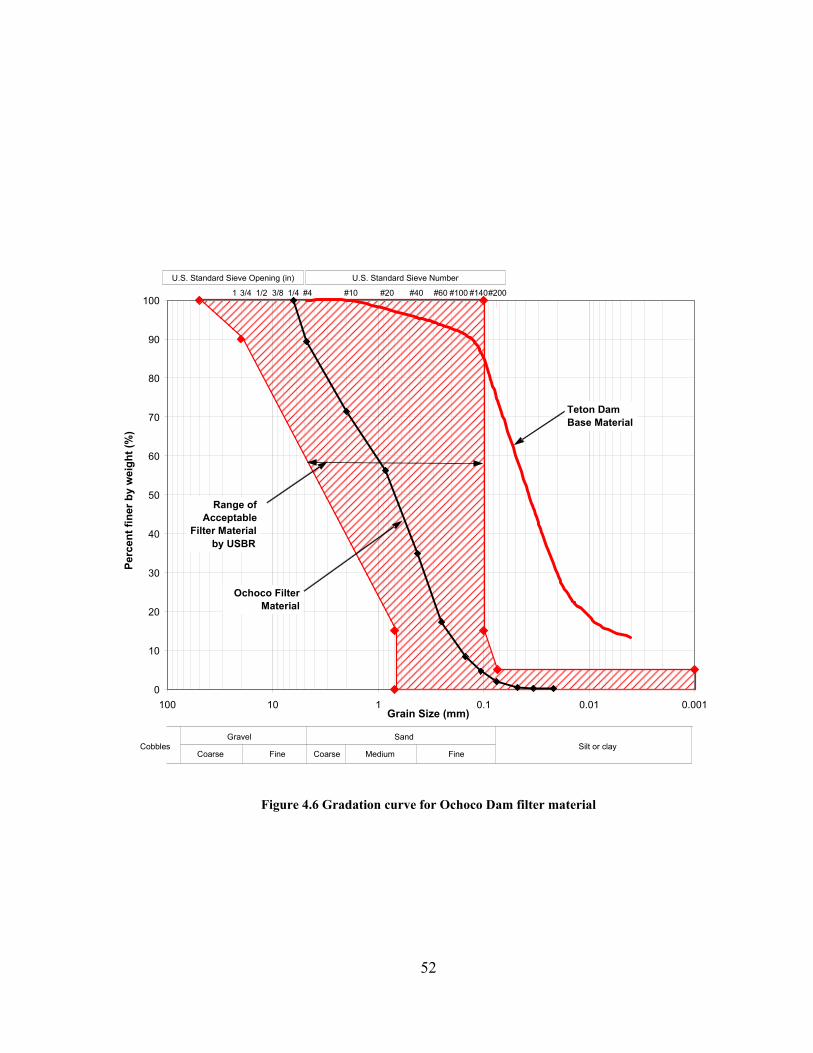
Based on the gradation curve of the Teton Dam core material, a range of acceptable
filters, according to current USBR specifications, can be determined. A soil that plots
within the boundaries shown on Figure 4.2 would meet the USBR specifications, provided
that the soil contains non-plastic fines.
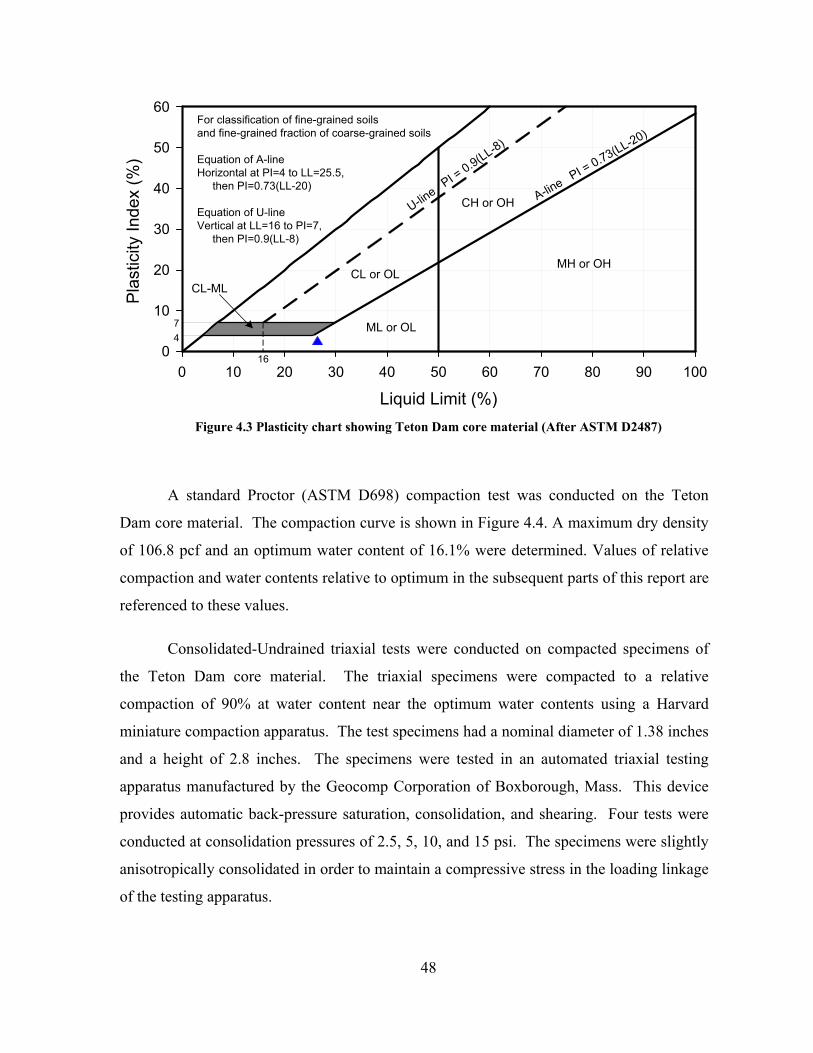
Atterberg limits (ASTM D4318) were determined for the Teton Dam core material.
A Liquid Limit of 26.4%, a plastic limit of 24.1%, and a plasticity index of 2.3% were
determined. These Atterberg limit results are shown plotted on a plasticity chart in Figure
4.3. Based on the gradation curve and the plasticity characteristics, the Teton Dam core
material classifies as a sandy, inorganic silt of low plasticity (ML).
47
0
10
20
30
40
50
60
70
80
90
100
0.0010.010.1110100Grain Size (mm)
Perc
ent f
iner
by
wei
ght (
%)
Gravel
Coarse Fine Coarse FineMedium
SandSilt or clayCobbles
#10 #20 #40 #60 #100 #140#200#4
U.S. Standard Sieve Number
1/43/81/23/41
U.S. Standard Sieve Opening (in)
Teton DamBase Material
Range ofAcceptable
Filter Material
A
B
C
D
E
by USBR
* Note:
A is minimum D15F for permeability.
B is maximum 5% fines content limit.
C is maximum D15F for restraint.
D is maximum D90F for based on considerations of segregation.
E is maximum particle size of filter .
Figure 4.2 Range of gradations meeting USBR specifications for granular filters
48
47
Liquid Limit (%)0 10 20 30 40 50 60 70 80 90 100
Pla
stic
ity In
dex
(%)
0
10
20
30
40
50
60
16
MH or OH
ML or OL
CH or OH
CL or OLCL-ML
U-line P
I = 0.9(LL-8)
A-line PI = 0.73(LL-20)
For classification of fine-grained soilsand fine-grained fraction of coarse-grained soils
Equation of A-lineHorizontal at PI=4 to LL=25.5, then PI=0.73(LL-20)
Equation of U-lineVertical at LL=16 to PI=7, then PI=0.9(LL-8)
Figure 4.3 Plasticity chart showing Teton Dam core material (After ASTM D2487)
A standard Proctor (ASTM D698) compaction test was conducted on the Teton
Dam core material. The compaction curve is shown in Figure 4.4. A maximum dry density
of 106.8 pcf and an optimum water content of 16.1% were determined. Values of relative
compaction and water contents relative to optimum in the subsequent parts of this report are
referenced to these values.
Consolidated-Undrained triaxial tests were conducted on compacted specimens of
the Teton Dam core material. The triaxial specimens were compacted to a relative
compaction of 90% at water content near the optimum water contents using a Harvard
miniature compaction apparatus. The test specimens had a nominal diameter of 1.38 inches
and a height of 2.8 inches. The specimens were tested in an automated triaxial testing
apparatus manufactured by the Geocomp Corporation of Boxborough, Mass. This device
provides automatic back-pressure saturation, consolidation, and shearing. Four tests were
conducted at consolidation pressures of 2.5, 5, 10, and 15 psi. The specimens were slightly
anisotropically consolidated in order to maintain a compressive stress in the loading linkage
of the testing apparatus.
49
Water Content (%)
0 5 10 15 20 25 30
Dry
Den
sity
(pcf
)
90
95
100
105
110
115
120
Zero air voids Gs =2.65
96.0
106.0105.3
95.5
Figure 4.4 Standard Proctor compaction curve for Teton Dam core material
Figure 4.5 shows the effective stress paths measured for the CU triaxial tests. In
this figure, 2/)( 31 σσ −=q and 2/)(' 31 σσ +=p . The solid dark line shown on the figure
is the Kf line derived from the test data. This line corresponds to 30'=φ degrees and
04.1'=c psi.
A flexible wall permeability test (ASTM D5084) was conducted on a compacted
test specimen of the Teton Dam core material. The test specimen was compacted in a
50
1/30ft3 compaction mold at a relative compaction of 90% of the standard Proctor maximum
dry density at the optimum water content. The test specimen was back-pressure saturated
and then consolidated to an isotropic stress of 2.5 psi. The sample was permeated at a
hydraulic gradient of about 5. From this test, the coefficient of permeability of the Teton
Dam core material was found to be 1×10⁻⁶ to 1.5×10⁻⁶ cm/s.
p' (psi)
0 5 10 15 20 25
q (p
si)
0
5
10
15
20
25
15 psi10 psi5 psi2.5 psi
Figure 4.5 Effective stress paths for CU triaxial tests conducted on Teton Dam core material
51
4.3. Tests on Filter Material
Various filter materials were used in this research. The initial tests (Tests 1 through
5) used the filter soil from the Ochoco Dam that was provided by the USBR. Tests 7 and 8
used a filter material fabricated from commercially-available quartz sands. Tests 9 through
12 used the Ochoco filter material, and the remaining tests used the Horsetooth Dam filter
material.
A sieve analysis was performed on the Ochoco Dam filter material and the
gradation curve is shown in Figure 4.6. This material, in the as-delivered condition, would
meet the USBR filter criteria for a filter for the Teton Dam core material, and was used for
the first series of tests to troubleshoot the testing apparatus.
The production tests were conducted using the Horsetooth Dam filter material. A
gradation curve for this filter is shown in Figure 4.7. As delivered, this soil contained 4%
fines, and met the criteria for a filter material for the Teton Dam base material. The
Horsetooth Dam filter soil was split on different size sieves, and recombined to form test
specimens having 0%, 5%, and 15% fines. The gradation curves for these specimens are
also shown in Figure 4.7. The plot shows both the as-delivered gradation curve, and the
gradation curves of the recombined test specimens.
Maximum and minimum density tests (ASTM D4253 and ASTM D4254) were
conducted on the Horsetooth Dam filter soil with different fines contents. The maximum
and minimum densities that were measured are given in Table 4.2.
52
0
10
20
30
40
50
60
70
80
90
100
0.0010.010.1110100Grain Size (mm)
Perc
ent f
iner
by
wei
ght (
%)
Gravel
Coarse Fine Coarse FineMedium
SandSilt or clayCobbles
#10 #20 #40 #60 #100 #140#200#4
U.S. Standard Sieve Number
1/43/81/23/41
U.S. Standard Sieve Opening (in)
Teton DamBase Material
Range ofAcceptable
Filter Material
Ochoco FilterMaterial
by USBR
Figure 4.6 Gradation curve for Ochoco Dam filter material
53
0
10
20
30
40
50
60
70
80
90
100
0.0010.010.1110100Grain Size (mm)
Perc
ent f
iner
by
wei
ght (
%)
Gravel
Coarse Fine Coarse FineMedium
SandSilt or clayCobbles
#10 #20 #40 #60 #100 #140#200#4
U.S. Standard Sieve Number
1/43/81/23/41
U.S. Standard Sieve Opening (in)
Teton DamBase Material
Range ofAcceptable
Filter Materialby USBR
Mixed 5% non-plastic fines with #200 retained Horsetooth Dam filter material
Mixed 10% non-plastic fines with #200 retained Horsetooth Dam filter material
Mixed 15% non-plastic fines with #200 retained Horsetooth Dam filter material
Original Horsetooth Dam filter material
Figure 4.7 Gradation curves for Horsetooth Dam filter material
54
Table 4.2 Results of Maximum and Minimum density tests
% Fines Maximum Density γdmax (pcf)
Minimum Density γdmin (pcf)
0 120.7 100.2
5 125.5 103.3
15 131.1 107.8
A standard Proctor compaction test (ASTM D698) was conducted on the Horsetooth
material with 0% and 5% fines in order to compare relative compactions with relative
densities. The compaction curves are shown in Figure 4.8. A maximum dry density of 115
pcf and an optimum water content of 13% were estimated from the curve for the soil having
0% fines. A maximum dry density of 121 pcf and an optimum water content of 12% were
estimated from the curve for the soil having 5% fines.
Based on these data, the maximum dry density determined from a standard Proctor
compaction test results in a relative density of 76% for the soil containing 0% fines and
83% for the soil containing 5% fines. In reporting the filter test results, relative density was
used to characterize the filter materials.
55
Water Content (%)
8 9 10 11 12 13 14 15 16
Dry
Den
sity
(pcf
)
100
105
110
115
120
125
130
Zero air voids Gs=2.65
0% fines
5% fines
Figure 4.8 Standard Proctor compaction curves for Horsetooth Dam filter for 0% and 5% fines
56
Chapter 5. Tests Performed using 4-inch Diameter Filter Test Device
5.1. Introduction
A total of twenty-seven tests were conducted with the 4-inch diameter filter test
device. The conditions examined in these tests are summarized in Table 5.1. Test 1 through
Test 12 were pilot tests, conducted to determine the proper specimen fabrication techniques,
to refine the instrumentation and data recording methods, and to examine the influence of
the device orientation and flow direction on the test results.
The pilot tests were performed using the tap water in the laboratory as the source of
water, controlling the pressure using a water pressure regulator. However, it proved not to
be possible to maintain a constant pressure in this way. To overcome this difficulty a water
tank pressurized with regulated air pressure was used as the source of water for subsequent
tests. In all of the pilot tests, the crack width was 0.03 inches.
57
Table 5.1 Test summary of 4-inch filter test device
Flow Pressure Video fc (%) w (%) Dr (%) γd (pcf)
Test 1 0.03 H / H 4 11.5Test 2 0.03 H / H 4 11.5Test 3 0.03 V / H 4 11.5Test 4 0.03 V / H 4 11.5Test 5 0.03 V / V 4 11.5Test 6 0.03 V / V Pea Gravel 0 N/ATest 7 0.03 V / H 0 5.6 111.4Test 8 0.03 V / H 0 5.6 111.5Test 9 0.03 V / V 0 12.3 109.9Test 10 0.03 V / V 5 12.3 114.5Test 11 0.03 V / V 10 12.3 110.1Test 12 0.03 V / V 15 12.3 120.8Test 13 0.03 V / V 0 10 50 109.3Test 14 0.06 V / V 0 10 50 109.3Test 15 0.09 V / V 0 10 50 109.3Test 16 0.03 V / V 0 10 70 113.7Test 17 0.06 V / V 0 10 70 113.7Test 18 0.09 V / V 0 10 70 113.7Test 19 0.03 V / V 5 10 70 117.9Test 20 0.06 V / V 5 10 70 117.9Test 21 0.09 V / V 5 10 70 117.9Test 22 0.03 V / V 15 10 70 123.2Test 23 0.06 V / V 15 10 70 123.2Test 24 0.09 V / V 15 10 70 123.2Test 25 0.03 V / V 0 14 70 113.7Test 26 0.09 V / V 15 14 46 123.2Test 27 0.15 V / V 0 10 18 103.4
N/A
Compaction Method
Crack Oriendation / Flow Direction
Pressure Control
Standard Proctor
Hammer
Direct Connection from Tap
Water with Regulator
Crack width cw (inch)
Fabricated Filter
Ochoco Dam Filter
DAQ MeasurementBase Material Filter Material
Ochoco Dam Filter
Measured
Not measured
Filter Material Properties
N/A
Monitored
Teton Dam Core
Horsetooth Dam Filter
Not Monitored
Not measured
Measured
Moist Tamping Constant from Water Tank
58
5.2. Sample Preparation
As mentioned earlier, the cross section of the 4-inch diameter filter test device is a
truncated circle. The standard Proctor (ASTM D698) compaction hammer was used to compact
the specimens in the filter test device. The segments of base and filter material were 3 inches
high after compaction. The base material was compacted to 95% of the maximum density as
determined by the standard proctor test, ASTM D698. The filter material was compacted to
values of relative density varying from 18% to 70%. For density control, the thickness of every
compaction lift was measured using the depth gauge shown in Figure 5.1.
Figure 5.1 Measuring thickness of each layer by depth gauge
59
Figure 3.2(a) (in Chapter 3) shows a cross section through the 4-inch diameter filter test
device. Compaction with void-forming plates inside the device produced samples with truncated
circular shapes. The void-forming plates were removed after compaction. The void-forming
plates extended over the filter and base material segments of the specimens. The closure plate
was replaced by a clear plastic plate before testing so that particle movements could be observed
during the tests. Figure 5.2 shows a perspective view of the 4-inch diameter filter test device. A
longitudinal cross section through the device is shown in Figure 5.3. The detailed steps involved
in assembly and preparation of a sample are explained in Appendix A.
Figure 5.2 4-inch diameter filter test device
60
Base Material
Filter Material
Figure 5.3 Longitudinal cross section through 4-inch diameter filter test device with compacted sample
5.3. Pilot Tests
5.3.1. Horizontal Crack Orientation and Horizontal Flow Direction
Tests 1 through 5 were conducted using the Teton Dam core material as the base material,
and the Ochoco Dam filter material as the filter material. The Ochoco Dam filter material meets
the USBR filter criteria for the Teton Dam core material.
61
In tests 1 and 2, the crack orientation was horizontal, and the flow direction was
horizontal as shown in Figure 5.4. This condition is denoted here as HH. In this orientation, the
filter material cannot close the crack by slumping, since gravitational forces tend to keep the
crack open. Clogging is possible, however, as particle migration occurs due to flow of water
through the specimen. Severe erosion was experienced in Test 1, and a continuous channel was
eroded through the base and filter material. The effluent was visibly turbid throughout the test,
and a stable condition was never reached.
Test 2 was conducted using the same conditions as Test 1, but the filter system
successfully restrained the base material due to particle migration. Early in the test, particles of
the base material covered the filter, and the filter and base then became "mixed." The mixed
material was restrained by the pea gravel, as shown in Figure 5.5. The effluent was first turbid,
and then quickly cleared as the test progressed.
These results showed that the HH condition, which does not permit slumping of the filter
under the force of gravity, does not simulate the field conditions that are of interest for this study.
Although testing with horizontal crack orientation offered some slight advantage with regard to
test setup, it was decided that all subsequent tests should be performed with vertical crack
orientations to better simulate field conditions.
62
Figure 5.4 After Test 1 (HH condition)
Flow Direction
Figure 5.5 After Test 2 (HH condition)
63
5.3.2. Vertical Crack Orientation and Horizontal Flow Direction
Four tests (3, 4, 7, and 8) were performed with vertical crack orientation and horizontal
flow, denoted here as condition VH.
Test 3 was performed using the Teton Dam core material and the Ochoco Dam filter
material, with the filter test device rotated 90 degrees about its long axis, so that the plane of the
crack was vertical. With flow in the horizontal direction, particles of the base material and the
filter material migrated downstream and were restrained by the pea gravel as shown in Figure
5.6(a).
Test 4 (shown in Figure 5.6(b)) had the same conditions as Test 3, except that the section
of the specimen comprised of base material was thicker, and a smaller hydraulic gradient was
used. Although some base material was initially eroded, particles of the filter quickly migrated
to collect on the pea gravel, and the effluent became clear.
Flow Direction
Flow Direction
(a) After Test 3 (b) After Test 4
Figure 5.6 Tests 3 and 4 (VH condition)
64
Test 7 used the Teton Dam core material as the base soil, and the filter material was
fabricated from quartz sand so that D15F/D85B ratio was equal to 6. This represents a filter that is
slightly coarser than allowed by the current USBR criteria. The specimen was compacted about
24 hours prior to testing. During the time between compaction and testing, the base material
swelled and partially filled the crack, within the area outlined by the dashed red line in Figure 5.7.
When flow was started, particles of the filter migrated downstream and were restrained by the
pea gravel, and the filter then successfully restrained the base material.
Flow Direction
Figure 5.7 Before Test 7
Test 8 was conducted using the same conditions as Test 7, but the sample was tested soon
after compaction. This test resulted in more base material being eroded, but the filter
successfully restrained the base, as shown in Figure 5.8.
Test 7 and 8 were the first tests in which upstream pressures were measured. Figure 5.9
shows the variations of upstream water pressure with time measured in these tests. It may be
65
seen that the pressures dropped as soon as the valve was opened, and increased as clogging
developed. Even though the filter successfully restrained the base material, the pressure did not
return to the original value, as may be seen in Figure 5.9. Close examination of the specimens
during these tests, showed that empty spaces remained at the top of the crack, and that there was
free flow through these empty spaces.
Flow Direction
Flow Direction
(a) After Test 7 (b) After Test 8
Figure 5.8 Tests 7 and 8 (VH condition)
Tests with vertical crack orientation and horizontal flow direction modeled the desired
field condition, but it resulted in empty spaces at the top of sample the crack. Because dams have
freeboard, such spaces in the field would most likely be above water, and therefore not involved
in flow through the crack, even if the upper part of the crack remained open. Therefore the VH
condition in the 4-inch filter test device imposes a more severe condition than would be expected
in the field.
66
0.00
1.00
2.00
3.00
4.00
5.00
6.00
0 100 200 300 400 500 600
Time (sec)
Pres
sure
(psi
)Test 7 Test 8
Open the Valve Figure 5.9 Pressure measurement of Test 7 and 8
5.3.3. Vertical Crack Orientation and Vertical Flow Direction
Tests 5 and 6 were conducted with the crack oriented vertically, and with the water
flowing vertically downward through the crack. This condition is denoted here as VV.
Test 5 was conducted before the data acquisition (DAQ) system was built, so no
continuous record of pressure variation was made. Figure 5.10(a) shows Test 5 before opening
the valve. On the top left, the digital clock shows elapsed time (the reading shown is 11 hours, 47
minutes, and 24 seconds), and the digital display at the left shows a voltage that represents the
67
upstream pressure (0.0101 volts represent 5 psi pressure). As shown in Figure 5.10(b), the
pressure immediately dropped by more than half (about 2 psi) after the valve was opened.
Flow
Dire
ctio
n
Flow
Dire
ctio
n
(a) Test 5 before opening the valve (b) Test 5 immediately after opening the valve
Figure 5.10 Early stage of Test 5 (VV condition)
As mentioned previously, the filter test device in this test (Test 5) was oriented vertically,
with the base material above the filter material, and flow was downward. The average gradient
used through the soil sample (i = 36) was slightly smaller than the values (i = 39 to 46) used in
previous tests. During the test, the base material was first eroded and filled the crack, and then
particles of the filter material also moved in to fill the crack, as shown in Figure 5.11(a). The
effluent became clear very quickly. Figure 5.11(b) shows that the pressure returned almost to its
initial value, and the filter material successfully restrained the base.
Figure 5.12 shows an enlarged view of Figure 5.11(b). It can be seen that a thin layer of
the base material formed on top of the filter material that had slumped on top of the pea gravel.
Subsequently, more filter material collapsed on top of the thin layer of base material. The
condition shown in Figure 5.12 illustrates clogging mechanism described in Chapter 3, and
shown by the sketch in Figure 3.5.
68
Flow
Dire
ctio
n
Flow
Dire
ctio
n
(a) Test 5 during the test (b) Test 5 after the test
Figure 5.11 Late stage of Test 5 (VV condition)
Figure 5.12 Clogging layer after Test 5
Test 6 was conducted to investigate whether the filter test device with vertical crack
orientation was capable of showing filter failure for conditions under which filter failure should,
in fact, occur. This test used pea gravel, which does not meet the USBR criteria for the Teton
Dam core material, in place of the filter material. The ratio of the D15F of the pea gravel divided
by the D85B of the Teton Dam core was equal to 25, far greater than the allowable value of five.
69
In this test, shown in Figure 5.13(b), most of the base material was washed through the pea
gravel, and a stable condition was never reached. This result demonstrated that the successful
performance of the filters in earlier were not an artifact of the test conditions, and were therefore
indicative of the actual behavior of the filter materials tested.
5.4. Compaction Procedure and Water Supply
In Tests 9 through 12, as in Test 1 through 8 described previously, the specimens were
compacted using the standard Proctor compaction hammer, and using water pressures controlled
by a water pressure regulator attached to the laboratory water supply line. Tests 9 through 12
showed that this method of compaction and this method of controlling water pressures were not
adequate to achieve consistent results for all of the tests.
Tests 9 through 12 were performed to investigate the effect of fines content on filter
behavior, one of the major objectives of the study. These tests showed, as did later tests, which
filters with as much as 15% non-plastic fines were able to collapse, fill an initial crack, and
satisfactorily retain the base material. However, the results of these tests were not systematic
with regard to the effects of the percentage of fines on the variation of flow with time during the
tests.
It was surmised that these erratic results were due to variations in the dry densities
achieved with the standard Proctor hammer and energy: It was decided that for subsequent tests
the specimens would be compacted using a moist tamping procedure, with careful control of the
density of each lift. As explained subsequently, consistent results were achieved when this was
done.
It was also observed during Tests 9 through 12 that the water pressures varied erratically
during the tests, and it was evident that the water pressure regulator was not able to control the
water pressures with sufficient uniformity. It was found that much more uniform water pressures
70
could be achieved with a water supply tank using air pressures in the tank controlled by an air
pressure regulator, and this system was used for all subsequent tests.
Flow
Dire
ctio
n
Flow
Dire
ctio
n
(a) Test 6 before opening the valve (b) Test 6 after the test
Figure 5.13 Test 6 (VV condition)
71
5.5. Major Test Results
5.5.1. Details for a Typical Test
As explained in previous sections, the apparatus and test procedures were developed as
Test 1 through Test 12 were performed. Consequently, the procedures used for tests 9 through 12
were not standardized to the degree desired, and the results of these 12 tests are not reported in
detail. Test 13 was the first in which the apparatus and test procedures were the same as used
throughout the remainder of the tests.
The results of a typical test (Test 16) are shown in Figure 5.14, Figure 5.15, and Figure
5.16.
Flow vs. Time - Test 16 (cw= 0.03", fc=0%, Dr=70%, w=10%)
Time (sec)
0 20 40 60 80 100
Flow
(lite
r)
0.0
0.2
0.4
0.6
0.8
1.0
Open the Valve
Figure 5.14 Flow vs. Time (Test 16)
72
Flow rate vs. Time - Test 16 (cw= 0.03", fc=0%, Dr=70%, w=10%)
Time (sec)
0 20 40 60 80 100
Flow
rate
(lite
r/sec
)
0.000
0.005
0.010
0.015
0.020
0.025
0.030
0.035
Open the Valve
Figure 5.15 Flow Rate vs. Time (Test 16)
Pressure vs. Time - Test 16 (cw= 0.03", fc=0%, Dr=70%, w=10%)
Time (sec)
0 20 40 60 80 100
Pres
sure
(psi
)
3.5
4.0
4.5
5.0
5.5
Open the Valve
Figure 5.16 Pressure vs. Time (Test 16)
73
Figure 5.14 shows the variation of flow volume with time and Figure 5.15 shows the
variation of flow rate with time. Flow through the test specimen began at t=10 seconds, when the
flow control valve was opened. It can be seen that the flow rate was initially very rapid, and that
it decreased essentially to zero in a period of about 80 seconds. At this stage in the test, the filter
had collapsed and retained the eroding base material.
Figure 5.16 shows the recorded variation of pressure with time during the test.
Immediately after opening the valve, the pressure dropped suddenly as the water flowed rapidly
through the device. Within approximately 15 seconds the pressure had returned to near its initial
value of about 4.7 psi.
It was found that the process of erosion and clogging during the tests often occurred
episodically. As can be seen in Figure 5.15, there was evidence of a tendency for increased flow
rate and subsequent rapid decrease in flow rate that is characteristic of these episodes of erosion,
clogging and retention of the base materials by the filter. It is interesting to note, as can be seen
in Figure 5.18, after the filter had reached an apparently stable condition there was a later
episode of breakthrough and subsequent reestablishment of a stable condition in the period from
about 350 to 400 seconds after the beginning of the test. The conditions remain stable throughout
the remainder of the test, as can be seen in Figure 5.19. While the details of the tests vary
somewhat from one test to the next, the characteristic behavior shown in Figure 5.14 through
Figure 5.16 was consistent throughout Tests 13 through 27.
5.5.2. Effect of the Percent Fines
One of the primary objectives of this research program is to determine the effect of the
fines content on the ability of a filter to collapse and fill a crack. Figure 5.17, 5.18, and Figure
5.19 show the results of Tests 16, 19, and 22. The only difference in the conditions for these tests
was the percentage of fines in the filter material. In Test 16 the filter had no fines, in Test 19 the
filter contained 5% fines and in Test 22 the filter contained 15% fines.
74
All three tests were conducted with an initial crack width of 0.03 inches, and with the
filter compacted to a relative density of 70% at a water content of 10%. All three of these tests
were successful, with the filter eventually collapsing and retaining the base material. After an
initial reduction in pressure immediately after the valve was opened, the water pressures returned
to their initial values very quickly, within about 20 seconds. It can be seen in Figure 5.17 that the
flow rate diminished most quickly with the finest filter and most slowly with the coarsest filter.
Flow vs. Time (cw=0.03", Dr=70%, w=10%)
Time (sec)
0 100 200 300 400
Flow
(lite
r)
0.0
0.2
0.4
0.6
0.8
1.0
fc = 0% (Test 16)
fc = 5% (Test 19)
fc = 15% (Test 22)
Open the Valve
Figure 5.17 Flow vs. Time comparing Test 16, 19, and 22
75
Flow rate vs. Time (cw=0.03", Dr=70%, w=10%)
Time (sec)
0 100 200 300 400
Flow
rate
(lite
r/sec
)
0.000
0.005
0.010
0.015
0.020
0.025
0.030
0.035
Open the Valve
fc = 0% (Test 16)
fc = 5% (Test 19)
fc = 15% (Test 22)
Figure 5.18 Flow Rate vs. Time comparing Test 16, 19, and 22
Pressure vs. Time (cw=0.03", Dr=70%, w=10%)
Time (sec)
0 100 200 300 400
Pres
sure
(psi
)
2.5
3.0
3.5
4.0
4.5
5.0
5.5
Open the Valve
fc = 0% (Test 16)
fc = 5% (Test 19)
fc = 15% (Test 22)
Figure 5.19 Pressure vs. Time comparing Test 16, 19, and 22
76
The conclusion based on the results of these three tests is that variation of the percentage
of non-plastic fines from 0 to 15% does not change the ability of the filter to collapse, plug the
crack, and prevent erosion of the base material.
5.5.3. Effect of Crack Width
It was considered important to investigate the width of the crack formed between the
specimen and the wall of the filter test device, since this is an important boundary condition in
the tests. The results shown in Figure 5.20, 5.21, and 5.22 indicate that variation of the crack
width from 0.03 to 0.09 inches does not change the basic behavior of the specimens during the
tests. Although there are some detailed differences in the test results, in all cases the filter was
able to collapse and close the crack and retain the base soil, even with a crack width as large as
0.09 inches.
77
Flow vs. Time (fc=0%, Dr=70%, w=10%)
Time (sec)
0 20 40 60 80 100 120 140
Flow
(lite
r)
0.0
0.5
1.0
1.5
2.0
cw = 0.03 in (Test 16)
cw = 0.06 in (Test 17)
cw = 0.09 in (Test 18)
Open the Valve
Figure 5.20 Flow vs. Time comparing Test 16, 17, and 18
Flow rate vs. Time (fc=0%, Dr=70%, w=10%)
Time (sec)
0 20 40 60 80 100 120 140
Flow
rate
(lite
r/sec
)
0.000
0.005
0.010
0.015
0.020
0.025
0.030
0.035
Open the Valve
cw = 0.03 in (Test 16)
cw = 0.06 in (Test 17)
cw = 0.09 in (Test 18)
Figure 5.21 Flow Rate vs. Time comparing Test 16, 17, and 18
78
Pressure vs. Time (fc=0%, Dr=70%, w=10%)
Time (sec)
0 20 40 60 80 100 120 140
Pre
ssur
e (p
si)
2.5
3.0
3.5
4.0
4.5
5.0
5.5
Open the Valve
cw = 0.03 in (Test 16)
cw = 0.06 in (Test 17)
cw = 0.09 in (Test 18)
Figure 5.22 Pressure vs. Time comparing Test 16, 17, and 18
5.5.4. Effect of Density
The results of Test 13 and Test 16 are compared in Figure 5.23, 5.24, and 5.25. The
relative density of the filter material in Test 13 was 50% and the relative density of the filter
material in Test 16 was 70%. Although there are some differences in the rate at which the
specimen reached a stable condition, both tests resulted in successful retention of the base by the
filter. Test 13 is one of those in which there was a subsequent episode of collapse and
reestablishment of a stable condition.
79
Flow vs. Time (fc=0%, w=10%, cw=0.03")
Time (sec)
0 100 200 300 400
Flow
(lite
r)
0.0
0.5
1.0
1.5
2.0
Dr = 50% (Test 13)
Dr = 70% (Test 16)
Open the Valve
Figure 5.23 Flow vs. Time comparing Test 13 and 16
Flow rate vs. Time (fc=0%, w=10%, cw=0.03")
Time (sec)
0 100 200 300 400
Flow
rate
(lite
r/sec
)
0.000
0.005
0.010
0.015
0.020
0.025
0.030
0.035
Open the Valve
Dr = 50% (Test 13)
Dr = 70% (Test 16)
Figure 5.24 Flow Rate vs. Time comparing Test 13 and 16
80
Pressure vs. Time (fc=0%, w=10%, cw=0.03")
Time (sec)
0 100 200 300 400
Pre
ssur
e (p
si)
2.5
3.0
3.5
4.0
4.5
5.0
5.5
Open the Valve
Dr = 50% (Test 13)
Dr = 70% (Test 16)
Figure 5.25 Pressure vs. Time comparing Test 13 and 16
5.5.5. Effect of Water Content
The effect of water content during compaction of the filter material can be seen by
comparing the results of Test 16 and Test 25, which are plotted together in Figure 5.26, 5.27, and
5.28. These two tests had the same filter material, but different water contents. The results of
these tests are nearly identical, with very similar flow rates versus time required to re-establish
the initial pressure. This result might be expected, because the filter material is granular, and its
compaction is not effected much by variation in compaction water content.
81
Flow vs. Time (fc=0%, Dr=70%, cw=0.03")
Time (sec)
0 20 40 60 80 100
Flow
(lite
r)
0.0
0.2
0.4
0.6
0.8
1.0
w = 10% (Test 16)
w = 14% (Test 25)
Open the Valve
Figure 5.26 Flow vs. Time comparing Test 16 and 25
Flow rate vs. Time (fc=0%, Dr=70%, cw=0.03")
Time (sec)
0 20 40 60 80 100
Flow
rate
(lite
r/sec
)
0.000
0.005
0.010
0.015
0.020
0.025
0.030
0.035
Open the Valve
w = 10% (Test 16)
w = 14% (Test 25)
Figure 5.27 Flow Rate vs. Time comparing Test 16 and 25
82
Pressure vs. Time (fc=0%, Dr=70%, cw=0.03")
Time (sec)
0 20 40 60 80 100
Pre
ssur
e (p
si)
2.5
3.0
3.5
4.0
4.5
5.0
5.5
Open the Valve
w = 10% (Test 16)
w = 14% (Test 25)
Figure 5.28 Pressure vs. Time comparing Test 16 and 25
Tests 24 and 26 were performed to determine if water content would have any effect on
the behavior of filter materials containing fines. The results of these tests, conducted using filter
material containing 15% fines, and compacted at water contents of 10% and 14%, are shown in
Figure 5.29, 5.30, and 5.31. The results show that compaction water content did not have any
significant effect on the results. Therefore, compaction water content does not appear to have
any effect on the ability of the filter to collapse and block a crack, even if the filter material
contains as much as 15% of non-plastic fine material.
83
Flow vs. Time (fc=15%, Dr=70%, cw=0.09")
Time (sec)
0 100 200 300 400
Flow
(lite
r)
0
1
2
3
4
5
w = 10% (Test 24)
w = 14% (Test 26)
Open the Valve
Figure 5.29 Flow vs. Time comparing Test 24 and 26
Flow rate vs. Time (fc=15%, Dr=70%, cw=0.09")
Time (sec)
0 100 200 300 400
Flow
rate
(lite
r/sec
)
0.000
0.005
0.010
0.015
0.020
0.025
0.030
0.035
Open the Valve
w = 10% (Test 24)
w = 14% (Test 26)
Figure 5.30 Flow Rate vs. Time comparing Test 24 and 26
84
Pressure vs. Time (fc=15%, Dr=70%, cw=0.09")
Time (sec)
0 100 200 300 400
Pres
sure
(psi
)
2.5
3.0
3.5
4.0
4.5
5.0
5.5
Open the Valve
w = 10% (Test 24)
w = 14% (Test 26)
Figure 5.31 Pressure vs. Time comparing Test 24 and 26
5.6. Summary of Tests with 4-inch diameter Filter Test Device
The results obtained with the 4-inch diameter filter test device support these conclusions:
• An apparatus and test procedure has been developed that is capable of investigating the
ability of filters to collapse and retain base materials that are initially cracked. The
principal limitation is that the apparatus is only 4 inches in diameter, which only allows
filter materials having maximum particle sizes of 0.25 inches.
• Tests have been performed to investigate the effects of the percentage of non-plastic
fines in the filter (up to 15 percent), the effect of the crack widths (up to 0.09 inches), the
effects of relative density in the range from 18% to 70%, and the effects of compaction
water content in the filter ranging from 10% to 14 %. In all of the tests performed over
85
this range of variables the filter material successfully collapsed and retained the base
material.
• The fact that the uniformly successful test results are not an artifact of the apparatus
design is illustrated by the result of Test 6, in which the filter material was replaced by
pea gravel too coarse to satisfy filter criteria. In this case, the base material was washed
through the pea gravel continuously, and a stable condition was never reached during the
test.
• A major finding of this research study is the fact that filters with as much as 15% of non-
plastic fines are sufficiently cohesionless to collapse and retain the base material in an
initially cracked specimen. Investigation of the effects of percent fines on the crack-
stopping ability of filters was the major objective of this research.
• It should be noted that all of the filter materials used in these tests were composed of
inert particles that exhibited no bonding or cementation during compaction. Bonding or
cementation during compaction would be expected to have a major effect on the ability
of filters to perform as crack stoppers.
86
Chapter 6. Tests Performed using the 12-inch Square Filter Test Device
6.1. Introduction
The 12-inch square filter test device was designed and constructed to make it
possible to test larger filter materials and larger crack widths. The device, shown
schematically in Figure 6.1, can be used to test filter materials with particles as large as 1.5
inches, and crack widths as large as 1.0 inches. Most of the tests performed using the 12-
inch device were performed with a vertical crack and horizontal flow. The 4-inch diameter
and 12-inch square filter test devices are shown side-by-side in Figure 6.2. Further
appreciation for the scale of the larger tests is afforded by considering that the volume of a
test specimen for the 12-inch device is about 30 times as large as the volume of a specimen
for the 4-inch device. The time required for specimen preparation was considerably longer
than for the smaller device. However, closer correspondence to real field conditions
justified the larger-scale tests.
In addition to its larger size, the 12-inch device was constructed with a membrane
(discussed in the subsequent section) that could be used to apply pressure to the top of the
test specimen, simulating overburden pressure in the field. In the 4-inch diameter filter test
device, the boundary conditions imposed on the test specimen did not allow for meaningful
results to be obtained for a vertical crack orientation with horizontal flow, because a void
formed at the top of the specimen when the filter slumped, and water continued to flow
through this space even if the filter performed well. The membrane incorporated in the 12-
inch device prevented formation of a void at the top of the specimen, and resulted in closer
simulation of field conditions.
87
Embankment Dam
Cracks CoreDownstream filter
Shell
A
A
B B
A - A
CoreDownstream filter
B - B
Base Soil (core)Filter
Figure 6.1 Relationship of tests to field conditions
Figure 6.2 Comparison of cross section of the two filter test device
88
Table 6.1 summarizes the results of the 11 tests performed using the 12-inch square
filter test device. The base material used in all of the tests was the Teton Dam core material.
Three different filter materials were used: Horsetooth Dam filter material, Horsetooth Dam
filter material mixed with various amounts of highly plastic fines, and very coarsely graded
marble chips.
89
Table 6.1 Summary of tests performed using 12-inch square filter test device
Flow Pressure Video fc (%) w (%) Dr (%) γd (pcf)
Test 28 0.15 V / H 0 10 70 109.5Test 29 0.15 V / H 0 10 70 109.5Test 30 0.50 V / H 0 10 70 113.7Test 31 1.00 V / H 0 10 70 113.7Test 32 1.00 V / V 0 10 70 113.7Test 33 1.00 V / H 5 10 70 112.7Test 34 1.00 V / H 15 10 70 112.5Test 35 1.00 V / H 10 10 70 113.8Test 36 1.00 V / H 0 N/A 70 102.1Test 37 1.00 V / H 0 N/A 70 111.1Test 38 1.00 V / H 0 N/A 70 127.2
Horsetooth Dam Filter w/
HPF
Standard Proctor
Hammer
Constant from Water Tank Measured Measured
Pressure Control
Compaction Method
Crack Oriendation / Flow Direction
Crack width cw (inch)
DAQ MeasurementBase Material Filter Material
Filter Material Properties
Teton Dam Core
Horsetooth Dam Filter
Monitored
Fabricated Marble Chip
Note: HPF = highly plastic fines.
90
6.2. Pressure Membrane
As noted above, the 12-inch square filter test device was equipped with a flexible
pressure membrane. The purpose of the membrane was to expand and fill the void that
formed at the top of the specimen when the filter collapsed, and to prevent flow through
this area. Figure 6.3 shows the orientation of the device for horizontal flow through a
vertical crack. The flexible membrane is beneath the top panel. An exploded view of the
membrane, and the panel to which it is attached, is shown in Figure 6.4. Figure 6.5 shows a
cross section through the crack and the membrane, and indicates how the membrane
expands to fill the void that forms as filter material slumps to fill the crack. Detailed
drawings of the 12-inch square filter test device, the steps involved in sample fabrication,
and assembly of the device for testing are shown in Appendix B.
Side panel with pressure membrane
Cross section normalto direction of flow
Figure 6.3 Permeameter orientation for vertical crack and horizontal flow
91
O-ring
Membrane
Membrane
retainer
Bolts
(a)
(b)
Figure 6.4 Exploded view of flexible membrane and backing panel
92
Soil
Aluminum Panel Rubber Membrane
Clear PlasticPanel
SimulatedCrack
(Not to Scale)
(a) Before the test
Soil
Aluminum Panel Rubber Membrane
Clear PlasticPanel
SimulatedCrack
Pressurizedair
(Not to Scale)
(b) During the test
Figure 6.5 Flexible membrane used to fill void at top of specimen
93
6.3. Test with Vertical Crack and Vertical Flow (VV test condition)
One test was performed using the same VV test condition used in the 4-inch
diameter filter test device, to ensure that similar results were achieved for similar test
conditions. The results of this test (Test 32) are shown in Figure 6.6. The gradations of the
base and filter materials used in this test were the same as those used in Tests 16, 17, and 18.
However, the gap width in Test 32 was 1.0 inch, as compared to gap widths varying from
0.03 inches to 0.09 inches in the earlier tests.
Figure 6.6(a) shows the specimen after it was tipped up into position for testing, and
the filter material slumped to fill the bottom of the crack. Figure 6.6(b) shows the specimen
at the end of the test, when base material had been retained on top of the filter material and
conditions had stabilized.
Variations of flow rate and pressure with time during the test are shown in Figures
6.7 and 6.8. Immediately after the flow valve was opened, a spike in flow occurred, and the
pressure dropped suddenly. As base material accumulated on the filter and blocked the flow
path, the flow rate decreased and the pressure stabilized. It can be seen that the initial
clogging event was followed by two smaller clogging events. This behavior was essentially
the same as measured in similar tests with the 4-inch device using the same grain sizes in
the base and filter materials, but smaller gap widths.
94
Flow
Dire
ctio
n
(a) Before the Test 32
Flow
Dire
ctio
n
(b) After the Test 32
Figure 6.6 Test 32 with 12-inch square filter test device (VV condition)
95
Test 32 (VV)Flow Rate vs. Time (cw=1.0", fc=0%, w=10%, Dr=70%)
Time (sec)
0 50 100 150 200 250 300
Flow
Rat
e (li
ter/s
ec)
0.00
0.01
0.02
0.03
0.04
0.05
Open the Valve
Figure 6.7 Flow rate vs. Time of Test 32
Test 32 (VV)
Pressure vs. Time (cw=1.0", fc=0%, w=10%, Dr=70%)
Time (sec)
0 50 100 150 200 250 300
Pre
ssur
e (p
si)
4.2
4.4
4.6
4.8
5.0
5.2
5.4
5.6
5.8
6.0
6.2
Open the Valve
Figure 6.8 Pressure vs. Time of Test 32
96
6.4. Effect of Crack Width
Tests 29, 30, and 31 were performed using the Teton Dam base material and the
Horse Tooth Dam filter material, with no fines. The crack widths used in the tests were
0.15 inches in Test 29, 0.5 inches in Test 30, and 1.0 inches in Test 31. The results of these
tests are shown in Figures 6.9 and 6.10.
As shown in Figure 6.9, the measured flow rate increased with increasing crack
width. Both the initial spike in flow rate, and the steady flow rate later in the test, were
largest for Test 31 with a 1.0-inch crack width, and smallest for Test 29, with a 0.15-inch
crack width. The measured pressures shown in Figure 6.10 also varied with crack width.
Stabilized pressure after clogging was highest for Test 29, with the 0.15-inch crack, and
smallest for Test 31, with the 1.0-inch crack.
Open the Valve
Flow Rate vs. Time (fc=0%, w=10%, Dr=70%)
Time (sec)
0 100 200 300 400
Flow
Rat
e (li
ter/s
ec)
0.00
0.01
0.02
0.03
0.04
cw=0.15 in (Test 29)
cw=0.5 in (Test 30)
cw=1.0 in (Test 31)
Figure 6.9 Flow rate vs. Time (Test 29, 30, and 31)
97
Open the Valve
Pressure vs. Time (fc=0%, w=10%, Dr=70%)
Time (sec)
0 100 200 300 400
Pre
ssur
e (p
si)
4.4
4.6
4.8
5.0
5.2
5.4
5.6
5.8
6.0
cw=0.15 in (Test 29)cw=0.5 in (Test 30)
cw=1.0 in (Test 31)
Figure 6.10 Pressure vs. Time (Test 29, 30, and 31)
6.5. Effect of Highly Plastic Fines Content
Three tests were conducted to investigate the effect of highly plastic fines on the
ability of filters to collapse and fill cracks. Test 33 was performed on a specimen
containing 5% of material with Liquid Limit = 72, and Plastic Limit = 32. Test 34 was
performed on a specimen containing 15% of the same highly plastic material, and Test 35
was performed on a specimen with 10% of this material.
Figure 6.11 shows Test 33 (5% fines) before and during the test. In Figure 6.11(a),
the test device has been rotated into position for testing, with the crack vertical. The filter
and base materials have slumped, and fill the bottom part of the crack. Cloudy water fills
the top of the crack. In Figure 6.11(b) the membrane has expanded to fill most of the void
left by the collapsing filter material. Although a small void remained between the
membrane and the soil beneath, the membrane did block most of the flow through the void,
as would slumping soil in the field.
98
Flow Direction
(a) Before the Test 33
Flow Direction
(b) During the Test 33
Figure 6.11 Test 33 (5% HPF)
99
Figure 6.12 shows Test 34 (15% fines) before and during the test. In Figure 6.12(a),
the test device has been rotated into position for testing, with the crack vertical. Very little
of the base material slumped to fill the crack when the device was rotated into position and
most of the crack was filled with water. During the test, the membrane had to expand
further than in Test 33. At a later stage of the test, the membrane burst, and useful results
could not be obtained beyond that point. It may be noted that there is a void at about the
lower third point across the specimen, between the darker material above (predominantly
filter, with some base mixed in by particle migration) and the lighter material below
(predominantly base, with particles of filter mixed in). Cloudy water flows through this
void. This test, with the largest content of highly plastic fines, was the only test in which
this phenomenon was observed.
The results of Tests 33, 34, and 35 are shown in Figures 6.13 and 6.14. As noted
previously, the membrane burst during Test 34, and useful results were not obtained after
about 220 seconds. In all three tests the flow rate increased with time and then stabilized at
or near the maximum. The upstream pressures dropped immediately, and did not return
close to their original values, as had pressures in tests on filters that did not contain highly
plastic fines. These differences are qualitative indications that the highly plastic fines
reduce the ability of the filter to slump and fill cracks.
In Test 33 (5% fines) and Test 35 (10% fines) a stable condition was achieved at the
end of the tests, and the effluent was clear, indicating no continuing erosion of the base
material. In Test 34, which had 15% fines, however, conditions did not stabilize. Cloudy
effluent continued to flow from the specimen throughout the test, indicating that effective
filter action was not established.
100
Flow Direction
(a) Before the Test 34
Flow Direction
(b) During the Test 34
Figure 6.12 Test 34 (15% HPF)
101
Open the Valve
Flow Rate vs. Time (cw=1.0", w=10%, Dr=70%)
Time (sec)
0 100 200 300 400 500
Flow
Rat
e (li
ter/s
ec)
0.000
0.005
0.010
0.015
0.020
0.025
0.030
fc=5% (Test 33)
fc=10% (Test 35)
fc=15% (Test 34)
Figure 6.13 Flow rate vs. Time (Test 33, 34, and 35)
Open the Valve
Pressure vs. Time (cw=1.0", w=10%, Dr=70%)
Time (sec)
0 100 200 300 400 500
Pre
ssur
e (p
si)
2.5
3.0
3.5
4.0
4.5
5.0
5.5
6.0
fc=5% (Test 33)
fc=10% (Test 35)
fc=15% (Test 34)
Figure 6.14 Pressure vs. Time (Test 33, 34, and 35)
102
6.6. Tests on Very Coarse Filters
Tests 36, 37 and 38 were performed on filters containing large particles. The
gradations of these materials are shown in Figure 6.15. The materials used in Tests 36 and
37 were too coarse to satisfy Bureau of Reclamation filter criteria. The material used in
Test 38 was at the coarsest boundary of Bureau filter criteria.
Figure 6.16 shows the Test 36 specimen before and during the test. The coarse
material collapsed and filled the lower part of the crack when the filter test device was
rotated into position for testing, and cloudy water filled the upper part of the crack. When
the test was begun, the membrane expanded to fill most of the upper part of the crack. In
Test 38 the membrane burst after about 200 seconds, and no more useful data could be
obtained beyond that point in the test.
Although these coarse materials slumped and filled the crack, they all failed to
perform as effective filters because of their excessively coarse gradations. The voids in
these materials were so large that the Teton Dam base material was not restrained, and was
washed through the voids of the “filter” materials. Even in Test 38, where the gradation was
marginally acceptable, the effluent was cloudy throughout the test, and it appeared that
erosion of the base continued at a steady rate until the test ended. The flow rates and
pressure variations with time are shown in Figures 6.17 and 6.18. It can be seen that the
results are very similar: The flow rates increase to maximum values and persisted, and the
pressures dropped to nearly constant values.
103
0
10
20
30
40
50
60
70
80
90
100
0.0010.010.1110100Grain Size (mm)
Perc
ent f
iner
by
wei
ght (
%)
Gravel
Coarse Fine Coarse FineMedium
SandSilt or clayCobbles
#10 #20 #40 #60 #100#140#200#4
U.S. Standard Sieve Number
1/43/81/23/41
U.S. Standard Sieve Opening (in)
Test 37
Test 36
Test 38
Figure 6.15 Gradation curves of Test 36, 37, and 38
104
Flow Direction
(a) Before the Test 36
Flow Direction
(a) During the Test 36
Figure 6.16 Test 36 (coarse filter material)
105
Open the Valve
Flow Rate vs. Time (cw=1.0", fc=0%, w=10%, Dr=70%)
Time (sec)
0 100 200 300 400 500
Flow
Rat
e (li
ter/s
ec)
0.000
0.005
0.010
0.015
0.020
0.025
0.030
0.035
Test 36
Test 37
Test 38
Figure 6.17 Flow rate vs. Time (Test 36, 37, and 38)
Open the Valve
Pressure vs. Time (cw=1.0", fc=0%, w=10%, Dr=70%)
Time (sec)
0 100 200 300 400 500
Pre
ssur
e (p
si)
4.2
4.4
4.6
4.8
5.0
5.2
5.4
5.6
5.8
6.0
Test 36
Test 37
Test 38
Figure 6.18 Pressure vs. Time (Test 36, 37, and 38)
106
6.7. Summary
The tests performed using the 12-inch square filter test device support these conclusions:
• The 12-inch device was found to be effective for testing specimens containing particles
as large as 1.5 inches, with crack widths as large as 1.0 inch. The behavior observed in
these tests was qualitatively the same as had been measured in the tests using the 4-inch
diameter device, and showed that this behavior, involving collapse of the filter to fill
cracks and clogging to stop erosion, applies to particle sizes and crack widths
representative of field conditions.
• The pressure membrane incorporated in the 12-inch device was effective in simulating
the effect of overburden pressure in the field, enhancing the tendency of the filter to
collapse and fill the crack. Two tests on specimen with 1.0-inch cracks were terminated
prematurely when the membranes burst. However, in other respects the membranes
functioned as intended, and were effective in simulating the effect of overburden pressure
in the field.
• A test performed in the 12-inch device using the VV condition (vertical crack, vertical
flow), replicated the results achieved in the 4-inch device for this flow condition,
demonstrating the fact that the results were not controlled by the size of the device, the
particle size (for cohesionless materials), or the crack width.
• These tests were performed on specimens containing highly plastic fines (HPF) with the
VH condition (vertical crack, horizontal flow). The crack widths in these tests were 1.0
inch, and the maximum particle size was 0.25 inches in all cases.
The filter containing 5% HPF behaved the same as had filters with no fines – the filter
collapsed (slumped) before flow was started, and clogging occurred quickly with clear
effluent from the specimen.
The filter containing 10% HPF did not collapse until flow began. Ultimately, however,
collapse and clogging did occur, and the effluent became clear.
107
The filter containing 15% HPF also did not collapse until flow began. Even after collapse
occurred, an un-collapsed flow channel remained which prevented clogging and effective
filter action. The effluent never became clear, indicating that this material was not a
reliable filter.
108
Chapter 7. Sand Castle Tests3
7.1. Background
To prevent continuous erosion through cracks, filter materials must satisfy two conditions.
The first is that the gradation of the filter material falls within the proper gradation limits,
detailed in previous chapters. The second is that the filter material must be capable of collapsing
and filling a crack, should one develop. Vaughan and Soares (1982) noted that including fines in
a filter to enable it to retain small clay particles may give it cohesion, thereby reducing its ability
to collapse and fill cracks. They suggested a simple test to examine the ability of filter material &
collapse using a compaction mold or a small bucket, like a child's toy used to build sand castle.
The test is performed by placing a sample (the "sand castle") a shallow tray and the tray is
flooded with water. A cohesionless material will collapse immediately, showing its ability to
collapse and fill cracks. A sample with cohesion will not collapse, or will collapse only after a
long period of time, indicating that it would not be suitable for use as a filter.
7.2. Description of device and test procedure
A sand castle test is performed by placing a compacted soil sample in water and
observing it for some time. In the tests described in this chapter, the behavior of the samples was
recorded using a digital camera. Figure 7.1 shows the test apparatus developed for the Sand
Castle Tests described here. A plastic sheet was first inserted into a 261 ml plastic cup. The
plastic sheet prevents the soil from adhering to the cup. The soil sample was then compacted in
the cup using a hand compactor. The compacted sample was inverted over a wire mesh, and was
lowered into a one gallon glass container filled with distilled water using the steel rod with hooks
3 Sand Castle Test (SCT): The name of test was coined by Vaughan and Soares (1982)
109
at their ends. The condition of the sample was recorded using a digital camera, and a recording
of the test was saved as a movie file. After the test, pictures at elapsed times of 0, 1, 2, 4, 8, 16,
32, and 64 minutes were extracted from the movie file for presentation.
Figure 7.1 Devices for Sand Castle Test
Figure 7.2 shows the assembled apparatus ready for a sand castle test. White panels were
placed behind the reservoir and in front of the camera to prevent glare during filming. The steel
rod hooks were removed after the sample was placed under water. Time was measured by
filming a digital clock. A description of the sample (test number, water content, fines content,
types of fines, and sample weight) was posted on a card visible in the movie frame as shown in
Figure 7.3.
110
Figure 7.2 Test configuration for Sand Castle Test
Figure 7.3 Front view of test setup
111
7.3. Test material
Sand castle tests were performed on the Horsetooth Dam filter material used in this
research. The fine fraction of this material was separated from the coarse fraction by sieving
through a #200 sieve. Samples were prepared for testing by mixing the coarse fraction of the
Horsetooth Dam filter material with various percentages of highly plastic fines (HPF) or non-
plastic fines (NPF). In this research, the plastic fines contents were 5%, 10% and 15%, and water
contents were 5%, 7%, 10%, and 13%. All samples were stored for 24 hours in a plastic bag
prior to testing. For highly plastic fines, CH material was used. The Liquid Limit was 72, the
Plastic Limit was 32, resulting in a Plasticity Index of 40.
For tests with non-plastic fines, the original fines from the Horsetooth Dam filter material
were remixed with the coarse fraction. This fine material cannot be rolled into a 1/8 inch thread
at any water content; therefore it is classified as "non-plastic" by ASTM D2487. These non-
plastic fines were combined with the coarse fraction to form test specimens having 15% fines.
Tests on samples containing highly plastic fines were conducted for various combinations
of water and fines contents. Some samples containing non-plastic fines could not be tested
because they slumped immediately after the samples were taken from mold, before immersion in
water.
112
7.4. Test Results
As mentioned in the previous section, the Horsetooth Dam filter material was mixed to
5%, 10%, and 15% of HPF. For each fines content, water contents of 5%, 7%, 10%, and 13%
were tested. Table 7.1 shows the results of tests at these four water contents with 5% HPF. The
only test specimen which did not collapse completely in one minute or less was compacted at
13% water content.
Test results for the test specimens containing 10% HPF are shown in Table 7.2. The
specimens formed at 5% and 7% water contents collapsed within 16 minutes. Test specimens
compacted at higher water contents did not collapse in 64 minutes. This indicates that
compaction water content is an important factor governing collapse behavior. This finding is
substantiated by the results shown in Figure 7.4 and Figure 7.5.
113
Table 7.1 Sand Castle Test with 5% highly plastic fine