+ All Categories
Home > Documents > Investigation of the ballistic performance of Ultra High ... · ballistic studies on fabrics and...

Investigation of the ballistic performance of Ultra High ... · ballistic studies on fabrics and...

Date post: 04-Jun-2018
Category:
Upload: lythu
View: 214 times
Download: 0 times
Share this document with a friend
20
Investigation of the ballistic performance of Ultra High Molecular Weight Polyethylene composite panels Tomasz K. ´ Cwik a, , Lorenzo Iannucci a , Paul Curtis a,b , Dan Pope b a Department of Aeronautics, Imperial College of Science and Technology, London, UK b DSTL, Porton Down, UK Abstract The ballistic performance of Dyneema R HB26 and Spectra R 3124 subjected to high velocity impact of steel and copper Fragment Simulating Projectiles was evaluated. A 3D High Speed Digital Image Correlation was used for measurement of the panels front face deformation and the back face deformation. The information obtained from the measurements, along with the post-mortem observation of the panels, allowed to draw conclusions with respect to the importance of various energy dissipation mechanisms that occurred in the tested materials. It was observed that, although Dyneema R HB26 and Spectra R 3124 deform very dierently during the impact event, they had a similar ballistic performance. Keywords: Dyneema, Spectra, UHMWPE, ballistics, impact 1. Introduction High performance composite materials are currently extensively used in various defence applications requiring high protection levels and low weight at the same time. Typically, unidirectional (UD) cross ply (X-ply) laminates provide better protection against ballistic threats than composites reinforced with woven fabrics, whereas the latter tend to provide better protection than the UD X-ply laminates when exposed to blast threats. An extensive overview of ballistic studies on fabrics and compliant composite laminates was provided by Cheeseman & Bogetti [1]. The authors noted the importance of material properties and the fabric structure when designing against impact. The influence of the projectile geometry and the striking velocity, as well as many other factors, on the ballistic response of various materials were also discussed. Although a number of publications contributed to increasing the understanding of dynamic behaviour of compliant laminates, the processes occurring in these composites during impacts are still not fully understood. Iremonger & Went [2] conducted ballistic trials on Nylon 6.6/EVA laminates subjected to impact from a 1.1 gram Fragment Simulating Projectile (FSP). The authors noted that the fibres located in front face of the panel experienced one of the two dierent failure modes (transverse shear of fibres or stretch and tensile failure of fibres) depending on which edge of the projectile they were in contact. Prosser [3] investigated ballistic performance of a multilayer Nylon 6,6 fabric impacted with 0.22 FSPs. The author identified that the work of penetration per interior layer was constant. Penetration mechanisms were described in part II of his work [4], which is focused on providing more evidence that the major mode of failure of the Nylon panels impacted by the FSP were cutting and shearing mechanisms. Ballistic performance of Nylon 6,6 was also compared with the performance of Kevlar 29 in Figucia et al. [5]. The authors observed that tensile yarn straining was the main energy dissipating mechanisms in the tested fabrics, while the strain wave velocity was concluded to be the most influential parameter aecting the ballistic performance of the materials. An investigation of the ballistic performance of composites reinforced with aramid and ultra high molecular weight polyethylene (UHMWPE) fibres was conducted by Scott [6]. The author compared deformation characteristics, caused by the projectile impact, of rigid and compliant laminates. Similarly to Corresponding author Email address: [email protected] (Tomasz K. ´ Cwik ) Preprint submitted to Elsevier September 19, 2015
Transcript

Investigation of the ballistic performance of Ultra High Molecular WeightPolyethylene composite panels

Tomasz K. CwikIa,, Lorenzo Iannuccia, Paul Curtisa,b, Dan Popeb

aDepartment of Aeronautics, Imperial College of Science and Technology, London, UKbDSTL, Porton Down, UK

Abstract

The ballistic performance of DyneemaR© HB26 and SpectraR© 3124 subjected to high velocity impact of steel andcopper Fragment Simulating Projectiles was evaluated. A 3D High Speed Digital Image Correlation was used formeasurement of the panels front face deformation and the back face deformation. The information obtained from themeasurements, along with the post-mortem observation of the panels, allowed to draw conclusions with respect tothe importance of various energy dissipation mechanisms that occurred in the tested materials. It was observed that,although DyneemaR© HB26 and SpectraR© 3124 deform very differently during the impact event, they had a similarballistic performance.

Keywords: Dyneema, Spectra, UHMWPE, ballistics, impact

1. Introduction

High performance composite materials are currently extensively used in various defence applications requiringhigh protection levels and low weight at the same time. Typically, unidirectional (UD) cross ply (X-ply) laminatesprovide better protection against ballistic threats than composites reinforced with woven fabrics, whereas the lattertend to provide better protection than the UD X-ply laminates when exposed to blast threats. An extensive overview ofballistic studies on fabrics and compliant composite laminates was provided by Cheeseman & Bogetti [1]. The authorsnoted the importance of material properties and the fabric structure when designing against impact. The influence ofthe projectile geometry and the striking velocity, as well as many other factors, on the ballistic response of variousmaterials were also discussed. Although a number of publications contributed to increasing the understanding ofdynamic behaviour of compliant laminates, the processes occurring in these composites during impacts are still notfully understood. Iremonger & Went [2] conducted ballistic trials on Nylon 6.6/EVA laminates subjected to impactfrom a 1.1 gram Fragment Simulating Projectile (FSP). The authors noted that the fibres located in front face of thepanel experienced one of the two different failure modes (transverse shear of fibres or stretch and tensile failure offibres) depending on which edge of the projectile they were in contact. Prosser [3] investigated ballistic performanceof a multilayer Nylon 6,6 fabric impacted with 0.22 FSPs. The author identified that the work of penetration perinterior layer was constant. Penetration mechanisms were described in part II of his work [4], which is focused onproviding more evidence that the major mode of failure of the Nylon panels impacted by the FSP were cutting andshearing mechanisms. Ballistic performance of Nylon 6,6 was also compared with the performance of Kevlar 29 inFigucia et al. [5]. The authors observed that tensile yarn straining was the main energy dissipating mechanisms inthe tested fabrics, while the strain wave velocity was concluded to be the most influential parameter affecting theballistic performance of the materials. An investigation of the ballistic performance of composites reinforced witharamid and ultra high molecular weight polyethylene (UHMWPE) fibres was conducted by Scott [6]. The authorcompared deformation characteristics, caused by the projectile impact, of rigid and compliant laminates. Similarly to

ICorresponding authorEmail address: [email protected] (Tomasz K. CwikI)

Preprint submitted to Elsevier September 19, 2015

observations made by Iremonger [2], Scott highlighted the fact that there was a spring-back effect in the compliantlaminates i.e. the fibres at the front face after being compressed by the projectile, and having fractured, spring back inthe direction opposite to the projectile flight. Lee et al. [7] noted in their ballistic study involving Spectra 900R© thatalthough the matrix system did not seem to absorb substantial amounts of the impact energy, it definitely contributedto the overall amount of the energy absorbed by the composite. Flanagan et al. [8] compared ballistic performanceof various fabrics of different architectures, made of Spectra 1000R©, Kevlar 129R©, and Twaron 2000R©. An epoxy resinwas used as the matrix system. 12 gram right cylinder projectiles with a length-to-diameter ratio of 3 were fired at200 - 1100 m/s. It was observed that the failure modes experienced by the panels changed with increasing the strikingvelocity. At velocities higher than 800 m/s shear-plug formation was the main failure mode at the front face of thepanels, whereas fibre breakage and pullout were observed at the back face of the panels. Cunniff [9] showed thatthe ballistic performance of composites reinforced with highly aligned polymeric fibres (e.g. DyneemaR©, KevlarR©,SpectraR©, ZylonR© etc.) depends largely on the yarns sonic velocity and the energy-based mass absorption capacityof the fibres . Although the dimensionless analysis proposed by Cunniff provides reasonable predictions for somematerials made of the high performance fibres, it is a ”first-level screening tool to assess the performance of fibres”as noted by Cheeseman & Bogetti [1]. The analysis simplifies the impact problem to only two parameters whichare related to the yarn physical and mechanical properties. The analysis does not take into consideration: strain rateeffects in the fibres, non-linearity of the yarn stress-strain curve, plastic deformation of the yarns, influence of thecomposite matrix system and all the associated phenomena.

This paper presents results of ballistic testing of DyneemaR© HB26 and SpectraR© 3124. DyneemaR© HB26 is a prod-uct made by DSM Dyneema, whereas Spectra 3124 is produced by Honeywell. The tests were conducted to providevalidation data for high fidelity numerical codes. A highly instrumented experimental setup was used to obtain qual-itative information regarding deformation and strain distributions on both the front and rear faces of the panel duringthe impact event. The high quality impact data provide an insight into understanding the physical phenomena takingplace in these two high performance composite materials during projectile penetration, and thus identify to what extentthe ballistic properties of the panels are actually dependant on the properties of the expensive high performance fibres.The information should help improve numerical modelling techniques and analytical methods used to determine theV50 of a laminate.

2. Materials

The following materials were tested in this study: DyneemaR© HB26, SpectraR© 3124. Both had a 0/90 cross plylayup and were provided as already consolidated panels. All tested panels had areal density of 23.5 kg/m2 and were300 x 300 mm. The nominal thickness of all panels was 23 mm, however the average measured thicknesses were24.02 mm and 24.08 mm for the DyneemaR© and the SpectraR©, respectively. According to the authors best knowledge,areal density of single ply of DyneemaR© and SpectraR© were similar and close to 260 g/m2 i.e. both type of panels hadabout 90 plies. The average weight of the panels was 2.118 kg and 2.060 kg for DyneemaR© and SpectraR©, respectively.15 DyneemaR© panels and 12 SpectraR© panels were tested.

3. Experimental setup

The trials employed 20 mm diameter steel and copper Fragment Simulating Projectiles (FSPs) fired at up to1.2 km/s at zero obliquity by a powder gas gun. The steel projectiles were manufactured to STANAG 2920 [10], whilethe copper projectiles had exactly the same geometry, but higher mass (as a consequence of the density of copper). Astandard copper was used for the projectiles (ρ= 8930 kg/m3, E= 110 GPa, σY= 70 MPa). The projectiles weighed53.1±0.15 gram and 60.25±0.25 gram, respectively.

The back face of the tested plates was supported in all four edges. The panels were clamped by four clamps withbolts fastened in the direction transverse to the flight of the projectile, as shown in Figure 1 (the panel is shown inorange). This clamping system guaranteed the panel remained in place, while no substantial compression force wasapplied to the panel. No holes were made in the panels. Most of the figures in this paper showing snapshots from highspeed videos show the entire width of the panel visible from the back of the rig, i.e. 250 mm in Figure 1, and slightlymore than half of the panel hight i.e. about 150 mm.

2

Figure 1: The CAD drawing of the ballistic rig used in the study.

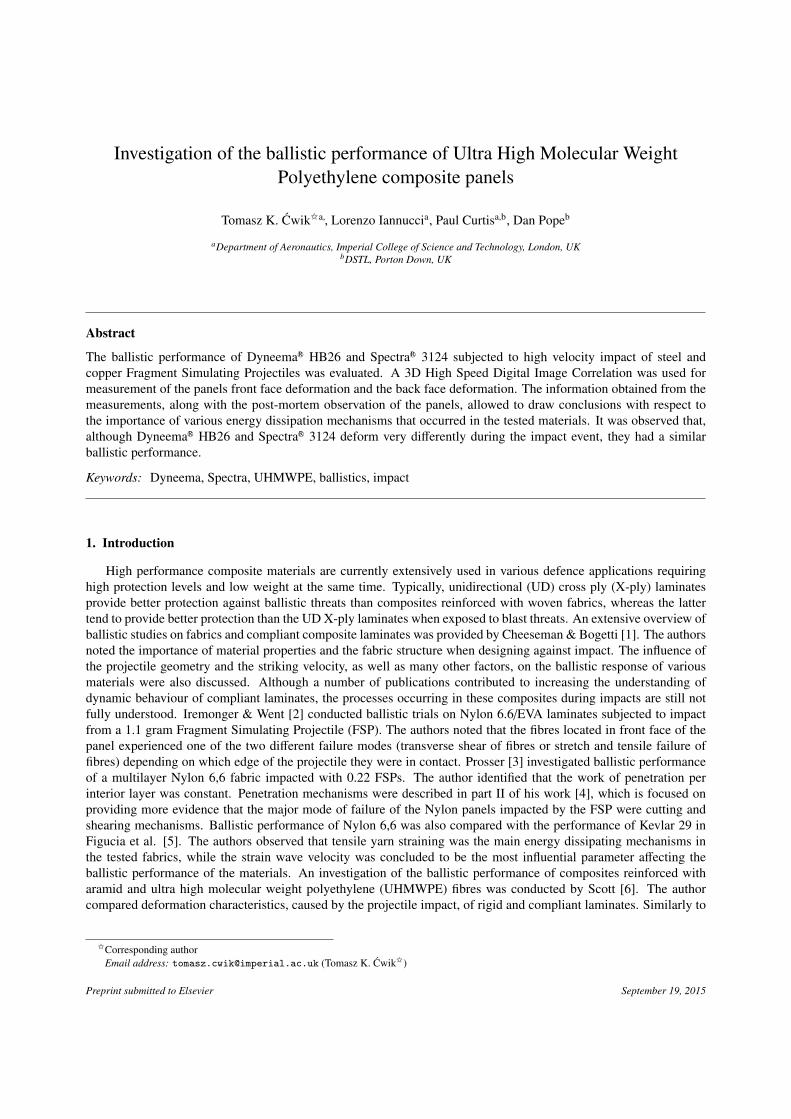
A typical experimental setup is presented in the Figure 2 (schematically) and Figure 3 (in practice). Up to sixVision Research high speed cameras were used during the trials. Table 1 lists all the high speed cameras used for thestudy and their settings. All cameras had a common trigger and common time reference (IRIG). This allowed to cor-relate the recorded deformation observed at the front face with the back face deformation. Additionally, the camerasused for the DIC had their frames synchronized (F-sync). The striking velocity of the projectile was measured eitherby an infrared gate or by Doppler radar. Typically, two high speed cameras were used for the front face 3D DigitalImage Correlation (DIC), another two cameras were used for the rear face 3D DIC, and one high speed camera wasused for measurement of the residual velocity. When the front face 3D DIC set was unavailable, a single high speedcamera was used for recording the front face deformation. The rear DIC cameras were positioned approximately 1.6m away from the target, whereas the front DIC cameras were approximately 1.5 m from the target. Projectiles whichpenetrated panels were caught in a wooden catcher box filled with sand and rags.

A C-shape object, shown in Figure 3b, of known dimensions was used as the calibration object for the residualvelocity camera. The software used for the high speed cameras has an inbuilt algorithm for measurement of displace-ment and velocity of the observed object, but it requires defining a known reference length. In this case, the length wasdefined by using the C-shape object. Tracing paper was used to dim the light required for illumination of silhouette ofthe projectile and panel observed by the residual velocity camera.

The speckle pattern was painted on the panels and on the test rig using black markers. The dots on the rig weremade in order to identify whether the rig moved during the experiments. It was found that the movement of the rigduring the experiments was negligible and therefore it was not necessary to subtract it from the movement/deformationof the panel.

4. Results and discussion

4.1. Ballistic curves

Greenhalgh at al. [11] postulates that different processing conditions (consolidation pressure during fabri-cation) may influence the global failure mechanism characteristics occurring in consolidated polyethylene panels,subjected to impact loading. As a result the panels may have different ballistic performance depending on the man-ufacturing cycle adopted and whether it was optimised for ballistic impact. The DyneemaR© panels used in this studywere provided by DSM, but the processing cycle was not disclosed to the authors. Similarly, the processing cycle

3

Figure 2: Schematic diagram of the experimental setup.

Figure 3: The actual ballistic testing experimental setup.

4

Table 1: Specification of the Phantom cameras setup used in this study.

DyneemaR© HB26 SpectraR© 3124Front 3D HS DIC set

Camera model - Phantom V711Frame rate - 39k fpsResolution - 464 x 320 px

Lens - 50mm NikonRear 3D HS DIC set

Camera model Phantom V711 Phantom V16Frame rate 41k fps 82k fpsResolution 512 x 304 px 512 x 304 px

Lens 50mm Nikon 50mm NikonSide camera

Camera model Phantom V16 Phantom V12Frame rate 87k fps 62k fpsResolution 284 x 336 px 256 x 280 px

Lens 100mm Carl Zeiss 24-85mm NikonFront cameraCamera model Phantom V12 Phantom V12

Frame rate 21k fps 65k fpsResolution 512 x 512 px 200 x 304 px

Lens 50mm Nikon 100mm Carl Zeiss

of SpectraR© remains unknown to the authors as the panels were provided by a third-party supplier who manufacturedthem using the standard recommended cycle. Therefore, it should be noted that the ballistic behaviour of the twomaterials may have been influenced by the manufacturing processes used to make them.

The ballistic trials were conducted in a slightly different manner than a conventional V50 trial. Due to the fact theaim of the trials was to generate large amounts of data required for validation of advanced numerical simulations (i.e.the estimation of V50 was not the main goal) and because a limited number of panels were available for the study, thestriking velocity, Vs, was increased every shot by approximately 100 m/s up to more than 1 km/s. Figure 4 presentsthe ballistic curves. St denotes Steel, while Cu denotes Copper. During the trials it was observed that in some teststhe rear part of the panel debonded and flew off with the projectile i.e. the projectile was not visible to the cameras.In these cases the residual velocity was measured from the movement of the panel (not the projectile) and these shotsare denoted ”BF” in Figure 4, which stands for ”Back Face” measurement. These residual velocity values shouldbe treated with caution, as clearly if the panel was larger additional work would be performed in failing the ejectedcomposite.

The collected data indicated that the ballistic limit (BL) of the materials is approximately in the region of: 700m/s for DyneemaR© HB26 impacted with steel and copper FSPs; and 600 m/s for SpectraR© 3124 impacted with steel,while approximately 700 m/s when impacted with copper FSPs. The data is not sufficient to provide more preciseestimates of the ballistic limits. It should be also emphasized, once again, that the edge effects might have influencedthe response of the panels. In the firings in which the residual velocity was measured from the panels’ back face, mostlikely the projectile would be caught, if a larger panel was used. Thus, the ballistic limits could have been different.

4.2. Deformation of the projectiles

The projectiles which penetrated the panels were caught by the catcher box filled with sand and rags. Priorto the experiments test projectiles were shot into the catcher box, with no panel in the ballistic rig, to identify theinfluence of the box and the sand on the deformation of the projectile. It was found that the steel projectiles did notdeform, irrespectively of the striking velocity. The copper projectiles fired at low velocities (e.g. 200-400 m/s) did notdeform during the catching process. However, copper projectiles fired at high velocities (e.g. 1 km/s) deformed to acertain extent. Figure 5a shows a copper projectile that was fired at 1 km/s into the catcher box. It was observed thatthe projectile deformed due to the impact. Therefore, the deformation of the projectiles presented in the Figure 5d and

5

Figure 4: Experimental points for Dyneema R© HB26 and Spectra R© 3124, for copper and steel FSPs.

e is a resultant of the deformation during penetration of the tested panel and during the penetration of the catcher box.No weight loss of the steel projectiles was noticed for all tests. The copper projectiles deformed substantially

during the impact, however any significant weight loss was only noticed for two projectiles which impacted DyneemaR©

panels at 1047 m/s and 1094 m/s (the two projectiles lost 1.49g and 2.58g of mass, respectively). The extent ofdeformation of the copper FSPs increased along with the increasing striking velocity.

Figure 5: Photographs of the post-mortem projectiles: a) The copper FSP fired into the catcher box at 1 km/s (top view and side view); b) St FSP,Dyneema R© HB26, Vs=1008 m/s; c) St FSP, Spectra R© 3124, Vs=1016 m/s; d) Cu FSP, Dyneema R© HB26, Vs=1047 m/s; e) Cu FSP, Spectra R©

3124, Vs=1027 m/s.

The data in Table 2 indicates that panels impacted with copper projectiles lost more weight than panels impactedwith steel projectiles. DyneemaR© and SpectraR© panels lost on average 0.129% and 0.048% of their initial weight,respectively, when impacted with steel projectiles; while 0.271% and 0.048% average weight loss was observed forthe two materials respectively, when impacted with a copper projectile. This is probably the result of copper lowyield strength (and possibly due to the shock heating discussed in the next section) which allowed for more extensive

6

plastic deformation of the projectile during the impact event, as it was shown in Figure 5. The ”mushroomed” copperprojectile has a greater effective area which allows it to affect (e.g. tear or melt) a larger amount of the material that isin contact. The data for copper projectiles shows also that the weight loss is greater for shots above the BL. In termsof the steel projectiles, it is difficult to say whether more material was lost with shots fired above the BL velocity, asthe measured difference of the lost mass was very small and the number of tested panels was not sufficient to observeany trends.

Table 2: The average panel weight loss after the impact.

Units Dyneema R© HB26 Spectra R© 3124FSP type St Cu St Cu

Below BL g 3.5 4.5 1.0 0Above BL g 2.0 7.0 1.0 2.0

4.3. The front face deformationIt is known that a material is in the hydrodynamic state if the velocity of the waves propagating in the material

is higher than the sound velocity in the material i.e. there is a shock wave in the material. Figure 6 shows the Equationof State (EoS) curves for DyneemaR© (in-fibre direction - the red dots; and in transverse direction - blue dots), as wellas for bulk polyethylene (PE), coming from reference [12] in which the authors reference results from other studies(i.e. the PE results). The figure shows that the sound velocity in the transverse direction of DyneemaR© is slightlyless than 2 km/s. If the material is impacted at the particle velocity (i.e. the striking velocity) of 400 m/s or higher,a shock is created in the material which propagates at a velocity higher than the sound velocity in the transversedirection of DyneemaR©. Considering the fact that similar striking velocities were used in the presented study, it is fairto presume that a certain region of the DyneemaR© panel was in the hydrodynamic state during the ballistic test. Due

Figure 6: The EoS curves for Dyneema R© and PE [12].

to the additional high speed camera that was recording the very point of impact every 15.38 µs, during the trials withSpectraR© 3124, it was possible to observe that actually during the first 15.38 µs, although the projectile was penetratingthe panel, there was no lateral movement of the adjacent material at all. Any movement of the material was observedin the subsequent frames (30.76µs and later). This indicates that for at least the first 15.38 µs, but less than 30.76 µs,a certain part of the front face material experienced an inelastic deformation. Figure 7 presents snapshots from thePhantom camera. Assuming that the Equation of State (EoS) of Spectra 3124R© is similar to the DyneemaR© EoS (as bothcomposites have the same mass density and they consist of similar polyethylene fibres) considering the observations

7

from the high speed videos, it is very likely that certain regions of the SpectraR© panel were also in the hydrodynamicstate during the conducted experiments.

Figure 7: Front face, magnified view of Spectra R© 3124 panel impacted with copper FSP at 773 m/s.

It was observed that during all experiments at the instance of projectile-panel contact a bright flash, circular inshape was generated (see Figure 8). The shape of the flash changed from the circle to a peanut as the projectilestarted penetrating the panel. This was followed by ejection of fragmented stoke melted material from the sides ofthe projectile chiselled nose, and then by a global deformation of the front face and ejection of larger quantities of thematerial. It was not identified whether the ejecta consisted of the polyurethane (PU) resin, or the polyethylene fibres,or both. It is believed that the flash was a result of the pressure rise at the projectile-panel interface and in the adjacent

Figure 8: Front face view of a Spectra R© 3124 panel impacted with copper FSP at 773 m/s.

areas due to shock loading induced by the impacting projectile, which caused the rise of the temperature in bothbodies. Figure 9 and Figure 10 present how the temperature and pressure changes in DyneemaR© during shock loading,with respect to the striking velocity, respectively. The charts were created based on the data from reference [12].Following Hazel et al. [12], the temperature during shock loading was approximated by calculating the temperaturealong the adiabat (Ta) using the following equation:

Ta = T1exp[Γ − Γ(vv0

)] (1)

The pressure in the material was calculated as follows:

p = ρUsup (2)

8

where Γ is Gruneisen gamma, T1 is the initial temperature of the sample (300oK), v0 is the specific volume at ambientconditions, ρ is the mass density of the material, Us is the shock velocity, and up is the particle velocity (i.e. thestriking velocity). The Equation of State (EoS) of DyneemaR© in the through thickness direction was given by Us =

1.81 + 2.72Up based on the information provided by Hazel et al. [12]. Additionally, the charts contain informationabout the melting temperature of the DyneemaR© fibres, denoted as “PE” in the charts, and about the thermoplasticpolyurethane (TPU) resin. The melting temperature range of the former is 144-152oC [13], whereas the TPU resinmelts at about 180oC [14]. Figure 9 shows that below the striking velocity of 800 m/s, neither PE fibres nor TPU

Figure 9: Temperature rise along the adiabat for compressed Dyneema R©. Figure 10: Pressure rise in the compressed Dyneema R©.

melts. At striking velocities higher than 800 m/s only the PE fibres melts. The latter would explain why both Spectra3124R© and Dyneema HB26R© tested in this study had very similar residual velocities for the striking velocities higherthan 850 m/s (see Figure 4). Figure 7 in Hazel et al. [12] shows that no melting was observed at striking velocitiesof 259 m/s and 600 m/s, however melting was observed in the material impacted at 947 m/s. Greenhalgh et al. [11],however, conducted a fractographic analysis of similarly tested panels and concluded that the matrix resin melted andresolidified on the fibres after the impact. Thus, a more detailed fractographic analysis of the panels tested in thisstudy would identify what actually melted.

Figure 11 and Figure 12 present out-of-plane and in-plane displacement of a point selected on the surface ofthree SpectraR© panels, for the two projectile types, obtained from the front face 3D High Speed DIC. It should beemphasized that the measured points were not exactly the very same points in each case. Also, due to the destructivenature of the experiment it was impossible to obtain any DIC readings from the very impact point. As a result, thepoints as close to the impact point as possible were selected. Typically the measurement point was 50 mm below theimpact point, in the horizontal centre of the panel. The DIC measurements show that the in-plane movement of thematerial occurred first, before the out-of-plane movement. The former started approximately after the first 50 µs ofthe projectile penetration, while the latter approximately after 100 µs. This is no surprise as the sonic velocity alongthe DyneemaR© fibres is much higher than the transverse velocity through the DyneemaR© panel. Figure 12 shows thatthe projectile material did not influence the in-plane response of the front part of the SpectraR© panels, during the initialstages of the impact. However, it was observed that the velocity of the deformation depends on the striking velocity(the slope of the curves is higher for impacts at lower striking velocities). The panels impacted at lower velocitiestended to deform in-plane quicker than the panels impacted at higher velocities. In terms of the out-of-plane paneldisplacement, it was observed that the projectile material influenced the response of the panel. Panels impacted withcopper FSPs deformed more than the ones impacted with steel FSPs. Figure 13 and Figure 14 show the front face ofan impacted Dyneema panel and a cross section view at the impact area, respectively. The compression deformationobserved around the impact hole in Figure 13 (but also present in many other tested panels), that resembles a typicalopen hole problem, occurred at the later stages of deformation, long after the projectile penetrated the initial thicknessof the panel. The deformation was onset by the moving projectile which pushed away the adjacent material, as showedin the Figure 7, at about 31 µs after the impact. From then on, the wrinkles propagated towards the edges of the panel,resulting in the type of deformation observed in the Figure 13.

9

Figure 11: The out-of-plane time-displacement history of a point on thefront surface of Spectra R© 3124.

Figure 12: The in-plane time-displacement (in horizontal direction) his-tory of a point on the front surface of Spectra R© 3124.

The DIC measurements showed that the SpectraR© front face experiences less than 1% tensile strain during the

Figure 13: Magnified view on the Dyneema R© HB26 panel impacted at509 m/s by a steel FSP. Figure 14: View at the impact point of the Dyneema HB26 panel.

impact event (typically substantially less, which was at the level of the measurement noise), regardless of the impactvelocity. Unfortunately, it was impossible to conduct a similar analysis (the front face 3D DIC) on the DyneemaR©

panels.

4.4. Location of the First Major Delamination (FMD)

Figure 15 and Figure 16 present two full panels which were impacted at different velocities by two differentprojectiles. Typically during the ballistic trials, the rear part of a DyneemaR© panel was drawn in during the projectilepenetration. The kinetic energy of the projectile was dissipated by the lateral deformation of the rear part of the panelwhich acted as a membrane. As the material deformed out of plane, the edges of the rear part of the panel were drawnin, which created the substantial delamination, example of which is shown in Figure 15. A similar response was alsoobserved for SpectraR© 3124, however, the material appeared to be less stiff than DyneemaR© which was pronounced bylarger lateral deformations of the entire panel (including the front part of the panel), as shown in Figure 16. This largedelamination is denoted in this paper as the First Major Delamination (FMD). Such nomenclature was implementeddue to the fact that although, quite often, there were other smaller delaminations observed earlier, at the edges ofthe panel, there were always one or two larger ones, after which the deformation of the panel was different to what

10

Figure 15: Full Dyneema R© HB26 panel impacted at 1410 m/s by a steelFSP.

Figure 16: Full Spectra R© 3124 panel impacted at 466 m/s by a copperFSP.

was observed prior to this delamination (at the “front part” of the panel). It is noted also that the delaminations wereapparent due to a relatively small panel size used for the trials. Most likely they would not be visible if 1 m2 panelswere used.

In order to estimate the exact location of the transition between the front part of the panel and the rear part ofthe panel (the part that experienced the membrane behaviour), the authors measured the distance from the front faceof each tested panel to the first major delamination and plotted it against the striking velocity. Also, in the previoussection it was noted that no movement of the front face material was observed for a short period of time, during eachtest with SpectraR© panels. The author multiplied this time period by the striking velocity of the projectile in those testsin order to see at what depth of the panel the projectile was, when the front face surface movement was observed for afirst time by the 3D DIC. This calulation was made for each SpectraR© panel. All these measurements and calculationsare presented in Figure 17 and Figure 18. The ”0” value on the y-axis denotes the panel front face, the “24” valuedenotes panel rear face.

Figure 17: Location of the FMD for Spectra R© 3124 panels. Figure 18: Location of the FMD for Dyneema R© HB26 panels.

The presented data shows that the location of the transition region is striking velocity dependent. The first majordelamination occurs deeper in the panel as the striking velocity rises. Also, the delamination occurred deeper in panelsimpacted with steel FSPs than in panels impacted with copper FSPs. However, it should be noted that the distancewas measured using a calliper and the measured data was averaged over four sides of the panel. Thus, it is fair topresume that there is no (or there is very little) difference in the through thickness location of the transition plane,between the response of the two materials subjected to impact of steel and copper FSPs. Figure 17 shows that thedistance obtained from the high speed videos is similar to the results obtained from the manual measurements. Thisindicates that there might be a relationship between the location of the FMD and the response of the front part of thematerial. It was noted in the previous section that the 3D DIC measurements revealed that the panels impacted atlower velocities tended to deform in-plane quicker than the panels impacted at higher velocities. Figure 17 shows thatthe panels impacted at lower velocities had also the front part of the panel thinner compared with panels impactedat higher velocities. Possibly, the deformation of the rear part of the material might have influenced the front face

11

deformation. A thinner front part would respond to the rear part deformation probably quicker. The slight differencein the curves slope (the manual measurements versus the high speed video measurements) might be the result of (ontop of the measurement error discussed earlier) assumptions made on the timespan of the projectile presence in thefront part of the panel - the limitation associated with camera frame rate (frame every 15.38 µs). This error could bereduced by using a higher specification camera (e.g. Phantom V2511) for the measurement.

In some cases, it was observed that at the rear surface of the front part of the panel the very outer layers ex-perienced a very localized (approx. two projectile diameters) membrane-type of loading, which indicates that thetransition region between the front part and the rear part of the panel, has a certain thickness i.e. it is not a sudden stepchange in the material behaviour. The latter ought to be confirmed by a fractographic analysis of the impacted panelsand by Computed Tomography (CT) scans that will be conducted in near future.

4.5. The back face deformationThe experiments showed that the back face deformation of the panels differed substantially depending on the

striking velocity. Figure 19 presents the out-of-plane deformation histories for the horizontal mid-plane section ofthe tested panels, obtained from the 3D DIC measurements. The plots were divided into three columns, from left:below the ballistic limit (except SpectraR© 3124 impacted with steel FSPs), close to the ballistic limit, and at strikingvelocities substantially higher then the ballistic limit. The information about the striking velocity and the projectiletype are provided in the top, left corner of each plot. The time frame stamp is provided next to each curve. The lengthof the plotted section was 220 mm, which is almost the entire length of the panel in the effective impact window. Itshould be noted that the sections used for the plot i), j), and k) were not in the mid-plane but slightly below, due tothe poor speckle pattern in the mid-plane area. The authors understand that it might be more convenient to validatea numerical model using a one point time-displacement history. Thus, the time-displacement histories for a pointlocated in the centre of the sections used for plots in Figure 19 are given in Figure 20 and Figure 21. The two chartsare not further discussed herein as the focus is put on the data presented in Figure 19. It is observed that some of thecurves are broken in Figure 19. This is a result of either panel damage due to the projectile penetration e.g. b), c), f);or due to problems with recognizing the pattern at high deformations e.g. a), i). The plots also show that not all shotswere made exactly in the center of the panels e.g. c), g). A numerical artefact is also visible on the very bottom curveof the plot f) - the curve should be a smooth bump as all the other curves.

The data presented in the three columns of Figure 19 show that the response of the two materials changes withincrease of the striking velocity. The materials response becomes more local as the striking velocity increases. Thedata shows that for the DyneemaR© panels impacted below their BL (the first column), the initial deformation occursat the impact point, in the in- and the out-of the plane directions, whereas at the final stages of the penetration, theout-of-plane deformation at the impact point does not change considerably while a substantial out-of-plane movementtakes place at the areas remote to the impact point (see Figure 19d ). It is noted that the deformation reaches the edgesof the panel. This phenomenon is less pronounced for the SpectraR© panels due to the fact that the panel, as mentionedpreviously, almost always split into two halves during projectile penetration. The 3D DIC measurements (plots h),i), and k)) shows that the unpenetrated SpectraR© rear surface, at later stages of deformation, flew away towards thehigh speed cameras. The plots presenting deformation of panels subjected to shots at very high velocities (the thirdcolumn) show that deformation of both materials is very local and the out-of-plane displacements are relatively low;less than 30 mm (except for the SpectraR© 3124 impacted with steel FSP which split into two halves).

In general, the data in Figure 19 shows that DyneemaR© HB26 was characterized by lower out-of-plane displace-ments than SpectraR© 3124. Also, the deformation of DyneemaR© HB26 impacted below or at the BL reached the edgesof the panel (plots a), d), e) in Figure 19), while this was not taking place for the SpectraR© panels impacted at similarstriking velocities (plots g), h), j) and k)). This means that the load applied by the projectile was being distributedover the larger area in the DyneemaR© case, compared with SpectraR©. It appears that a similar size of area was beingdeformed for both materials, when impacted at very high velocities e.g. 1 km/s. These observations allowed to drawthe following conclusions: a) most likely DyneemaR© HB26 has higher interlaminar shear strength and shear stiffnessthan SpectraR© 3124. The two properties allowed DyneemaR© material to transfer the load applied by the projectile moreeffectively throughout the panel over the larger area, while deforming less than a comparative SpectraR© 3124 panel.;b) the fact that deformation of both materials was similar at very high velocities while substantially different whenimpacted at lower velocities may indicate that the resin used as matrix system in both materials may be different (the

12

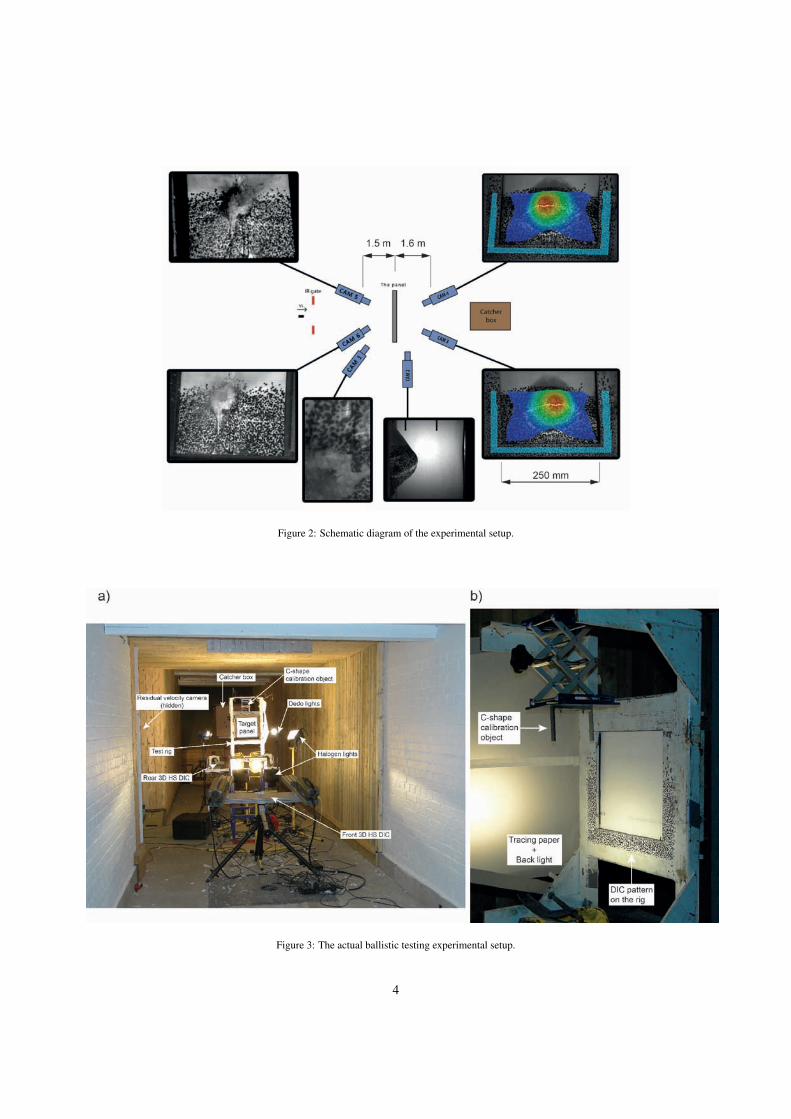
two may have different strain rate properties). The latter has a direct influence on how the applied load is transferredbetween the adjacent plies and within them. An alternative explanation is that as the matrix and the fibres are softeneddue to temperature rise caused by the shock, the projectile penetrates both panels in a similar manner. These genericconclusions are depicted by an example case presented in Figure 22.

Figure 19: The out-of-plane displacement histories of the mid-plane horizontal section of the experimental panels, obtained from the 3D DICmeasurements, for three different velocity ranges (below the BLs: a),d),g,j; at the BL or just above: b),e),h),k); substancially above the BLs:c),f),i),l) ). Row 1: Dyneema HB26 impacted with steel FSP; Row 2: Dyneema HB26 impacted with copper FSP; Row 3: Spectra 3124 impactedwith steel FSP; Row 4: Spectra 3124 impacted with copper FSP.

At 50 µs after the impact both DyneemaR© and SpectraR© panels seem to deform similarly in terms of the in-planeand the out-of-plane displacement. (The applied kinetic energy is probably dissipated by yarn straining, internaldamage growth and the panel deformation. The in-plane waves propagate away from the impact point through theyarns). However, as the time progresses (120 µs) the in-plane deformation area of SpectraR© increases only to a smallextent, most of deformation takes place out of the plane; while the deformed in-plane area of DyneemaR© increased insize about twice. The out-of-plane panel deformation also increased. (Most likely the low shear strength of SpectraR©

allowed for quick delamination growth in one or more planes inside the panel thus allowing for less restricted out-of-plane movement. The higher shear strength and shear stiffness of DyneemaR©, possibly in conjunction with theinfluence of the material layup, facilitates further in-plane load transfer. The waves continue to propagate towards the

13

Figure 20: Time-displacement history of the point on the rear surface ofthe tested panels.

Figure 21: Time-displacement history of the point on the rear surface ofthe tested panels - magnified view.

Figure 22: Comparison of the back face deformation of two panels impacted at approximately 510 m/s with steel FSPs: a) Spectra R© 3124; b)Dyneema R© HB26.

edges of the panel. The initial circular deformation shape becomes a rectangle as the load is transferred via shear inthe regions between the primary yarns perpendicular to each other. It is emphasized that the above statements on theshear strength and stiffness of the two materials are entirely based on the shear deformation information obtained fromthe DIC measurements, which are described in the subsequent section). During the following 580 µs the tensile wavetravelling in the mid-plane of SpectraR© panel reached the edges of the panel, which was pronounced as the drawing-inof the primary fibres. In terms of DyneemaR© the in-plane deformation reached the edges of the panel, while the out-of-plane deformation further increased. No drawing-in was observed. (Possibly the low intralaminar shear strength ofSpectraR©, or extensive slippage at the yarn/matrix interface, or ductility of the used matrix, or all of these together allowfor extensive in-plane movement of the primary and the secondary yarns, as the out-of-plane deformation progresses).In the subsequent deformation stages (not shown in here) the DyneemaR© captured the projectile and ”relaxed”, whilethe the SpectraR© also captured the projectile, but the rear part of it almost completely slipped out of the rig. The latter isbelieved to be associated with the edge effects. It is noted here that when determining the ballistic limit of a compositepanel the edge or boundary of the panel should not affect the result, otherwise the ballistic limit is determined for thespecific panel size, and may not be a function of its thickness. A common assumption is that the transverse or kinkwave speed does not reach the boundary and return to the impact site during the event, i.e. during penetration of the

14

panel, which typical occurs in less than 200 microsecs. For UHMWPE and the velocities considered in this paper theboundary or edge support conditions should not affect the ballistic limit results.

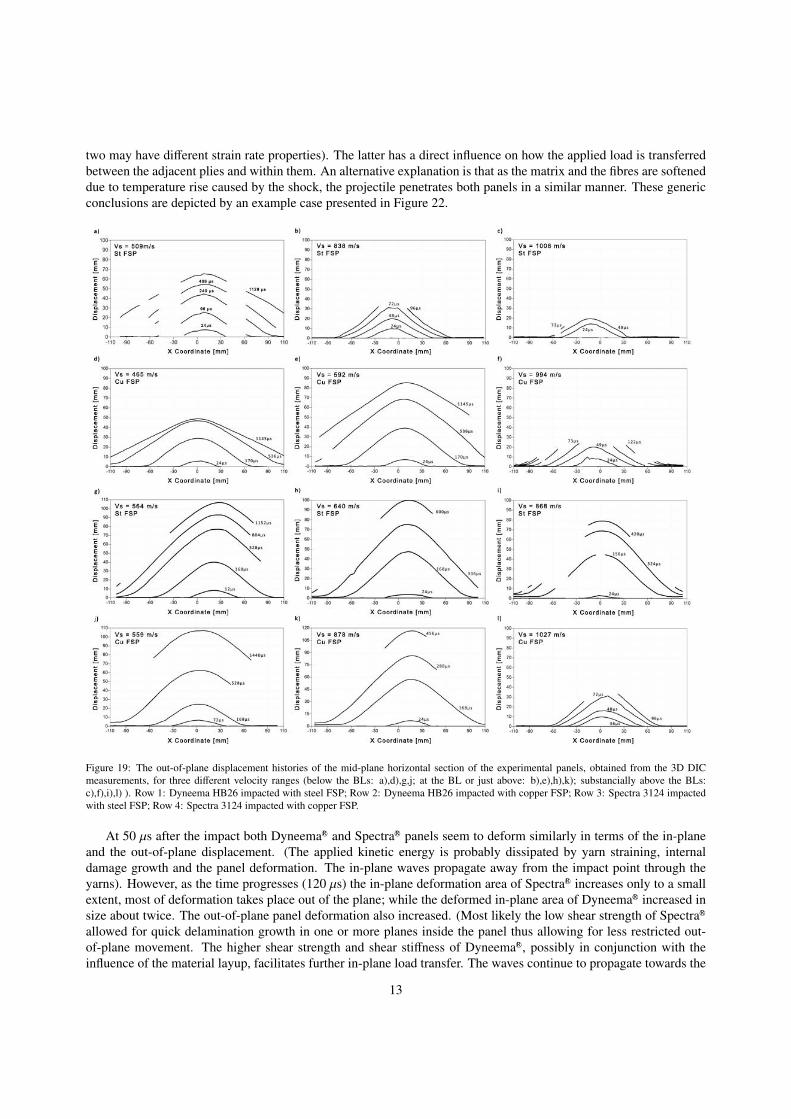
Figure 23 presents strain readings from the same section that was used in Figure 19. Each plot in the figure showsthe highest strains recorded in a number of time frames - this should give the reader an appreciation of what strains thepanels experienced throughout the experiments. The logarithmic strain in the horizontal direction, denoted as EpsilonX, is plotted on the Y-axis (0.04 is the maximum value on each chart). All other annotations remain the same as in

Figure 23: The in-plane strain histories of the mid-plane horizontal section of the experimental panels, obtained from the 3D DIC measurements,for three different velocity ranges (below the BLs: a),d),g),j); at the BL or just above: b),e),h),k); substancially above the BLs: c),f),i),l) ). Row 1:Dyneema HB26 impacted with steel FSP; Row 2: Dyneema HB26 impacted with copper FSP; Row 3: Spectra 3124 impacted with steel FSP; Row4: Spectra 3124 impacted with copper FSP.

Figure 19. Although the charts look “noisy”, it is not noise that is presented but the actual data from many time framesoverlaid on each other. The spikes are partially a result of relatively low camera frame rate that was used. The curveswould be more smooth, if a higher camera frame rate was used (which was impossible during the experiments dueto the selected resolution). It is observed that as the striking velocity rises (from the first column on the left to thethird column), the fewer readings were plotted. This is due to the fact that as the measurement setup remained thesame throughout all experiments (cameras resolution and frame rate) but the striking velocity increased, the material

15

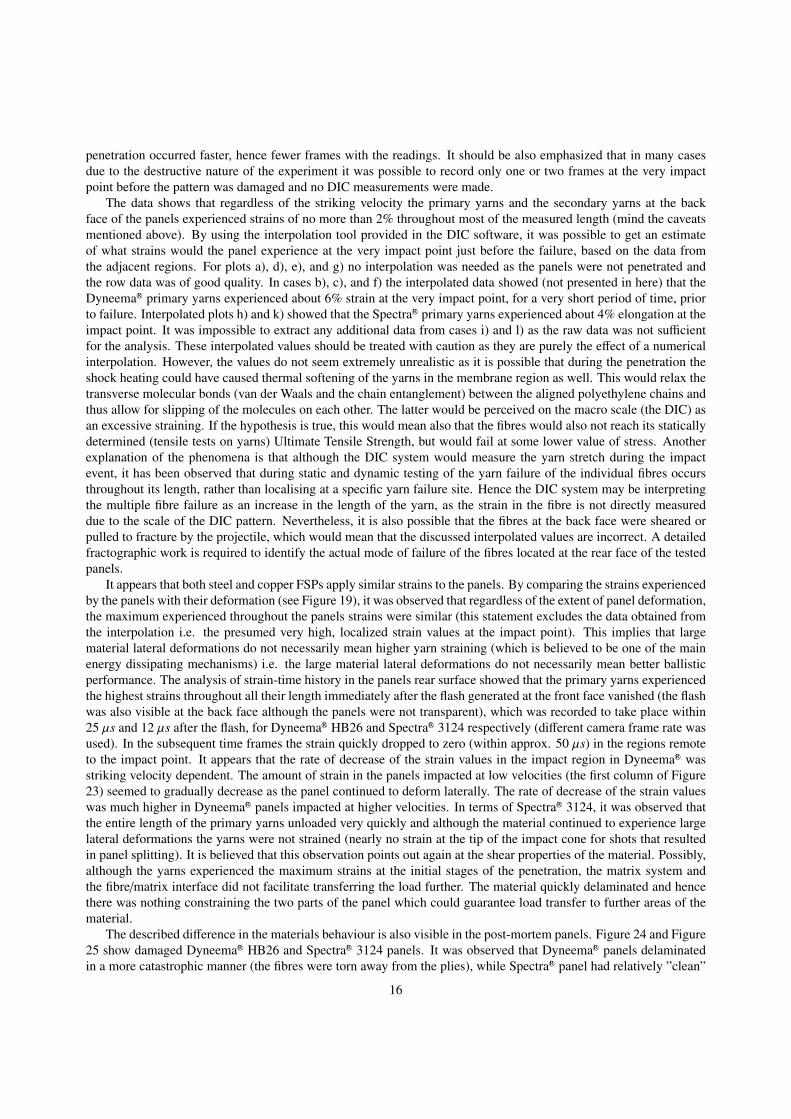
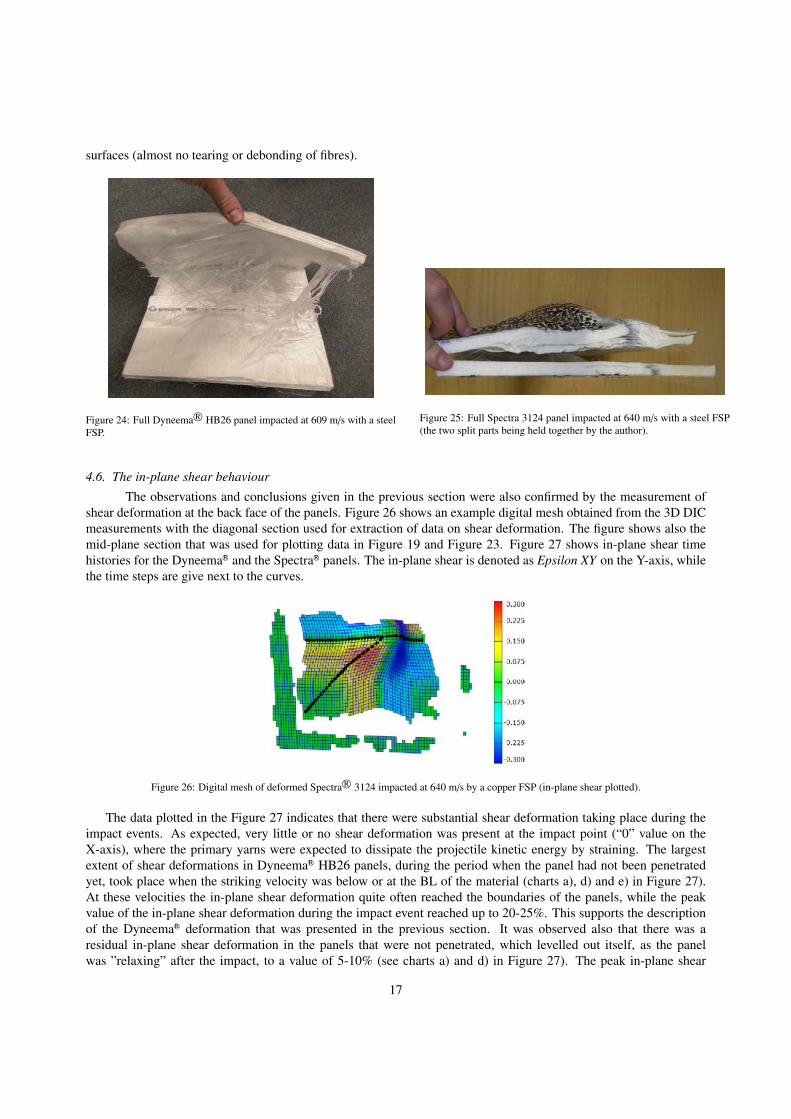
penetration occurred faster, hence fewer frames with the readings. It should be also emphasized that in many casesdue to the destructive nature of the experiment it was possible to record only one or two frames at the very impactpoint before the pattern was damaged and no DIC measurements were made.

The data shows that regardless of the striking velocity the primary yarns and the secondary yarns at the backface of the panels experienced strains of no more than 2% throughout most of the measured length (mind the caveatsmentioned above). By using the interpolation tool provided in the DIC software, it was possible to get an estimateof what strains would the panel experience at the very impact point just before the failure, based on the data fromthe adjacent regions. For plots a), d), e), and g) no interpolation was needed as the panels were not penetrated andthe row data was of good quality. In cases b), c), and f) the interpolated data showed (not presented in here) that theDyneemaR© primary yarns experienced about 6% strain at the very impact point, for a very short period of time, priorto failure. Interpolated plots h) and k) showed that the SpectraR© primary yarns experienced about 4% elongation at theimpact point. It was impossible to extract any additional data from cases i) and l) as the raw data was not sufficientfor the analysis. These interpolated values should be treated with caution as they are purely the effect of a numericalinterpolation. However, the values do not seem extremely unrealistic as it is possible that during the penetration theshock heating could have caused thermal softening of the yarns in the membrane region as well. This would relax thetransverse molecular bonds (van der Waals and the chain entanglement) between the aligned polyethylene chains andthus allow for slipping of the molecules on each other. The latter would be perceived on the macro scale (the DIC) asan excessive straining. If the hypothesis is true, this would mean also that the fibres would also not reach its staticallydetermined (tensile tests on yarns) Ultimate Tensile Strength, but would fail at some lower value of stress. Anotherexplanation of the phenomena is that although the DIC system would measure the yarn stretch during the impactevent, it has been observed that during static and dynamic testing of the yarn failure of the individual fibres occursthroughout its length, rather than localising at a specific yarn failure site. Hence the DIC system may be interpretingthe multiple fibre failure as an increase in the length of the yarn, as the strain in the fibre is not directly measureddue to the scale of the DIC pattern. Nevertheless, it is also possible that the fibres at the back face were sheared orpulled to fracture by the projectile, which would mean that the discussed interpolated values are incorrect. A detailedfractographic work is required to identify the actual mode of failure of the fibres located at the rear face of the testedpanels.

It appears that both steel and copper FSPs apply similar strains to the panels. By comparing the strains experiencedby the panels with their deformation (see Figure 19), it was observed that regardless of the extent of panel deformation,the maximum experienced throughout the panels strains were similar (this statement excludes the data obtained fromthe interpolation i.e. the presumed very high, localized strain values at the impact point). This implies that largematerial lateral deformations do not necessarily mean higher yarn straining (which is believed to be one of the mainenergy dissipating mechanisms) i.e. the large material lateral deformations do not necessarily mean better ballisticperformance. The analysis of strain-time history in the panels rear surface showed that the primary yarns experiencedthe highest strains throughout all their length immediately after the flash generated at the front face vanished (the flashwas also visible at the back face although the panels were not transparent), which was recorded to take place within25 µs and 12 µs after the flash, for DyneemaR© HB26 and SpectraR© 3124 respectively (different camera frame rate wasused). In the subsequent time frames the strain quickly dropped to zero (within approx. 50 µs) in the regions remoteto the impact point. It appears that the rate of decrease of the strain values in the impact region in DyneemaR© wasstriking velocity dependent. The amount of strain in the panels impacted at low velocities (the first column of Figure23) seemed to gradually decrease as the panel continued to deform laterally. The rate of decrease of the strain valueswas much higher in DyneemaR© panels impacted at higher velocities. In terms of SpectraR© 3124, it was observed thatthe entire length of the primary yarns unloaded very quickly and although the material continued to experience largelateral deformations the yarns were not strained (nearly no strain at the tip of the impact cone for shots that resultedin panel splitting). It is believed that this observation points out again at the shear properties of the material. Possibly,although the yarns experienced the maximum strains at the initial stages of the penetration, the matrix system andthe fibre/matrix interface did not facilitate transferring the load further. The material quickly delaminated and hencethere was nothing constraining the two parts of the panel which could guarantee load transfer to further areas of thematerial.

The described difference in the materials behaviour is also visible in the post-mortem panels. Figure 24 and Figure25 show damaged DyneemaR© HB26 and SpectraR© 3124 panels. It was observed that DyneemaR© panels delaminatedin a more catastrophic manner (the fibres were torn away from the plies), while SpectraR© panel had relatively ”clean”

16

surfaces (almost no tearing or debonding of fibres).

Figure 24: Full Dyneema R© HB26 panel impacted at 609 m/s with a steelFSP.

Figure 25: Full Spectra 3124 panel impacted at 640 m/s with a steel FSP(the two split parts being held together by the author).

4.6. The in-plane shear behaviour

The observations and conclusions given in the previous section were also confirmed by the measurement ofshear deformation at the back face of the panels. Figure 26 shows an example digital mesh obtained from the 3D DICmeasurements with the diagonal section used for extraction of data on shear deformation. The figure shows also themid-plane section that was used for plotting data in Figure 19 and Figure 23. Figure 27 shows in-plane shear timehistories for the DyneemaR© and the SpectraR© panels. The in-plane shear is denoted as Epsilon XY on the Y-axis, whilethe time steps are give next to the curves.

Figure 26: Digital mesh of deformed Spectra R© 3124 impacted at 640 m/s by a copper FSP (in-plane shear plotted).

The data plotted in the Figure 27 indicates that there were substantial shear deformation taking place during theimpact events. As expected, very little or no shear deformation was present at the impact point (“0” value on theX-axis), where the primary yarns were expected to dissipate the projectile kinetic energy by straining. The largestextent of shear deformations in DyneemaR© HB26 panels, during the period when the panel had not been penetratedyet, took place when the striking velocity was below or at the BL of the material (charts a), d) and e) in Figure 27).At these velocities the in-plane shear deformation quite often reached the boundaries of the panels, while the peakvalue of the in-plane shear deformation during the impact event reached up to 20-25%. This supports the descriptionof the DyneemaR© deformation that was presented in the previous section. It was observed also that there was aresidual in-plane shear deformation in the panels that were not penetrated, which levelled out itself, as the panelwas ”relaxing” after the impact, to a value of 5-10% (see charts a) and d) in Figure 27). The peak in-plane shear

17

Figure 27: In-plane shear strain histories of the diagonal section of the experimental panels from the 3D DIC measurements, for three differentvelocity ranges (below the BLs: a),d),g,j; at the BL or just above: b),e),h),k); substancially above the BLs: c),f),i),l) ). Row 1: Dyneema R© HB26impacted with steel FSP; Row 2: Dyneema R© HB26 impacted with copper FSP; Row 3: Spectra R© 3124 impacted with steel FSP; Row 4: Spectra R©

3124 impacted with copper FSP.

value seemed to decrease with increase of the striking velocity. In the experiments where DyneemaR© was impacted atapprox. 1 km/s the peak value was 10-15%, before the projectile penetrated the panel (see charts c) and f) in Figure27). SpectraR© 3124 experienced far higher in-plane shear deformations than DyneemaR© HB26. The peak in-planeshear values for SpectraR© panels impacted at 500-600 m/s ranged from 30 to 35%. The peak in-plane shear values,before the penetration, for the two shots fired at 868 m/s and 1027 m/s were 18% and 23%, respectively; which isabout a double of the DyneemaR© values for similar shots. At these velocities DyneemaR© panels failed within 48 µswhile SpectraR© panels within 72 µs. It was observed that at these high velocities the shear deformation of DyneemaR©,before penetration, was enclosed within approx. 65 mm radius from the impact point, while the extent of sheardeformation of SpectraR© reached about 100 mm radius. Also, it appears that steel projectiles left a different in-planeshear deformation ”signature” than the copper projectiles. Charts a), d), g), and j) in Figure 27 show that the shearstrain time history over the measured section had a dome shape for steel projectiles, while being more triangular forpanels impacted with copper projectiles. This is probably related to the fact that the copper FSPs were more prone toplastically deform, due to their low yield strength and the adiabatic heating previously described, compared to steelprojectiles.

18

5. Conclusion

The presented study compared the ballistic behaviour of DyneemaR© HB26 and SpectraR© 3124 subjected to impactof 20 mm diameter copper and steel Fragment Simulating Projectiles, fired in the 400 - 1000 m/s striking velocityrange. The highly instrumented, state-of-the-art experimental setup allowed to extract vast amounts of data on thematerials behaviour during the projectile penetration, required for validation of advanced numerical models.

The results showed that DyneemaR© HB26 had slightly higher ballistic limits than the latter, nevertheless, theresponse of the panels was most likely affected by the edge effects, as a relatively small, with respect to the appliedloads, panel size was used. It is possible that the larger panels would show different ballistic limits of the materials.Also, for precise determination of the ballistic limit, more panels should be tested.

It was observed that at very high striking velocities (850 m/s and above) both materials had very similar ballisticperformance. The steel projectiles deformed very little during the impact and this only took place at firings at 1 km/sor above. The deformation of the copper FSPs increased with increasing striking velocity. The observed deformation,however, was a result of the impact on both the tested panel and the catcher box used in the study. The influence ofthe latter could be minimized, if an alternative to sand was found/used e.g. gelatine, however the cost of such solutionwould probably be much higher. In general, the panels lost very little of their initial mass due to impact (less than1%). It was observed that the panels impacted with copper FSPs lost more weight than panels impacted with steelFSPs.

The front 3D DIC measurements allowed identifying how the front face of the panels deformed in-plane and out-of-plane in time. It was observed that the in-plane movement of the material occurred first, before the out-of-planemovement. Although the projectile material did not influence the in-plane response of the panels, the out-of-planeresponse was affected. The measurements showed also that the front face of the Spectra panels experienced less than1% tensile straining during the projectile penetration.

A post-mortem observation of the test panels showed that the deformation characteristics of each panel changedin the through thickness direction. It was observed that at a certain distance away from the front face a large delami-nation(s), which reached to the edges of the panel, occurred, after which the remaining part of the panel was drawn in.By plotting the location of this delamination (denoted as the First Major Delamination) against the striking velocity,it was identified that the through thickness location of the FMD was striking velocity dependent. It occurred furtheraway from the impact face as the striking velocity rose.

The 3D DIC measurements of the rear part of the panel, which acted as a membrane during penetration, allowedanalysis of the back face deformation characteristics of the two tested materials. It was observed that the responseof the materials changed (became more local) with increase of the striking velocity. The measurements showedthat the primary and the secondary yarns at the back surface experienced not more than 2% strain, independentlyof the striking velocity, at the areas which were not a direct point of exit of the projectile. The interpolated dataat the point of the projectile exit (which was not possible to measure during the experiments) indicated that thestrains in this region might have been as high as 6%. Nevertheless, the accuracy of this interpolation remains to beinvestigated. The in-plane shear behaviour was found to be very different for the two tested materials. SpectraR© panelsexperienced about twice higher shear deformations than comparable DyneemaR© panels. It was observed that there wasa residual shear deformation in DyneemaR© panels impacted at low velocities, at the level of 5-10% of shear strain. Themeasurements showed also that the panels impacted with steel projectiles had different in-plane shear deformationthan panels impacted with copper projectiles.

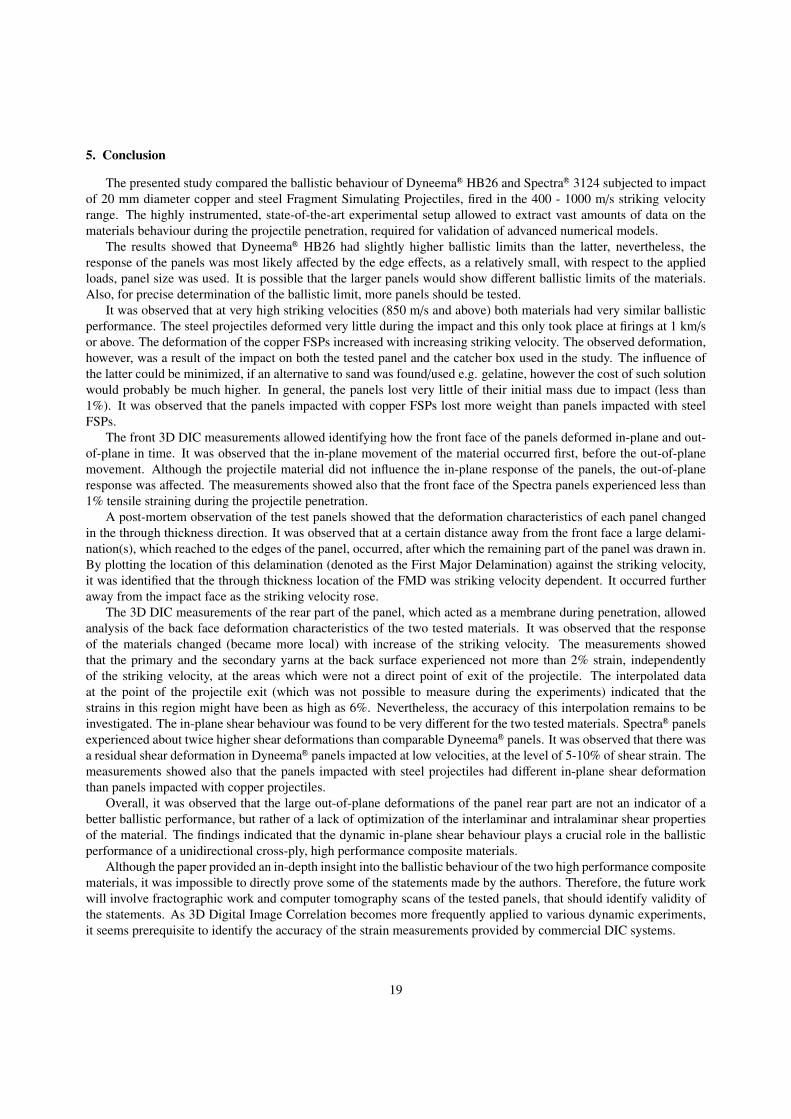
Overall, it was observed that the large out-of-plane deformations of the panel rear part are not an indicator of abetter ballistic performance, but rather of a lack of optimization of the interlaminar and intralaminar shear propertiesof the material. The findings indicated that the dynamic in-plane shear behaviour plays a crucial role in the ballisticperformance of a unidirectional cross-ply, high performance composite materials.

Although the paper provided an in-depth insight into the ballistic behaviour of the two high performance compositematerials, it was impossible to directly prove some of the statements made by the authors. Therefore, the future workwill involve fractographic work and computer tomography scans of the tested panels, that should identify validity ofthe statements. As 3D Digital Image Correlation becomes more frequently applied to various dynamic experiments,it seems prerequisite to identify the accuracy of the strain measurements provided by commercial DIC systems.

19

Acknowledgement

The authors would like to acknowledge funding from the EPSRC and the Dstl grant EP/G042861/1. The researchwould not be possible without support from Vision Research UK represented by Mr Jolyon Cleaves. The supportof DSM, that provided DyneemaR© HB26 for the study, is greatly appreciated. Special thanks to Dr Ian Softley fromDSTL, and to Dr Adam Connolly, Dr Stefano Del Rosso, Mr Joseph Meggyesi, Dr Lucio Raimondo, and MichelleWillows from Imperial College London for help during the trials.

Dyneema is a trademark of DSM. Use of this trademark is prohibited unless strictly authorized.

References

[1] Cheeseman, B. A., Ballistic impact into fabric and compliant composite laminates. Composite structures,2003,Vol. 61, p. 161-173.[2] Iremonger, M. J., Went, A.C, Ballistic impact of fibre composite armours by fragment-simulating projectiles. composites Part A, Vol.26A,

p.575-581.[3] Prosser, R. A., Penetration of nylon Ballistic Panels by Fragment-Simulating Projectiles. Part I: A linear approximation of the relationship

between the square of the V50 or Vc striking velocity and the number of layers of cloth in the ballistic panel. Textile Research Journal,1988,Vol.58(3), p.161-165.

[4] Prosser, R. A., Penetration of nylon Ballistic Panels by Fragment-Simulating Projectiles. Part II: Mechanism of penetration. Textile ResearchJournal,1988, Vol.58(3), p.61-68.

[5] Figucia, F., Williams, C., Kirkwood, B., Koza, W., Mechanisms of Improved Ballistic Fabric Performance. 1982. Technical Report, U.S.Army Natick Research & Development Center

[6] Scott, B.R., The penetration of compliant laminates by compact projectiles. In: Proceedings of the 18th International Symposium on Ballistics.San Antonio, Texas, 15-19 November 1999. p. 1184-91.

[7] Lee, B. L., Walsh, T. F., Won, S. T., Patts, H. M., Song, J. W., Mayer, A. H.,Penetration Failure Mechanisms of Armor-Grade Fiber Compositesunder Impact. Journal of Composite Materials, Vol. 35, No. 18/2001.

[8] Flanagan, M. P., Zikary, M. A., Wall, J.W., El-Shiekh, A., An experimental investigation of high velocity impact and penetration failure modesin textile composites. Journal of Composite Materials, Vol. 33, No. 12/1999.

[9] Cunniff P. M., Dimensionless parameters for optimization of textile-based body armor systems. In: Proceedings of the 18th InternationalSymposium on Ballistics, San Antonio, Texas, 1519 November 1999. p. 130310.

[10] STANAG 2920 Edition 2 Ballistic Test Method for personal armour materials and combat clothing; July 2003.[11] Greenhalgh, E. S., Bloodworth, V. M., Iannucci, L., Pope, D., Fractographic observations on Dyneema composites under ballistic impact.

Composites: Part A. 2012.[12] Hazell, P. J., Appleby-Thomas, G. J., Trinquant, X.,Chapman D. J. In-fiber shock propagation in Dyneema. Journal of Applied Physics, 2011,

Vol. 110.[13] DSM product data sheet: Dyneema SK76 dtex1760 TZ25. 2006[14] Qi, H.J., and Boyce, M.C. Stress - strain behavior of thermoplastic polyurethanes. Mechanics of Materials, 2005, Vol. 37, p.817-839.

20


Recommended