FINAL CONTRACT REPORT INVESTIGATION OF TRANSFER LENGTH, DEVELOPMENT LENGTH, FLEXURAL STRENGTH, AND PRESTRESS LOSSES IN LIGHTWEIGHT PRESTRESSED CONCRETE GIRDERS THOMAS E. COUSINS, Ph.D. Associate Professor ADIL NASSAR Research Assistant Department of Civil and Environmental Engineering Virginia Polytechnic Institute and State University V·I·R·G·I·N· I·A TRANSPORTATION RESEARCH COUNCIL VIRGINIA TRANSPORTATION RESEARCH COUNCIL
Transcript
FINALCONTRACT REPORT
INVESTIGATION OF TRANSFER LENGTH,DEVELOPMENT LENGTH, FLEXURAL STRENGTH,
AND PRESTRESS LOSSES IN LIGHTWEIGHTPRESTRESSED CONCRETE GIRDERS
THOMAS E. COUSINS, Ph.D.Associate Professor
ADIL NASSARResearch Assistant
Department of Civil and Environmental EngineeringVirginia Polytechnic Institute and State University
V·I·R·G·I·N· I·A
TRANSPORTATION RESEARCH COUNCIL
VIRGINIA TRANSPORTATION RESEARCH COUNCIL
1. Report No.FHWA/VTRC 03-CR20
Standard Title Pa2e - Report on Federally Funded Project2. Government Accession No. 3. Recipient's Catalog No.
4. Title and SubtitleInvestigation of Transfer Length, Development Length, Flexural Strength,and Prestress Losses in Lightweight Prestressed Concrete Girders
7. Author(s)Thomas E. Cousins and Adil Nassar
9. Performing Organization and Address
Virginia Transportation Research Council530 Edgemont RoadCharlottesville, VA 22903
12. Sponsoring Agencies' Name and Address
5. Report DateApril 2003
6. Performing Organization Code
8. Performing Organization Report No.VTRC 03-CR20
10. Work Unit No. (TRAIS)
11. Contract or Grant No.56804
13. Type of Report and Period CoveredFinal
Virginia Department of Transportation1401 E. Broad StreetRichmond, VA 2321915. Supplementary Notes
16. Abstract
FHWAP.O. Box 10249Richmond, VA 23240
14. Sponsoring Agency Code
Encouraged by the performance of high performance normal weight composite girders, the Virginia Department ofTransportation has sought to exploit the use of high performance lightweight composite concrete (HPLWC) girders to achieveeconomies brought about by the reduction of dead loads in bridges. Transfer length measurements (conducted on two AASHTO TypeIV HPLWC prestressed girders) indicated an average transfer length of 17 inches, well below the AASHTO and ACI requirements.
Two HPLWC AASHTO Type II girders and a 48 x 8 inch normal weight 4000-psi concrete deck were fabricated. The girderswere cast of concretes with a compressive strength of 6380 psi and a unit weight of 114 pcf. Full scale testing of the girders wasconducted to evaluate development length and flexural strength in HPLWC composite girders. Embedment lengths of five, six, andeight feet were evaluated. Tests indicated a development length of about 72 inches, marginally below the ACI and AASHTOrequirements. All tested girders exceeded their theoretical flexural capacity by 24% to 30%.
A third composite Type II girder was cast of high performance normal weight concrete and topped with a 48 x 8 inch normalweight 4000-psi concrete deck. This girder was intended as a control specimen.
Prestress losses in the HPLWC AASHTO Type IV girders monitored over a nine-month period were found to be less thanthose calculated using the ACI and PCI models.
17 KeyWordshigh-performance concrete, lightweight concrete, lowpermeability concrete, prestressed concrete bridge girders,structural testing, transfer length, development length, flexuralstrength
18. Distribution StatementNo restrictions. This document is available to the public throughNTIS, Springfield, VA 22161.
19. Security Classif. (of this report)Unclassified
20. Security Classif. (of this page)Unclassified
21. No. of Pages44
22. Price
Form DOT F 1700.7 (8-72) Reproduction of completed page authorized
FINAL CONTRACT REPORT
INVESTIGATION OF TRANSFER LENGTH, DEVELOPMENT LENGTH, FLEXURALSTRENGTH, AND PRESTRESS LOSSES IN LIGHTWEIGHT PRESTRESSED
CONCRETE GIRDERS
Thomas E. Cousins, Ph.D.Associate Professor
Adil NassarResearch Assistant
Department of Civil and Environmental EngineeringVirginia Polytechnic Institute & State University
Project ManagerJose P. Gomez, Ph.D., P.E., Virginia Transportation Research Council
Contract Research Sponsored by theVirginia Transportation Research Council
Virginia Transportation Research Council(A Cooperative Organization Sponsored Jointly by
the Virginia Department of Transportationand the University of Virginia)
Charlottesville, Virginia
April 2003VTRC 03-CR20
NOTICE
The project that is the subject of this report was done under contract for the VirginiaDepartment of Transportation, Virginia Transportation Research Council. The contentsof this report reflect the views of the authors, who are responsible for the facts and theaccuracy of the data presented herein. The contents do not necessarily reflect theofficial views or policies of the Virginia Department of Transportation, theCommonwealth Transportation Board, or the Federal Highway Administration. Thisreport does not constitute a standard, specification, or regulation.
Each contract report is peer reviewed and accepted for publication by Research Councilstaffwith expertise in related technical areas. Final editing and proofreading of thereport are performed by the contractor.
Copyright 2003 by the Commonwealth of Virginia.
11
ABSTRACT
Encouraged by the performance of high performance normal weight composite girders,the Virginia Department of Transportation has sought to exploit the use of high performancelightweight composite concrete (HPLWC) girders to achieve economies brought about by thereduction of dead loads in bridges. Transfer length measurements (conducted on two AASHTOType IV HPLWC prestressed girders) indicated an average transfer length of 17 inches, wellbelow the AASHTO and ACI requirements.
Two HPLWC AASHTO Type II girders and a 48 x 8 inch normal weight 4000-psiconcrete deck were fabricated. The girders were cast of concretes with a compressive strength of6380 psi and a unit weight of 114 pcf. Full-scale testing of the girders was conducted to evaluatedevelopment length and flexural strength in HPLWC composite girders. Embedment lengths offive, six, and eight feet were evaluated. Tests indicated a development length of about 72 inches,marginally below the ACI and AASHTO requirements. All tested girders exceeded theirtheoretical flexural capacity by 24% to 30%.
A third composite Type II girder was cast of high performance normal weight concreteand topped with a 48 x 8 inch normal weight 4000-psi concrete deck. This girder was intendedas a control specimen.
Prestress losses in HPLWC AASHTO Type IV girders monitored over a nine-monthperiod were found to be less than those calculated using the ACI and PCI models.
111
FINAL CONTRACT REPORT
INVESTIGATION OF TRANSFER LENGTH, DEVELOPMENT LENGTH, FLEXURALSTRENGTH, AND PRESTRESS LOSSES IN LIGHTWEIGHT PRESTRESSED
CONCRETE GIRDERS
Thomas E. Cousins, Ph.D.Associate Professor
Adil NassarResearch Assistant
Department of Civil and Environmental EngineeringVirginia Polytechnic Institute & State University
INTRODUCTION
Recent years have seen the successful use of high perfonnance concretes (HPCs) inbridge design and construction. 1
,2 These bridges were built with nonnal weight HPCs (HPNWC)of a density of about 145 pcf. HPCs are characteristically higher in strength and more durablethan their regular counterparts due to their lower water to cement ratio and denser cement matrixas a result of the mineral admixtures used in their makeup. These attributes contribute directly todesired structural and economic efficiencies in the design and construction of highway bridges.
Encouraged by the successful implementation ofHPC technology in demonstrationbridges built by the Virginia Department of Transportation (VDOT), the Virginia TransportationResearch Council (VTRC) is seeking to exploit HPC technology further by using lighter weightconcretes.
PURPOSE AND SCOPE
An experimental program was planned and executed with the general objectives ofdemonstrating the capability of producing prestressed American Association of State Highwayand Transportation Officials (AASHTO) type girders made of high perfonnance lightweightconcrete (HPLWC) with a density of about 120 pcf and a 28-day compressive strength of 8000psi and further studying their behavior. This program was a necessary prelude to a plannedHPLWC demonstration bridge to be built over the Chickahominy River on Route 106 in CharlesCity County, Virginia.
The experimental program included the proportioning and testing of lightweight andnonnal weight concrete mixes and was chiefly concerned with investigating the effects of usinglightweight concretes in prestressed girders on transfer length, development length, and flexuralstrength. An additional objective was to monitor prestress losses in HPLWC girders and
compare those losses to estimates that were calculated from various models available in theliterature.
To accomplish the objectives, five precast, prestressed AASHTO type bridge girders(three AASHTO Type II girders and two AASHTO Type IV girders) were cast and tested.Transfer lengths were measured on all girders, and the AASHTO Type II girders were tested tofailure with a composite deck section added. The AASHTO Type VI girders were monitored for9 months to determine prestress loss.
METHODS
Overview
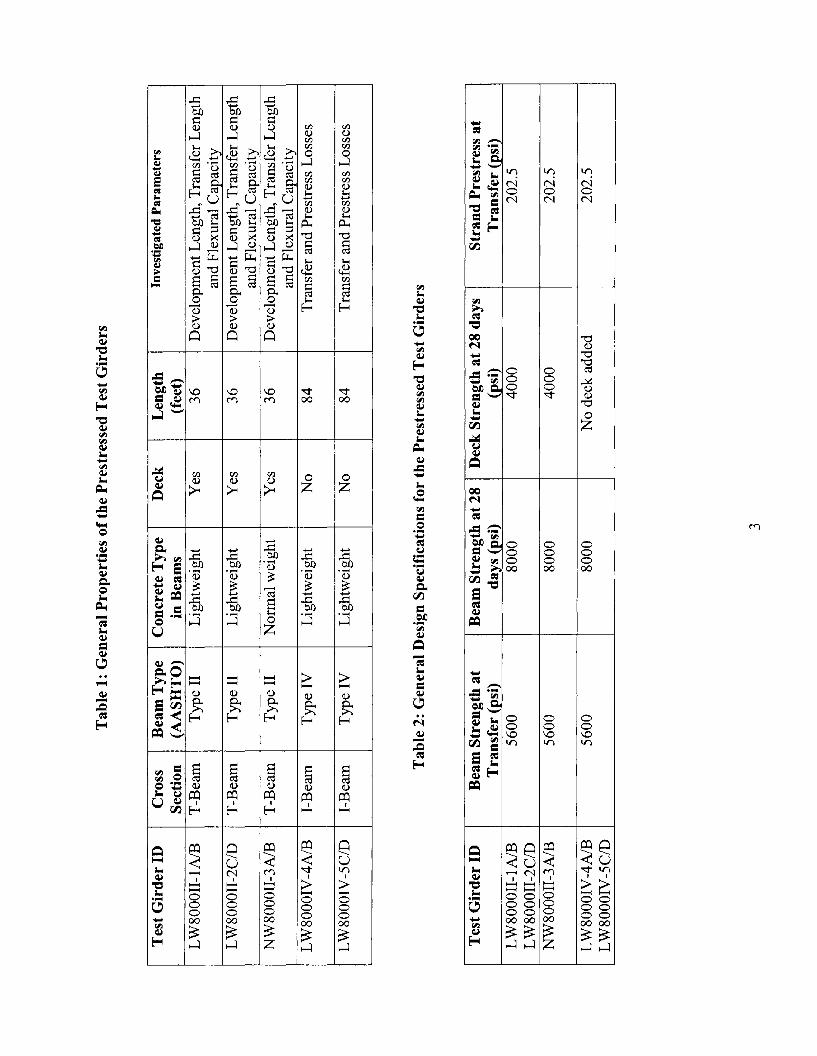
Three prestressed test girders were produced to evaluate transfer length, developmentlength, and flexural capacity of composite HPLWC beams. Two prestressed Type II AASHTOgirders were cast of HPLWC, and the third one was made of HPNWC to serve as a control andcomparison test girder. The composite decks were made of normal weight 4000-psi concrete.Two additional AASHTO Type IV girders were produced to investigate transfer length andprestress losses in HPLWC beams. The nomenclature shown in Figure 1 is used throughout thisreport to delineate the different test specimens used in the research investigation. Table 1 detailsthe general properties of the test specimens and the corresponding test parameters investigated,and Table 2 contains the design specifications for each beam.
Design Concrete Strengthat 28 days (psi)
AASHTOTypeGirder (II or IV)
Beam End
Beam Number
~ •LW 8000 11-1 AJ ~~ t_Concrete Type of
AASHTO beamsLW - LightweightNW - Normal Weight
Figure 1: Test Beam Nomenclature
2
Tab
le1:
Gen
eral
Pro
pert
ies
ofth
eP
rest
ress
edT
estG
irde
rs
Tes
t Gir
der
IDC
ross
Bea
mT
ype
Con
cret
eT
ype
Dec
kL
engt
hIn
vest
igat
edP
aram
eter
s
Sec
tion
(AA
SH
TO
)in
Bea
ms
(fee
t)L
W80
00II
-IA
IBT
-Bea
mT
ype
IIL
ight
wei
ght
Yes
36D
evel
opm
ent
Len
gth,
Tra
nsfe
rL
engt
han
dF
lexu
ral
Cap
acit
yL
W80
00II
-2C
/DT
-Bea
mT
ype
IIL
ight
wei
ght
Yes
36D
evel
opm
ent
Len
gth,
Tra
nsfe
rL
engt
han
dF
lexu
ral
Cap
acit
yN
W80
00II
-3A
IBT
-Bea
mT
ype
IIN
orm
alw
eigh
tY
es36
Dev
elop
men
tL
engt
h,T
rans
fer
Len
gth
and
Fle
xura
lC
apac
ity
LW
8000
IV-4
A1B
I-B
eam
Typ
eIV
Lig
htw
eigh
tN
o84
Tra
nsfe
ran
dP
rest
ress
Los
ses
LW
8000
IV-5
C/D
I-B
eam
Typ
eIV
Lig
htw
eigh
tN
o84
Tra
nsfe
ran
dP
rest
ress
Los
ses
Tab
le2:
Gen
eral
Des
ign
Spe
cifi
cati
ons
for
the
Pre
stre
ssed
Tes
tGir
ders
Tes
tGir
der
IDB
eam
Str
engt
hat
Bea
mS
tren
gth
at28
Dec
kS
tren
gth
at28
days
Str
and
Pre
stre
ssat
Tra
nsf
er(p
si)
days
(psi
)(p
si)
Tra
nsfe
r(p
si)
LW
8000
II-I
AIB
5600
8000
4000
202.
5L
W80
00II
-2C
/DN
W80
00II
-3A
IB56
0080
0040
0020
2.5
LW
8000
IV-4
A1B
5600
8000
No
deck
adde
d20
2.5
LW
8000
IV-5
C/D
3
General Definitions and Testing Scheme
The end region of a member over which the effective prestressing stresses, fse, are
transmitted from the strands to the concrete is referred to as the transfer length, Lt. A generallyaccepted model of the variation of prestress forces in a concentrically prestressed member isshown in Figure 2.3
-5
Strand stress
Member axis
Figure 2: Variation of Stresses in a Prestressed Member
The transfer lengths in this study were established by measuring concrete surface strainsin the end regions of five test specimens designed and built for the purpose of this experimentalresearch. Two of these specimens were T-girders made ofHPLWC Type II AASHTO girdersand a normal weight composite concrete deck. A third specimen similar in every way to theaforementioned two was made with HPNWC. This specimen was intended to serve as a controland comparison specimen. The other two specimens were Type IV AASHTO girders made ofHPLWC.
The transfer length in members prestressed with strands is to be taken as 50 stranddiameters per the American Concrete Institute (ACI) building code provisions 6 and theAASHTO standard specifications for highway bridges.7 This provision is stipulated in sectionsof the code addressing shear design of prestressed members. The ACI commentary RI2.9, inChapter 12, which covers "Development and Splices of Reinforcement," gives the equation fortransfer length as (fse/3) db, where fse is the effective prestress and db is the strand diameter. Anaverage effective prestress of 150 ksi lends the approximation of 50 strand diameters. TheAASHTO Load and Resistance Factor Design (LRFD)8 acknowledges and allows for a highereffective prestress as is normally applied in current practice by increasing the transfer length to60 strand diameters.
ACI defines development length as the "length of embedded reinforcement required todevelop the desired strength of reinforcement at a critical section.,,6 In prestressed concretemembers, development length is composed of two bond regions. The first bond region is the onecharacterized previously as the transfer length, and the second bond region is termed the flexuralbond length. This flexural bond region is the additional length required beyond the transferlength for the strands to develop their ultimate flexural stress, fps. Figure 36 illustrates aqualitative variation of strand stress along the development length.
4
Strand stressDevelopment Length
Flexural BondLength
Figure 3: Variation of Steel Stress with Distance from Free End of Strand6
The three AASHTO Type II T-girders were loaded to failure at various embedmentlengths, Le, to establish the development length, Ld' and the flexural strength of the specimens.In theory, the development length is established when a test specimen has attained its ultimateflexural strength at the shortest tested embedment length. Figure 4 demonstrates the testingscheme adopted to arrive at the development length.
Figure 4: Development Length and Flexural Strength Testing Scheme
Section 12.9, "Development of Prestressing Strand," in the ACI code6 and Section 9.28,"Embedment ofPrestressed Strand," of the AASHTO standard code7 stipulate a developmentlength for girders prestressed with three- or seven-wire strands to be not less than
Eq.1
where db is the nominal strand diameter in inches, and fps and fse are the ultimate and effectivestrand stresses, respectively, in kips per square inch. The resulting data from the transfer length,development length, and flexural strength tests were compared to the relevant design provisions
5
available in the ACI and AASHTO codes to verify their validity for HPLWC prestressedmembers.
Moreover, in order to monitor prestress losses in HPLWC members, the two Type IVspecimens were fitted with internal vibrating wire gages that recorded concrete strains to a digitalread-out over a period of about nine months. Data from these gages were compared totheoretically calculated strains that incorporated the long-term effects of creep, shrinkage, andsteel relaxation.
Composite Type II Prestressed HPLWC and HPNWC Test Girders
Figure 5 shows the cross section of the composite specimens used in this investigation.An AASHTO Type II girder and a 48 x 8 inch normal weight concrete slab comprised the crosssection of the test girders. Each girder was prestressed with eight Y2-inch-diameter Grade 270low-relaxation strands. Six strands were straight throughout the girder, and two were harped at14 feet from each beam end.
1-1/2~----.
Top #5 @ 8" c/cBottom #5 @ 16" c/c
# 4 stirrup
6 ea#4top/bottom
Harped StrandsAt Beam-Ends
30 T18
1~21~
Typical Type IIAASHTO Girder
~" dia. Strands atMid-Span Section
# 5 confinementrebar
Figure 5: Prestressed Composite Test Girders Cross-Section (all dimensionsin inches)
An allowable tensile stress of 100 psi at transfer of prestress was used for the beamdesign to ensure the absence of tensile cracks upon transfer, since lighter weight concretes often
6
have proportionally lower tensile strength. The deck reinforcement is typical of that usedthroughout Virginia. The web reinforcement was detailed to guarantee composite action andsufficient shear capacity to prevent shear failure.
Mill certificates from Florida Wire and Cable, Inc., indicate that Grade 270 lowrelaxation strands per ASTM A-416-93, with a 28,600-ksi modulus of elasticity, were used in thegirders. All other reinforcement was Grade 60 reinforcing steel.
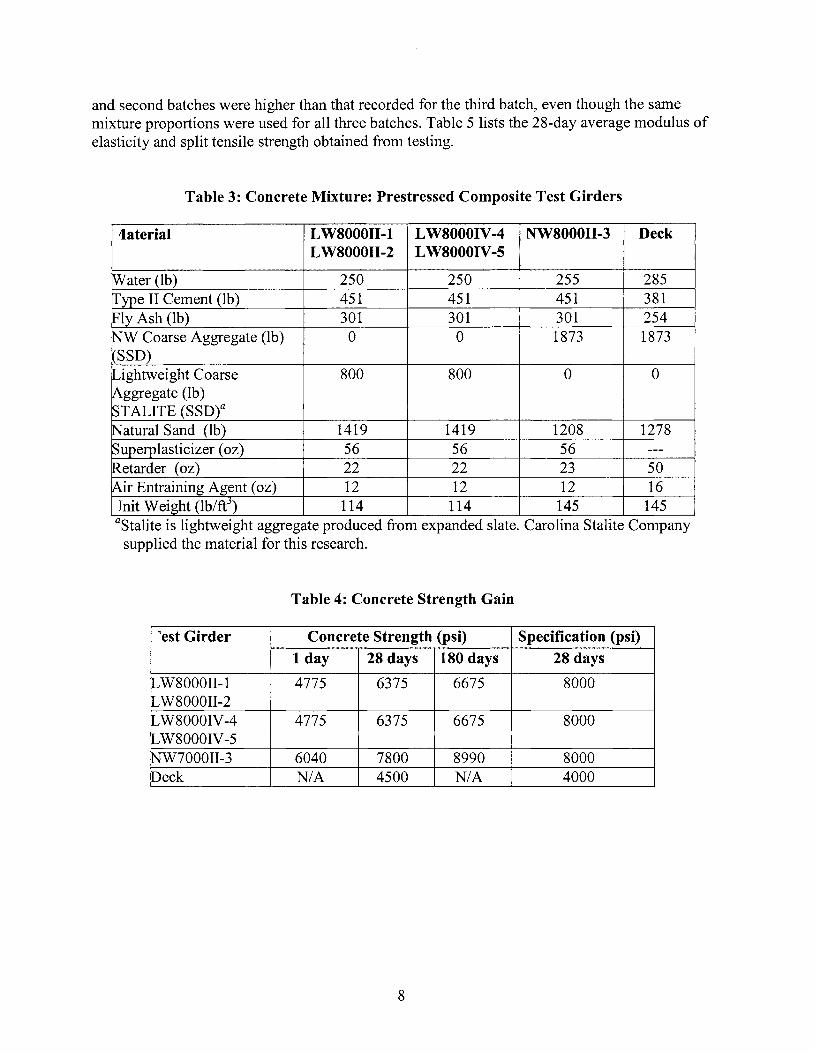
All decks were cast of normal weight concrete, with a design 28-day compressivestrength of 4000 psi. Table 3 presents the mixture proportions.
Three batches of HPLWC were used to produce the Type II and Type IV girders. Resultsfor the Type IV non-composite girders are discussed here since these girders were cast at thesame time as the Type II composite test girders. The Type II girders were cast out of the firstbatch and the Type IV girders were cast out of the second and third batches. Even though theconcrete mixture proportions in the three batches was the same, the 28-day compressive strengthrecorded for the first, second, and third batches was, 6660 psi, 6320 psi, and 6140 psi,respectively.
In all succeeding calculations and representations of strength in this report, an average28-day compressive strength of6375 psi is used for both the Type II and Type IV HPLWCprestressed girders.
The mixture proportions for the Type II and Type IV HPLWC girders were used toachieve a compressive strength of at least 8000 psi at 28 days with a unit weight of about 120Ib/ft3
. The concrete mixture, however, did not develop the desired 28-day strength. In fact, thehighest average strength recorded at the time of testing (180 days of age) was 6680 psi and theactual average unit weight of the mixture was 114Ib/ft3. At transfer, the compressive strengthwas 4780 psi, 15% lower than the specified strength of 5600 psi. Tables 3 and 4 present theHPLWC mixture proportions and the strength gain over time, respectively. It is suspected thatthe undesired high water-cementitious materials ratio in the mixture resulted in its lowerstrength. However, a subsequent mixture developed for use in the actual lightweight prestressedconcrete girders for the Chickahominy River crossing incorporated the desired watercementitious materials ratio and normal weight fine and coarse aggregates to increase its densityto 120 Ib/ft3
• Moreover, the lightweight aggregates used in the mixture were limited to a'l2-inchmaximum diameter size instead of the %-inch aggregate used in the first mixture.
A single composite Type II test girder was made with HPNWC. The mixture for theHPNWC was also designed to develop a 28-day compressive strength of 8000 psi. Included inTables 3 and 4 are the mixture proportions and strength gain for the concrete. As observed, themixture attained a 28-day compressive strength of 7800 psi, less than the design strength.
The modulus of elasticity and the split tensile strength of the concrete were tested at 28days of age. The values recorded for the three batches of the lightweight concrete used to cast theType II and Type IV lightweight girders mirrored the trend seen in the recorded values of theconcrete mix strength. The modulus of elasticity and split tensile strength recorded for the first
7
and second batches were higher than that recorded for the third batch, even though the samemixture proportions were used for all three batches. Table 5 lists the 28-day average modulus ofelasticity and split tensile strength obtained from testing.
Table 3: Concrete Mixture: Prestressed Composite Test Girders
As shown in Table 5, the modulus of elasticity for the lightweight concrete was about12% lower than the theoretical value calculated per section 8.5.1 of the ACI code.6 The averagesplit tensile strength was about 6.7-V fe' for the lightweight concrete and 9.6-V fe' for the normalweight concrete. Naaman9 lists observed ranges for split tensile strength of lightweight andnormal weight concretes as 4-5-V fe' and 6-7-V fe', respectively, both ofwhich are considerablylower than was found in this research investigation.
Beams LW8000II-1 and LW8000II-2 were cast with the lightweight concrete mixture,and beam NW8000II-3 was cast with the normal weight concrete mixture. One day afterconcrete placement and steam curing, the side forms were stripped. Detensioning of the strandsthen proceeded immediately through torching each of the eight strands.
The concrete mixture used for producing the HPLWC beams failed to reach the designstrength of 5600 psi required before detensioning of the strands could occur. The strengthattained was 4780 psi, approximately 15% lower than the design strength. A decision was madeto detension the strands despite the lower concrete strength recorded. The transfer operation wassuccessfully completed, and no visible splitting cracks were observed at the transfer zone(s).
The normal weight concrete decks topping each of the three girders were placed onemonth later, and shored construction was used. The shear reinforcement used in the AASHTOgirders extended upward into the slab, providing composite action of the girder and deck.
Non-Composite Type IV Prestressed HPLWC Test Girders
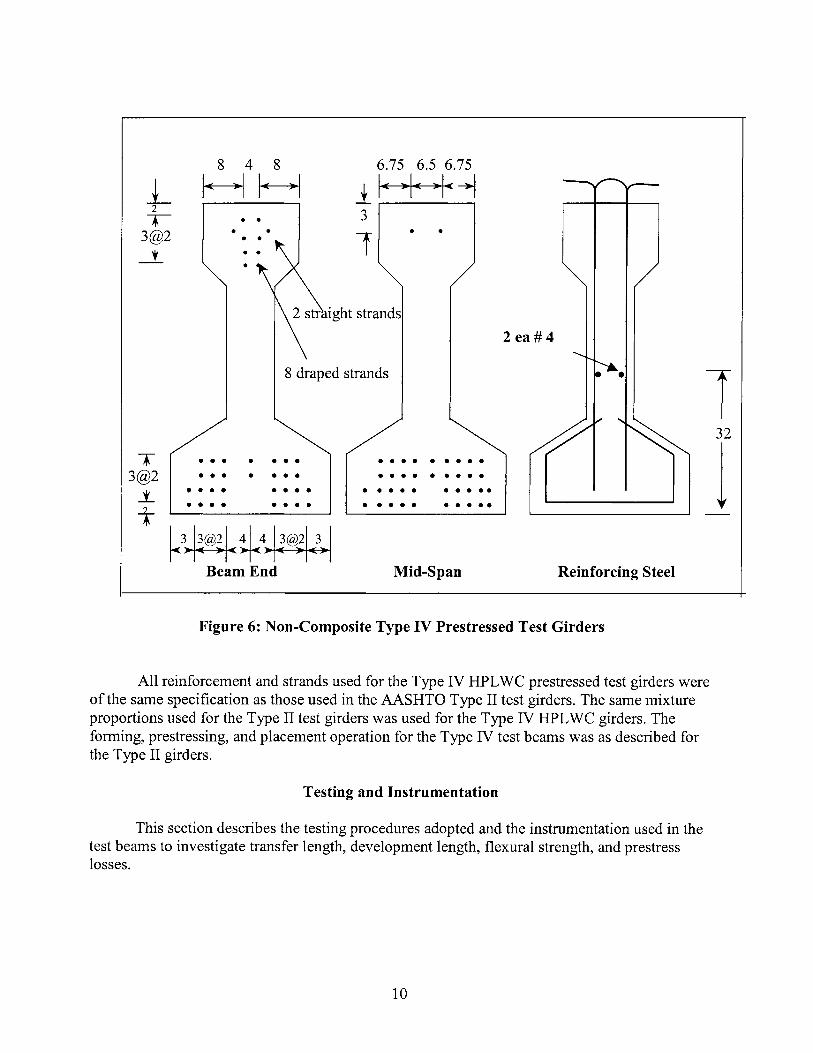
The main purpose of this research was to evaluate the behavior of HPLWC prestressed girdersprior to using the material in the Chickahominy River crossing. Two Type IV test girders ofsimilar design to the ones specified for the Chickahominy Bridge were used to investigatetransfer length and prestress losses in the girders. The design and detailing of the girders wereperformed by VDOT. Figure 6 shows the cross section of the test girders and the detailing of theprestressing strands and reinforcing steel.
9
8 draped strands
321
Reinforcing Steel
2 ea#4
Mid-Span
• • •• • ••••• • •• • ••••
• • • • • • ••••• • • • • • ••••
• • •• • •
• • • •• • • •
••
• • •• • •
• • • •• • • •
8 4 8 6.75 6.5 6.75
L HH 1~-12 3T • •
3@2 • •1
• •• •i • •
•
T3@2
i.T~3~~~
ReamEnd
Figure 6: Non-Composite Type IV Prestressed Test Girders
All reinforcement and strands used for the Type IV HPLWe prestressed test girders wereof the same specification as those used in the AASHTO Type II test girders. The same mixtureproportions used for the Type II test girders was used for the Type IV HPLwe girders. Theforming, prestressing, and placement operation for the Type IV test beams was as described forthe Type II girders.
Testing and Instrumentation
This section describes the testing procedures adopted and the instrumentation used in thetest beams to investigate transfer length, development length, flexural strength, and prestresslosses.
10
Transfer Length
The transfer length is the distance over which the prestressing force is fully transmittedfrom the strands to the concrete. Assuming that the prestress force varies linearly from zero atthe end of the beam to the effective prestress force at the end of the transfer length,3 a means ofmeasuring the transfer length is to measure the concrete surface strains along the transfer zone.
To that end, metallic strips fitted with threaded inserts spaced four inches apart wereattached to the side forms on both sides of each end of each girder prior to casting of theconcrete. After stripping of the side forms, the day after concrete placement, the metallic stripswere removed from the sides of each girder to result in flush embedment of the threaded insertsalong both sides of each end of the girders. The inserts spaced four inches apart, stretched adistance of six feet from the end of the beam. The first inserts were placed two inches from eachend of the test girder.
A Whittemore strain measurement device, with an eight-inch gauge length, was used tomeasure the distance between the embedded inserts immediately after the stripping of the sideforms. This records the zero or reference state of the concrete surface strain. A second set ofmeasurements was taken after detensioning to record the strain state on the concrete surface afterprestressing. The difference between the first and second Whittemore readings divided by the 8inch gauge length provides the strains induced in the concrete surface by the prestressing.Another set of measurements was also taken one week after detensioning. Figures 7 indicatesthe layout of the Whittemore inserts in the girders.
End of Girder
•••••• .:........ --J
• • • •• • •
8-ingaugelength
I~
12
f
Figure 7: Layout of Whittemore Inserts
11
Development Length and Flexural Strength
Full-scale flexural testing was conducted to evaluate the development length and flexuralcapacity of the composite test girders. Should the reinforcement embedded in the concrete beshorter than is required, a bond slip occurs before the flexural capacity of the beam is reached.
In order to arrive at the development length and flexural capacity of the beams, a pointload was applied to failure at varying embedment lengths. A 24-foot-Iong test span was chosento allow for two flexural tests per test beam.
By loading the beam to failure, assuming sufficient shear strength, a flexural failurewould indicate that the tested embedment length was longer than the development length.However, strand slippage and/or failure of the beam prior to development of its flexural capacitywould indicate that the tested embedment length is shorter than the development length. As such,the next test setup should examine a longer embedment length to arrive at the developmentlength. This iterative process was the methodology adopted to arrive at the development length.Four overall tests were carried out on the two Type II HPLWC composite beams to evaluate theirdevelopment length and flexural capacity.
Development length and flexural strength testing were conducted at Bayshore ConcreteProducts in Cape Charles, Virginia. Two concrete blocks two feet high were used as supports forthe test beams. Elastomeric pads were placed on top of each concrete block (24 feet apart, centerto-center). The tested end of the beam was lined up such that the centerline of the elastomericpad was six inches from the end of the beam. The pad extended the full width of the flange and12 inches along the beam's axis. Figure 8 shows the load frame and the test girder during one ofthe tests.
In order to monitor beam behavior during loading and at failure, several data collectiondevices (DCDs) were used to record beam deflections at regular intervals along the length of thebeam, strand slippage at the beam end, load intensity at the ram, and internal strains in theflanges and deck. These devices were in tum connected via cabling to a computerized dataacquisition system. The DCDs for the internal strain were connected to a separate digital readout. This section describes the function and property of these devices.
A 300-kip-capacity load cell placed underneath the hydraulic ram and on top of a swivelplaced on the deck, was connected to the data acquisition system to record the load intensityapplied to the beam during the testing. The load cell was calibrated to a plus or minus 1%precIsIon.
12
Figure 8: Load Frame and Test Setup
Wire pots or vertical displacement measuring potentiometers were placed six feet fromthe beam end, and at nine, 12, and 18 feet from the support to record the displacement profile ofthe beam. The data accuracy of these wire pots was on the order ofplus or minus 0.01 inch. Asin the case of the load cell, these wire pots were interfaced to the data acquisition system for datacollection.
To monitor strand slippage while loading the beam to failure, linear variable differentialtransformer (LVDT) devices were fastened to the protruding stands at the tested end of the beam.The LVDTs recorded slippage in the strands with an accuracy of plus or minus 0.003 inch. A slipof 0.01 inch was considered indicative ofbond failure.
Three vibrating wire strain gages, Model VeE 4200, by Geokon Inc., were embedded ateight feet from one end of each composite test girder, at the centroids of the lower flange, upperflange and deck. Vibration frequencies, of a pretensioned steel wire between two metalliccasings that made up the strain gages, denoted the movement and the corresponding strainsinduced by the relative displacement of one metallic casing with respect to the other. Acompanion digital read-out was interfaced to the vibrating wire gauges to record the detectedinternal strains. Internal strain readings were manually recorded at 25-kip load increments tofailure.
13
The data acquisition system consisted of the following:
1. notebook with 8MB RAM, 500 MB hard disk, and a Windows 95 operating system
2. multi-port MEGADAC System Series 3100, for data collection. Each portaccommodated four-channel bridging cartridges that interfaced with the DCDs
3. TCS software interfaced the operating system and the MEGADAC, which allowedfor continuous recording of data from the DCDs.
After all the DCDs were connected to the test beam, load was applied in increments of 25kips. A remote control operated the 300-kip hydraulic ram. Internal strain readings wererecorded manually at the end of each load increment for tested beam ends, which were fittedwith internal strain gauges. At cracking, the load was held constant for a short period to allow thestudy team to visually inspect and map the emerging cracks in the beam. Loading was thenresumed to failure. In some of the tests, the load approached 290 kips, which was deemed thehighest load that could safely be supported by the test assembly, and the test was terminated. Inone instance, the beam failed by yielding, followed by rupture of a strand.
The data set denoting beam deflections, strand slippage, and load intensity wascontinuously recorded by the MEGADAC during the testing at the rate of 10 scans per second.At the end of each test, the cracks were mapped and pictures were taken to record the final crackpatterns.
Prestress Losses
Three vibrating wire gauges were embedded at the centroid of the prestressing strands ofthe Type IV test girders, at mid-span, and at six inches on either end of the mid-span. Internalstrains were recorded at two-hour increments on a digital read-out device for nine months afterdetensioning. Thermocouples to monitor change in temperature in the concrete were placedadjacent to each of the three vibrating wire gauges.
RESULTS
Transfer Length Results
Concrete surface strain profiles produced from the Type II test beams were notdecipherable. Low prestressing forces on the Type II beams led to strains on the order of 90 to180 micro strains at the transfer ends. The Whittemore gauge could not precisely record such lowstrains. Moreover, some of the Whittemore inserts were damaged during the removal of themetallic strip that attached them to the side forms. Therefore, evaluation of the transfer lengths ofType II girders was not possible. The following discusses results for the Type IV girders.
Sixteen concrete surface strain readings were taken on each side of each end of eachbeam. Each strain reading represented the average strain over the eight-inch Whittemore gauge
14
length. These strain data are referred to here as raw strain data. Strain profiles (variation ofstrains along the beam ends) produced from these raw strain data were quite irregular, a fact thatcould be attributable to high variations in the modulus of elasticity along the concrete surface ofthe lightweight beams and to human inaccuracies in measurement data.
Because the inserts were spaced four inches apart, successive strain readings overlappedfour inches with the preceding ones. By averaging three successive strain data readings at a time,the effect of the irregularities are reduced and a smoother strain profile is produced. Thistechnique is referred to as smoothing.9 Figure 9 illustrates raw and smoothed strain profilesproduced from strain readings taken on one side of beam end LW8000IV-4A.
Further reduction of the data was done by averaging the "smoothed" strain profiles onboth sides of each end of a test beam for both beam-ends and for all beam ends. These averagedresults (labeled ASSP) are shown in Figure 10. The 95 % average maximum strain (AMS)method10 was used to determine the transfer length for the HPLWC Type IV test beams. Theprocedure for the 95 % AMS method was as follows:
1. Determine the point at which the strain profile begins to plateau.
2. Compute the average strain for all points within the plateau. This represents the 100% average maximum strain.
3. Calculate 95% of the AMS and plot its line.
The intersection of the 95% AMS line with the sloping smoothed strain profile producesthe transfer length. Figure 10 demonstrates the use of the 95 % AMS method.
The transfer length determined from this strain profile was 17 inches, which is less thanthat calculated using the ACIIAASHTO code (50 db, or 25 inches in this case). Consistent withfindings from other research investigations, the live beam ends (beam ends closest to theprestressing jack) had longer transfer lengths than did the dead beam ends.
O __-.,.------r----r----,---...,.--.,------r----r----,.---,---..,-----,----r"---r---,-----t
o 6 10 14 18 22 26 30 34 38 42 46 50 54 58 62 66
Distance From End (inches)
C 1200.n;~....,fne 1000CJ
gc:.~....,enCDCJ
~~enCD....,eCJc:oo
Figure 9: Raw and Smoothed Strain Profiles (SSP) for One Side of LW8000IV-5C
1200
U)C
"cu'-
10001;)0'-(.)
I 800
U)c
L t=17.0"cu.... 600en(1)(.) • ASSP-LW 8000lV~~ 400
en -.- 95%AMS-LW 8000lV(1)
G)'-(.) 200C0(,)
10 20 30 40 50 60 70
Distance From End (inches)
Figure 10: Averaged Strain Profile for Both HPLWC Type IV Test Beams
16
Development Length Tests Results and Analysis
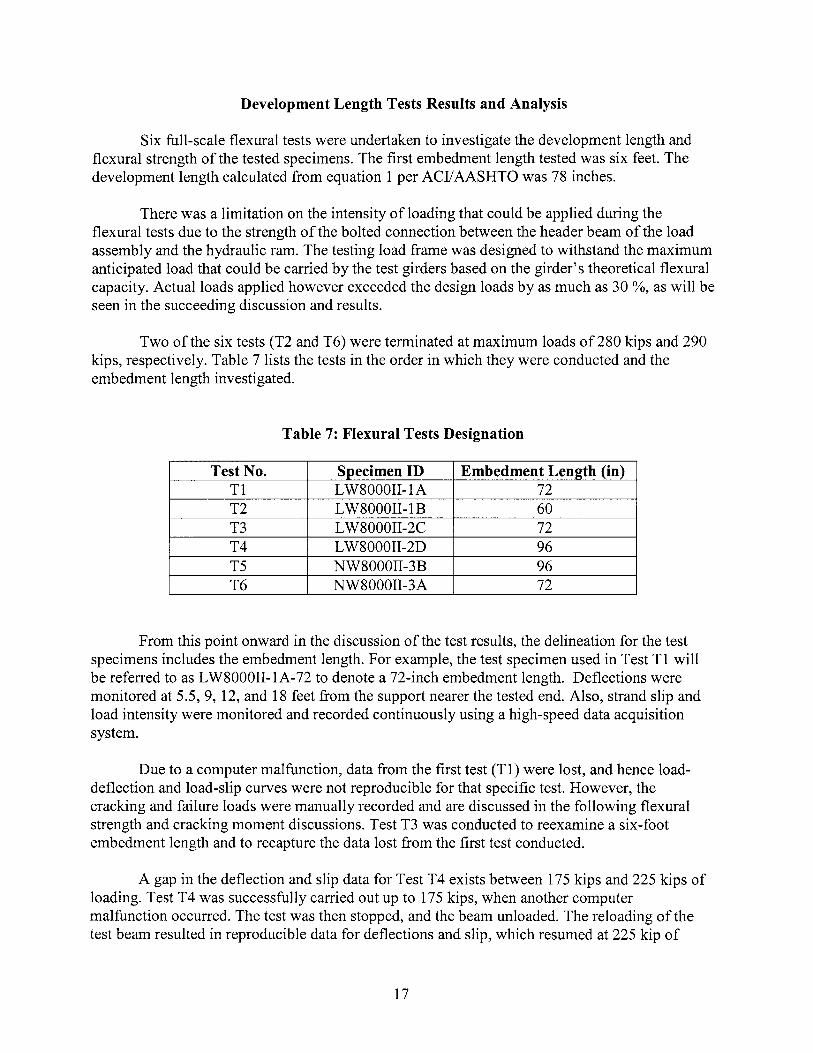
Six full-scale flexural tests were undertaken to investigate the development length andflexural strength of the tested specimens. The first embedment length tested was six feet. Thedevelopment length calculated from equation 1 per ACI/AASHTO was 78 inches.
There was a limitation on the intensity of loading that could be applied during theflexural tests due to the strength of the bolted connection between the header beam of the loadassembly and the hydraulic ram. The testing load frame was designed to withstand the maximumanticipated load that could be carried by the test girders based on the girder's theoretical flexuralcapacity. Actual loads applied however exceeded the design loads by as much as 30 %, as will beseen in the succeeding discussion and results.
Two of the six tests (T2 and T6) were terminated at maximum loads of 280 kips and 290kips, respectively. Table 7 lists the tests in the order in which they were conducted and theembedment length investigated.
Table 7: Flexural Tests Designation
Test No. Specimen ID Embedment Length (in)T1 LW8000II-1A 72T2 LW8000II-1B 60T3 LW800011-2C 72T4 LW800011-2D 96T5 NW800011-3B 96T6 NW800011-3A 72
From this point onward in the discussion of the test results, the delineation for the testspecimens includes the embedment length. For example, the test specimen used in Test T1 willbe referred to as LW8000II-1A-72 to denote a 72-inch embedment length. Deflections weremonitored at 5.5,9, 12, and 18 feet from the support nearer the tested end. Also, strand slip andload intensity were monitored and recorded continuously using a high-speed data acquisitionsystem.
Due to a computer malfunction, data from the first test (T1) were lost, and hence loaddeflection and load-slip curves were not reproducible for that specific test. However, thecracking and failure loads were manually recorded and are discussed in the following flexuralstrength and cracking moment discussions. Test T3 was conducted to reexamine a six-footembedment length and to recapture the data lost from the first test conducted.
A gap in the deflection and slip data for Test T4 exists between 175 kips and 225 kips ofloading. Test T4 was successfully carried out up to 175 kips, when another computermalfunction occurred. The test was then stopped, and the beam unloaded. The reloading of thetest beam resulted in reproducible data for deflections and slip, which resumed at 225 kip of
17
loading to failure. A combination of the test data from these two test attempts did provideintelligible load-deflection and load-slip graphs, albeit with a gap in the curves.
Prior to a discussion of the test results, the following sections briefly detail the testbeams' engineering properties and the prestress loss models used to calculate the amount ofprestress in the beams at the time of testing and at its end of service.
Composite Test Beam Engineering Properties
Table 8 lists the engineering properties for the HPLWC and HPNWC composite testbeams. The modulus of elasticity for the beams and deck were calculated per Section 8.5.1 of theACI code,6based on their 28-day compressive strength. The transformed composite sectionswere based on the modulus of elasticity of the concrete in the beams.
Table 8: Composite Test Beam Properties
Specimen ID Beam MOE Deck MOE Moment of Unit Weight(ksi) (ksi) Inertia (in4
The jacking force in a strand was determined from calibration tables, which translatedpressure gauge readings on the jack to equivalent loads in pounds. A measurement of the strandelongation along the prestressing bed assisted in verifying the applied jacking forces. For theType II beams, an anomaly in the pressure gauge readings dictated determining the jacking forcefrom the recorded elongations. The strands were initially prestressed with a pre-load of about4000 pounds to remove slack. The recorded elongation of the strand after preloading was about9.5 inches. With a distance of approximately 130 feet between the prestressing abutments, thistranslated into a force of approximately 26,900 pounds and a total jacking force of 30,900pounds per Yi-inch strand, or 202 ksi (0.75 fpu). Instantaneous losses due to slip of strands at theprestressing chucks, steel relaxation, and elastic shortening of the concrete at transfer were allcalculated, and the initial prestress, fsi, was determined.
Effective prestress, fse, at the time of testing (180 days after detensioning) was calculatedin order to compare the theoretical cracking moments to the test cracking moments. The modelsused to calculate long-term losses (TL) due to steel relaxation (REL), creep (CR), and shrinkage(SH) were the ACI209R-9211 model and the Prestressed Concrete Institute (PCI) mode1. 12 Table9 is provided as an illustrative sample of the calculations undertaken to arrive at the effectiveprestresses in the HPLWC test beams.
18
Table 9: Effective Prestress for the HPLWC Test Beam (Per PCI Model)
Parameter Time Interval in Days(ksi) oto 30 30 to 90 90 to 180 180 to End of Service
The flexural test results are presented in Table 10. Ultimate moments in the test beamswere calculated from the ACI and AASHTO equations (MAcIIAAHSTO) for strength and strandstress. Note that the ACI and AASHTO approximate methods for calculating strength yieldidentical results for the test beams. Ultimate moments were also calculated using the straincompatibility analysis method (MCOMP) for comparison purposes. The ACIIAASHTO equationprovides an approximate value of the stress in the strand at failure. The strain compatibilityanalysis is a more accurate evaluation of the strand stress at failure. It is based on the generallyaccepted assumptions that plane sections remain plane, the compatibility of strains between thestrand and the concrete (i.e., perfect bond), and equilibrium of forces. The ACIIAASHTO codesallow the use of either method. As shown in Table 10, there is close agreement between the twomethods with a difference of about 1%. The ACI/AASHTO equation is generally moreconservative.
Table 10: Development Test Results: Ultimate Moments
Test Specimen ID MAcIIAAHSTO MCOMP MTEST Failure Mode MTEST
aSlip data were not available. The data were lost due to a computer malfunction during testing.bTesting was stopped at 280 kips. Higher loads were deemed unsafe to the load frame.CTesting was stopped at 290 kips for the same reason indicated previously.
19
Generally, three modes of failure were observed: flexure, flexurelbond, and bond/shearfailures. Flexural failure was characterized by excessive flexure and shear-flexure cracks,yielding of the strands, and subsequent crushing of the compression zone concrete in the deck.In one instance (NW8000II-3B-96), the flexural failure was characterized by a simultaneouscrushing of the concrete and rupture of one prestressing strand.
Flexurelbond failure was similar to the flexural mode failure; however, significant bondslippage was recorded prior to the failure of the beam.
Bond/shear failure ofbeam LW8000II-1B-60 was characterized by a widening shearcrack at the near support of the beam at about 250 kip of loading, which caused local disjointingat the lower flange and simultaneous inception of bond slippage, with increased loading. Thetheoretically computed ultimate load for that beam was about 256 kips. For this reason, thefailure mode of this beam was classified as shear failure accompanied by general bond failure asobserved from the recorded strand slippage. A reexamination of the shear capacity of the Type IIcomposite beam calculated per ACI 318-99,6 given the lower concrete strength (6780 psi) and theshort development length tested (5 feet) in this specimen, shows a reduced shear strength ofabout 247 kips. This is consistent with the shear crack and disjointing exhibited by the specimenat around 250 kips. Formation of a tie in the lower flange as shown in Figure 11 accelerated theprogression of the incipient web shear crack into the lower flange and hence the noted disjointingduring the testing. It is this deep beam action that enabled the beam to carry additional loadingbeyond its shear capacity. The load applied to this beam reached 280 kips.
Cracking Moments
Cracking moments observed during flexural testing corresponded to moments in thebeam at the first visible signs of cracking. Cracking moments based on the predicted effectiveprestresses (predicted by the ACI and PCl models at the time of testing) were calculated usingthe concrete strength at the time of testing. Table 11 presents the actual (MCR-TEST) andtheoretical cracking moments (MCR-ACI and MCR-PCI) in the test beam.
Table 11: Cracking Moments
Specimen ID MCR-ACI MCR-TEST MCR-PCI MCR-TEST MCR-TEST
Figure 11: Strut and Tie Model: Shear Crack Propagation in Specimen LW8000II-IB-60
Load Deflection and Load Slip Behavior
Load deflection curves were obtained for each test. Wire pots located at 5.5, 9, 12, and 18feet from the support recorded the beam deflections during the testing. Figures 12 and 13 depictthe load deflection and load slip behavior for Test T3 on beam LW80000II-2C-72. Slip wasrecorded via LVDTs attached to the strands. Bond failure was defined as occurring whenslippage greater than 0.01 inch occurred in any of the strands. This particular beam exhibited aflexural/bond failure.
In general, the load deflection curves for the lightweight beams were tri-linear. Thecurves varied linearly to cracking and then reflected an elasto-plastic behavior in the beams assteel yielded, followed by a plastic behavior characterized by increased deflections with littleadditional loads applied until concrete crushed at failure. The load deflection curves for thenormal weight concrete beams were bi-linear in shape. The curves increased linearly to crackingand then slightly beyond cracking, after which yielding of steel induced increasing deflections inthe beam followed by ultimate failure by crushing of the concrete.
Figure 14 illustrates superimposed load deflection curves for a lightweight and normalweight test beam for comparison purposes. The resulting linear segments of the curves aredelineated with a dashed line. Note that, even though the lightweight and normal weight beamswere both AASHTO Type II beams, the compressive strength for the normal weight beams was8990 psi at the time of testing compared to 6680 psi for the lightweight beams, and the density ofthe lightweight concrete (114 pct) was about 79% of the normal weight concrete's density (145pct).
Figure 14: Typical Load Deflection Curve for HPLWC/HPNWC Beams
Strand Slip and Development Length
There are two types ofbond failure in beams prestressed with multi-wire strands: Generaland ultimate bond failures.
General bond slip represents significant slip at the free end of the strands, considered tobe a slip of 0.01 inch or greater in this research investigation. At ultimate bond failure, thestrands continue to slip without an additional increase in load/stress. Mechanical resistance toslip between general and ultimate bond failure is provided by the interlock between the concreteand the helically shaped strands.
It is worthwhile indicating here that the development length equation in theACI/AASHTO codes was intended to serve as a reasonable mean representing general bondfailure. 13
,14 Table 12 indicates the maximum slip in the strands recorded during testing.
24
Table 12: Maximum Strand Slip Recorded During Testing
"est lpecimen ID 1ax. Strand lo. of Strands "ailure Mode 1TEST
aSlip data were not available. Data lost due to computer malfunction during testing.bTest was stopped at 280 kips for safety purposes. Beam was not loaded to failure.bTest stopped at 290 kips for safety purposes.
Crack Patterns
In general, lightweight beams exhibited cracks that were closely spaced, as indicated inFigure 15. At failure the widest crack was about 3/16 inch wide. Vertical flexural cracksdominated the zone under the load, and inclined flexure-shear cracks dominated the zones oneither end of the load. Due to the weaker tensile strength of the lightweight concretes, web shearcracking was more prevalent than in the normal weight concrete beams. Prior to failure, mostlightweight beams tested featured extensive flexure and flexure-shear cracks. Redistribution ofincreasing bending and shear stresses in the lightweight beams by progressive cracking led toincreased elasto-plastic behavior and ductility in the lightweight beams. This is most evidentfrom the tri-linear shape of the load-deflection curves of the HPLWC beams.
Cracks in the normal weight beams were further apart than in the lightweight concretebeams as can be seen in Figure 16. There were considerably fewer web shear cracks than in thelightweight beams due to the higher tensile strength of the normal weight beams. At failure thecracks were about Y2 inch wide. As higher bending stresses were induced into the beams, theflexural cracks grew wider, and with increasing shear stresses, web shear cracks appeared on oneside of the loading zone.
25
Figure 15: Crack Pattern for Beam LW8000II-IA-72
Figure 16: Crack Pattern for Beam NW8000II-3A-72
26
Prestress Loss Results
A secondary objective of this research investigation was to monitor and compareprestress losses in HSLWC AASHTO Type IV girders to estimates derived from existing lossprediction models.
The two AASHTO Type IV specimens, LW8000IV-4 and LW8000IV-5, produced forthis purpose were fitted with internal vibrating wire gauges, which measured concrete strains atthe center of gravity of the prestressing strands. Three vibrating wire gauges were installed ineach beam: One at the center of the beam span and two placed six inches on each side of thecenter. A data logger recorded strain readings from the gauges at two-hour intervals. Atemperature sensor was contained in each vibrating wire gage and these temperature readingswere recorded by the data logger as well.
In order to assess directly the prestress losses in the beams, it would have been necessaryto measure separately the amount of creep and shrinkage occurring in the beam during thetesting. Since this was not the objective of the research, a qualitative assessment of the prestressloss that is encountered in the HPLWC Type IV prestressed girders is achieved through acomparative analysis of the concrete strains measured directly from the girders throughout a ninemonth period to theoretical strains derived from creep, shrinkage, and relaxation lossesdetennined from the ACI and PCI models.
As indicated, concrete strain readings from three gauges in each girder were recorded bihourly. Since the gauges were six inches apart along the girder's axes, the significance of thedifferences in the girders self weight on the concrete stresses and strains at the level of thestrands on the different gauges was neglected. Also, since both girders were cast out of the sameHPLWC mixture, data from the six gauges internal to the girders were averaged on a daily basisto provide average concrete strains at the center of gravity of the strands in the test specimensafter transfer. Averaging the data also smoothed the effects of the daily temperature changes inthe concrete on the recorded concrete strains.
The resulting test data were then compared to theoretical strains determined using a timestep method3 using the ACI and PCI prestress loss models.
Time dependent losses in prestressed concrete, namely creep, shrinkage, and steelrelaxation are interdependent. Creep and steel relaxation are a function of the prestress force inthe concrete, which is itself decreasing due to the effects of creep, shrinkage, and relaxation. Thisinterdependency is accounted for by a summation procedure that takes into account all of thesevariables within a discrete time interval. For the purpose of this study, a weekly time interval wasused.
The procedure was as follows: 3
1. At the beginning of each time interval, the concrete strains at the bottom and top
fibers (Et ,Eb) of the section are calculated and the strains at the level of the strands
(Es) are then derived.
27
2. The creep strain (~ECT) at the level of the strands is computed by multiplying thecreep coefficient, from the PCI or ACI model during the time interval, by the strainsat the level of the strand.
3. The total change of strain in the level of the strand is computed by adding the
shrinkage strain increment (~Esh) during the time interval to the creep strainscalculated in Step 2.
4. The total change in strain computed in Step 3 is then multiplied by Eps (Modulus ofElasticity of the strand) and added to the steel relaxation to obtain the total loss inprestress during the time interval.
5. Concrete strains (~Es) corresponding to the decrease in the prestress losses duringthe time interval are calculated as Step 1.
6. The net strain (Esnet) at the level of the strands is computed by adding the strains in
Steps 1,3, and 4.
The initial prestress used in the time stepped analysis was calculated by subtracting theinstantaneous losses of elastic shortening, steel relaxation, and anchorage slippage from thejacking force.
Figure 17 shows the actual variation of strains over time in the HPLWC Type IV girdersand the corresponding theoretical strains for the ACI and PCI models.
As seen from the curve, the PCI method closely models the HPLWC behavior over time.Generally, the actual concrete strains were less than those predicted by the ACI and PCI models.
Table 13 compares the actual and theoretical strains at 1, 8, 29, 57, 180, and 266 days,respectively.
28
Table 13: HPLWC Type IV Beams: Actual and Theoretical Strains1
DAY TEST PCI (ue) ACI (ue) PCI ACI ACI(ue) TEST TEST PCI
There are few research investigations that address the effect of using high-strengthlightweight concretes on transfer length. Among these emerging studies are one performed atPurdue University by Peterman et aI.,15 and the University of Texas at Austin, by KolzoS. 16
Table 14 details the results from these two studies and those derived from this research study(labeled Virginia Tech).
It is evident that the transfer length tests presented in this report produced the shortestaverage transfer length (17 inches) in the available research findings. This is consistent withfindings from work done by Russell and Bums,10 which found that specimens with larger crosssections exhibit shorter transfer length. In particular their findings have shown that AASHTOtype beams exhibit transfer length 28% to 40% shorter than is found in small rectangular testspecimens, such as the ones used in Purdue's research. In this research study, the transfer lengthwas about 21 % shorter than that recorded at Purdue University.
Multi-strand prestressed AASHTO type girders simulate more closely the transfer lengthto be found in pretensioned members used in actual bridge construction. In this researchinvestigation, the cross sections, and prestressing applied is typical of the pretensioned membersthat will be used in the construction of the planned demonstration bridge. Therefore, the transferlength to be expected in the pretensioned members to be used in the Chickahominy Bridgeshould closely mirror the findings of this research investigation.
The transfer length results from the University of Texas at Austin (UTA) are interesting.The specimens were AASHTO Type I beams. The concrete strength at transfer was higher thanwas recorded in our specimens and the concrete density of the elements was higher than thatrecorded for this research work. Yet, the average transfer length recorded was about 35.5 inches,which is about 200% of that recorded in our investigation. The standard deviation for UTA's testdata sample was about 4.5 inches.
A report attributed to Logan17 by Peterman et aI. 15 in their investigation of the transferlength of semi-lightweight concrete concluded that there is a significant difference in the bondperformance in prestressed concrete beams among strands supplied by different manufacturers,such as was the case between the strands used in the research study of UTA and this researchstudy. Whether this could singularly explain the large disparity in the transfer lengths resultsbetween UTA's tests and this research investigation is unclear. As such, it is recommended thatfurther investigation of transfer length is necessary in order to reach a more conclusiveinterpretation of transfer length results for HPLWC prestressed beams. It would be beneficial touse strands from different manufacturers and adopt different AASHTO cross sections as testspeCImens.
30
Tab
le14
:C
om
par
iso
no
fTra
nsf
erL
eng
thR
esul
tsw
ith
Oth
erR
esea
rch
ers'
Res
ults
Res
earc
hS
peci
men
Co
ncr
ete
Noof~-
fsi
fei
f eL
t(te
st)N
o.O
fIn
stit
utio
nT
yp
eD
ensi
tyin
ch(k
si)
(psi
)(p
si)
(in)
Spe
cim
ens
(lb
/ft3 )
stra
nd
sP
urdu
eU
nive
rsit
yR
ecta
ngul
ar13
02
190
5620
7960
21.5
24
x6
inch
Uni
vers
ity
ofT
exas
atA
AS
HT
O12
012
180
4900
8130
35.8
2A
usti
nT
ype
IU
nive
rsit
yo
fTex
asat
AA
SH
TO
120
1218
055
6078
5034
.83
Aus
tin
Typ
eI
Vir
gini
aT
ech
(i.e
.,cu
rren
tA
AS
HT
O11
440
180
4480
6680
172
stud
y)T
ype
IV
Tab
le15
:C
om
par
iso
no
fTra
nsf
erL
eng
thto
Cod
esan
do
ther
Res
earc
her
s'R
ecom
men
dati
ons
Res
earc
hL
t(te
st)fs
ife
iE
eiL
t=5
0d
bL
t-te
stL
t=60
dbL
t-te
stIn
stit
utio
n(i
n)(k
si)
(psi
)(k
si)
AC
I/A
AS
HT
OL
t-co
deA
AS
HT
OL
t-co
dest
and
ard
LR
FD
Pur
due
Uni
vers
ity
21.5
190
5620
3670
250.
8630
0.72
UT
A35
.818
049
0030
4025
1.43
301.
19
UT
A34
.818
055
6032
4025
1.39
301.
16
Vir
gini
aT
ech
1718
044
8026
9025
0.68
300.
57(i
.e.,
curr
ent
stud
y
31
The findings from Purdue University and the current study are well within the codestipulations of the ACI, AASHTO standard, and AASHTO LRFD as shown in Table 15. UTA'sresults are well beyond the range of the current codes, including the AASHTO LRFD stipulationof60 db. The average transfer length from UTA's study is about 20% (six inches) longer than theAASHTO LRFD code.
Pending further research, it is recommended for lightweight concrete that all codes beupgraded, including the ACI and AASHTO standard to 60db or (fs1 .db)/3. The equations fortransfer length were always intended as mean representations. Raising the ACI/AASHTOstandards equation by 20% will still maintain that intent and should be re-evaluated whenadditional research data becomes available.
A keen reading of the development of the transfer length guidance in the ACI/AASHTOstandard code indicates that the 50 db stipulation for the transfer lengths was based on thepremise that the effective prestress at the time of testing done by Hanson and Kaar18 was 150 ksi,which when coupled with the formula derived by Mattock19 {Lt = fse.db/3}, lends the 50 dbguidance. In today's practice, most transfer length data referred to in the literature are determinedfrom measurements conducted immediately after detensioning. Hence, it is logical to use theinitial prestress rather than the effective prestress in the formulation of the transfer length as hasbeen suggested by Buckner14 and Shahawy et a1.20 Moreover, as is readily observed in Tables 14and 15, the initial prestress in today's practice falls within the range of 180 ksi and higher. Assuch, the 60db guidance for transfer lengths stipulated in AASHTO LRFD is more appropriate totoday's practice. Whereas it may not be conservative for some transfer lengths results as seenfrom the study conducted by UTA, it is still a more conservative mean representation than thecurrent ACI and AASHTO standard stipulation of 50 db.
Development Length Test Results
Ultimate Moments
Figure 18 shows that all the HPLWC prestressed test beams exhibited a flexural capacityexceeding the design strength predicted by the ACI and AASHTO codes by about 25% to 30%.Test T2, Specimen LW8000II-IB-5, was terminated prior to ultimate failure of the beam asstated. Despite that, the test moments reached have surpassed the ACI/AASHTO ultimatemoments.
In general, the test failure moments of the HPLWC beams were lower than their HPNWCcounterparts by about 5%. Lower stiffness in the beams resulted in higher curvatures for thesame test load in the lightweight beams than in the normal weight beams. Lightweight concreteis weaker in tension, which expedited cracking and the migration of the neutral axis toward theupper compression fibers and, hence, failure of the beams.
Lightweight beams exhibited greater ductility and energy absorption capacity than thenormal weight beams. This is evident from the recorded ultimate deflections and the areas underthe load-deflection curves for similar development lengths tested.
32
Figure 19 presents the ratio of the ultimate to cracking moments recorded during testingand compares that to the same ratios derived from calculating the ultimate and cracking momentsfrom the ACIIAASHTO codes. It is evident that the beams' capacity to withstand increasedloading beyond cracking is higher than the code predictions.
Consistent with the observed increased ductility in the lightweight beams, it is again seenhere that those beams exhibit higher flexural capacity beyond cracking than the normal weightones.
It is necessary to note that AASHTO/ACI design strength equations produce the sameultimate strength for the HPNWC composite beam and the HPLWC beams, even though theprestressed beams used are of differing strength and density. This is because the neutral axis atfailure falls within the normal weight concrete deck that tops both beams and therefore thestrength of the composite HPNWC and HPLWC beams is similar to that of any equivalentrectangular prestressed normal weight beam with the same reinforcement.
Given this discussion, it is necessary to caution the reader that the test moments observedin this study seem considerably high (25% to 37%). This is attributed in part to the use ofneoprene pads at both supports. The neoprene pads were used to simulate the condition of thetest girder in the bridge. The friction provided by the pads provided some lateral restraint at bothsupports and hence added to the flexural capacity of the test girders. Moreover, the theoreticalvalues for the flexural capacity of the girders were based on an ultimate strand stress of270 ksiand ultimate concrete compression fiber strains of 0.003. It is generally accepted thatcontemporary prestressing strands could withstand higher ultimate stresses and that concretecompressive strains higher than 0.003 could occur.
Figures 20 and 21 are a comparison of the actual cracking moments recorded duringtesting and the theoretical cracking moments derived from elastic analysis of the sections usingeffective prestresses derived from the ACI and PCI models. The modulus of rupture, fr , used inthe computation of the theoretical cracking moments for the lightweight beams was calculatedper the guidance of section 9.5.2.3 (b) of the ACI code, where fr is equal to 0.85 (7.5~fc').
Where the split tensile strength, fCh is specified the ACI allows substituting fct/6.7 for ~fc'. Theaverage split tensile strength for this concrete mixture was 537 psi. The values offct/6.7 and ~fc'
(fc'= 6380 psi) were essentially equal, and hence no substitution was done to compute themodulus of rupture.
It can be readily seen from Figure 20 that the lightweight beams cracked at a modulus ofrupture lower than that provided by the code. With the exception of Test T1 in which theemergence of first cracks may have been missed, the remaining beams cracked at moments 86%to 95% of the theoretical cracking moments. As will be seen in the prestress loss discussion, theACI and PCI models predict higher prestress losses than are actually present in HPLWC beams.It is therefore unlikely that the higher theoretical cracking moments compared herein are due toprediction of higher effective prestress in the beams by the ACI/PCI prestress loss models.
Assuming prestress forces in the test beams are as predicted by the ACI model, theequivalent modulus of rupture for the cracking moments recorded during tests T2 to T4 rangesabout 60% to 85% of the code provisions (3.75~fc'- 5.45~fc').
The cracking moments recorded during testing of the normal weight beam are closer tothe theoretical cracking moments than were the lightweight ones, as shown in Figure 25. Thetest cracking moments were about 94% to 98% of the theoretical values of the crackingmoments.
The modulus of rupture for the lightweight beams appears to be lower than the codestipulation. Naaman9 quotes observed values for modulus of rupture ranging from 5~fc' to 9~fc'.
He further elaborates that the code stipulation on modulus of rupture 0.85 (7.5~fc') are based onthe lower limit of these.
It is clear that the moduli of rupture observed in this research warrant furtherinvestigation and possible revision of the code with regard to the modulus of rupture oflightweight concretes of the density and strength used in this research investigation. Furthermore,it is interesting to note that the correlation between the average split tensile strength measured inthe lab, 537 psi (6.7 ~fc'), and the tensile strength recorded during flexural testing (3.75~fc'
5.45~fc') is poor. This is one more reason for more conservative limits on the allowable tensilestresses and/or modulus of rupture used for lightweight concretes of the density and strengthused in this research investigation. The difference in the curing conditions and the testingprocedures combined add up to a wide variation between actual in-situ recorded tensile strengthand lab-measured values.
36
8.587.576.5
-+-Mcr-aci-Mcr-pci-"'Mcr-test
6
Tl
5.5
1.00
"'~----""""_---------_1.03
1.06
1.04
1.02
1.00
0.98
0.96
0.94
0.92
0.90
0.88
0.86
0.84
4 4.5 5
Embedment Length (feet)
Figure 20: Ratio of Test and Theoretical Cracking Moments for the HPLWC Test Beams
11 1'\1'\ 1 nn••vv ••vv- -...... "... 1.001.00
.------. 0.98
..------ T5·0.94
,....,r.I.U
-+-Mcr-aci-Mcr-pci-~Mcr-test
1.06
1.04
1.02
1.00
0.98
0.96
0.94
0.92
0.90
0.88
0.86
0.84
4 4.5 5 5.5 6 6.5 7 7.5 8 8.5
Embedment Length (feet)
Figure 21: Ratio of Test and Theoretical Cracking Moments for the HPNWC Beams
37
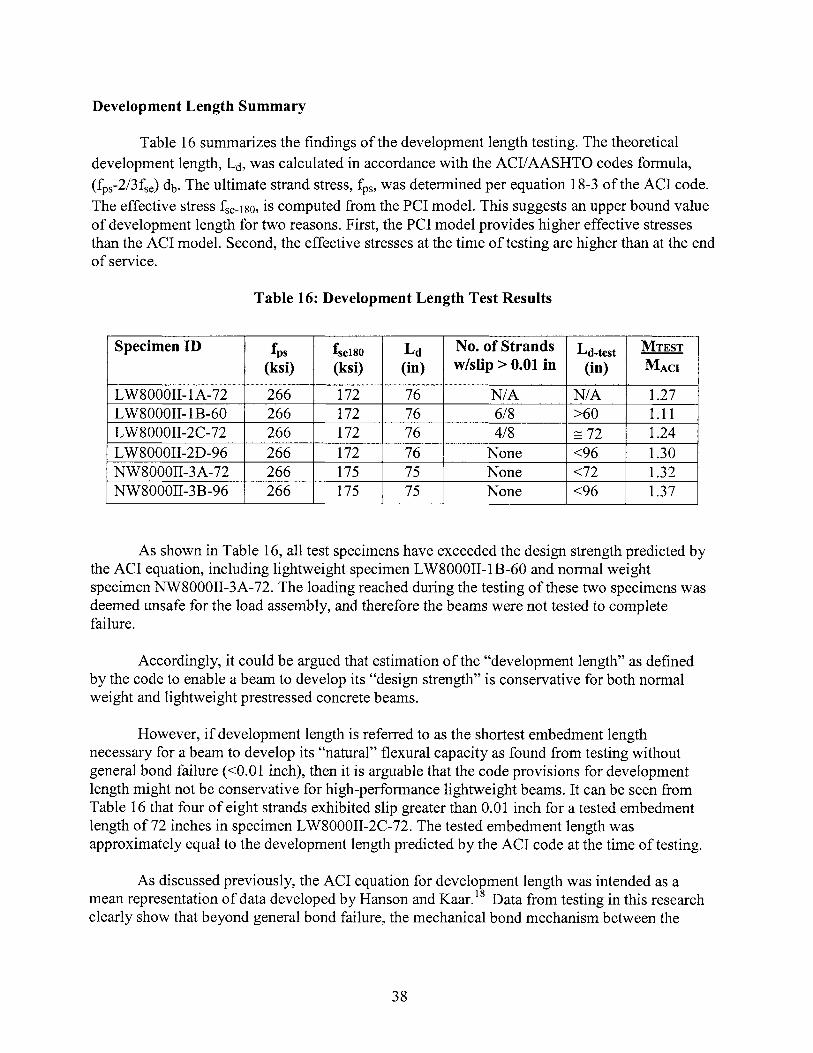
Development Length Summary
Table 16 summarizes the findings of the development length testing. The theoreticaldevelopment length, Ld, was calculated in accordance with the ACI/AASHTO codes formula,
(fps-2/3fse) db. The ultimate strand stress, fps, was determined per equation 18-3 of the ACI code.
The effective stress fse-180, is computed from the PCI model. This suggests an upper bound valueof development length for two reasons. First, the PCI model provides higher effective stressesthan the ACI model. Second, the effective stresses at the time of testing are higher than at the endof service.
Table 16: Development Length Test Results
Specimen ID fps fse180 L d No. of Strands Ld-test MTEST
As shown in Table 16, all test specimens have exceeded the design strength predicted bythe ACI equation, including lightweight specimen LW8000II-1B-60 and normal weightspecimen NW800011-3A-72. The loading reached during the testing of these two specimens wasdeemed unsafe for the load assembly, and therefore the beams were not tested to completefailure.
Accordingly, it could be argued that estimation of the "development length" as definedby the code to enable a beam to develop its "design strength" is conservative for both normalweight and lightweight prestressed concrete beams.
However, if development length is referred to as the shortest embedment lengthnecessary for a beam to develop its "natural" flexural capacity as found from testing withoutgeneral bond failure «0.01 inch), then it is arguable that the code provisions for developmentlength might not be conservative for high-performance lightweight beams. It can be seen fromTable 16 that four of eight strands exhibited slip greater than 0.01 inch for a tested embedmentlength of72 inches in specimen LW800011-2C-72. The tested embedment length wasapproximately equal to the development length predicted by the ACI code at the time of testing.
As discussed previously, the ACI equation for development length was intended as amean representation of data developed by Hanson and Kaar. 18 Data from testing in this researchclearly show that beyond general bond failure, the mechanical bond mechanism between the
38
strands and the concrete contributed towards additional flexural resistance in the HSLWC testbeams.
Table 17 summarizes the loads at which general bond failure (defined as slip of 0.01inch) occurred in specimens LW8000II-IB-60 and LW8000II-2C-72, and the failure loadspredicted by the AASHTO/ACI design strength equations and the final test/failure loads. Notethat at 280 kips, testing of specimen LW8000II-2C-72 was tenninated for safety purposes asindicated previously.
Table 17: Comparison of Loads at Failure and Slip
Specimen ID PSL1P PACI PTEST PTEST PTEST
(k) (k) (k) PSLIP PACI
LW8000II-IB-60 244 252 280 1.15 1.11
LW8000II-2C-72 230 218 272 1.18 1.25
As seen, the HPLWC test beams developed additional flexural resistance in excess of15% beyond general bond failure.
The nonnal weight beams showed no slip in the tested embedment length of six feet andeight feet, respectively. Although testing of the six-foot embedment length in specimenNW8000II-3A-72 was tenninated at 290 kips of load for safety purposes, the flexural momentsreached were 32% greater than the design strength calculated from the ACI/AASHTO equations.As such it could be argued that the equation for the development length in ACI/AASHTO ismore conservative for HPNWC members than for the HPLWC prestressed members.
Unfortunately because of the limited number of test samples available, an exactdevelopment length could not be established for the HPNWC prestressed beam to enableestablishment of a factor of safety, vis-a.-vis the code provisions. It is also necessary to note thata direct comparison between the HPNWC and HPLWC specimens could not be drawn becauseof the variation in the concrete strength of the specimens. The HPNWC beams were significantlyhigher in compressive strength than the lightweight counterparts.
In light of these findings, it is the authors' opinion that the development length equationin the ACI/AASHTO codes as a mean representation remains valid for prestressed HPLWCbeams, even if with a low-to-no factor of safety, when compared to HPNWC prestressedmembers as could be qualitatively concluded here. At 72-inch embedment length, four of eightstrands recorded a general bond failure, and yet the HPLWC beam (LW8000II-2C-72) developeda flexural capacity 24% higher than the code prediction. The ACI/AASHTO development lengthequation predicted a 75-inch development length for this test member (i.e., a factor of safety ofapproximately 1.0).
39
Further testing is necessary to develop a correlation in the factors of safety inherent in thecurrent development length equation for high performance lightweight and normal weightprestressed concrete beams and to adjust the code accordingly for lightweight prestressedconcrete members.
Until further test data are obtained, it is recommended that the development lengthequation in the code be modified by a factor of 1/~, where ~ is equal to 0.85 for lightweightprestressed concrete beams. This increases the factor of safety of the development length forlightweight beams by about 18 %, given the test results of this research investigation. The ~
factor here is recommended for its ease of use. It is referenced in the AASHTO and ACI codes tomodify shear strength and modulus of rupture for lightweight concrete beams.
Prestress Losses
As stated, the objective for monitoring the variation of strain in the prestressed Type IVgirders was to assist in drawing qualitative deductions as to the rate and amount ofprestress lossthat occurred in the girders made with high performance lightweight concretes when comparedto predictions derived from the ACI and PCI models. Correlation of the measured strains overtime to strains calculated using the PCI and ACI models allows for a qualitative assessment ofprestress losses in the girders.
Concrete strains at the level of the strands are a function ofprestress, eccentricity of thestrands, and the gravity loading at the critical section. Due to softness of the material (lowmodulus of elasticity) and its relatively lower developed strength at detensioning (4780 psi), theelastic shortening loss was relatively high, 20.5 ksi (i.e., 10 % of the initial jacking stress of 205ksi). Due to this fact, it was recommended that a denser and stronger mixture be developed. Themixture used in the Chickahominy Bridge eventually incorporated normal weight coarse and fineaggregates to increase its unit weight and lightweight coarse aggregates of ~-inchmaximum sizeto increase its strength.
The overall prestress losses estimated for the HPLWC Type IV girders over a ninemonth period was 28.65 ksi using the ACI model and 16.20 ksi using the PCI model. Creepconstituted 55% to 63% of the calculated losses, and shrinkage about 33% to 36% of the same asseen in Table 18.
Table 18: Prestress Loss Components in the Type IV Girders
MODEL CREEP SHRINKAGE RELAXATION Total Loss(ksi) (ksi) (ksi) (ksi)
ACI 17.99 9.46 1.20 28.65PCI 8.99 5.81 1.40 16.20
40
Creep and shrinkage are the major components that contribute to the increase ofcompressive strains at the level of strands in prestressed beams. Creep is simply the property ofconcrete to continue to deform under sustained load, and shrinkage is the reduction in concretevolume due to loss of water by evaporation and continuing hydration.
As shown in Table 13, the actual compressive strains measured at the level of strands inthe HPLWC Type IV girders are less than that estimated using either the PCI or ACI model.
It is conservative to use either of these models to estimate the prestress losses in HPLWCprestressed beams, assuming that the long-term trend is not unlike the short-term trend. The ACImodel, which is the more conservative of the two and therefore forms a lower bound, predicts aneffective prestress of about 143 ksi at the end of service (assumed as 10,000 days here) of theprestressed beams studied herein. That is to say, the final effective prestress would be about 53%of the ultimate strength of the strands. As such, it is safe to conclude that the designers of theChickahominy Bridge could still use the ACI/AASHTO equations to determine the stress in thestrands and subsequently the strength of the HPLWC prestressed bridge girders, since theretained prestress in the members can safely be assumed to be greater than 50% fpu as stipulatedin the ACI/AASHTO codes.
Given that, the reader is cautioned that thermal effects on the concrete were notaccounted for and therefore constitutes a source of error in the test data. Moreover, thetheoretical strains beyond the 28th day were calculated using the modulus of elasticity of concretecalculated using its 28th day strength per ACI Section 8.5.1. (i.e., the increase in strength ofconcrete and therefore its modulus of elasticity was not accounted for in calculating the increasein compressive strains due to shrinkage and creep over time). As such, these strains areunderstandably higher than if the increase ofmodulus of elasticity with time had been accountedfor. However, this is counterbalanced by the fact that the modulus of elasticity calculated perSection 8.5.1 of the ACI code was about 14% higher than that recorded from testing done tomeasure the modulus of elasticity of the HPLWC mix on its 28th day.
The compressive strains at detensioning were recorded as 801 micro-strains, which isabout 26% higher than the theoretically calculated strain of 634 micro-strains. Two main factorscould be contributing to that. First, the actual modulus of elasticity of the concrete is lower thanthe theoretical one, and second, the initial prestress used in calculating the strains may beunderestimated.
Overall, however, it is evident from the short-term trend observed that both the ACI andPCI models could be safely used to estimate the prestress losses in HPLWC prestressed girders,since both seem to be conservative with regard to actual losses observed during this researchinvestigation.
CONCLUSIONS
• Composite girders made ofHPLWC AASHTO girders and normal weight concrete (NWC)decks behave like their counterparts made with NWC AASHTO girders and NWC decks.
41
This is due to the fact that the neutral axis at failure invariably lies within the NWC deck. Itis, therefore, safe to predict their nominal strength using the ACIIAASHTO equations forcalculating stresses in the strands at nominal strength for strength calculations.
• Tests have shown that the modulus of rupture for HPLWC prestressed T-girders is about 60%to 85% of the ACIIAASHTO code stipulation of~*7.5~fc', where ~ is recommended to be0.85 for lightweight concretes. This indicates that the allowable tensile stress at transfer ofprestress force and at service load in lightweight, prestressed concrete members should bereduced to allow for the same safety factor against cracking as found in prestressed concretemembers containing non-lightweight concrete.
• Prestress losses in HPLWC prestressed girders appear to be less than those predicted by theACI and PCI models. Furthermore, the loss trend appears to validate the use of theACI/AASHTO equations for predicting the stresses in the strands at nominal strength, whichequations are predicated on the condition that the effective prestresses at the end of serviceshould not be less than 50% of the strand strength.
RECOMMENDATIONS
1. It is recommended that all ACI/AASHTO code guidance for transfer length be raised to 60 dbper AASHTO LRFD's stipulation and/or (fsi.db)/3 for lightweight, prestressed concretebridge girders.
2. It is recommended that the equation for the development length of prestressing strands inprestressed concrete be modified by a factor of 1/~ (where ~ is equal to 0.85) when applied toprestressing strand in lightweight concrete. This should result in an 18% increase in theACI/AASHTO code stipulation for development length.
3. Additional development length testing is required to validate these results for other testparameters. The parameters that need to be varied are differing AASHTO Type girders,prestressing forces, HPLWC strengths, strand manufacturers, and concrete density.
4. Additional testing is required to verify the findings of this research regarding the lowmodulus of ruptures that characterized the HPLWC prestressed Type II T-girders at cracking,but a reasonable and minimum reduction of ~ is recommended.
5. Additional research is required to evaluate creep and shrinkage in HPLWC of differingstrength and densities. This is necessary in order to better estimate long-term prestress lossesin HPLWC prestressed girders.
42
REFERENCES
1. Ozyildirim, C., and Gomez, J. High-performance Concrete in a Bridge in Richlands,Virginia. FHWNVTRC 00-R6. Virginia Transportation Research Council, Charlottesville,1999.
2. Ralls, M. Texas High-performance Concrete Bridges: How Much Do They Cost? ConcreteInternational, Vol. 20, No.3, March 1998, pp. 71-74.
3. Nilson, A.H. Design ofPrestressed Concrete, 2nd Edition. John Wiley and Sons, New York,1987.
4. Cousins, T. Bond ofEpoxy Coated Prestressing Strand. Dissertation, North Carolina StateUniversity, Raleigh, 1986.
5. Simmons, M. Transfer and Development in Pretensioned, Prestressed Concrete GirdersUsing ~ inch Diameter Strands. Dissertation, Auburn University, Alabama, 1995.
6. ACI Committee 318. Building Code Requirements for Structural Concrete (318-99) andCommentary (318R-99). American Concrete Institute, Farmington Hills, Michigan, 1999.
7. American Association of State Highway and Transportation Officials. StandardSpecification for Highway Bridges. Sixteenth Edition.
8. American Association of State Highway and Transportation Officials. AASHTO LRFDBridge Design Specifications: Customary U.S. Units. Second Edition.
9. Naaman, A. Prestressed Concrete Analysis and Design: Fundamentals. McGraw Hill BookCompany, New York, 1982.
10. Russell B. and Bums N. Measured Transfer Lengths of 0.5 and 0.6 in. Strands inPretensioned Concrete. PCI Journal, Vol. 41, No.5, September-October 1996, pp. 44-65.
11. ACI Committee 209. Prediction of Creep, Shrinkage, and Temperature Effects in ConcreteStructures. Manual ofConcrete Practice. American Concrete Institute, Detroit, Michigan,2000.
12. PCI Committee on Prestress Losses. Recommendations for Estimating Prestress Losses.PCI Journal, Vol. 20, No.4, July-August 1975, pp. 43-75.
13. Tabatabi, H., and Dickson, T. The History of the Prestressing Strand Development LengthEquation. PCI Journal, Vol. 38, No.6, November-December 1993, pp. 64-75.
14. Buckner, C.D. An Analysis ofTransfer and Development Lengths for Pretensioned ConcreteStructures. FHWA-RD-94-049. Federal Highway Administration, Washington, D.C.,December 1994.
43
15. Peterman R., Ramirez J., and Olek, J. Evaluation ofStrand Transfer and DevelopmentLengths in Pretensioned Girders with Semi-Lightweight Concrete. FHWA-IN-JTRP-99/3.Federal Highway Administration, Washington, D.C., July 1999.
16. Kolzos R. Transfer and Development Length ofFully Bonded lh-inch Prestressing Strand inStandard AASHTO Type I Pretensioned High Performance Lightweight Concrete (HPLC)Beams. Thesis, University of Texas at Austin, 2000.
17. Logan, D. Acceptance Criteria for Bond Quality of Strand for Pre-tensioned PrestressedConcrete Applications. PCI Journal, Vol. 42, No.2, March-April 1997, pp. 52-79.
18. Hanson, N., and Kaar, P. Flexural Bond Tests ofPre-tensioned Prestressed Beams.Research and Development Bulletin D28. Portland Cement Association, Skokie, IL,January 1959.
19. Mattock, A. Proposed Redraft of Section 2611: Bond. Letter to W. Burr Bennet, Jr., ACICommittee 323, December 6,1962.
20. Shahawy, M., Moussa, I., and Batchelor, B. Strand Transfer Lengths in Full Scale AASHTOPrestressed Concrete Girders. PCI Journal, Vol. 37, No.3, May-June 1992, pp. 84-96.