Investigation of Water Binding in Aqueous Solutions of Poly(ethylene glycol), Poly(propylene glycol) and Symmetric Triblock Copolymers of Poly(ethylene glycol) and Poly(propylene glycol) Andreas Stensgaard Stoltze M.Sc. Thesis 2009 Section of Chemistry Department of Biotechnology, Chemistry and Environmental Engineering Aalborg University
Transcript
Investigation of Water Binding in Aqueous Solutions of Poly(ethylene glycol), Poly(propylene
glycol) and Symmetric Triblock Copolymers of Poly(ethylene glycol) and Poly(propylene glycol)
Andreas Stensgaard Stoltze M.Sc. Thesis 2009 Section of Chemistry Department of Biotechnology, Chemistry and Environmental Engineering Aalborg University
I
Title: Investigation of Water Binding in Aqueous Solutions of Poly(ethylene
glycol), Poly(propylene glycol) and Symmetric Triblock Copolymers of Poly(ethylene glycol) and Poly(propylene glycol)
Titel (Danish Title): Undersøgelse af vandbinding i vandige opløsninger af
polyethylenglykol, polypropylenglykol og symmetriske tre-blok copolymerer af polyethylenglykol og polypropylengly-kol
Subject: M.Sc. Thesis Project Period: September 1st 2008 – June 4th 2009 ___________________________ Andreas Stensgaard Stoltze Supervisor: Kristian Keiding Project Technician: Lisbeth Wybrandt Issues: 3 Number of Pages - Report: 38 - Appendices: 4 CD-ROM
II
III
Preface This M.Sc. thesis is based on the work carried out at the 9th and 10th semester at the Section of
Chemistry, Department of Biotechnology, Chemistry and Environmental Engineering, Aal-
borg University.
I would like to thank Associate Professor Søren Hvidt, Department of Science, Systems and
Models, Roskilde University, for providing Pluronic copolymers to my experimental work.
The Harvard System (Author Date Method) is used for references throughout the thesis.
IV
Table of Contents
ABSTRACT VII
RESUME (DANISH ABSTRACT) IX
1 INTRODUCTION 1
2 THEORY 3
2.1 POLY(ETHYLENE GLYCOL) 3 2.2 POLY(PROPYLENE GLYCOL) 4 2.3 PEO-PPO-PEO COPOLYMERS 6 2.4 INTERPRETATION OF WATER ACTIVITY MEASUREMENTS 9 2.4.1 THE VAN’T HOFF EQUATION 9 2.4.2 THE BET ISOTHERM 11
3 MATERIALS AND METHODS 13
3.1 DETERMINATION OF DRY MATTER CONTENT IN STOCK REAGENTS 14 3.2 PREPARATION OF POLYMER SOLUTIONS 14 3.3 WATER ACTIVITY MEASUREMENTS 15 3.3.1 WATER ACTIVITY AS FUNCTION OF TEMPERATURE 16 3.3.2 WATER ACTIVITY AS FUNCTION OF WATER CONTENT 17 3.4 DIFFERENTIAL SCANNING CALORIMETRY 17 3.4.1 DETERMINATION OF CMT AND ENTHALPY OF MICELLIZATION 18
4 RESULTS 19
4.1 POLY(ETHYLENE GLYCOL) 19 4.1.1 WATER ACTIVITY AS FUNCTION OF TEMPERATURE 19 4.1.2 WATER ACTIVITY AS FUNCTION OF WATER CONTENT 22 4.2 PEO-PPO-PEO COPOLYMERS 25 4.2.1 DETERMINATION OF CMT AND ENTHALPY OF MICELLIZATION 25 4.2.2 WATER ACTIVITY AS FUNCTION OF TEMPERATURE 27
5 DISCUSSION 29
5.1 WATER ACTIVITY MEASUREMENTS 29 5.1.1 WATER ACTIVITY AS FUNCTION OF TEMPERATURE 29 5.1.2 WATER ACTIVITY AS FUNCTION OF WATER CONTENT 30 5.2 DIFFERENTIAL SCANNING CALORIMETRY 31
6 CONCLUSION 33
V
7 REFERENCES 35
8 APPENDIX A – DRY MATTER CONTENT OF STOCK REAGENTS 39
9 APPENDIX B – AW DATA FOR PLURONIC F87 AND F88 41
VI
VII
Abstract The aim of this thesis was to investigate the water binding in aqueous solutions of
poly(ethylene glycol) (PEG), poly(propylene glycol) (PPG) and amphiphilic symmetric
triblock copolymers of PEG and PPG by water activity measurements as function of tempera-
ture and concentration. Furthermore, Differential Scanning Calorimetry (DSC) was used to
determine the critical micelle temperature (cmt) of the triblock copolymers. Eight different
PEG polymers, one PPG polymer and three different triblock copolymers were applied; how-
ever the PPG polymer was omitted as it could not be dissolved properly.
The water activity measurements showed that the water activity increases with increasing
temperature and decreasing concentration, i.e. water becomes a poorer solvent with increasing
temperature because the polymer-water interactions are reduced. Excess enthalpies for the
water binding were derived from the water activity measurements, but these are too large due
to insufficient equilibrium time in the system.
The DSC measurements showed that at a given concentration the cmt increases with increas-
ing hydrophilicity of the copolymer.
VIII
IX
Resume (Danish Abstract) Formålet med dette afgangsprojekt var at undersøge vandbindingen i vandige opløsninger af
polyethylenglykol (PEG), polypropylenglykol (PPG) og amfifile symmetriske treblok copo-
lymerer af PEG og PPG ved måling af vandaktivitet som funktion af temperatur og koncentra-
tion. Endvidere blev skanning kalorimetri (DSC) brugt til at bestemme den kritiske micelle
temperatur (cmt) for treblok copolymererne. Otte forskellige PEG polymerer, en PPG poly-
mer og tre forskellige treblok copolymerer blev anvendt; dog blev PPG polymeren undladt da
den ikke kunne opløses ordentligt.
Vandaktivitetsmålingerne viste at vandaktiviteten stiger med stigende temperatur og aftagen-
de koncentration, dvs. at vand bliver et dårligere solvent med stigende temperatur fordi poly-
mer-vand interaktionerne reduceres. Overskudsentalpier for vandbindingen blev udregnet fra
vandaktivitetsmålingerne, men disse er for store pga. utilstrækkelig ligevægtstid i systemet.
DSC målingerne viste at ved en given koncentration stiger cmt med stigende hydrofil karakter
af copolymeren.
X
1
1 Introduction Protein behavior, such as enzyme activity, is a function of the thermodynamic activity and
hydration of the macromolecule [Ng et al. 1990]. Thus, it is important to account for this non-
ideal behavior when modeling such systems [Ng et al. 1990]. Many studies of the kinetics and
equilibria of biochemical reactions have been done in dilute solutions, but as physiological
media normally have a high macromolecular content, these studies are not applicable in de-
scribing the same reactions in the crowded cellular environment [Ng et al. 1990]. It has been
suggested that the polymer poly(ethylene glycol) (PEG) is useful in such model studies of the
interaction mechanisms of water with hydrophilic surfaces and macromolecules due to its
unusual good solubility at high concentrations [Branca et al. 2002]. It is assumed that amphi-
philic symmetric triblock copolymers of PEG and poly(propylene glycol) (PPG) are also use-
ful in studies of the interaction mechanisms of water with macromolecules because of their
ability to assemble in microstructures that resemble micelles [Alexandridis and Hatton 1995].
As PPG is a constituent of these copolymers, it is also useful to study this polymer.
With regard to macromolecules/polymers the solution is expected to be non-ideal due to both
the large volume occupied by the polymer and specific water binding to the polymer. The
non-ideality of aqueous solutions can be investigated by measuring the water activity, aw,
which is given by [Atkins and de Paula 2006; Clement et al. 2004]
( )( ) RHTpTp
xaw
wwww === *γ (1)
where γw is the activity coefficient of water, xw is the mole fraction of water, pw (T) is the par-
tial vapor pressure of water at the temperature T, p*w (T) is the saturated vapor pressure of
water at the temperature T, and RH is the relative humidity above the solution. If the thermo-
dynamic properties of the solution are ideal, the activity of water equals the mole fraction, i.e.
γw = 1, and the measured effects are solely colligative [Blandamer et al. 2005].
It is seen from Equation 1 that at equilibrium the water activity of a solution is equal to the
relative humidity above the solution. As it is fairly easy to measure the relative humidity of
solutions, this enables one to conduct comprehensive studies of the water binding of polymer
solutions.
2
The aim of this thesis is to investigate the water binding in aqueous solutions of PEG, PPG
and amphiphilic symmetric triblock copolymers of PEG and PPG by water activity measure-
ments as function of temperature and concentration.
To fulfill the aim stated above it is necessary to gain knowledge about the properties of the
polymers in aqueous solution and how the water activity is expected to correlate with solution
temperature and polymer concentration. Furthermore, a theoretical study of the interpretation
of the water activity measurements is convenient.
3
2 Theory First, a description of the polymers and their properties will be given, followed by the theo-
retical aspects of the interpretation of the water activity measurements.
2.1 Poly(ethylene glycol)
PEG, also known as poly(ethylene oxide) (PEO) or poly(oxyethylene) (POE), is a synthetic
polyether of ethylene glycol. The polymers are identified by their average molecular weight,
e.g. PEG 200 for a polymer with an average molecular weight of 200 g/mol.
The PEG polymer has the general structure as shown in Figure 1, where the subscript n de-
notes the number of repeating units within the PEG molecule.
HOHO
n
Figure 1: General structure of a PEG molecule. The subscript n denotes the number of repeating units in the PEG molecule.
The PEG-water system is well-studied due to the remarkable solubility of the polymer in wa-
ter; actually it is soluble in all proportions at temperatures below the boiling point of water
[Branca et al. 2002]. One of the most pronounced characteristics is the clouding behavior, i.e.
the tendency for the polymer-water interactions to become less favorable with increasing
temperature [Almgren et al. 1995]. Numerous explanations have been given to account for
this behavior, and three will be discussed here [Almgren et al. 1995]. The first explanation is
based on the properties of water; it is suggested that the PEG molecule fits well into the water
lattice at room temperature. As the temperature is increased the water structure diminishes,
and the compatibility between PEG and water is reduced. This could explain why PPG is not
near as water soluble as PEG. But as the clouding behavior of PEG is observed in other polar
solvents as well, this theory does not seem valid. A second explanation states that hydrogen
bonding between the ether oxygen atoms of PEG and water stabilizes the PEG molecule. As
the temperature is increased, the hydrogen bonds are broken and the polymer-polymer attrac-
tions become more pronounced. But clouding of PEG has been observed in a very weakly
4
hydrogen bonding solvent (tert-butyl-acetate), which does not support this explanation. Fur-
thermore, if this hypothesis is correct, poly(methylene glycol) (PMG) should be water soluble
and exhibit clouding – which is not the case. A third model is based on the conformational
properties of the -OCCO- sequence in the polymer chain. It is suggested that the majority of
the possible conformations from rotation around the C-C bond are relatively non-polar,
whereas only two are strongly polar. These two conformations have the lowest energy and
interact most favorably with water. As the temperature is increased, the non-polar conforma-
tions are favored and will start to dominate the properties of the chain, which will make inter-
actions with water less favorable. 13C NMR studies have confirmed these non-polar confor-
mations to be favored at high temperatures. The theory has the advantage that it can explain
why PPG is water soluble (although to a lesser extent than PEG) and PMG is not; PMG does
not contain the -OCCO- sequence in the polymer chain.
The fact that the polymer-water interactions become less favorable with increasing tempera-
ture will also have an impact on the water activity of a solution of PEG. It has been shown by
Christiansen et al. [2007] that the water activity increases with increasing temperature and
decreasing concentration.
Another issue that has caught a lot of attention is the determination of the number of water
molecules bound to each monomeric unit of PEG. Studies by Makogon and Bondarenko
[1985], Ng et al. [1990] and Branca et al. [2002] show that approx 2 water molecules are
bound to every repeating unit at room temperature. Drying experiments of PEG performed by
Christiansen et al. [2007] indicates that the number of water molecules bound per monomeric
unit decreases with increasing temperature. This is in good agreement with the fact that the
polymer-water interactions become less favorable with increasing temperature, and that the
water activity of a PEG solution increases with increasing temperature.
2.2 Poly(propylene glycol)
PPG, also known as poly(propylene oxide) (PPO), is a synthetic polyether of propylene gly-
col. As with PEG the PPG polymers are identified by their average molecular weight, e.g.
PPG 1000 for a polymer with an average molecular weight of 1000 g/mol.
The PPG polymer has the general structure as shown in Figure 2, where the subscript n de-
notes the number of repeating units within the PPG molecule.
5
n
CH3
HOHO
Figure 2: General structure of a PPG molecule. The subscript n denotes the number of repeating units in the PPG molecule.
PPG has a remarkable lower solubility in water than PEG. This is explained by the fact that
the lower critical solution temperature is below the freezing point of water for high molecular
weight polymers, whereas it is above room temperature for low molecular weight polymers
[Almgren et al. 1995]. Figure 3 shows the temperature-concentration phase diagrams of PPG
1000 and PPG 2000 in water (data adapted from Weilby [2008] and Hvidt et al. [1994], re-
spectively). Below the solid lines the system is a one-phase system whereas a two-phase sys-
tem exists above the solid lines.
0
5
10
15
20
25
30
35
40
0 5 10 15 20 25Concentration [wt %]
Tem
pera
ture
[o C]
Figure 3: Temperature-concentration phase diagrams of PPG 1000 (-■-) and PPG 2000 (-▲-) in water. Below the solid lines the system is a one-phase system whereas a two-phase system exists above the solid lines. Adapted from Weilby [2008] (PPG 1000) and Hvidt et al. [1994] (PPG 2000).
6
As expected it is seen from Figure 3 that the higher molecular weight polymer PPG 2000
phase separates first as the temperature is increased. It has been shown that ΔH is positive and
ΔCp is negative for the phase separation of PPG and water [Hvidt et al. 2002]. As the phase
separation is spontaneous, it must be accompanied by a gain in entropy. This can be explained
by the breakdown of the ordered water lattice around the polymer, i.e. the PPG polymers are
dehydrated during the phase separation.
In analogy to PEG the water activity of a PPG solution is expected to increase with increasing
temperature and decreasing concentration, and above the cloud point it should be near unity as
the polymer-water interactions are reduced significantly.
2.3 PEO-PPO-PEO Copolymers
Water-soluble symmetric triblock copolymers of PEO and PPO, often denoted
(EO)x(PO)y(EO)x, are non-ionic macromolecular surface active agents that are available in a
range of molecular weights and PPO/PEO composition ratios. The surfactants are sold under
the commercial names Poloxamers (manufactured by ICI) and Pluronics (manufactured by
BASF) [Alexandridis and Hatton 1995]. In the Pluronic nomenclature the code for a polymer
is given by a letter and two or three numbers, e.g. Pluronic P85 or Pluronic L101. The letter
states the physical form of the copolymer at room temperature; L (liquid), P (paste) of F
(flakes). The fist number (or the first two numbers in a three digit code) multiplied by 300
indicates the approximate molecular weight of the PPO block, and the last number multiplied
by 10 gives the percentage weight fraction of PEO in the copolymer [Alexandridis and Hatton
1995].
The PEO-PPO-PEO triblock copolymers have the general structure as shown in Figure 4,
where the subscripts x and y denote the number of ethylene oxide and propylene oxide units,
respectively.
H
O
OOH
O
CH3
x xy
Figure 4: General structure of a PEO-PPO-PEO triblock copolymer. The subscripts x and y denote the number of ethylene oxide and propylene oxide units, respectively.
7
The most striking difference between the PEO-PPO-PEO triblock copolymers and the PEG
and PPG polymers is the ability of the copolymers to form micelles and gels. This gives a
more complex phase diagram as illustrated in Figure 5 where the temperature-concentration
phase diagram of Pluronic P85 is shown [Glatter et al. 1994].
0
10
20
30
40
50
60
70
80
90
100
0 5 10 15 20 25 30 35 40Concentration [wt %]
Tem
pera
ture
[o C]
Unimers
Spherical micelles & unimers
Spherical micelles
Cylindrical micelles
Clouding
Clouding
Hard gel
Figure 5: Temperature-concentration phase diagram of Pluronic P85. Adapted from Glatter et al. [1994].
At low temperature and concentration the copolymers are dissolved as unimers, but as the
temperature is increased micelles start to form as indicated by the lower solid line in Figure 5.
It is seen that the micellization occurs over a broad temperature interval between the lowest
two solid lines. The dotted line in between indicates the maximum in micelle formation rate.
Around 70 °C the shape of the micelles are changed as illustrated by the dashed line, and
eventually the copolymer will phase separate at high temperatures as depicted by the upper
solid line. At concentrations above 25 wt % the copolymer solution will form a hard gel when
heated. This hard gel will ‘dissolve’ again above 60 °C as indicated by the bold solid line.
8
The micellization of symmetric triblock copolymers of PEO and PPO is believed to be a sim-
ple equilibrium process of the form [Hvidt 1995]
n unimers micelle (2)
where n denotes the number of unimers per micelle. The micellization process is endothermic
(positive ΔH) and has a negative ΔCp [Hvidt et al. 2002]. Since the micelles are stable the
process must be characterized by a positive entropy change [Hvidt 1995]. From the equilib-
rium in Equation 2 it would be intuitively to predict a negative entropy change since micelles
are more ordered structures than free unimers. Simultaneous Differential Scanning Calo-
rimetry (DSC) studies of PEG 6000, PPG 2000 and Pluronic P94 have shown that PPG 2000
and Pluronic P94 undergo endothermic transitions (phase separation and micellization, re-
spectively) with very equal onset temperatures, while PEG 6000 does not show any transition
[Hvidt et al. 1994]. This gives the following explanation for the micellization process [Hvidt
et al. 1994; Hvidt 1995; Hvidt et al. 2002]: At low temperature and concentration the co-
polymers are dissolved as unimers, and both the PEO and PPO part is hydrated. As the tem-
perature is increased the PPO block becomes insoluble and undergoes a transition like it is
seen in the phase separation of a PPG solution. The PEO blocks do not undergo any transi-
tions but prevent the copolymer from phase separating by keeping the PPO block in solution
as micelles, i.e. the micelles consist of a core of PPO and a hydrated mantle of PEO. The posi-
tive enthalpy and entropy change along with the negative change in the heat capacity is ex-
plained as a breakdown of the structured water around the PPO block and/or removal of hy-
drated water from the PPO block.
As for both PEG and PPG the water activity of a solution of these triblock copolymers is ex-
pected to increase with increasing temperature and decreasing concentration. Especially at the
point of micellization, where the PPO core is dehydrated, it is expected that the water activity
will show a sharp increase. The magnitude of this increase is believed to correlate with the
enthalpy of micellization.
9
2.4 Interpretation of Water Activity Measurements
Two approaches will be used in interpreting the water activity measurements; the van’t Hoff
equation and the BET isotherm.
2.4.1 The van’t Hoff Equation
To interpret the water activity measurements it is necessary to study the equilibrium for water
in the system. Regardless of the type of polymer in solution there must be the following gen-
eral equilibrium considering the adsorption of water to the polymer
)(2 gOH )(2 adsOH (3)
where H2O(g) represents water vapor and H2O(ads) water adsorbed to the polymer. The equilib-
rium constant, K, is given by
pK 1= (4)
where p is the partial pressure of water. The van’t Hoff equation is then applied [Atkins and
de Paula 2006]
( ) RH
TdKd r
oΔ−=
/1ln (5)
where T is the temperature, R is the gas constant, and ΔrH0 is the standard reaction enthalpy.
By inserting Equation 4 in Equation 5 one obtain
( )( )
( ) RH
Tdpd
RH
Tdpd
ads
ads
Δ=
Δ−=
/1ln
/1/1ln
c (6)
10
where ΔHads is the reaction enthalpy of the reaction in Equation 3. From Equation 1 it is seen
that p = aw⋅p*, and by inserting this in Equation 6 one obtain
( )( )
( ) ( ) RH
Tdpd
Tdad
RH
Tdpad
adsw
adsw
Δ=+
Δ=
⋅
/1ln
/1ln
/1ln
*
*
c (7)
The term ( )Tdpd
/1ln *
in Equation 7 refers to the enthalpy of condensation of pure water, and
hence R
H adsΔ can be expanded as follows
( ) ( ) RH
RH
Tdpd
Tdad conexcessw Δ
+Δ
=+/1
ln/1
ln *
(8)
where ΔHexcess is the excess enthalpy, i.e. the extra energy associated with water binding, and
ΔHcon is the enthalpy of condensation of pure water (it has the same numerical value as the
enthalpy of vaporization but opposite sign). Hence, by plotting ln aw as function of 1/T it is
possible to find R
H excessΔ as the slope of a linear fit (assuming that ΔHexcess is temperature in-
dependent). The value of ΔHexcess will be negative as energy is released during adsorption.
If the solution is ideal Equation 7 should be written as
( ) ( ) RH
Tdpd
Tdxd adsw Δ
=+/1
ln/1
ln *
(9)
As the mole fraction of water does not depend on temperature the term ( )Tdxd w
/1ln
equals zero,
and there is no excess enthalpy regarding the condensation/vaporization of water.
11
2.4.2 The BET Isotherm
It is believed that the water activity measurements can be interpreted using a BET-like iso-
therm. The BET isotherm accounts for multilayer adsorption to a surface and is given by [At-
kins and de Paula 2006]
( ) ( ){ } *th wi111 p
pzzcz
czV
V
mon
=−−−
= (10)
where V is the total volume of adsorbed material, Vmon is the volume corresponding to
monolayer coverage, p is the vapor pressure, p* is the vapor pressure above a layer of adsor-
bate that is more than one molecule thick and which resembles a pure bulk liquid, and c is a
constant which is large when the enthalpy of desorption from a monolayer, ΔdesH0, is large
compared with the enthalpy of vaporization, ΔvapH0, of the liquid adsorbate
( ) RTHH ovap
odesec /Δ−Δ= (11)
Although the BET isotherm fits experimental data moderately well, it has the disadvantage
that it underestimates the extent of adsorption at low pressures and overestimates it at high
pressures [Atkins and de Paula 2006].
It is convenient to rewrite Equation 11 as proposed by Keiding and Pedersen [Unpublished
note]
( ) ( )( ) * re whe111 p
pRHRHkRH
RHkY
Y
mono
=⋅−+⋅−
⋅= (12)
where Y is the water content [kg water/kg solid], Ymono is the water content of the monolayer
[kg water/kg solid], k is a constant reflecting the same properties as c in Equation 10, and RH
is the relative humidity of the solution. If the function is inverted it gives the relative humidity
of a solution as function of the water content, hence as function of the concentration of poly-
mer. By fitting the isotherm to experimental data it is possible to determine Ymono and k. On
12
the basis of Ymono the number of water molecules per monomeric unit, ⎟⎟⎠
⎞⎜⎜⎝
⎛
monomerPEG
water
nn
, can be
calculated, and from the value of k the difference ΔdesH0 – ΔvapH0 can be estimated as seen in
Equation 11. This difference should be a measure of the extra energy needed to vaporize a
water molecule from the monolayer compared to a water molecule in the bulk liquid.
13
3 Materials and Methods Eight different PEG polymers with a broad molecular weight range and one PPG polymer
(Mw = 2000) was used. The Pluronic copolymers P85, F87 and F88 were selected because
PPG 2000 resembles the central PPO block (Mw ∼ 2400 g/mol) and PEG 1000, 3000 and 4000
resembles the PEO blocks. Furthermore, these specific copolymers are well described in the
literature.
The dry matter content of all stock reagents was determined, but besides this the polymers
were used as received.
Differential Scanning Calorimetry (DSC) was used to determine the critical micelle tempera-
ture (cmt) and the enthalpy of micellization of the Pluronic copolymers at different concentra-
tions to be able to identify the expected sharp increase in the water activity.
The relevant information of the applied polymers is listed in Table 1.
Table 1: Basic information about the applied polymers, including average composition, average molecular weight and supplier.
3.1 Determination of Dry Matter Content in Stock Reagents
To account for any water in the stock reagents the dry matter content was determined (dupli-
cate determination) [Dansk Standardiseringsråd 1980]. Aluminum weighing vessels were
dried in a furnace at 105 °C for two hours. Afterwards they were placed in a desiccator and
weighed, and an appropriate amount of stock reagent was added. The weighing vessels were
then dried in a furnace at 105 °C for at least 20 hours and finally weighed to determine the
water loss.
3.2 Preparation of Polymer Solutions
Solutions of PEG, PPG and Pluronic copolymers were prepared gravimetrically using distilled
water (ρ = 18.2 MΩ⋅cm), and the polymers were allowed to dissolve and mix at 5 °C with
gentle shaking for at least 15 hours. After the preparation they were kept at 5 °C. An overview
of the prepared polymer solutions is given in Table 2.
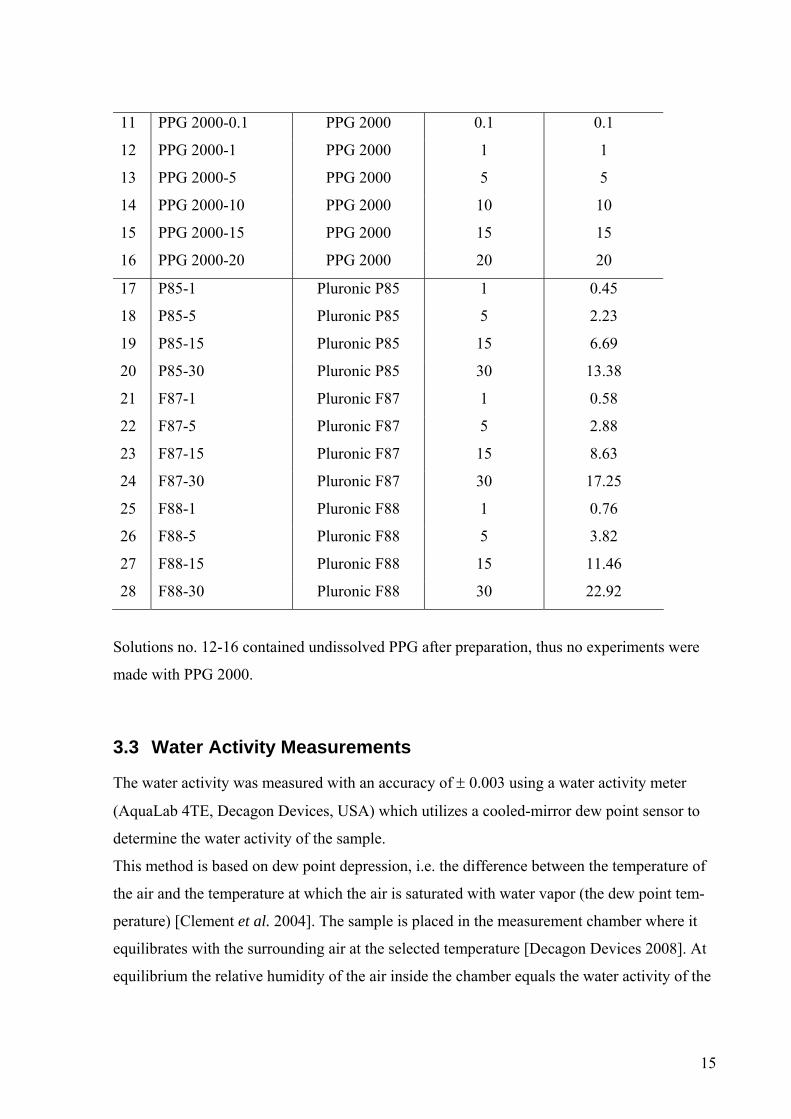
Table 2: Overview of the prepared polymer solutions. The nominal and corrected concentration refers to the fact that some solutions were prepared before the determination of dry matter content, i.e. the corrected concentration is the actual concentration of the solution. NB: The table continues on the next page.
No. Sample ID Reagent
Nominal
Concentration
[wt %]
Corrected
Concentration
[wt %]
1 PEG 200-40 PEG 200 N/A 40
2 PEG 200-60 PEG 200 N/A 60
3 PEG 400-40 PEG 400 N/A 40
4 PEG 600-40 PEG 600 N/A 40
5 PEG 1000-40 PEG 1000 N/A 40
6 PEG 2000-40 PEG 2000 N/A 40
7 PEG 2000-60 PEG 2000 N/A 60
8 PEG 3000-40 PEG 3000 N/A 40
9 PEG 4000-40 PEG 4000 N/A 40
10 PEG 8000-40 PEG 8000 N/A 40
15
11 PPG 2000-0.1 PPG 2000 0.1 0.1
12 PPG 2000-1 PPG 2000 1 1
13 PPG 2000-5 PPG 2000 5 5
14 PPG 2000-10 PPG 2000 10 10
15 PPG 2000-15 PPG 2000 15 15
16 PPG 2000-20 PPG 2000 20 20
17 P85-1 Pluronic P85 1 0.45
18 P85-5 Pluronic P85 5 2.23
19 P85-15 Pluronic P85 15 6.69
20 P85-30 Pluronic P85 30 13.38
21 F87-1 Pluronic F87 1 0.58
22 F87-5 Pluronic F87 5 2.88
23 F87-15 Pluronic F87 15 8.63
24 F87-30 Pluronic F87 30 17.25
25 F88-1 Pluronic F88 1 0.76
26 F88-5 Pluronic F88 5 3.82
27 F88-15 Pluronic F88 15 11.46
28 F88-30 Pluronic F88 30 22.92
Solutions no. 12-16 contained undissolved PPG after preparation, thus no experiments were
made with PPG 2000.
3.3 Water Activity Measurements
The water activity was measured with an accuracy of ± 0.003 using a water activity meter
(AquaLab 4TE, Decagon Devices, USA) which utilizes a cooled-mirror dew point sensor to
determine the water activity of the sample.
This method is based on dew point depression, i.e. the difference between the temperature of
the air and the temperature at which the air is saturated with water vapor (the dew point tem-
perature) [Clement et al. 2004]. The sample is placed in the measurement chamber where it
equilibrates with the surrounding air at the selected temperature [Decagon Devices 2008]. At
equilibrium the relative humidity of the air inside the chamber equals the water activity of the
16
sample. When measuring the air is cooled by a thermoelectric (Peltier) cooler, and the appear-
ance of water on the mirror is detected by a photoelectric cell [Decagon Devices 2008]. The
temperature at which condensation occurs (the dew point temperature) is recorded by a ther-
mocouple attached to the mirror [Decagon Devices 2008]. The sample temperature and the
dew point temperature are related to the relative humidity of the air, and hence the water ac-
tivity of the sample, through the Clausius-Clapeyron equation [Atkins and de Paula 2006]
⎟⎠⎞
⎜⎝⎛ −
Δ−
=*
11
*TTR
H vap
epp (13)
where p is the partial pressure at the temperature T, p* is the partial pressure at the tempera-
ture T*, ΔHvap is the enthalpy of vaporization (assumed temperature-independent) and R is the
gas constant. As wapp=* , the water activity of the sample is obtained directly from the dew
point depression ⎟⎠⎞
⎜⎝⎛ − *
11TT
, hence T is the sample temperature and T* is the dew point tem-
perature.
3.3.1 Water Activity as Function of Temperature
The water activity meter was placed in a climate room at 8 to10 °C as it had difficulties in
cooling the samples below ambient temperature when placed in the laboratory. 5 mL of sam-
ple was transferred to a sample cup and placed in the measurement chamber of the device.
The water activity was measured at 15 to 40 °C with 5 degrees interval. For sample no. 1, 3-6
and 8-10 three successive measurements were taken, and the mean value was used, while for
sample no. 17, 20, 21, 24, 25 and 28 the water activity was measured until a stable value was
obtained; defined as a change in ‘direction’ of the water activity over time. It was noticed that
for sample no. 1, 3-6 and 8-10 there was a general tendency for the water activity to increase
during the three successive measurements. All samples were weighed before and after the
experiment to account for vapor loss (∼ 1 %). Furthermore it was observed that sample no. 20,
24 and 28 had formed a gel at the end of the experiment.
17
3.3.2 Water Activity as Function of Water Content
The water activity meter was placed in the laboratory at ambient temperature. 3 mL of sample
was transferred to a sample cup and placed in the measurement chamber of the device. The
water activity of solutions no. 1, 2, 6, 7, 10 and the PEG 2000 stock reagent was measured
continuously at 50 °C until a constant value was obtained; defined as three successive meas-
urements that fluctuated no more than ± 0.0005 aw. During the measurements a general ten-
dency for the water activity to decrease towards this constant value was observed. Then 0.5
mL distilled water (ρ = 18.2 MΩ⋅cm) was added, and the procedure was repeated until maxi-
mum 3.5 mL water had been added. Before each addition of water the sample was weighed to
account for vapor loss.
The Solver Function in Microsoft Excel was used to fit the measured data with the inverse
function of Equation 12 by changing the values of k and Ymono.
3.4 Differential Scanning Calorimetry
DSC is the measurement of the change of the difference in the heat flow rate between a sam-
ple and a reference sample while they are subjected to a controlled temperature program
[Höhne et al. 2003]. The basic principle of this method is to heat/cool the sample and the ref-
erence at a desired rate. If the sample undergoes a phase transition, a differential temperature
signal is generated which is proportional to the difference between the heat flow rates to the
sample and reference. The differential temperature signal is then used to calculate the output
heat flow rate [Höhne et al. 2003].
It is necessary to calibrate the instrument with regard to onset temperature of the transition
and peak area which is done by the following procedure [Höhne et al. 2003]: At least two
calibration standards, covering the temperature interval of interest, are used. The standard is
measured at three different scanning rates, β, and the extrapolated peak onset temperature, Te,
is determined (defined as the intersection between the auxiliary line and the baseline). Then Te
is plotted as function of β and extrapolated to zero heating rate. This temperature, Te(β → 0),
is compared with the literature value of the transition temperature, and a temperature correc-
tion, ΔTcorr (β = 0), is established. This procedure is repeated for each standard, and ΔTcorr (β
= 0) is plotted as function of Te(β → 0). This curve will give the corrections to be applied to
18
the measured values Te(β → 0) of the samples. The peak area is calibrated by measuring on a
standard and comparing the measured area with the literature value of the heat of transition.
3.4.1 Determination of CMT and Enthalpy of Micellization
A Perkin Elmer DSC 7 scanning calorimeter connected to a Perkin Elmer Thermal Analysis
Controller, TAC 7/DX was used to study the heat capacity of solutions no. 17-28. Approx 30
mg of solution was placed in an aluminum pan which was sealed. Thermograms were ob-
tained in heating scans at different rates (10 to 80 °C/min) at temperatures between -10 and
100 °C with an empty aluminum pan as reference. A water bath (TopTech FP50-ME, Julabo
Labortechnik GmbH, Germany) set at -40 °C was used to cool the furnace, and the furnace
was purged with nitrogen gas. The melting point of water and gallium was used for tempera-
ture calibration while water was used for peak area calibration. The enthalpies of transitions
were calculated as the area of the peaks relative to the baseline, which was drawn as a straight
line between the baselines prior to and after the transition, using the Pyris Software from
Perkin Elmer.
19
4 Results In the first section the water activity measurements of PEG will be presented followed by a
section where the calorimetric data and water activity measurements of the PEO-PPO-PEO
triblock copolymers are presented. The data from the determination of dry matter content can
be found in Appendix A – Dry Matter Content of Stock Reagents. Furthermore, all data can
be found on the enclosed CD-ROM.
4.1 Poly(ethylene glycol)
4.1.1 Water Activity as Function of Temperature
Figure 6 shows the water activity as function of temperature for all 40 wt % PEG solutions
along with literature values for 40 wt % PEG 400 and 40 wt % PEG 8000 from Stanley and
Strey [2003].
0.8
0.82
0.84
0.86
0.88
0.9
0.92
0.94
0.96
0.98
1
0 5 10 15 20 25 30 35 40
Temperature [oC]
a w
Figure 6: Water activity as function of temperature for PEG 200-40 (■), PEG 400-40 (■), PEG 600-40 (■), PEG 1000-40 (■), PEG 2000-40 (■), PEG 3000-40 (■), PEG 4000-40 (■), PEG 8000-40 (■). Literature values from Stanley and Strey [2003] are given for 40 wt % PEG 400 (-▲-) and 40 wt % PEG 8000 (-▲-).
20
A general trend in Figure 6 is that the water activity increases with increasing temperature for
all 40 wt % PEG solutions. Additionally, it is seen that the water activity measurements of
PEG 200-40 lies significantly lower than the measurements of the remaining PEG solutions.
The water activity data of PEG 400-40 are in reasonable consistence with the values found in
the literature, while this is not the case for PEG 8000-40.
The ΔHexcess values are presented in Table 3 along with the standard deviation and literature
values from Stanley and Strey [2003] given in parentheses.
Table 3: Calculated values of ΔHexcess for the 40 wt % PEG solutions along with the standard deviation. Litera-ture values from Stanley and Strey [2003] are given in parentheses.
ΔHexcess
[J/mol]
PEG 200-40 -1380 ± 24
PEG 400-40 -779 ± 15 (-481 ± 30)
PEG 600-40 -719 ± 16
PEG 1000-40 -805 ± 13
PEG 2000-40 -774 ± 18
PEG 3000-40 -809 ± 18
PEG 4000-40 -911 ± 17
PEG 8000-40 -1016 ± 18 (-417 ± 27)
It is seen from Table 3 that PEG 200-40 has the largest value of ΔHexcess. Otherwise, there is
no correlation between the molecular weight of the PEG polymers and the ΔHexcess values.
In order to evaluate the data in Figure 6, other than from the literature values already given,
the water activity measurements for all 40 wt % PEG solutions at 20 °C are converted to os-
motic pressure, Π1. The osmotic pressure is then plotted against the molecular weight of the
PEG polymers as seen in Figure 7. Literature data from Money [1989] for solutions of 100,
200 and 300 g/L, i.e. approx 10, 20 and 30 wt %, respectively, are given for comparison.
1 w
m
aVRT ln−=Π , where Vm is the molar volume of water [Atkins and de Paula 2006].
Figure 7: Osmotic pressure as function of molecular weight for the 40 wt % PEG solutions at 20 °C (-■-). Lit-erature data from Money [1989] for solutions of 100 (-▲-), 200 (-▲-) and 300 g/L (-▲-), i.e. approx 10, 20 and 30 wt %, respectively, are given for comparison.
As indicated in Figure 7 the osmotic pressure of the 40 wt % solutions is higher than the os-
motic pressure data from the literature at all molecular weights. Below 2000 g/mol the os-
motic pressure has a tendency to increase with decreasing molecular weight, and the osmotic
pressure increases with increasing concentration at a specific molecular weight.
22
4.1.2 Water Activity as Function of Water Content
Figure 8 shows the water activity as function of water content at 50 °C for PEG 200 (PEG
200-40 and PEG 200-60) along with the fitted BET-isotherm.
Figure 9: Water activity as function of water content at 50 °C for PEG 2000 (PEG 2000-40 (■), PEG 2000-60 (▲) and the PEG 2000 stock reagent (●)) along with the fitted BET-isotherm (–).
From Figure 8 and Figure 9 it is seen that the water activity decreases with decreasing water
content, i.e. increasing polymer concentration. The values of k and Ymono obtained from the
modeling of the BET isotherm in Figure 8 and Figure 9 are given in Table 4 along with the
calculated values of ΔdesH0 – ΔvapH0 and ⎟⎟⎠
⎞⎜⎜⎝
⎛
monomerPEG
water
nn
.
Table 4: BET fitting parameters along with the derived values of ΔdesH0 – ΔvapH0 and the number of water mole-cules per PEG monomer.
k Ymono
[kg water/kg solid]
ΔdesH0 – ΔvapH0
[J/mol] monomerPEG
water
nn
PEG 200 1.75 0.11 1505 0.3
PEG 2000 2291 0.07 20776 0.18
24
It is seen from Table 4 that there is a large difference between the two k values, and hence a
large difference between the values of ΔdesH0 – ΔvapH0. The difference in Ymono, and hence
monomerPEG
water
nn
is less pronounced.
Figure 10 shows the water activity as function of water content at 50 °C for PEG 8000-40
along with two data sets from Christiansen et al. [2007] obtained by another method where a
sample of PEG 8000 is dried continuously at 50 °C. The data for PEG 8000-40 is not fitted
Figure 10: Water activity as function of water content at 50 °C for PEG 8000-40 (■) along with two data set (▲ and ●) from Christiansen et al. [2007] obtained by another method where a sample of PEG 8000 is dried con-tinuously at 50 °C.
It is clearly seen from Figure 10 that the data for PEG 8000-40 lies significantly higher than
the data from Christiansen et al. [2007]. The water activity of the literature data clearly de-
creases with decreasing water content, i.e. increasing polymer concentration.
25
4.2 PEO-PPO-PEO Copolymers
4.2.1 Determination of CMT and Enthalpy of Micellization
The extrapolated onset temperature of micellization as function of corrected concentration for
Pluronic P85, F87 and F88 is shown in Figure 11 along with literature values for Pluronic P85
and F88 from Alexandridis et al. [1994].
0
10
20
30
40
50
60
0 5 10 15 20 25Corrected Concentration [wt %]
T e [
o C]
Figure 11: Extrapolated onset temperature of micellization as function of corrected concentration for Pluronic P85 (-■-), F87 (-●-) and F88 (-▲-) along with literature values from Alexandridis et al. [1994] for P85 (■) and F88 (▲).
It is seen from Figure 11 that both the critical micelle concentration (cmc) and the critical
micelle temperature (cmt) increase in the order P85 < F87 < F88. The measured values for
P85 lie slightly below the corresponding literature values while the values for F88 fit quite
well.
26
The enthalpy of micellization as function of corrected concentration for Pluronic P85, F87
and F88 is presented in Figure 12.
0
2
4
6
8
10
12
14
0 5 10 15 20 25Corrected Concentration [wt %]
ΔH [J
/g s
olut
ion]
Figure 12: Enthalpy of micellization as function of corrected concentration for Pluronic P85 (■), F87 (●) and F88 (▲).
Figure 12 clearly indicates that at a given concentration the enthalpy of micellization in-
creases in the order F88 < F87 < P85.
27
4.2.2 Water Activity as Function of Temperature
Figure 13 depicts the water activity as function of temperature for P85-1 and P85-30. The
whiskers indicate the uncertainty of the water activity meter (± 0.003).
0.985
0.987
0.989
0.991
0.993
0.995
0.997
0.999
1.001
1.003
1.005
0 5 10 15 20 25 30 35 40
Temperature [oC]
a w
Figure 13: Water activity as function of temperature for P85-1 (■) and P85-30 (▲). The whiskers indicate the uncertainty of the water activity meter (± 0.003).
It is difficult to make any quantitative observations in Figure 13 as all measurements are
above a water activity of 0.995 with an uncertainty of ± 0.003, thus it is neither possible to
identify any sharp increase in the water activity at the cmt nor to determine ΔHexcess. However,
there is a tendency for the measurements of P85-1 to have a higher water activity than P85-30.
The data for F87-1, F87-30, F88-1 and F88-30 are very similar to those of P85-1 and P85-30
and are given in Appendix B – aw Data for Pluronic F87 and F88.
28
29
5 Discussion In this chapter the results are discussed and compared with the theory, and the methods are
evaluated. The discussion is divided into sections according to the applied methods.
5.1 Water Activity Measurements
5.1.1 Water Activity as Function of Temperature
The comprehensive study of the water activity as function of temperature of 40 wt % solu-
tions of eight different PEG’s clearly demonstrates that the water activity increases with in-
creasing temperature (Figure 6). This agrees well with the fact that the polymer-water interac-
tions become less favorable, i.e. that water becomes a poorer solvent for PEG, with increasing
temperature. However, it is seen from Figure 6 that the water activity measurements of PEG
8000-40 are lower than the literature values. An explanation to this could be that the reaction
given in Equation 3 has had insufficient time to come to equilibrium. The samples were stored
at 5 °C and the initial measurements in the water activity meter were done at 15 °C. This tem-
perature change definitely causes the water activity of the sample to increase, but for the 40
wt. % PEG samples only three successive measurements were taken before the temperature
was raised. Hence, the timescale for the sample to reach equilibrium is only 10 to 15 minutes
at each temperature. This hypothesis is supported by the fact that the water activity measure-
ments have a tendency to increase during these three successive measurements at each tem-
perature, and by the fact that the measured values of both PEG 400-40 and PEG 8000-40 ap-
proach the literature values as the temperature is increased (see Figure 6). The former indi-
cates that the water activity is increasing towards a constant value that is not reached, and the
latter suggest that the equilibrium time decreases with increasing temperature. For PEG 8000-
40 in particular it was observed that the sample was very viscous which could explain a long
equilibrium time. To evaluate the measurements of the 40 wt % PEG solutions further the
water activity data at 20 °C are converted to osmotic pressure and compared with literature
values (see Figure 7). As expected the 40 wt % solutions have a higher osmotic pressure, i.e. a
lower water activity, than the solutions of 10, 20 and 30 wt %. If the 40 wt % solutions should
exhibit the same interrelationship as the solutions of 10, 20 and 30 wt %, it seems that the
level of the measurements of the 40 wt % solutions is too high, especially for PEG 200 and
30
PEG 8000. Hence, the water activity measurements for the 40 wt % PEG solutions as function
of temperature (Figure 6) are too low; in particular the measurements of PEG 200-40 and
PEG 8000-40. The fact that the water activity measurements for the 40 wt % PEG solutions
are too low due to insufficient equilibrium time, especially at low temperatures, has an impact
on the derived ΔHexcess values (Table 3). As seen from the two reference values given for 40
wt % PEG 400 and 40 wt % PEG 8000, the calculated values are too high.
The water activity measurements as function of temperature for the Pluronic copolymers are
too close to 1 to distinguish them from one another (see Figure 13 and Appendix B – aw Data
for Pluronic F87 and F88). Hence, it is not possible to identify any increase in water activity
as a consequence of the micellization process. The reason that the water activity measure-
ments are so close to 1 must be that the concentration of the copolymer solutions is too low.
For P85-30, F87-30 and F88-30 it is also possible that the water activity is close to 1 because
micellization already occurs below 15 °C as indicated in Figure 11. At high water activities it
will be more convenient to measure the osmotic pressure of the solution as the accuracy is
improved significantly, e.g. the osmotic pressure (at 25 °C) corresponding to a water activity
of 0.995 is 6.81 atm while it is 1.36 atm for a water activity of 0.999.
It was observed that the samples P85-30, F87-30 and F88-30 had formed a gel at the end of
the water activity experiments (45 °C). Considering the corrected concentration of P85-30
(13.4 wt %) this does not correspond to the phase diagram given in Figure 5 which states that
a gel is not formed at a concentration below 25 wt %. However, Brown et al. [1991] have
performed oscillatory shear measurements on Pluronic P85 that shows gelation in the concen-
tration range 3 - 40 wt %. At 13.4 wt % the gelation temperature is reported to be approx 40-
45 °C.
5.1.2 Water Activity as Function of Water Content
Water activity measurements as function of water content were done at 50 °C on PEG 200,
PEG 2000 and PEG 8000, see Figure 8, Figure 9 and Figure 10, respectively. As expected the
water activity decreases with decreasing water content. For PEG 200 it is seen that the two
data points with the lowest water content for the PEG 200-40 series differ from the data points
of the PEG 200-60 series. This is believed to be due to insufficient equilibrium time, although
the equilibrium time in these experiments were significantly longer (hours) compared to the
31
experiments where the water activity was measured as function of temperature (10-15 min-
utes). The lack of data points at low water contents has a great impact on the shape of the
BET isotherm, and hence the values of k and Ymono. Thus it is difficult to conclude anything
about the ΔdesH0 – ΔvapH0 values (Table 4) for PEG 200 and PEG 2000, although it seems im-
plausible that the desorption energy is 21 kJ higher than the energy of vaporization of pure
water. The number of water molecules per PEG monomer for both PEG 200 and PEG 2000,
0.3 and 0.18, respectively, is below 2 which is the expected value at room temperature. This
agrees well with the fact that the water-polymer interactions become less pronounced with
increasing temperature, i.e. the polymer is less hydrated at higher temperatures. Christiansen
et al. [2007] found that the number of water molecules per PEG monomer is 0.7 for PEG
8000 at 50 °C which is higher than the values found for PEG 200 and PEG 2000.
The data for PEG 8000-40 (Figure 10) is not fitted with the BET isotherm due to lack of data
points. Instead the data is compared with data from Christiansen et al. [2007] who has con-
ducted drying experiments on PEG 8000. The literature data clearly shows a decrease in water
activity with decreasing water content as expected. However, it is seen that the data for PEG
8000-40 does not fit the literature data. This is believed to be due to the differences between
the two methods used to obtain the data. The method of Christiansen et al. [2007] is based on
continuous drying of a PEG solution at constant temperature, while the method used in this
thesis is based on stepwise addition of water to a PEG solution. The former method has the
disadvantage that the equilibrium between water in the sample and in the air is disrupted con-
stantly due to the continuous drying. Hence, the relative humidity of the air above the sample
is too low. The method used in this thesis has the disadvantage that the system is disturbed
every time water is added, but if the system is given sufficient time to equilibrate reliable val-
ues should be achieved.
5.2 Differential Scanning Calorimetry
As expected the data shows that the cmc and cmt increases in the order P85 < F87 < F88
(Figure 11), i.e. the values are shifted towards higher concentration/temperature the more hy-
drophilic the copolymer is. At a given concentration the enthalpy of micellization increases in
the order F88 < F87 < P85 (Figure 12) as the number of copolymers, hence the number of
PPO blocks, in solution increases with decreasing molecular weight of the copolymer.
32
33
6 Conclusion Solutions of PEG and symmetric triblock copolymers of PEG and PPG were prepared at dif-
ferent concentrations and studied by water activity measurements as function of temperature
and concentration. Additionally, the symmetric triblock copolymers of PEG and PPG were
studied by DSC measurements.
The water activity measurements as function of temperature for the PEG solutions show that
the water activity increases with increasing temperature, i.e. water becomes a poorer solvent
with increasing temperature, giving excess enthalpies in the range -719 to -1380 J/mol. These
excess enthalpies are too large due to insufficient equilibrium time in the system. The water
activity measurements as function of concentration for the PEG solutions show that the water
activity increases with decreasing concentration, but fitting with the BET isotherm is prob-
lematical due to lack of data points, especially at low water contents. The water activity meas-
urements as function of temperature for the symmetric triblock copolymers of PEG and PPG
are all above 0.995 and impossible to distinguish due to the uncertainty of the water activity
meter. The DSC measurements of the symmetric triblock copolymers of PEG and PPG show
that both the cmt and cmc increase in the order P85 < F87 < F88 and that the enthalpy of mi-
cellization at a given concentration increases in the order F88 < F87 < P85.
34
35
7 References Alexandridis, P. and Hatton, T.A., 1995. Poly(ethylene oxide)-poly(propylene oxide)-
poly(ethylene oxide) block copolymer surfactants in aqueous solutions and at interfaces:
thermodynamics, structure, dynamics, and modeling. Colloids and Surfaces A: Physicochemi-
cal and Engineering Aspects, 96, 1-46.
Alexandridis, P., Holzwarth, J.F. and Hatton, T.A, 1994. Micellization of Poly(ethy1ene ox-
ide)-Poly(propy1ene oxide)-Poly(ethy1ene oxide) Triblock Copolymers in Aqueous Solu-
tions: Thermodynamics of Copolymer Association. Macromolecules, 27, 2414-2425.
Almgren, M., Brown, W. and Hvidt, S., 1995. Self-aggregation and phase behavior of
poly(ethylene oxide)-poly(propylene oxide)-poly(ethylene oxide) block copolymers in aque-
ous solution. Colloid and Polymer Science, 273, 2-15.
Atkins, P. and de Paula, J., 2006. Atkins’ Physical Chemistry. 8th ed. Oxford: Oxford Univer-
sity Press.
Blandamer, M.J., Engberts, J.B.F.N., Gleesonc, P.T. and Rei, J.C.R., 2005. Activity of water
in aqueous systems; A frequently neglected property. Chemical Society Reviews, 34, 440-458.
Branca, C., Magazù, S., Maisano, G., Migliardo, F., Migliardo, P. and Romeo, G., 2002. Hy-
dration Study of PEG/Water Mixtures by Quasi Elastic Light Scattering, Acoustic and
Rheological Measurements. Journal of Physical Chemistry B, 106, 10272-10276.
Brown, W., Schillén, K., Almgren, M., Hvidt, S. and Bahadur, P., 1991. Micelle and Gel
Formation in a Poly(ethylene oxide)/Poly(propylene oxide)/Poly(ethylene oxide) Triblock
Copolymer in Water Solution. Dynamic and Static Light Scattering and Oscillatory Shear
Measurements. Journal of Physical Chemistry, 95, 1850-1858.
36
Christiansen, K.S., Jørgensen, M.K. and Stoltze, A.S., 2007. Determination of Water Activity
in Poly(styrene-co-acrylic acid) Suspensions and Polyethylene Glycol Solutions by Relative
Stanley, C.B. and Strey, H.H., 2003. Measuring Osmotic Pressure of Poly(ethylene glycol)
Solutions by Sedimentation Equilibrium Ultracentrifugation. Macromolecules, 36, 6888-6893.
Weilby, L., 2008. Phase equilibrium of the Polypropylene oxide – water system. Thesis,
(Ph.D.). Roskilde University.
38
39
8 Appendix A – Dry Matter Content of Stock Reagents The results from the dry matter determination of the stock reagents are given in Table 5 along
with the standard deviation.
Table 5: Average dry matter content of the stock reagents along with the standard deviation.
Average Dry Matter Content
[wt %]
PEG 200 71.7 ± 1.5
PEG 400 92.0 ± 1.5
PEG 600 94.9 ± 0.5
PEG 1000 91.1 ± 1.0
PEG 2000 91.5 ± 0.1
PEG 3000 89.9 ± 0.6
PEG 4000 87.3 ± 0.1
PEG 8000 83.5 ± 0.6
PPG 2000 99.8 ± 0.1
Pluronic P85 44.6 ± 18.2
Pluronic F87 57.5 ± 3.8
Pluronic F88 76.4 ± 0.7
It is noticed that the standard deviation for Pluronic P85 is relatively high.
40
41
9 Appendix B – aw Data for Pluronic F87 and F88 Figure 14 shows the water activity as function of temperature for F87-1 and F87-30. The
whiskers indicate the uncertainty of the water activity meter (± 0.003).
0.985
0.987
0.989
0.991
0.993
0.995
0.997
0.999
1.001
1.003
1.005
0 5 10 15 20 25 30 35 40Temperature [oC]
a w
Figure 14: Water activity as function of temperature for F87-1 (■) and F87-30 (▲). The whiskers indicate the uncertainty of the water activity meter (± 0.003).
42
Figure 15 shows the water activity as function of temperature for F88-1 and F88-30. The
whiskers indicate the uncertainty of the water activity meter (± 0.003).
0.985
0.987
0.989
0.991
0.993
0.995
0.997
0.999
1.001
1.003
1.005
0 5 10 15 20 25 30 35 40Temperature [oC]
a w
Figure 15: Water activity as function of temperature for F88-1 (■) and F88-30 (▲). The whiskers indicate the uncertainty of the water activity meter (± 0.003).