Investigation of water diffusion mechanisms in relation to polymer relaxations in polyamides Florentina-Maria Preda, † Angel Alegr´ ıa, ‡ Anthony Bocahut, ¶ Louise-Anne Fillot, † Didier R. Long, † and Paul Sotta *,† Laboratoire Polym` eres et Mat´ eriaux Avanc´ es, CNRS/Solvay, UMR5268, Axel’One, 87 avenue des Fr` eres Perret, 69192 Saint Fons Cedex, France, Centro de Fisica de Materiales, P. Manuel de Lardizabal 5, E-20018 San Sebastian, Spain, and Advanced Polymers and Materials Department, Solvay, UMR5268, Axel’One, 87 avenue des Fr` eres Perret, 69192 Saint Fons Cedex, France E-mail: [email protected]July 27, 2015 Abstract Diffusion in semi-crystalline polymers is a complex phenomenon because of the existence of specific interactions (non-polar or polar), dynamic heterogeneities and crystalline phases. The diffusion of water in two semi-crystalline polyamide (PA6,6 and PA6,10) was investigated in order to determine the diffusion mechanisms and the influence of polymer relaxations on this process. Liquid water diffusion follows a Fickian mechanism in PA6,10 and a non-Fickian or anomalous mechanism in PA6,6. * To whom correspondence should be addressed † Laboratoire Polym` eres et Mat´ eriaux Avanc´ es, CNRS/Solvay, UMR5268, Axel’One, 87 avenue des Fr` eres Perret, 69192 Saint Fons Cedex, France ‡ Centro de Fisica de Materiales, P. Manuel de Lardizabal 5, E-20018 San Sebastian, Spain ¶ Advanced Polymers and Materials Department, Solvay, UMR5268, Axel’One, 87 avenue des Fr` eres Perret, 69192 Saint Fons Cedex, France 1
Transcript
Investigation of water diffusion mechanisms in
relation to polymer relaxations in polyamides
Florentina-Maria Preda,† Angel Alegrıa,‡ Anthony Bocahut,¶ Louise-Anne
Fillot,† Didier R. Long,† and Paul Sotta∗,†
Laboratoire Polymeres et Materiaux Avances, CNRS/Solvay, UMR5268, Axel’One, 87
avenue des Freres Perret, 69192 Saint Fons Cedex, France, Centro de Fisica de Materiales,
P. Manuel de Lardizabal 5, E-20018 San Sebastian, Spain, and Advanced Polymers and
Diffusion in semi-crystalline polymers is a complex phenomenon because of the
existence of specific interactions (non-polar or polar), dynamic heterogeneities and
crystalline phases. The diffusion of water in two semi-crystalline polyamide (PA6,6
and PA6,10) was investigated in order to determine the diffusion mechanisms and
the influence of polymer relaxations on this process. Liquid water diffusion follows a
Fickian mechanism in PA6,10 and a non-Fickian or anomalous mechanism in PA6,6.
∗To whom correspondence should be addressed†Laboratoire Polymeres et Materiaux Avances, CNRS/Solvay, UMR5268, Axel’One, 87 avenue des Freres
Perret, 69192 Saint Fons Cedex, France‡Centro de Fisica de Materiales, P. Manuel de Lardizabal 5, E-20018 San Sebastian, Spain¶Advanced Polymers and Materials Department, Solvay, UMR5268, Axel’One, 87 avenue des Freres
Perret, 69192 Saint Fons Cedex, France
1
Through a quasi-equilibrium experiment in Dynamic Vapor Sorption, it is shown that
this difference results from the dependence of the diffusion coefficients on water concen-
tration. Moreover, the influence of the polymer relaxations was assessed by Broadband
Dielectric Spectroscopy. The dielectric characteristic relaxation times of the α relax-
ation, associated to the glass transition, and of the β relaxation, related to more local
dynamics, have been measured. A simple comparison with the timescale of diffusion
suggests that diffusion and polyamide α relaxation should not be directly correlated.
However, diffusion is correlated to the secondary β relaxation, which encompasses the
local chain dynamics of hydrogen bonded amide groups in the presence of water. A
mechanism of diffusion based on the trapping of water molecules between neighboring
sorption sites (amide groups) is proposed in these strongly interacting polymers. It is
suggested that diffusion is limited by the relaxation time of hydrogen bonds between
water molecules and amide groups and the change in conformation of these amide
groups present in polyamides.
1 Introduction
Polyamides are a family of semi-crystalline thermoplastic polymers widely employed in the
automotive industry due to its excellent thermal stability and mechanical properties. How-
ever, polyamide can be significantly affected by the absorption of low molecular weight
penetrants1 like water from the air humidity or ethanol in biofuels. Water sorption is ac-
companied by a large decrease in the glass transition temperature,2,3 which strongly affects
mechanical properties.1 The rate of sorption and amount of absorbed water depend on the
mechanisms of interaction between water and polyamide, along with sorption and diffusion
mechanisms. Therefore, these aspects have been intensively studied in the literature.2–13 It
is generally accepted that water interacts with amide groups to replace the initial hydro-
gen bonds between them.4,6,10,14 It has been proposed that several water populations exist
(tightly and loosely bound water) and that water molecules organize in clusters beyond a
2
certain solvent uptake.5,7
Diffusion and sorption of solvents in polymers can be very complex because of the exis-
tence of specific interactions (non-polar or polar), dynamic heterogeneities in the amorphous
phase, modification of the polymer dynamics induced by the solvents and different crystalline
phases. In polyamide/water systems, all of these factors have to be taken into account. To
begin with, water interacts strongly with amide groups and leads to the decrease of the
glass transition temperature, or plasticization of the amorphous phase, i.e. an increase in
the mobility of the polymer chains.15 Secondly, although the crystalline phase is considered
impermeable to the solvent,16,17 its existence induces a gradient of mobility in the amorphous
phase, which has often been depicted as a Rigid Amorphous Fraction.18 As a consequence,
the whole amorphous phase may not be equally accessible to solvents. Indeed, a large number
of studies have been dedicated to elucidating the accessibility of the amorphous phase. While
it was estimated that roughly one third of the amorphous phase is in the interlamellar space
and two thirds outside the lamellar stacks19, water was found to diffuse in all amorphous
regions.16 Water molecules in the interlamellar regions are thought to be tightly bounded.20
Differences in the mobility of the amorphous phase have been studied by NMR.21–23
It was found that water diffuses preferentially in the soft amorphous phase, which is then
plasticized by the water molecules.
Previous literature studies have been focused on sorption or diffusion experiments of water
in dry polyamide at a certain activity. The diffusion mechanisms are either Fickian3 or non-
Fickian,11 depending on the polymer characteristics and on processing conditions. In one
of the most complete studies on water diffusion in polyamide, Lim et al2 have determined
that diffusion coefficients increase as a function of water activity and temperature. Each
measurement was done with a dry polyamide as a starting material, which means that water
diffuses in a polymer matrix gradually plasticized, subject to swelling and probably with a
gradient in water concentration.
Spatially resolved water uptake was studied quantitatively by NMR imaging.24–28 Recent
3
studies have also shown that a plasticization lag exists, meaning that a few percentages of
water were absorbed in the material before plasticization was visible.28
Thus, it would be interesting to study if there is a correlation between penetrant dif-
fusion and the mobility of the polymer chains due to amorphous phase heterogeneity or
plasticization. To our knowledge, no previous study has investigated the correlation be-
tween the diffusion coefficient and the polymer relaxations (main α relaxation and more
local, secondary relaxations) in polyamides.
In order to decouple polymer relaxations and water diffusion, we have adopted a step-by-
step experiment by using Dynamic Vapor Sorption (DVS). In DVS experiments, a polymer
film can be kept through small activity steps from 0.1 to 0.9 so that the polymer reaches
equilibrium at each step at water activity a before the next sorption experiment is launched at
activity a+∆a. Therefore, the system should stay close to thermodynamic equilibrium when
a new water population diffuses. If the activity steps are sufficiently small, diffusion occurs
in a homogeneously relaxing environment, with limited swelling and a relatively constant
water concentration. in this way, we might thus isolate diffusion and polymer relaxations
from other phenomena and test the correlation between these two processes.
The objective of this study is to investigate the relationship between water diffusion and
the various relaxation processes in polyamides. For this, we have measured water diffusion
coefficients and the polymer relaxation times as a function of water activity. Two different
polyamides with slightly different ratios of amide/methylene groups (PA6,6 and PA6,10),
obtained with different processing conditions, have been studied. The main purpose is to
understand diffusion mechanisms, in particular whether or not diffusion is coupled to polymer
relaxation. The influence of the ratio of amide/methylene groups, i.e. the density of hydrogen
bonds, is tentatively discussed.
4
2 Materials and methods
2.1 Materials
PA6,6 and PA6,10 pellets were provided by Solvay and contained no stabilizers or fillers.
PA6,6 films 100 µm thick were obtained by film-cast extrusion. PA6,10 plates 0.8×100×100
mm were obtained by injection-molding with a DEMAG H200-80T press. The plates were
thinned at 300 µm using a planer.
Prior to all experiments, the films were dried for 24h at 110◦C for PA6,6 and 80◦C for
PA6,10. The films were introduced in thermo-sealed envelopes and kept in a desiccator
to avoid any contact with air moisture. The characteristics of each film, measured after
drying, are: PA6,6 100 µm: glass transition temperature Tg = 64 ± 2◦C, melting point
Tm = 261± 2◦C, crystallinity ratio χc = 38 %, number average molecular weight Mn = 25000
g/mol and polydispersity PI ' 2 (SEC, absolute value, method of N-trifluoroacetylation29);
PA6,10 300 µm: glass transition temperature Tg = 53± 2◦C, melting point Tm = 222± 2◦C,
crystallinity ratio χc = 23 %, number average molecular weight Mn = 37000 g/mol and
polydispersity PI ' 2 (SEC, absolute value, method of N-trifluoroacetylation29).
2.2 Sorption experiments
Polymer films were immersed in liquid water and removed regularly for weighing following
a standard procedure: removal from sorption cell, pressing between absorbent paper, sur-
face drying with compressed air, record of weight exactly at 1 minute after removal from
sorption cell, re-immersion. The mass intake is recorded as a function of immersion time.
Measurements were done at the following temperatures: 25, 40 and 55°C.
For film conditioning at activity 0.5, the films was kept in a humidity-conditioned labo-
ratory. For film conditioning at activities 0.75 and 0.84, saturated salt solutions (NaCl, KCl)
were used at room temperature (20°C). The humidity in the atmosphere above a saturated
salt solution is tabulated in the literature30 as a function of temperature. The saturated
5
salt solution was placed at the bottom of a desiccator. The polymer film was left several
days above the saturated salt solution in the closed desiccator until sorption equilibrium
was reached. The conditioned films were used for Differential Scanning Calorimetry and
Broadband Dielectric Spectroscopy measurements.
No change in the crystalline fraction was observed by DSC after sorption experiments.
The crystalline structure was checked by X ray diffracton in the reference and water saturated
samples (a = 0.3, 0.7 and 1). Both polyamides have an α crystalline lattice. In water
saturated samples, Bragg peaks characteristic of the α crystalline lattice are better resolved,
with an increased angular spacing of the two main peaks (100) and (010)/(110), which
indicates a change towards a more perfect crystalline phase in the presence of water. This
evolution of the crystalline structure during long time sorption experiments has already
been reported16,31. In order to check the possible impact of this evolution on diffusion
and equilibrium sorption, liquid water-saturated films were dried and then re-immersed in
liquid water. The new curves of mass uptake superimpose perfectly to the initial ones up
to equilibrium values, meaning that the crystalline transformation does not impact diffusion
kinetics or equilibrium sorption.
2.3 Dynamic Vapor Sorption (DVS)
A DVS Advantage device was used for the sorption of water vapor at controlled activity (a =
P/Psat). The DVS Advantage Analyzer regulates the pressure inside the sample chamber and
an internal microbalance measures the mass uptake of the polymer film. Before sorption at
temperature T, the dried films were exposed to a dry nitrogen flow at T until their weight was
stable. Activity steps of 0.1 were then applied in the range of 0.1 to 0.9. Each activity was
maintained for 2 days to ensure that the sorption equilibrium was reached. After 2 days at
activity a, the device sets the next activity a+0.1 almost instantaneously (equilibration time
of new activity is shorter than 1 minute)and a new mass intake is recorded. Measurements
were done at 29, 35, 40 and 51°C for PA6,6 and 29, 40 and 51°C for PA6,10. For the two
6
polymers, measurements at 51°C stopped at activity 0.4 for PA6,6 and activity 0.6 for PA6,10
because the experimental temperature was too close to the limit of the machine (60°C).
2.4 Differential Scanning Calorimetry (DSC)
A TA Instruments DSC Q2000 was used in the standard mode (ramp 10°C/min) to determine
the melting point and the crystalline ratio and in the modulated mode (MDSC) to determine
the glass transition temperature Tg of pristine and water equilibrated polymer. MDSC was
essential to this study because the glass transition of polyamide films could not be clearly
determined in standard mode, as is sometimes the case in polyamides. A Liquid Nitrogen
Cooling System (LNCS) was used with a Helium flow (25 ml/min) to have access to very low
temperatures (down to−180◦C). Samples (between 7 and 15 mg) were placed in non-hermetic
aluminium pans and heated between −150 and 150◦C at a heating rate of 3◦C/min with a
temperature modulation of ±2◦C every 60 s. The water-swollen samples were transferred
rapidly between the sorption cell and the DSC pans in order to limit solvent evaporation.
The glass transition temperature was determined as the mid-height or inflexion point in the
reversible heat flow.
2.5 Dielectric Spectroscopy
Three main relaxation processes due to rotational fluctuations of the molecular dipoles have
been identified in polyamides.32 A highest frequency, the γ relaxation is generally attributed
to very fast rotation of the aliphatic sequences. These very local motions are internal to
the monomer. The β relaxation is generally attributed to the motion of the amide group
dipoles, while the α relaxation is related to larger scale motions associated to the glass
transition. Motions involved in the β and α relaxations may potentially be coupled to or
influenced by the motions of water molecules.13,33–35 We thus focus here on these processes.
The corresponding relaxation times have been measured by dielectric spectroscopy as a
function of temperature and at various water activities.
7
In dielectric spectroscopy, relaxation processes can be identified through the variations
of the frequency dependent complex permittivity ε∗dielec(ω), or equivalently complex modu-
lus M∗dielec(ω) or complex conductivity σ∗(ω). In addition to dipole reorientations, charge
transport and interfacial polarization effects take place. The α relaxation time τα is often
difficult to measure in polyamides because it is accompanied by a strong increase of the
sample conductivity. Other phenomena (electrode polarization, Maxwell-Wagner-Sillars po-
larization36) can also have a contribution (visible above the α peak on the high temperature
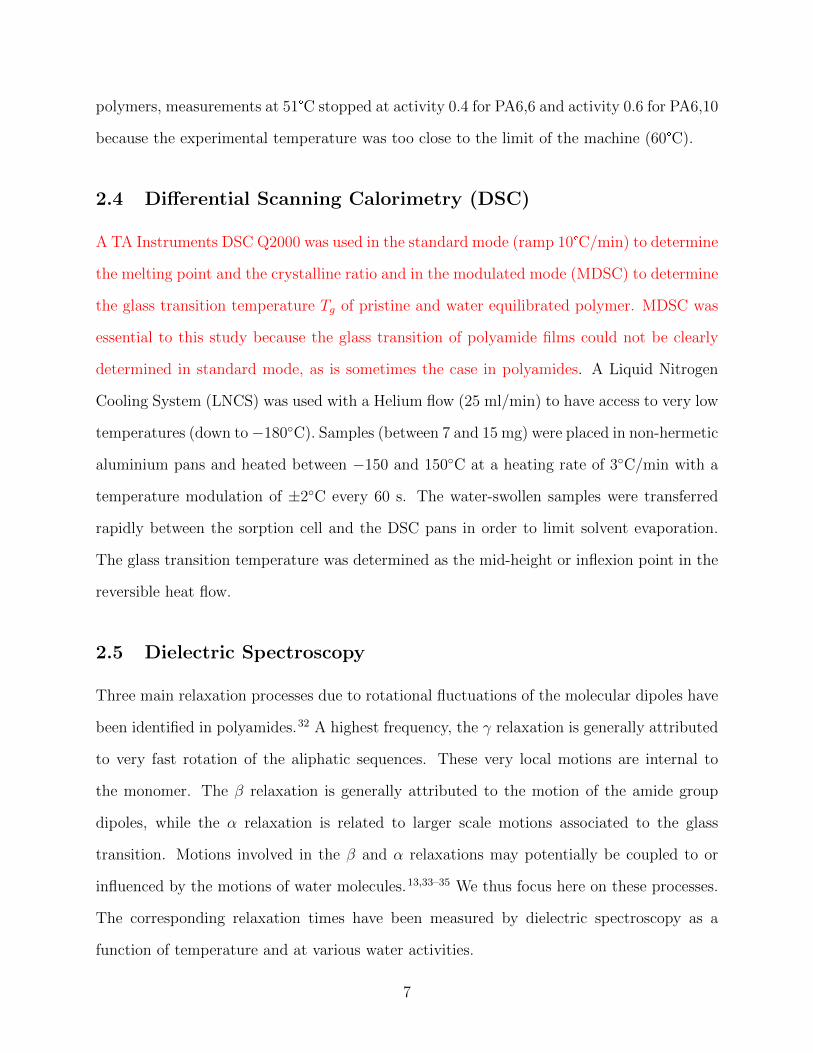
side in Figure 1). τα was determined by using the maximum of the loss permittivity and/or
the loss modulus in isochronal curves (Figure 1). Although this method may seem less pre-
cise than fitting the relaxation curves in isothermal representation, it was preferred because
it provides relaxation times over a larger temperature range. When both isochronal and
isothermal representations could be used, it was checked that the data coincide. The loss
modulus representation is less sensitive to contributions from sample conductivity and gives
a well-defined peak. The values obtained from the loss modulus are shifted with respect to
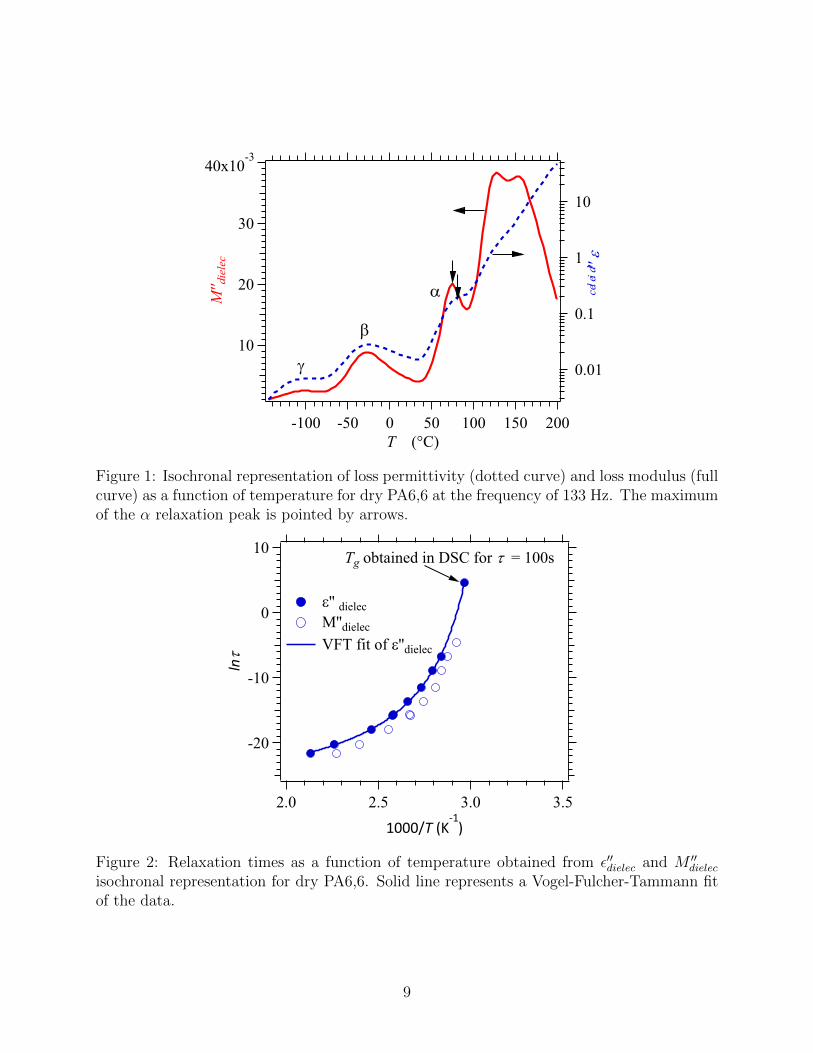
the values obtained from the loss permittivity but allow a verification of the latter. A typical
curve of obtained τα is shown in Figure 2. As it can be seen, the two curves are roughly
parallel but shifted in frequency.
The variation of the α relaxation times in polymers generally follows a Vogel-Fulcher-
Tammann (VFT)37–39 temperature dependence (equation (1)):
τ(T ) = τ0 exp
(AV FTT − T0
)(1)
where τ is the relaxation time, τ0 the relaxation time in the high temperature limit, AV FT
is a constant and T0 denotes the Vogel temperature, generally found to be 30− 70 K below
the glass transition temperature Tg.36
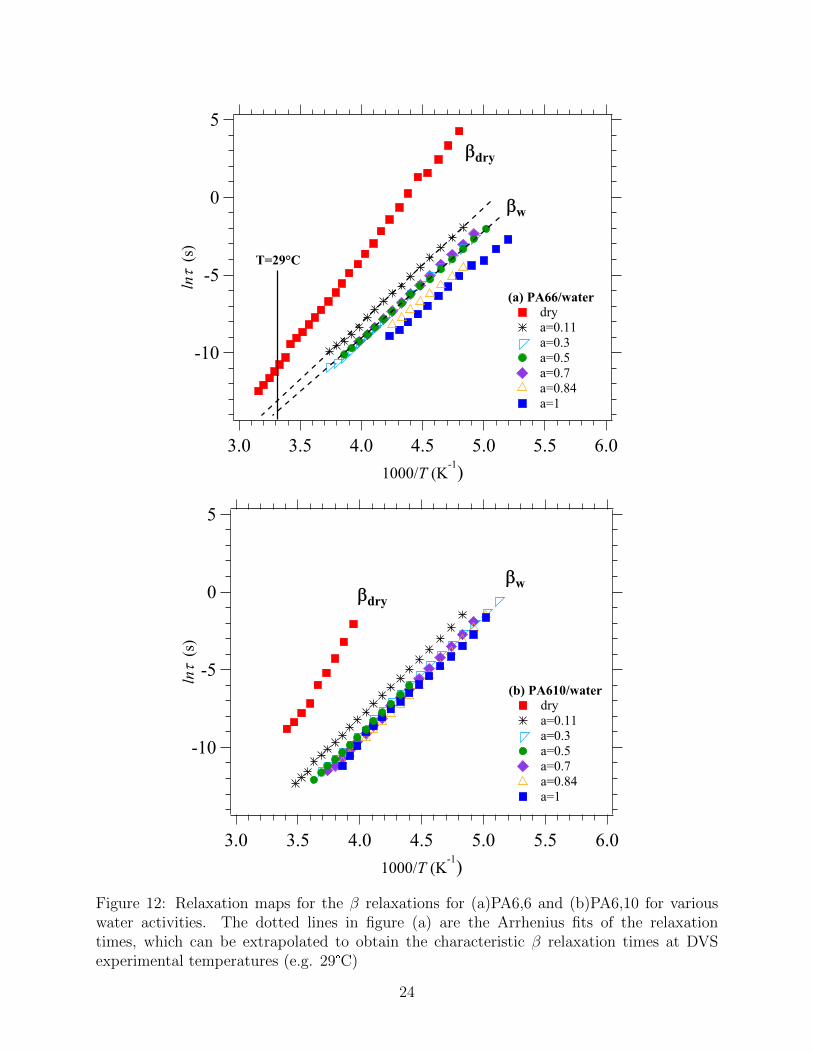
The β relaxation is strongly affected by the presence of water.13 In a dry polyamide,
the β relaxation is symmetrical and corresponds to the relaxation denoted βdry in Figure
8
40x10-3
30
20
10
M'' d
iele
c
200150100500-50-100
T (°C)
0.01
0.1
1
10e''d
ieleca
b
g
Figure 1: Isochronal representation of loss permittivity (dotted curve) and loss modulus (fullcurve) as a function of temperature for dry PA6,6 at the frequency of 133 Hz. The maximumof the α relaxation peak is pointed by arrows.
-20
-10
0
10
lnt
3.53.02.52.0
1000/T (K-1)
e'' dielec
M''dielec
VFT fit of e''dielec
Tg obtained in DSC for t = 100s
Figure 2: Relaxation times as a function of temperature obtained from ε′′dielec and M ′′dielec
isochronal representation for dry PA6,6. Solid line represents a Vogel-Fulcher-Tammann fitof the data.
9
3. When water is introduced, the initial position of the beta relaxation does not change
significantly but a second, more intense beta relaxation (denoted βw in Figure 3) appears
in the high frequency side. As the water concentration increases, this relaxation shifts to
higher and higher frequencies. It should be highlighted that in PA6,10, two relatively well
distinct processes can be observed in the presence of water (Figure 3 (a)). In PA6,6 however,
it is very difficult to clearly distinguish between the two processes, especially at high water
activities (Figure 3 (b)). For this reason, the position of the β relaxation determined for
the dry polymer was introduced manually in the fits, with varying dielectric strength. The
relaxation denoted βw is considered to be representative of the local chain dynamics of
hydrogen bonded amide groups in the presence of water. It is thus the one discussed in this
work in relation to water diffusion.
It should be highlighted that polymer processing and the resulting distribution of rigid
and mobile amorphous fractions can have an influence on polymer relaxations. A comparison
has been done between the PA6,6 100 µm film and a PA6,6 0.8 mm injected plate. The effect
of processing is mainly noticeable on the α relaxation associated to the glass transition, since
the crystalline fractions and the glass transition temperatures of the two samples are slightly
different. However, no effect was noticed on the secondary, more local β or γ relaxations,
for which the obtained characteristic relaxation times superimposed. As a consequence,
the characteristic relaxation times presented in this paper can be extended to polyamides
prepared with different processing methods.
A Novocontrol Alpha Analyzer and a Quatro temperature control system were used to
conduct experiments under a voltage of 3V in the temperature range of −130 to 200°C
with 4°C steps. For each temperature, the frequency range was 10−2 Hz to 106 Hz (Broad-
band Dielectric Spectroscopy - BDS). For dry samples, additional experimental points in
the frequency range 106 Hz to 109 Hz were obtained by High Frequency Dielectric Spec-
troscopy (HFDS) under a voltage of 0.5 V in the temperature range −130 to 200°C with
1°C steps. Polymer films were cut into disks of 30 mm (BDS) and 10 mm (HFDS) di-
10
10 -2 10-1 10 0 10 1 102 10 3 10 4 10 5 10 6 10 7
020
4060
80100
(c)
Frequency (Hz)
10-2 10-1 100 101 102 103 104 105 106 107
020
4060
80
(a)
Frequency (Hz)
Per
mitt
ivity
'' 10
-3
10 -2 10 -1 100 101 10 2 10 3 10 4 10 5 10 6
050
100
150
200
250
(b)
Frequency (Hz)
Per
mitt
ivity
'' 10
-3
Per
mitt
ivity
'' 10
-3
10-2 100 102 104 106 108 1010
050
100
150
(d)
Frequency (Hz)
Per
mit
tivi
ty''
10-3
dry
dry
dry
dry
w
ww
w
T=255K T=255K
T=255K T=236K
Figure 3: Isotherms of loss permittivity ε′′ in the region of the β relaxation in (a) PA6,10at water activity 0.11 (left) and 1 (right) and (b) PA6,6 at water activity 0.11 (left) and 1(right), together with corresponding Havriliak-Negami fits.
11
ameter and placed between gold plated electrodes. For water-equilibrated samples, the
electrode/polymer film/electrode sandwich was immediately quenched at −130◦C to avoid
solvent evaporation. Measurements were performed on heating. Polymer films kept a con-
stant weight up to 25 − 35◦C, depending on the initial water concentration. Above this
temperature, water evaporation started to occur as was illustrated by the decrease in the
real part of permittivity ε′ for all frequencies around 100°C.
2.6 Analysis of sorption curves
Based on the impact of the penetrant on the polymer matrix, different types of diffusion
may occur40:
� Case I or Fickian: diffusion occurs in a polymer matrix which is unperturbed by the
presence of solvent and the diffusion coefficient of the solvent is independent of the
solvent concentration, within the duration of the sorption experiment.
� Case II : the diffusion coefficient of the solvent depends on the solvent concentration
because the polymer matrix is affected (plasticized) by the presence of solvent. The
polymer relaxation rate becomes faster than the diffusion rate. Consequently, the
penetrant moves into a polymer with a steep concentration front separating regions
of swollen, penetrant saturated polymer behind the front and unswollen, dry polymer
ahead of the front.
� Anomalous or non-Fickian diffusion:41 polymer relaxation rates and diffusion rates
are similar. As in Case II diffusion, the penetrant induces swelling in the polymer
matrix but the phenomenon is delayed. Therefore, a slowly advancing front of swelling
is preceeded by a Fickian diffusion tail.
In order to properly interpret sorption curves, it is therefore esssential to (1) check the
variation of the diffusion coefficient along the sorption process and (2) relate diffusion time
12
scale to the characteristic relaxation time related to the various relaxation processes displayed
by the polymer chains.
1.0
0.8
0.6
0.4
0.2
0.0
M(t
)/M
eq
0.40.30.20.10.0
t1/2
(days1/2
)
(c) non-Fickian
1.0
0.8
0.6
0.4
0.2
0.0
M(t
)/M
eq
0.40.30.20.10.0
t1/2
(days1/2
)
(a) Fickian
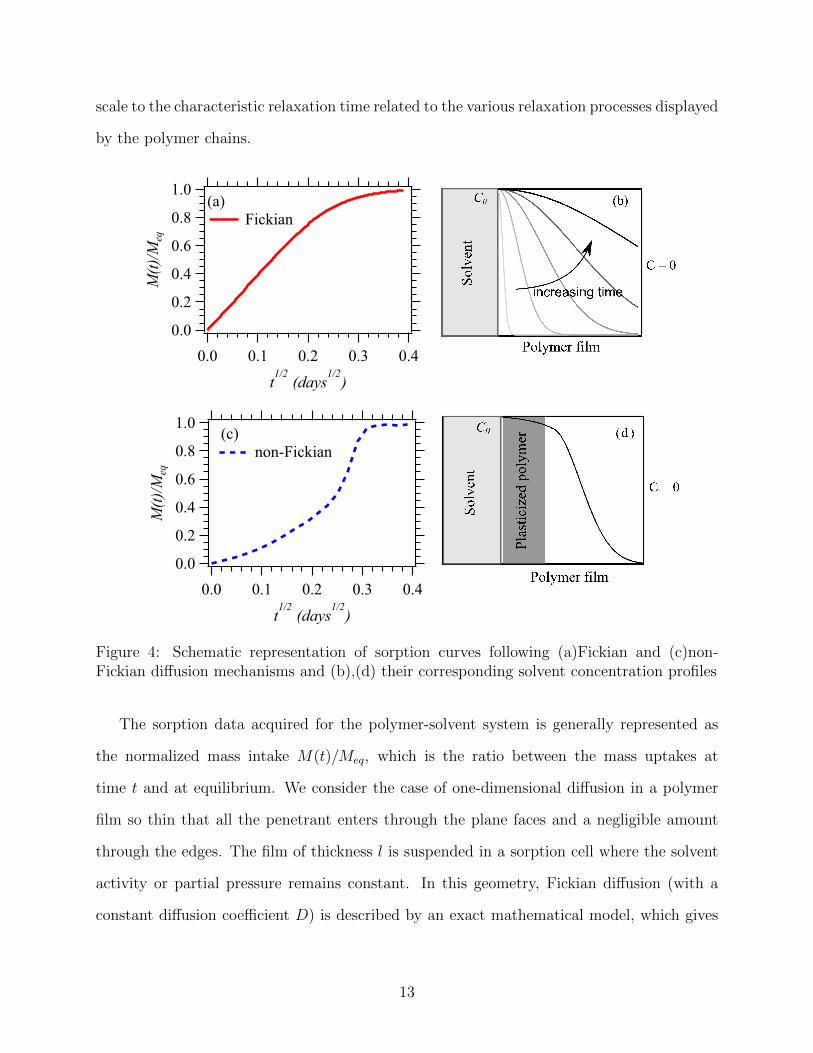
Figure 4: Schematic representation of sorption curves following (a)Fickian and (c)non-Fickian diffusion mechanisms and (b),(d) their corresponding solvent concentration profiles
The sorption data acquired for the polymer-solvent system is generally represented as
the normalized mass intake M(t)/Meq, which is the ratio between the mass uptakes at
time t and at equilibrium. We consider the case of one-dimensional diffusion in a polymer
film so thin that all the penetrant enters through the plane faces and a negligible amount
through the edges. The film of thickness l is suspended in a sorption cell where the solvent
activity or partial pressure remains constant. In this geometry, Fickian diffusion (with a
constant diffusion coefficient D) is described by an exact mathematical model, which gives
13
the following equation:42
M(t)
M∞= 1−
∞∑n=0
8
(2n+ 1)2π2exp
(−D(2n+ 1)2π2t
l2
)(2)
At short times, Equation 2 gives a linear increase of the normalized mass intake M(t)/Meq
as a function of t1/2 and the diffusion coefficient D is simply extracted from the slope of this
curve. Thus, the shape of the M(t)/Meq curve as a function of t1/2 gives a first information
on the diffusion mechanism (Figure 4). In the case of Fickian diffusion, a linear increase with
the square root of time is observed for the normalized mass intake, whereas in a non-Fickian
mechanism the curve is generally a sigmoid exhibiting an inflexion point. Our curve fits have
been strictly limited to the simple case of Fickian diffusion, where diffusion coefficients can
be calculated accurately with equation (2).
Several mathematical models have been suggested to analyze non-Fickian diffusion. Berens
and Hopfenberg43 proposed a heuristic model based on the linear superposition of Fickian
diffusion and relaxation processes. A more complete model was proposed by Hedenqvist and
Gedde,44 who took into consideration the solute-concentration dependence of diffusivity,
swelling, time-dependent surface boundary concentration and swelling-induced mechanical
stresses. However, all these models have a large number of adjustable parameters so their
physical relevance can be argued. To check the relevance of either model, it is crucial to
be able to relate time scales associated to diffusion to the relaxation time of the polymer
matrix.
3 Results
3.1 Sorption kinetics
The sorption of liquid water in the two polyamides was measured at three temperatures
(25, 40 and 55◦C) (Figure 5). In PA6,10, the normalized water intake M(t)/M∞ increases
14
linearly with t1/2 and a Fickian model fits the experimental data perfectly for all tempera-
tures. The calculated diffusion coefficients are 3× 10⁻⁹, 1.1× 10⁻⁸ and 3.5× 10⁻⁸ cm2/s for
the three temperatures respectively. Assuming that the diffusion coefficient dependence on
temperature follows an Arrhenius law, an activation energy of 66 kJ/mol is obtained for the
diffusion of water in PA6,10. This value is within the range of 60 to 80 kJ/mol activation
energies reported for diffusion of water in PA6,6.2,45
1.0
0.8
0.6
0.4
0.2
0.0
M(t)/M
eq
403020100
t1/2
(days1/2
)/thickness (cm)
(a) PA6,10 + water at 40°C: experimental
Fickian fit
1.0
0.8
0.6
0.4
0.2
0.0
M(t)/M
eq
20151050
t1/2
(days1/2
)/thickness (cm)
(b) PA6,6+ water at 40°C: experimental
Fickian fit
Figure 5: Sorption kinetics of liquid water at 40°C in (a)PA6,10 and (b)PA6,6
The curve obtained for the diffusion of water in PA6,6 at 40°C has a sigmoidal shape with
an inflexion point. This indicates that the diffusion mechanism is not Fickian. Consequently,
the experimental data cannot be fitted with equation (2). Therefore, other phenomena
might occur after a first step of linear Fickian diffusion: concentration dependent diffusion
coefficient, swelling and/or polymer relaxation.
A Dynamic Vapor Sorption experiment was designed to separate the diffusion process
from other phenomena. Swelling kinetics, polymer relaxation and concentration fronts ap-
pear when the solvent/polymer system is not at equilibrium. Intermediate equilibrium states
can be obtained by absorbing water at increasing activities. A small upward step of activity
results in a small increase of the water content with respect to equilibrium, which should not
modify significantly the state of the matrix. Water diffusion should then follow a Fickian
mechanism at each activity step. However, for practical reasons related to the precision of
15
the balance and the time span of the experiment, infinitesimal activity steps cannot be set
up. A good compromise consists in increasing the activity by 0.1 in the range 0.1 to 0.9,
which cumulates to a maximum span of 3 weeks for an experiment at the lowest temperature.
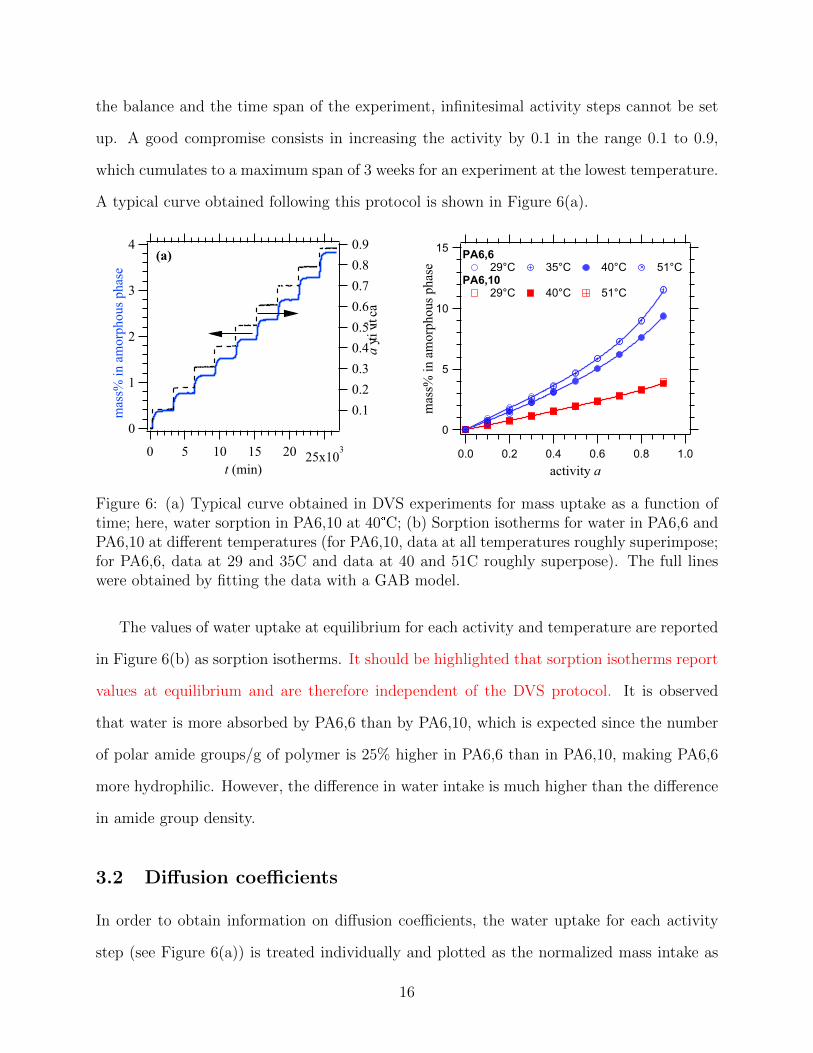
A typical curve obtained following this protocol is shown in Figure 6(a).
4
3
2
1
0
mas
s% i
n a
morp
hou
s p
has
e
25x10320151050
t (min)
0.9
0.8
0.7
0.6
0.5
0.4
0.3
0.2
0.1
activity
a
(a)15
10
5
0m
ass%
in a
morp
ho
us
phas
e
1.00.80.60.40.20.0
activity a
PA6,6 29°C 35°C 40°C 51°C
PA6,10 29°C 40°C 51°C
Figure 6: (a) Typical curve obtained in DVS experiments for mass uptake as a function oftime; here, water sorption in PA6,10 at 40°C; (b) Sorption isotherms for water in PA6,6 andPA6,10 at different temperatures (for PA6,10, data at all temperatures roughly superimpose;for PA6,6, data at 29 and 35C and data at 40 and 51C roughly superpose). The full lineswere obtained by fitting the data with a GAB model.
The values of water uptake at equilibrium for each activity and temperature are reported
in Figure 6(b) as sorption isotherms. It should be highlighted that sorption isotherms report
values at equilibrium and are therefore independent of the DVS protocol. It is observed
that water is more absorbed by PA6,6 than by PA6,10, which is expected since the number
of polar amide groups/g of polymer is 25% higher in PA6,6 than in PA6,10, making PA6,6
more hydrophilic. However, the difference in water intake is much higher than the difference
in amide group density.
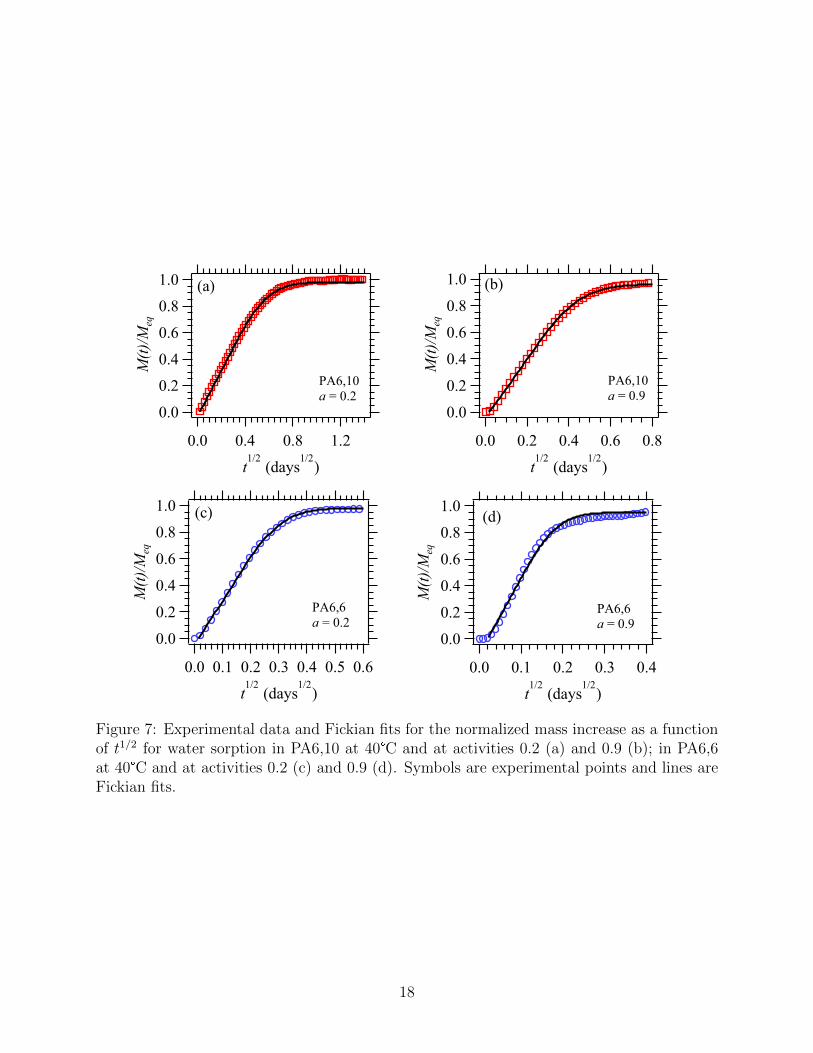
3.2 Diffusion coefficients
In order to obtain information on diffusion coefficients, the water uptake for each activity
step (see Figure 6(a)) is treated individually and plotted as the normalized mass intake as
16
a function of the square root of time. Figures 7(a) and (b) illustrate the sorption kinetics of
water in PA6,10 at 40°C. Similar curves were obtained at 29°C and 51°C. A linear increase
of the normalized mass uptake is observed as a function of t1/2. The diffusion mechanism is
Fickian from activity 0.1 up to activity 1. A fit with equation (2) gives excellent superposition
with experimental data and provides the values of the diffusion coefficients for each water
activity. In the case of PA6,6, for which non-Fickian diffusion was observed in liquid water,
the DVS experiment gave the expected Fickian diffusion mechanisms for low activities, as
illustrated in Figure 7(c). However, a change occurred around activity 0.7, at which point
the slightly sigmoidal shape of the curve suggests that the condition of quasi-equilibrium is
no longer fully satisfied (Figure 7(d)), or that water diffusion is intrinsically anomalous. An
estimate of the diffusion coefficients can still be provided by the fit with equation (2). The
same type of behavior was obtained at 29, 35 and 51°C.
The variation of the diffusion coefficients as a function of activity and temperature is
shown in Figure 8 for both polyamides. It is observed that diffusion coefficients are not
constant. They vary slightly in PA6,10, increasing by a factor 2 at most. In PA6,6, diffu-
sion coefficients are much more dependent on activity, increasing by a factor about 5. A
concentration dependent diffusion coefficient is one of the origins of non-Fickian diffusion
mechanisms,42 which might explain the sigmoidal sorption profile of water in PA6,6.
Moreover, Figure 8 illustrates that water diffusion is faster in PA6,10 than in PA6,6 at
the same experimental temperature, especially at low activities. As the activity increases,
the values of the diffusion coefficients in PA6,6 approach those in PA6,10. The experimental
temperatures were also chosen so as to have equivalent T − Tg = 24◦C, as is the case for
PA6,6 at 40°C and PA6,10 at 29°C or T − Tg = 13◦C, as is the case for PA6,6 at 51°C and
PA6,10 at 40°C. As it will be highlighted in the next section, the glass transition temperature
of the water-polyamide systems varies rapidly as water is absorbed so this initial condition
of equivalent mobility of the polymer chains is no longer valid. Moreover, it can be noticed
that diffusion coefficients are slightly higher in PA6,10 than in PA6,6 for the two equivalent
17
1.0
0.8
0.6
0.4
0.2
0.0
M(t)/M
eq
1.20.80.40.0
t1/2
(days1/2
)
PA6,10
a = 0.2
(a) 1.0
0.8
0.6
0.4
0.2
0.0M(t)/M
eq0.80.60.40.20.0
t1/2
(days1/2
)
PA6,10
a = 0.9
(b)
1.0
0.8
0.6
0.4
0.2
0.0
M(t)/M
eq
0.60.50.40.30.20.10.0
t1/2
(days1/2
)
PA6,6
a = 0.2
(c) 1.0
0.8
0.6
0.4
0.2
0.0
M(t)/M
eq
0.40.30.20.10.0
t1/2
(days1/2
)
(d)
PA6,6
a = 0.9
Figure 7: Experimental data and Fickian fits for the normalized mass increase as a functionof t1/2 for water sorption in PA6,10 at 40°C and at activities 0.2 (a) and 0.9 (b); in PA6,6at 40°C and at activities 0.2 (c) and 0.9 (d). Symbols are experimental points and lines areFickian fits.
18
6
810
-9
2
4
6
810
-8
2D
(cm
2/s
)
1.00.80.60.40.20.0
activity a
PA6,10 29°C 40°C
51°C
(a)
PA6,6 29°C 35°C
40°C 51°C
10
-9
2
3
4
5
6
10-8
2
D (
cm2/s
)
121086420
mass% in amorphous phase
(b)
PA6,6 29°C 35°C
40°C 51°C
PA6,10 29°C 40°C
51°C
Figure 8: Variation of diffusion coefficients of water in PA6,6 and PA6,10 at different tem-peratures as a function of (a) water activity and (b) water intake in the amorphous phase.Lines are guides for the eye.
values of T − Tg.
3.3 α relaxations of water-polyamide systems
Anomalous or non-Fickian effects might be related to the influence of the evolving polymer
mobility on diffusion or to the internal stresses (swelling) exerted as diffusion proceeds.42,46
Since water decreases the glass transition temperature of polyamide,2,3 it is interesting to
study if there is a correlation between diffusion and the mobility of polymer chains.
To begin with, the glass transition temperatures Tg of the two polyamide-water systems
were measured by Differential Scanning Calorimetry (DSC) at intermediate water mass up-
takes corresponding to different activity values (Figure 9). As illustrated before by the
sorption isotherms (Figure 6(b)), PA6,10 absorbs less water than PA6,6 in the activity
range 0.1 to 0.9. The overall decrease in the glass transition temperature is thus smaller
in PA6,10/water system at equilibrium than in PA6,6/water (-50°C compared to -80°C,
respectively).
19
60
40
20
0
-20
Tg (
°C)
0.80.60.40.2
activity a
PA6,6
PA6,10
(a)
-80
-60
-40
-20
0
DTg (
°C)
121086420
mass% in amorphous phase
PA6,6
PA6,10
(b)
Figure 9: Shift in the glass transition temperature Tg measured by DSC in PA6,6 and PA6,10as a function of (a) water activity and (b) water mass intake.
More detailed information on the polymer mobility can be obtained by dielectric spec-
troscopy. This technique gives access to the characteristic times of the polymer relaxations
as a function of temperature. The α relaxation in dielectric spectroscopy is associated to the
glass transition so the α relaxation times give an indication about the polymer mobility. The
glass transition temperature measured by DSC can be added to these data by considering
that the equivalent relaxation time in DSC measurements is approximately 100 seconds.36
The relaxation times were measured for the dry and water equilibrated films with saturated
salt solutions (activity 0.5, 0.75 and 0.84, Figure 10(a)).
The α relaxation times as a function of temperature for both the dry (activity a = 0)
and liquid-water equilibrated (a = 1) polyamide can be fitted by a Vogel-Fulcher-Tammann
(VFT) equation (equation 1), which can be rewritten as:
1
T=
1
T0 + AV FT
ln(τ/τ0)
(3)
where the VFT parameters T0, AV FT and τ0 depend on the activity. It was observed that the
relaxation times for intermediate activities could be obtained by an interpolation method
based on the position of the data points for DSC glass transition temperature (ln τ ' 4.6)
20
and their distances to the dry and liquid-water equilibrated polyamide VFT curves ln τ as
a function of 1/T . Based on the notations in Figure 10a, this semi-empirical interpolation
method is given by Equation 4:
1
T (a)=
x
x+ y
1
T (a = 1)+
y
x+ y
1
T (a = 0)(4)
where all temperatures correspond to the same value of ln τ and x and y are the differences
between the inverse 1/Tg of the polymer with water at activity a and 1/Tg of the dry and
water equilibrated polymer respectively. Equation 4 is analogous to the Fox-Flory mixing rule
for the Tg of miscible blends.47 It is an experimental finding here that the α relaxation times
for the systems equilibrated at intermediate water activities are well described by equation
4. Indeed, in Figure 10(a) it is observed that the dashed lines obtained from equation 4
superimpose over the experimental relaxation times represented by the markers, for the
three intermediate activities. Equation 4 expresses the fact that the Tg of polyamide/water
systems vs. activity curve (as shown in Figure 9) is independent of the frequency of the
measurement.
The DSC glass transition temperature was available for all intermediate activities be-
tween 0.1 and 0.9. Therefore, the VFT curves for the α relaxation times vs temperature at
intermediate activities from 0.1 to 0.9 were estimated based on this interpolation method
using equation 4. Finally, from the set of interpolated curves (as shown in Figure 10(b)), the
relaxation time as a function of activity at a given experimental temperature was obtained
by taking the intersections of the experimental temperature (vertical straight line Figure
10(b)) and of the interpolated relaxation time curves (Figure 10(b)).
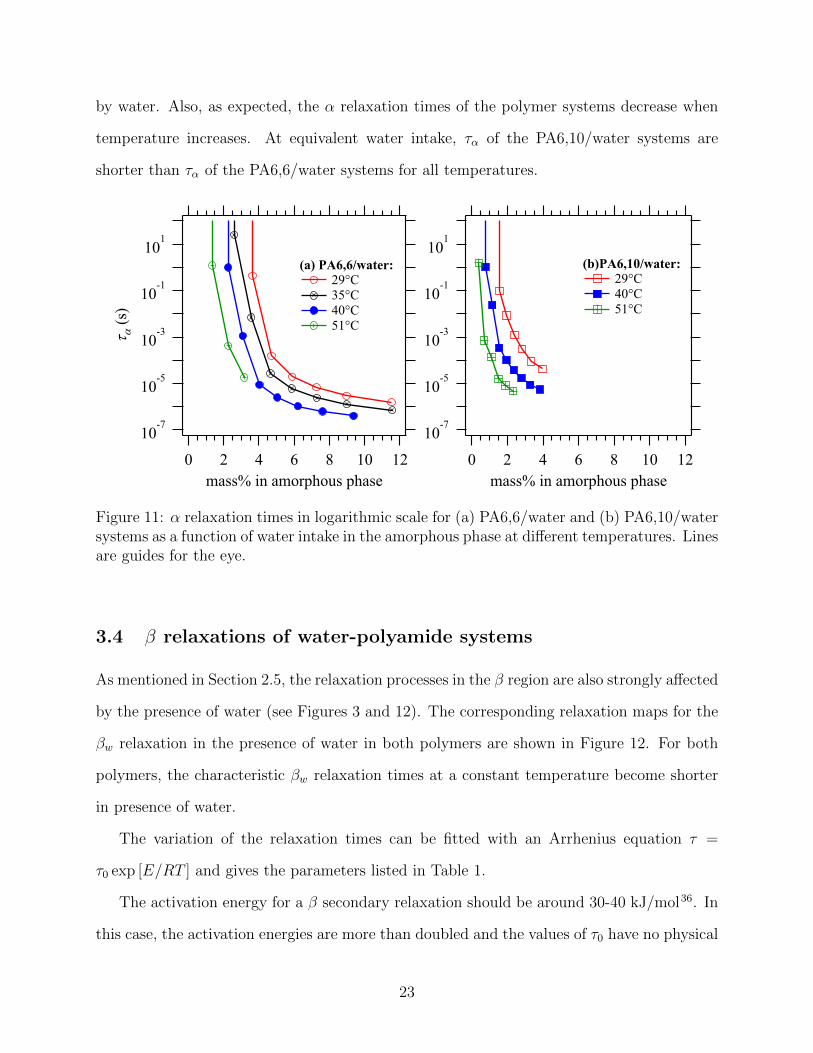
The characteristic relaxation times τα of PA/water systems at different temperatures
are illustrated in Figure 11(a) and (b) as a function of water mass intake in the polyamide
amorphous phase. First of all, it can be noticed that α relaxation times decrease when
the water concentration increases, which is in agreement with polyamide being plasticized
21
-25
-20
-15
-10
-5
0
5
10
lnt (t
in
s)
4.03.53.02.52.0
1000/T (K-1
)
(a)
x y a = 0 (dry) a = 0.5 a = 0.7 a = 0.84 a = 1
-25
-20
-15
-10
-5
0
5
10
lnt (t
in
s)
4.03.53.02.52.0
1000/T (K-1
)
a=0 a=1
T=40°C
(b)
Figure 10: (a) Experimental α relaxation times obtained from ε′′
dielec isochrones (markers),VFT fits (solid lines) and interpolation results (dashed line) for dry and water equilibrated(a = 0.5, 0.75, 0.84 and 1) PA6,6; (b) Set of interpolated curves for all DVS intermediateactivities and intersection with experimental temperature 40°C. Black markers correspondto the DSC measured Tg’s of polyamide/water systems at intermediate activities.
22
by water. Also, as expected, the α relaxation times of the polymer systems decrease when
temperature increases. At equivalent water intake, τα of the PA6,10/water systems are
shorter than τα of the PA6,6/water systems for all temperatures.
10-7
10-5
10-3
10-1
101
ta (s
)
121086420
mass% in amorphous phase
(a) PA6,6/water: 29°C
35°C
40°C
51°C
10-7
10-5
10-3
10-1
101
121086420
mass% in amorphous phase
(b)PA6,10/water: 29°C
40°C
51°C
Figure 11: α relaxation times in logarithmic scale for (a) PA6,6/water and (b) PA6,10/watersystems as a function of water intake in the amorphous phase at different temperatures. Linesare guides for the eye.
3.4 β relaxations of water-polyamide systems
As mentioned in Section 2.5, the relaxation processes in the β region are also strongly affected
by the presence of water (see Figures 3 and 12). The corresponding relaxation maps for the
βw relaxation in the presence of water in both polymers are shown in Figure 12. For both
polymers, the characteristic βw relaxation times at a constant temperature become shorter
in presence of water.
The variation of the relaxation times can be fitted with an Arrhenius equation τ =
τ0 exp [E/RT ] and gives the parameters listed in Table 1.
The activation energy for a β secondary relaxation should be around 30-40 kJ/mol36. In
this case, the activation energies are more than doubled and the values of τ0 have no physical
23
-10
-5
0
5
lnt (s
)
6.05.55.04.54.03.53.0
1000/T (K-1)
(a) PA66/water dry
a=0.11
a=0.3
a=0.5
a=0.7
a=0.84
a=1
T=29°C
bdry
bw
-10
-5
0
5
lnt (s
)
6.05.55.04.54.03.53.0
1000/T (K-1)
(b) PA610/water dry
a=0.11
a=0.3
a=0.5
a=0.7
a=0.84
a=1
bdry
bw
Figure 12: Relaxation maps for the β relaxations for (a)PA6,6 and (b)PA6,10 for variouswater activities. The dotted lines in figure (a) are the Arrhenius fits of the relaxationtimes, which can be extrapolated to obtain the characteristic β relaxation times at DVSexperimental temperatures (e.g. 29°C)
24
Table 1: Arrhenius parameters from the β relaxation maps of PA6,10 and PA6,6 at variouswater activities shown in Figure 12.
PA6,6 PA6,10activity Ea (kJ/mol) τ0 (s) Ea (kJ/mol) τ0 (s)0 (dry) 85 3.6E-20 103 4.3E-23
relevance. This is an indication that the β relaxation in polyamide is not a simple process
involving the rotation of a single amide group or the dissociation of a single hydrogen bond.
The complexity could be due to cooperative movements of the amide groups.
The Arrhenius equation and the parameters in Table 1 were used in order to extrapolate
the characteristic βw relaxation times at the experimental DVS temperatures (see extrapo-
lation in Figure 12 (a)). The variation of the characteristic βw relaxation time as a function
of water content in both polymers at DVS experimental temperatures are shown in Figure
13. The obtained values are considered to be representative of the local chain dynamics of
hydrogen bonded amide groups. Although β relaxation times approach α relaxation times in
presence of water, the two processes are still sufficiently separated to be studied individually.
As in the case of the α relaxation, β relaxation times decrease when the water content or
temperature increases. The same order of magnitude, 0.1 to 1 microseconds, is observed in
both polymers.
4 Discussion
4.1 Sorption isotherms
Before addressing the question of diffusion mechanisms, which is the core of this paper, it
is interesting to recall some basic considerations about water sorption. Indeed, analyzing
25
10-8
2
4
10-7
2
4
10-6
2
4
10-5
t b (
s)
1086420
mass% in amorphous phase
(a) PA66/water 29°C
35°C
40°C
51°C
10-8
2
4
10-7
2
4
10-6
2
4
10-5
t b (
s)
6543210
mass% in amorphous phase
(b) PA610/water 29°C
40°C
51°C
Figure 13: Characteristic β relaxation times as a function of water uptake in the amorphousphase of (a) PA6,6 and (b) PA6,10 corresponding to DVS experimental temperatures. Linesare guides for the eye.
sorption isotherms already gives some pieces of information on the effect of water on the
polymer matrix.
Since the two polymers were prepared by different processing methods, the comparison
between them is not straightforward. Indeed it is well established that morphology and
phase composition are influenced by processing and thermal history of semi-crystalline poly-
mers.21,22,24,27,48,49 For the diffusion and polymer relaxation investigation, the two polyamides
were studied independently and the same conclusions were reached. For sorption isotherms,
each matrix was analyzed individually as well.
Measured sorption isotherms are in agreement with those reported in the literature.2,5,7,9
The upward curvature of water sorption isotherms might be associated to the swelling of
the matrix or to the existence of water clusters.2,5,50 The Flory-Huggins model for binary
mixtures takes into account the swelling of the matrix and fits the experimental data with
equation (5)51 :
ln a = lnϕ+ (1− ϕ) + χ(1− ϕ)2 (5)
26
where ϕ is the volume fraction of solvent in the polymer and χ is the Flory-Huggins inter-
action parameter. Equation (5) provides and excellent fit for all experimental data and the
obtained χ values are 1.5 for PA6,6 at 29°C, 1.63 for PA6,6 at 40°C and 2.32 for PA6,10 at
29 and 40°C. A higher Flory-Huggins parameter in PA6,10 suggests that water is a worse
solvent for PA6,10 than for PA6,6, which is in accordance with PA6,10 being more hydropho-
bic. The value of the interaction parameter χ can alternatively be estimated with equation
6:52
χ =(δi − δj)2
RT
√vivj (6)
where δ is the Hildebrand solubility parameter, R is the gas constant, T is the temperature
and v is the molar volume of each specie. The reported values for Hildebrand solubility
parameters are 27.8 MPa1/2 for PA6,6,53,54 26 MPa1/2 for PA6,10 (calculated with group
contribution55) and 48 MPa1/2 for water as a pure liquid.52 Based on equation (6) and the
reported values of solubility parameters, the values of the Flory interaction parameter χ
would be 5.05 for PA6,6/water and 6.75 for PA6,10/water at 40°C. These values are much
larger than the χ values obtained from fitting the sorption isotherms. Experimental water
intake is thereby much higher than predicted from the calculated χ values. Moreover, in
the Flory approach, the water intake should increase with temperature, entropy being the
driving force for sorption. However, it is found that the water intake either decreases (PA6,6)
or is roughly constant (PA6,10) as a function of temperature. This suggests that sorption
enthalpy is more likely to be the driving force for sorption, and therefore, that an enthalpy-
driven model with specific sorption sites is more appropriate.
The Guggenheim, Anderson and De Boer (GAB)56–58 model assumes the existence of
preferential sorption sites (in the present case amide groups). The model allows sorption in
several layers and differentiates between the water molecules from the first sorbed layer and
the ones from the additional layers. The sorption isotherms can be fitted with equation (7)
27
(fit shown in Figure 6(b)):
M(a) =MmACa
(1− Aa)(1− Aa+ ACa)(7)
where M(a) is the solvent uptake at activity a, Mm is the solvent content corresponding
to saturation of all primary absorption sites by one solvent molecule (monolayer), C is the
Guggenheim constant and represents the difference in the adsorption energy for the first layer
and the other successive layers and A is a factor correcting the properties of the multilayer
molecules with respect to the bulk liquid.
The GAB parameters resulting from the fits are: Mm = 4.99%, A = 0.71, C = 2.74
(PA6,6 at 29°C); Mm = 4.99%, A = 0.72, C = 2.58 (PA6,6 at 35°C); Mm=4.99%, A=0.65,
C=2.4 (PA6,6 at 40°C) and Mm=3.61%, A =0.47, C=2.26 (PA6,10 at 29°C), Mm=3.61%, A
=0.46, C=2.39 (PA6,10 at 40°C) and Mm=3.61%, A =0.48, C=2.11 (PA6,10 at 51°C).
The values of the GAB parameters are in agreement with the literature.2 The obtained
solvent content in the first layer Mm is 5% in PA6,6 and 3.6% in PA6,10, which is close to the
1.25 ratio predicted by the difference in amide groups density. The Guggenheim constants
C and constant A have close values in the two polyamides, indicating that there is little
difference in the adsorption energy of a water molecule in PA6,6 or in PA6,10.
The GAB parameters can also be used to estimate the size of the water clusters (Mean
Cluster Size, MCS) with the following equation (8):59
MCS = −(1− ϕ)
[ϕ
MmC(−2 + 2Aa− 2ACa+ C)− 1
](8)
The equation provides a MCS of 2 for water in PA6,6 at 29°C, 1.7 for water in PA6,6
at 40°C and 1.3 for water in PA6,10 at 29 and 40°C. These values are in accordance with
literature data for PA6,62,5 and with results of molecular dynamic simulations60. A low
MCS value of 1.3 for water in PA6,10, as well as the linear shape of the sorption isotherm
suggest that water does not form clusters in PA6,10. Altogether, this indicates that water
28
is distributed in polyamide down to molecular size (or length scale) or nearly (cluster size
1.5-2) and does not form nanodomains (ordered or not) like for example in lyotropic systems
(surfactant/water mixtures). This implies that diffusion will be isotropic, not affected by
structuration at nanometer scale. Note however that diffusion is affected by the presence of
crystallites.
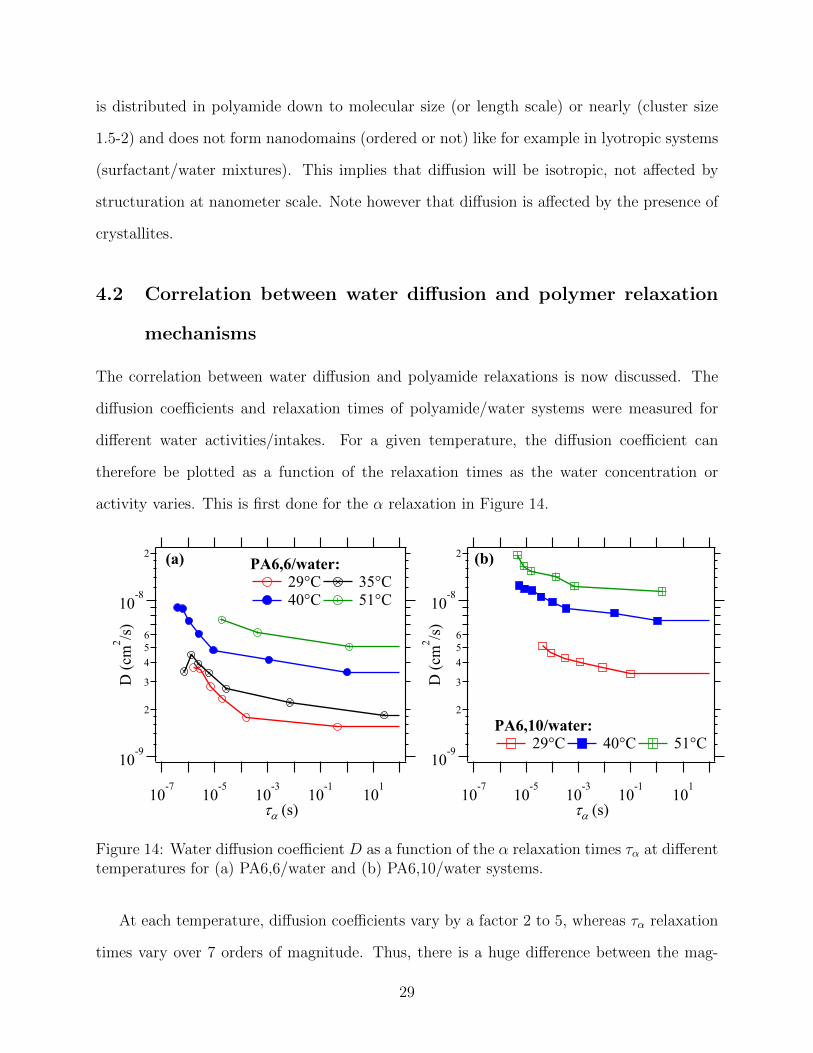
4.2 Correlation between water diffusion and polymer relaxation
mechanisms
The correlation between water diffusion and polyamide relaxations is now discussed. The
diffusion coefficients and relaxation times of polyamide/water systems were measured for
different water activities/intakes. For a given temperature, the diffusion coefficient can
therefore be plotted as a function of the relaxation times as the water concentration or
activity varies. This is first done for the α relaxation in Figure 14.
10-9
2
3
4
5
6
10-8
2
D (
cm2/s
)
10-7 10
-5 10-3 10
-1 101
ta (s)
PA6,10/water: 29°C 40°C 51°C
(b)
10-9
2
3
4
5
6
10-8
2
D (
cm2/s
)
10-7 10
-5 10-3 10
-1 101
ta (s)
PA6,6/water: 29°C 35°C 40°C 51°C
(a)
Figure 14: Water diffusion coefficient D as a function of the α relaxation times τα at differenttemperatures for (a) PA6,6/water and (b) PA6,10/water systems.
At each temperature, diffusion coefficients vary by a factor 2 to 5, whereas τα relaxation
times vary over 7 orders of magnitude. Thus, there is a huge difference between the mag-
29
nitude of the variation of diffusion coefficients and τα as a function of water content: the
two processes seem to follow distinct timescales. These results are in agreement with NMR
studies that showed a few percentages of water already penetrate in polyamide before the
plasticization sets in.28 The authors concluded on the existence of a plasticization lag, which
also suggests that plasticization and diffusion are not directly correlated. In addition, this
set of data gives access to the variation of the diffusion coefficients as a function of temper-
ature, for a constant characteristic rate of segmental motions of the matrix. The variation
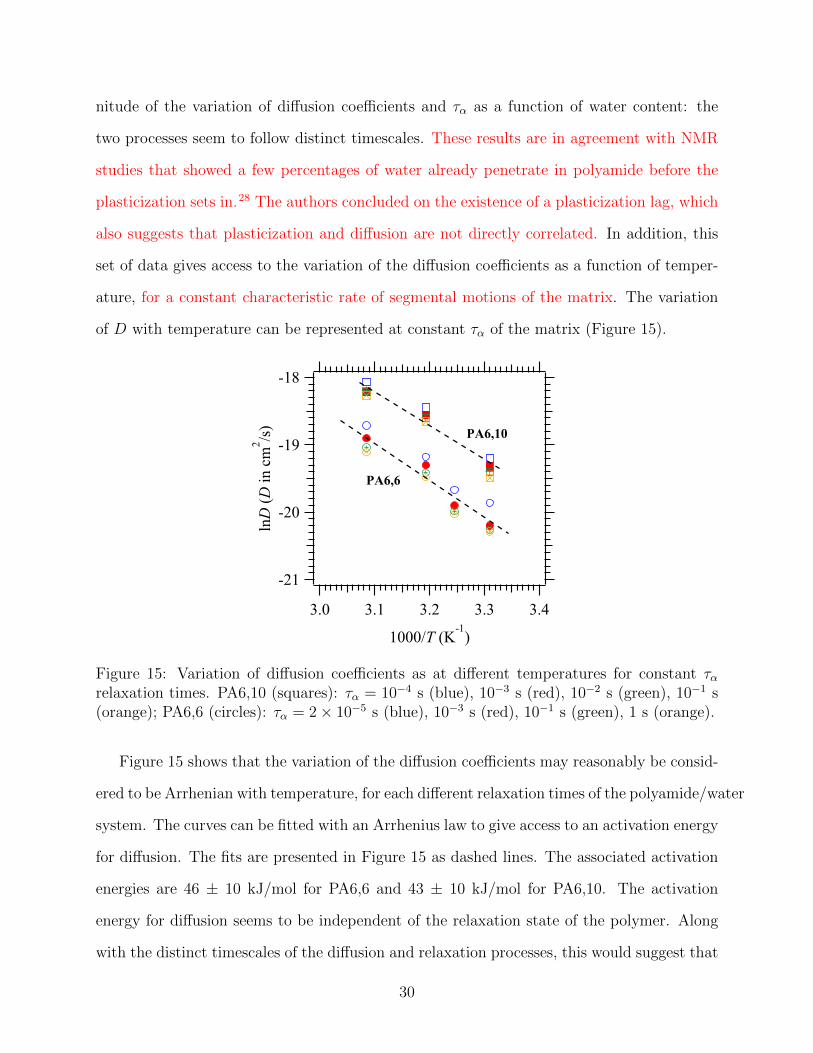
of D with temperature can be represented at constant τα of the matrix (Figure 15).
-21
-20
-19
-18
lnD
(D
in c
m2/s
)
3.43.33.23.13.0
1000/T (K-1
)
PA6,6
PA6,10
Figure 15: Variation of diffusion coefficients as at different temperatures for constant ταrelaxation times. PA6,10 (squares): τα = 10−4 s (blue), 10−3 s (red), 10−2 s (green), 10−1 s(orange); PA6,6 (circles): τα = 2× 10⁻⁵ s (blue), 10−3 s (red), 10−1 s (green), 1 s (orange).
Figure 15 shows that the variation of the diffusion coefficients may reasonably be consid-
ered to be Arrhenian with temperature, for each different relaxation times of the polyamide/water
system. The curves can be fitted with an Arrhenius law to give access to an activation energy
for diffusion. The fits are presented in Figure 15 as dashed lines. The associated activation
energies are 46 ± 10 kJ/mol for PA6,6 and 43 ± 10 kJ/mol for PA6,10. The activation
energy for diffusion seems to be independent of the relaxation state of the polymer. Along
with the distinct timescales of the diffusion and relaxation processes, this would suggest that
30
there is no direct correlation between the two phenomena.
The activation energies for diffusion are only slightly different in PA6,6 and PA6,10,
suggesting that water diffusion mechanisms at molecular scale are similar. Note, however,
that activation energies for diffusion of various gas and water molecules are found to be of
the order 30-60 kJ/mol in a wide variety of amorphous or semi-crystalline polymers.45 Thus,
such values for the activation energy do not allow discriminating a particular mechanism per
se.
At a molecular level, it is then interesting to investigate the correlation of diffusion to
local movements, more specifically the β relaxation. This secondary relaxation combines
conformational changes around amide groups and hydrogen bond relaxation. There are
several concordant indications that diffusion may be controlled by the lifetime of hydrogen
bonds, that is, by the local environment around a water molecule being hydrogen-bound to
an amide group. First, in polyamides, strong interactions exist between water molecules and
the amide preferential sorption sites, as already mentionned before. Another argument is the
fact that diffusion coefficients are only little affected by the huge variation of the polymer
matrix α relaxation time, as described above.
Following the same procedure as for the α relaxation, the water diffusion coefficients are
plotted as a function of the high frequency β relaxation times for various water activities
and various temperatures in both PA6,6 and PA6,10 in Figure 16.
In this case, the variations of the diffusion coefficients and β relaxation times are of
the same order of magnitude. To assess the contribution of the β relaxation and hydrogen
bonding to the diffusion process, the diffusion characteristic time can be compared to the β
relaxation time and the lifetime of a hydrogen bond. Assuming that water molecules diffuse
between neighboring amide groups, the characteristic time for diffusion is proportional to
the square length of distance over the diffusion coefficient. Based on elementary density
arguments, the average distance d between amide groups can be evaluated to approximately
0.7 nm in PA6,6 (in agreement with simulation results61) and 0.8 nm in PA6,10, due to the
31
10-10
2
4
6
10-9
2
4
6
10-8
2
4
6
10-7
D (
cm
2/s
)
10-8
2 4 6 8
10-7
2 4 6 8
10-6
2 4 6 8
10-5
tb (s)
PA66/water 29°C
35°C
40°C
51°C
slope=1PA610/water 29°C
40°C
51°C
Figure 16: Water diffusion coefficient D as a function of the characteristic β relaxation timesat different temperatures for PA6,6/water and PA6,10/water systems. Each series of pointscorresponds to a given T, each point in a series corresponds to a given water activity. Theline with a slope of 1 is a guide for the eyes.
additional methylene groups. For both polymers, the calculated characteristic diffusion times
tD ≈ d2/2D range from 10−7 to 10−6 s. Estimations for water-amide group interaction energy
can be found in the literature,10,62 based on ab-initio calculations for peptide-water systems in
vacuum. The interaction energy thus obtained is approximately 30-35 kJ/mol. In a polymer
environment, this interaction energy might be different because of hydrophobic contributions.
Taking the relaxation time of a hydrogen bond as Arrhenian τ = τ0 exp [E/RT ] with a
characteristic τ0 of 10−12 to 10−10 s−1 and an activation energy E of 30-35 kJ/mol,11 the
lifetime of a hydrogen bond is estimated between 10−7 and 10−5 s in the experimental
temperature range.
Note that β relaxation has an apparent activation energy of the order of 60 kJ/mol (as
mentioned before), which indicates that it involves more complex, perhaps more cooperative
processes than just the rotation of an amide group or breaking of one hydrogen bond. In
any case, the characteristic β relaxation times are found experimentally in the range 10−7
and 10−6 s, as illustrated in Figure 16. Therefore, the characteristic diffusion time, the β
32
relaxation time and the lifetime of the hydrogen bond are of the same order of magnitude,
which suggests that diffusion of water in polyamide may indeed be limited by the departure
of the water molecule from the amide sorption site. Consequently, the hoping in between
sites should be very fast.
Thus, the values of the diffusion coefficients themselves seem to be compatible with a
very simple picture in which diffusion would be controlled by hoping from one amide group
to the neighboring one.
Since the two polyamides studied here have not been processed with the same method,
a direct comparison would somehow be hazardous. The type of mechanism suggested above
would predict a faster diffusion through a polymer that has sorption sites separated by longer
distances (if tD is similar, then D ∼ d2
2tdis higher when d is higher), which is in accordance
with the experimental observation that water diffusion is faster in PA6,10 than in PA6,6,
either we compare at the same temperature or at equivalent T − Tg. Measured diffusion
coefficients in PA6,10 are 2 to 4 times larger than in PA6,6. However, this ratio is significantly
larger than predicted from the ratio of average distances between amide groups in both
polymers. This difference might arise from the samples microstructures. The crystalline
fraction is larger in PA6,6 than in PA6,10 (38% compared to 23%). Indeed, crystallites,63,64
as well as the rigid amorphous phase, may strongly affect diffusion coefficients. The measured
diffusion coefficient D can be expressed by equation 9:
D =D∗
ξβimm(9)
where D∗ is the diffusion coefficient in the bulk amorphous polymer, βimm is a chain immo-
bilization factor that relates to the fraction of rigid amorphous phase and ξ is the tortuosity
factor that accounts for the increased diffusion path in order to bypass crystallites.65 One
expression for the tortuosity factor proposed in the context of polymers nanocomposites with
layered clay fillers of aspect ratio f is of the form ξ ' 1+ f6Xc, where Xc is the volume fraction
33
of layered objects (taken to be here crystalline lamellae or lamellar stacks) and integration
has been done over all possible lamella orientations.65,66 With Xc varying from 23% to 38%,
it is easy to explain the ratio between diffusion coefficients with reasonable values of the
aspect ratio. Also, the chain immobilization factor should not be the same in the two poly-
mers. Note again, that a direct comparison of diffusion coefficients between polyamides with
different amide group densities would require a detailed control of the processing conditions
and an extensive characterisation of the microstructure.
5 Conclusions
The diffusion of water in semi-crystalline polyamides (PA6,6 and PA6,10) was investigated.
First, it was found that the diffusion of liquid water is apparently Fickian in PA6,10 and
non-Fickian or anomalous in PA6,6. Then, in order to get a more detailed insight on diffusion
mechanisms, a quasi-equilibrium experiment was set up to measure selectively the variation
of the diffusion coefficient as a function of water activity/concentration at equilibrium.
It was thus shown that the diffusion coefficient of water in PA6,6 increases significantly
as the water concentration increases, which accounts for the non-Fickian diffusion in this
polymer. In PA6,10, this variation is much less pronounced, which supports an apparent
Fickian diffusion.
Moreover, the polymer relaxation times associated to the glass transition (α relaxation)
and to the β secondary relaxation of the amorphous phase of the polyamides were measured
or estimated as a function of temperature and water concentration by Broadband Dielectric
Spectroscopy. The α relaxation times decrease by several orders of magnitude, illustrating
the polymer plasticization by water molecules. This variation (typically 6 orders of mag-
nitude) is much more extensive than the variation of diffusion coefficients (a factor 2 to 5
at most) over the activity range from 0 to one, indicating that diffusion is not controled
primarily by the α relaxation in polyamide. Conversely, the variation of the diffusion coef-
34
ficient with water concentration is coherent with that of the β relaxation time. The results
are compatible with a diffusion process controled by the hoping of water molecules between
preferential adsorption sites (amide groups), with which they form hydrogen bonds.
Acknowledgement
The authors thank Danielle Lamberet and Jean-Claude Le Thiesse (Solvay, Lyon) for their
help with DVS measurements and Silvia Arrese-Igor (Centro de Fisica de Materiales, San
Sebastian, Spain) for High Frequency Dielectric Spectroscopy measurements, funded by the
European Soft Matter Infrastructure (ESMI) program (grant no. 262348). The Broadband
Dielectric Spectrometer was funded by the GRAND LYON Metropolitan Council.
References
(1) Kohan, M. Nylon Plastics Handbook ; Wilmington:Hanser, 1995.
(2) Lim, L.; Britt, I.; Tung, M. Journal of Applied Polymer Science 1999, 71, 197.
(3) Rios de Anda, A.; Fillot, L. A.; Rossi, S.; Long, D.; Sotta, P. Polymer Engineering &
Science 2011, 51, 2129–2135.
(4) Starkweather, H. Journal of Applied Polymer Science 1959, 2, 129.
(5) Starkweather, H. Macromolecules 1975, 8, 476.
(6) Garcia, D.; Starkweather, H. Journal of Polymer science: Polymer Physics Edition
1985, 23, 537–555.
(7) Puffr, R.; Sebenda, J. J. Polym. Sci. C 1967, 16, 79–93.
(8) Skirrow, G.; Young, K. Polymer 1974, 15, 771–776.
(9) Auerbach, I.; Carnicom, M. Journal of Applied Polymer Science 1991, 42, 2417.
35
(10) Jorgensen, W.; Swenson, C. J. Am. Chem. Soc. 1985, 107, 1489.
(11) Camacho, W.; Hedenqvist, M. S.; Karlsson, S. Polymer International 2002, 51, 1366–
1370.
(12) Goudeau, S.; Charlot, M.; Vergelati, C.; Muller-Plathe, F. Macromolecules 2004, 37,
8072–8081.
(13) Laurati, M.; Sotta, P.; Long, D. R.; Fillot, L. A.; Arbe, A.; Alegra, A.; Embs, J. P.;
Unruh, T.; Schneider, G. J.; Colmenero, J. Macromolecules 2012, 45, 1676–1687.
(14) Murthy, N. S. Journal of Polymer Science: Part B: Polymer Physics 2006, 44,
17631782.
(15) Reimschuessel, H. K. Journal of Polymer Science: Polymer Physics 1978, 16,
12291236.
(16) Murthy, N. S.; Stamm, M.; Sibilia, J. P.; Krimm, S. Macromolecules 1989, 22,
12611267.
(17) Hedenqvist, M.; Gedde, U. Prog. Polym. Sci. 1996, 21, 299–333.
(18) Flory, P. Journal of the American Chemical Society 1962, 84, 2857–2868.
(19) Murthy, N. S.; Akkapeddi, M. K.; Orts, W. J. Macromolecules 1998, 31, 142–152.
(20) Hutchison, J. L.; Murthy, N. S.; Samulski, E. T. Macromolecules 1996, 29, 5551–5557.
(21) Litvinov, M.; Penning, J. P. Macromolecular Chemistry and Physics 2004, 205, 1721–
1734.
(22) Litvinov, V. M.; Persyn, O.; Miri, V.; Lefebvre, J. M. Macromolecules 2010, 43, 7668–
7679.
(23) Litvinov, V. M.; Koning, C. E.; Tijssen, J. Polymer 2015, 56, 406–415.
36
(24) Adriaensens, P.; Pollaris, A.; Carleer, R.; Vanderzande, D.; Gelan, J.; Litvinov, V. M.;
Tijssen, J. Polymer 2001, 42, 7943–7952.
(25) Adriaensens, P.; Pollaris, A.; Rulkens, R.; Litvinov, V. M.; Gelan, J. Polymer 2004,