Page 1
HLBiologyIA AnthonyHans Jan2016
InvestigationRegardingtheCorrelationBetweenHDIandMortalityRatesduetoStroke
ResearchQuestion
WhatisthecorrelationbetweenHDIandmortalityrateduetostroke(measuredinnumberofdeathsper
100,000ofpopulation),incountrieswithaHDIofabove0.75?
BackgroundResearch
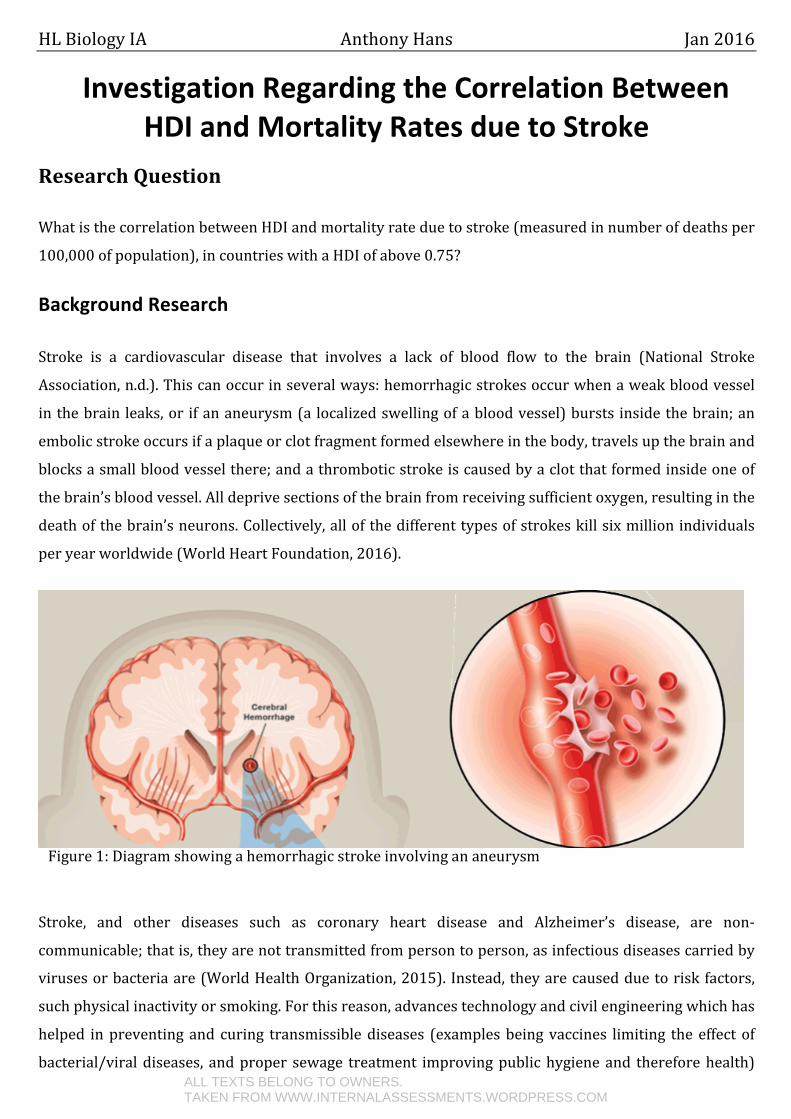
Stroke is a cardiovascular disease that involves a lack of blood flow to the brain (National Stroke
Association,n.d.).Thiscanoccurinseveralways:hemorrhagicstrokesoccurwhenaweakbloodvessel
inthebrainleaks,or ifananeurysm(a localizedswellingofabloodvessel)bursts insidethebrain;an
embolicstrokeoccursifaplaqueorclotfragmentformedelsewhereinthebody,travelsupthebrainand
blocksasmallbloodvesselthere;andathromboticstrokeiscausedbyaclotthatformedinsideoneof
thebrain’sbloodvessel.Alldeprivesectionsofthebrainfromreceivingsufficientoxygen,resultinginthe
deathofthebrain’sneurons.Collectively,allofthedifferenttypesofstrokeskillsixmillionindividuals
peryearworldwide(WorldHeartFoundation,2016).
Stroke, and other diseases such as coronary heart disease and Alzheimer’s disease, are non-
communicable;thatis,theyarenottransmittedfrompersontoperson,asinfectiousdiseasescarriedby
virusesorbacteriaare(WorldHealthOrganization,2015). Instead,theyarecausedduetoriskfactors,
suchphysicalinactivityorsmoking.Forthisreason,advancestechnologyandcivilengineeringwhichhas
helped inpreventingand curing transmissiblediseases (examplesbeingvaccines limiting theeffectof
bacterial/viraldiseases, andproper sewage treatment improvingpublichygieneand thereforehealth)
Figure1:Diagramshowingahemorrhagicstrokeinvolvingananeurysm
ALL TEXTS BELONG TO OWNERS.TAKEN FROM WWW.INTERNALASSESSMENTS.WORDPRESS.COM
Page 2
2
maynotnecessarilyworktoslowthegrowingprevalenceofnon-communicablediseases,whicharenot
causedbytransmissions.
Inthisinvestigation,HDI(humandevelopmentindex)willbeusedasthemetricbywhichdevelopmentis
measured. This is an index incorporating education, GNI per capita, and healthcare, using various
indicators to measure each component and therefore the overall HDI (Human Development Report,
2015).AnHDIvalueof0.75orhighercanthereforebeareasonableindicatorofadevelopedcountry.
Although certainly not as prominent as other non-communicable diseases, such as coronary heart
diseaseorcancer–bothofwhicharetheleadingcausesofdeathinmostdevelopedcountries–strokeis
bynomeansinsignificant.Evenifastrokeattackdoesnotclaimthelivesofitsvictims,thedevastationit
sooftencauses to theafflictedand their familiesarehugelyparalyzing.Therefore, Ihavedevoted this
investigationtothestudyofstroke’sprevalence,inhopesofbetterunderstandingitinthelargerpicture.
Therefore, this research aims to determine the impact of human development on the number of
mortalities caused by strokes; where human development is measured by HDI, and the number of
mortalitiesistakenperannumandper100,000.
Hypothesis
ItcanbepredictedthereisanegativecorrelationbetweentheHDIofacountryandthenumberoflethal
strokecasesthere.
This is because when very high HDI countries are concerned, strokes aremore easily treatable with
advanced healthcare, allowing stroke patients a higher recovery rate. Therefore, despite a higher life
expectancyandmorepeople suffering fromstrokes,highlydevelopedcountriesmightbeable to treat
strokesmore easily thanotherdiseases such as cancer or coronaryheart disease, hence reducing the
mortalityrateduetostrokes
Therefore,thehypothesesforstatisticaltestingareasfollows:
NullHypothesis:HDIhasnoimpactonthemortalityrateduetostroke.
AlternativeHypothesis:HDIwillhaveanegativecorrelationonthemortalityrateduetostroke
ALL TEXTS BELONG TO OWNERS.TAKEN FROM WWW.INTERNALASSESSMENTS.WORDPRESS.COM
Page 3
3
Materials
l MicrosoftExcel(usedforallcalculationsanddataprocessing)
l HDIdatabase(for this, theHumanDevelopmentReportspublishedby theUNwillbeused,which
maybefoundinthislink:http://hdr.undp.org/en/data)
l WHO database on mortalities due to cerebrovascular diseases (may be found in this link:
http://www.who.int/healthinfo/global_burden_disease/estimates/en/index1.html, note that the
deathestimatesfor2000and2012isused)
l World Bank database on total population (may be found in this link:
http://databank.worldbank.org/data/home.aspx)
Data from these sources are chosen for two reasons: reliability (as the UN and World Bank can be
consideredasreliableandtrustworthysourcesforsuchdataduetothenatureoftheirorganization),and
alackofotherdatabases.
Methodology&TrialInvestigation
The following trial investigationwasconductedwithaselectionofsevennations,whichcanalsobe
used to demonstrate the methodology of this investigation. These countries are: Austria, Denmark,
Germany, Greece, Hungary, Portugal, and Spain. These countries are chosen as they are all European
OECDnations,andthereforeshouldhavereasonablysimilarculturalandeconomicstatus,reducingthe
possible impact of unrelated outside factors such as lifestyle habits or dietary preferences. The
correlationshouldthereforebereasonablystrong,demonstratingthatthisinvestigationwillwork.
Firstly,dataregardingthepopulation,humandevelopmentindex,andpopulationwillbeobtainedfrom
their respectivedatabases for theyears2000and2012 (theonlyyearswhen theWHOhaspresented
dataregardingcausesofmortalityontheirwebsite):
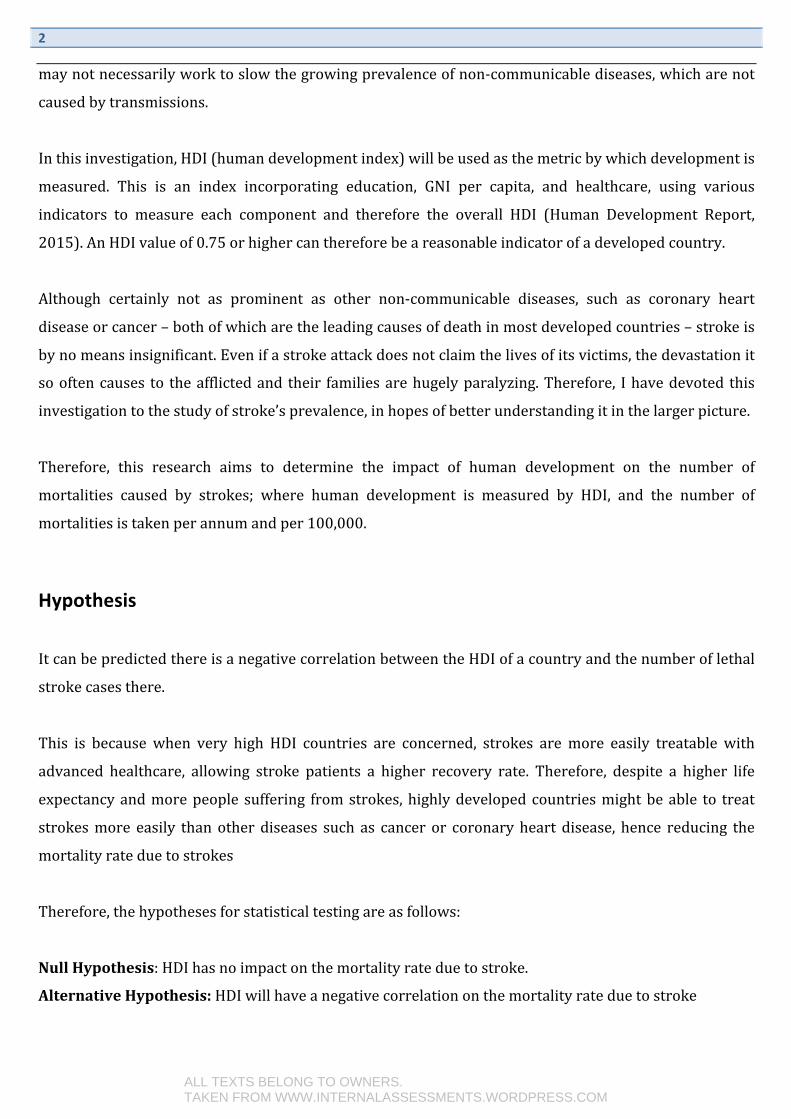
Table1:Rawdatashowingtheestimateddeathcountsduetostroke,populationandtheHDIofselectedcountriesinthespecifiedyears
CountryHumanDevelopmentIndex Estimateddeathcountsdueto
stroke(in'000sofdeaths) Population
2000 2012 2000 2012 2000 2012 Austria 0.836 0.884 8.8 5 8,011,566 8,429,991Denmark 0.862 0.921 5.2 3.6 5,339,616 5,591,572Germany 0.855 0.915 82.4 59.9 82,211,508 80,425,823Greece 0.799 0.865 22.9 20.7 10,805,808 11,045,011Hungary 0.769 0.823 18.8 13.3 10,210,971 9,920,362Portugal 0.782 0.827 22.8 12.8 10,289,898 10,514,844Spain 0.827 0.874 36.6 29.6 40,263,216 46,773,055
ALL TEXTS BELONG TO OWNERS.TAKEN FROM WWW.INTERNALASSESSMENTS.WORDPRESS.COM
Page 4
4
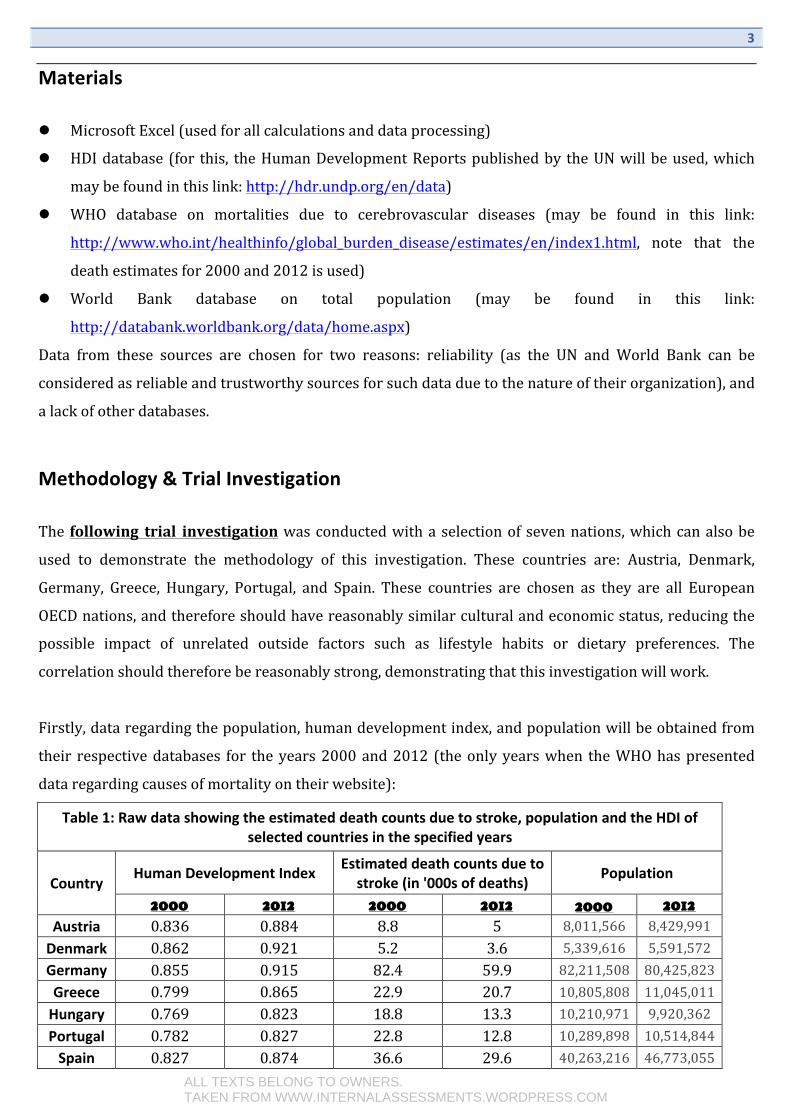
Tocalculatedeathrates,theestimateddeathcountsduetostrokecanbedividedbythepopulation.This
is the death rate due to stroke per person; to find the more conventional death rate per 100,000
population,thenumbercanbemultipliedby100,000.
Samplecalculations:Austria’sdeathrateduetostrokeper100,000populationin2000
𝐷𝑒𝑎𝑡ℎ 𝑟𝑎𝑡𝑒 𝑝𝑒𝑟 𝑝𝑒𝑟𝑠𝑜𝑛 =𝐸𝑠𝑡𝑖𝑚𝑎𝑡𝑒𝑑 𝑑𝑒𝑎𝑡ℎ 𝑐𝑜𝑢𝑛𝑡
𝑇𝑜𝑡𝑎𝑙 𝑝𝑜𝑝𝑢𝑙𝑎𝑡𝑖𝑜𝑛
=8.8
8011566= 0.001098412 𝐷𝑒𝑎𝑡ℎ 𝑟𝑎𝑡𝑒 𝑝𝑒𝑟 100,000 𝑝𝑜𝑝𝑢𝑙𝑎𝑡𝑖𝑜𝑛 = 𝐷𝑒𝑎𝑡ℎ 𝑟𝑎𝑡𝑒 𝑝𝑒𝑟 𝑝𝑒𝑟𝑠𝑜𝑛 × 100,000 = 0.001098412 × 100,000 = 109.8 (Note that the final result is in1decimalplace,as thedata foundondeathcounts isalso in1decimal
place.)
Table2:Processeddatashowingthemortalityratescausedduetostrokes
CountryMortalityratesduetostrokeperperson
Mortalityratesduetostrokeper100,000
population2000 2012 2000 2012
Austria 0.001098412 0.000593120 109.8 59.3Denmark 0.000973853 0.000643826 97.4 64.4Germany 0.001002293 0.000744786 100.2 74.5Greece 0.002119231 0.001874149 211.9 187.4Hungary 0.001841157 0.001340677 184.1 134.1Portugal 0.002215765 0.001217327 221.6 121.7Spain 0.000909018 0.000632843 90.9 63.3
Fromhere,itisasimplematterofaveragingthedeathratesandHDIforbothyears,thencomparingthe
twovaluesforcorrelation:
ALL TEXTS BELONG TO OWNERS.TAKEN FROM WWW.INTERNALASSESSMENTS.WORDPRESS.COM
Page 5
5
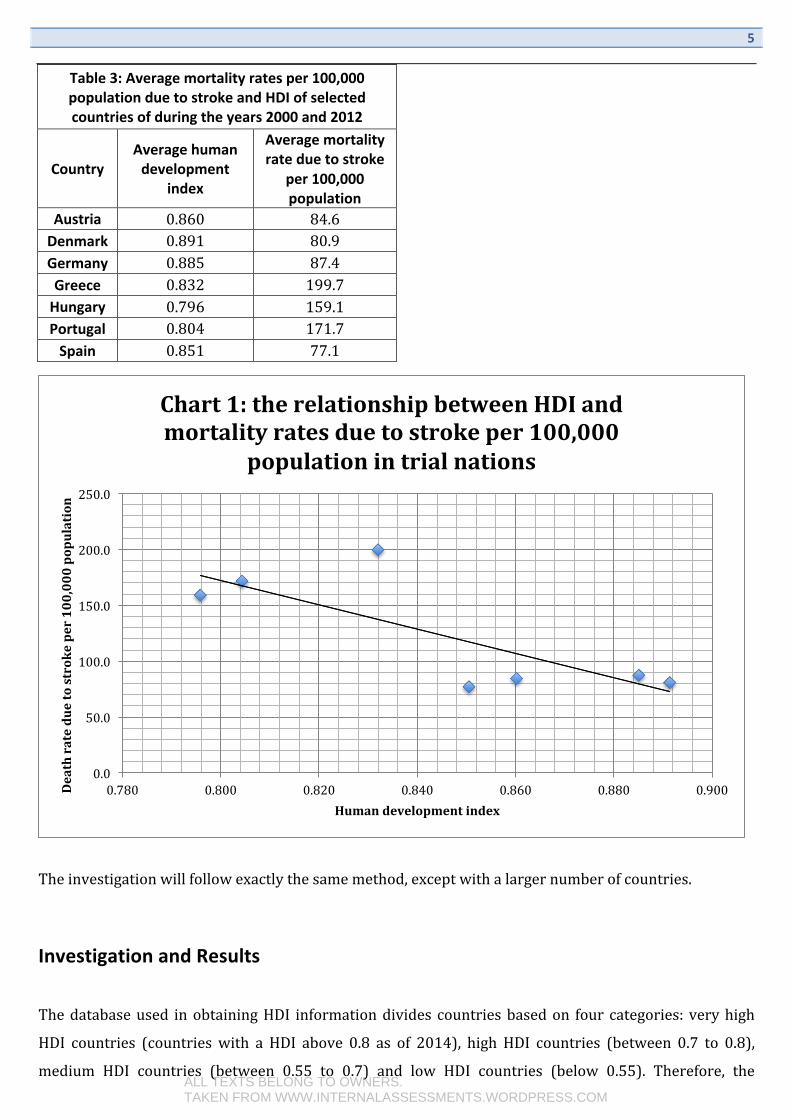
Table3:Averagemortalityratesper100,000populationduetostrokeandHDIofselectedcountriesofduringtheyears2000and2012
CountryAveragehumandevelopment
index
Averagemortalityrateduetostroke
per100,000population
Austria 0.860 84.6Denmark 0.891 80.9Germany 0.885 87.4Greece 0.832 199.7Hungary 0.796 159.1Portugal 0.804 171.7Spain 0.851 77.1
Theinvestigationwillfollowexactlythesamemethod,exceptwithalargernumberofcountries.
InvestigationandResults
Thedatabaseused inobtainingHDI informationdivides countriesbasedon four categories: veryhigh
HDI countries (countrieswith a HDI above 0.8 as of 2014), high HDI countries (between 0.7 to 0.8),
medium HDI countries (between 0.55 to 0.7) and low HDI countries (below 0.55). Therefore, the
0.0
50.0
100.0
150.0
200.0
250.0
0.780 0.800 0.820 0.840 0.860 0.880 0.900Deathrateduetostrokeper100,000population
Humandevelopmentindex
Chart1:therelationshipbetweenHDIandmortalityratesduetostrokeper100,000
populationintrialnations
ALL TEXTS BELONG TO OWNERS.TAKEN FROM WWW.INTERNALASSESSMENTS.WORDPRESS.COM
Page 6
6
countriescategorizedashavinga“veryhighHDI”willbeusedinthisinvestigation,asrelativelyfewof
them have a HDI below 0.75 during 2000 (which is theminimumHDI used for this investigation, as
statedintheresearchquestion).Astherearerelativelyfewcountriesinthiscategory–only49–anda
fewofthemeitherlackdata(suchasLiechtenstein)orhaveapopulationthatisrelativelysmall(suchas
SingaporeorHongKong),randomsamplingisnotnecessary;only18ofthesecountrieshavesufficient
data,anHDIthatisconsistentlyabove0.75andapopulationsizegreaterthan10millionsince2000,so
these18countriesshallbeused.
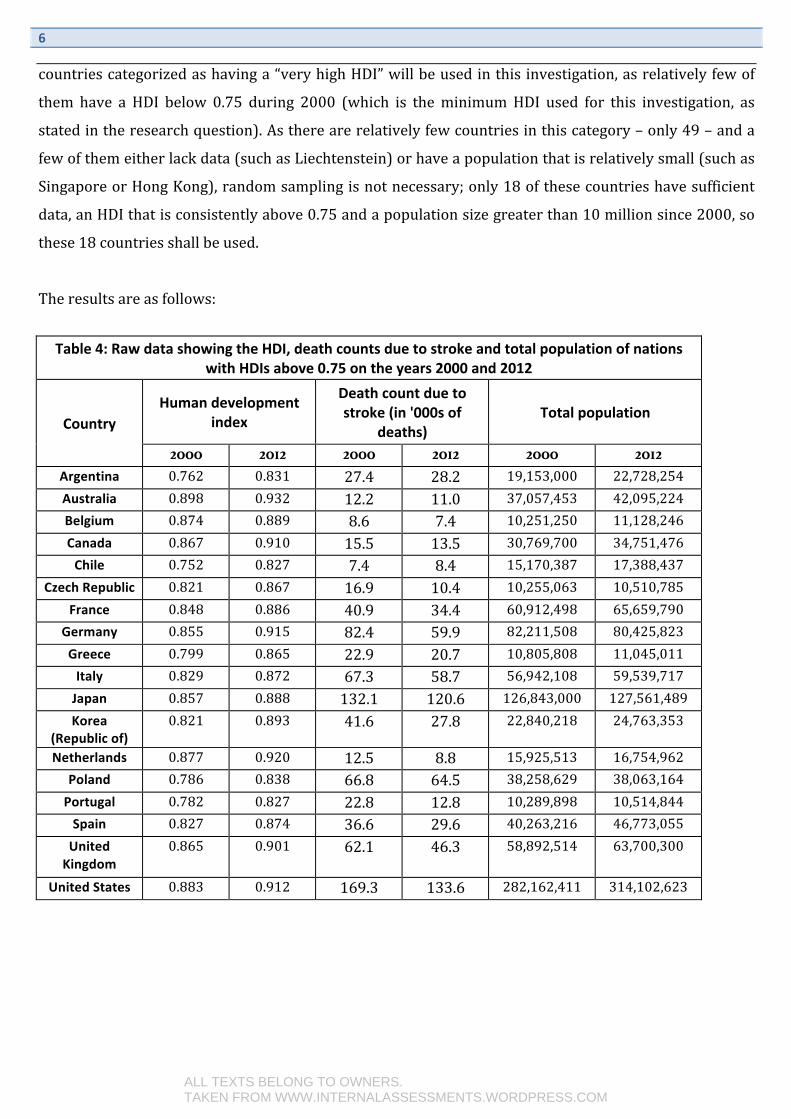
Theresultsareasfollows:
Table4:RawdatashowingtheHDI,deathcountsduetostrokeandtotalpopulationofnations
withHDIsabove0.75ontheyears2000and2012
CountryHumandevelopment
index
Deathcountduetostroke(in'000sof
deaths)Totalpopulation
2000 2012 2000 2012 2000 2012 Argentina 0.762 0.831 27.4 28.2 19,153,000 22,728,254Australia 0.898 0.932 12.2 11.0 37,057,453 42,095,224Belgium 0.874 0.889 8.6 7.4 10,251,250 11,128,246Canada 0.867 0.910 15.5 13.5 30,769,700 34,751,476Chile 0.752 0.827 7.4 8.4 15,170,387 17,388,437
CzechRepublic 0.821 0.867 16.9 10.4 10,255,063 10,510,785France 0.848 0.886 40.9 34.4 60,912,498 65,659,790
Germany 0.855 0.915 82.4 59.9 82,211,508 80,425,823Greece 0.799 0.865 22.9 20.7 10,805,808 11,045,011Italy 0.829 0.872 67.3 58.7 56,942,108 59,539,717Japan 0.857 0.888 132.1 120.6 126,843,000 127,561,489Korea
(Republicof)0.821 0.893 41.6 27.8 22,840,218 24,763,353
Netherlands 0.877 0.920 12.5 8.8 15,925,513 16,754,962Poland 0.786 0.838 66.8 64.5 38,258,629 38,063,164Portugal 0.782 0.827 22.8 12.8 10,289,898 10,514,844Spain 0.827 0.874 36.6 29.6 40,263,216 46,773,055UnitedKingdom
0.865 0.901 62.1 46.3 58,892,514 63,700,300
UnitedStates 0.883 0.912 169.3 133.6 282,162,411 314,102,623
ALL TEXTS BELONG TO OWNERS.TAKEN FROM WWW.INTERNALASSESSMENTS.WORDPRESS.COM
Page 7
7
Table5:Processeddatashowingthemortalityratecausedbystrokeintheselectednationsin2000and2012
CountryMortalityrateduetostrokeperperson Mortalityrateduetostrokeper
100,000population2000 2012 2000 2012
Argentina 0.001432383 0.001241697 143.2 124.2Australia 0.00032908 0.00026096 32.9 26.1Belgium 0.000840013 0.000661172 84.0 66.1Canada 0.000503748 0.000387472 50.4 38.7Chile 0.000490413 0.000482589 49.0 48.3
CzechRepublic 0.001647081 0.000988891 164.7 98.9France 0.00067176 0.000524081 67.2 52.4
Germany 0.001002107 0.000744576 100.2 74.5Greece 0.002114838 0.001870679 211.5 187.1Italy 0.001182507 0.000985131 118.3 98.5Japan 0.001041133 0.000945319 104.1 94.5
Korea(Republicof) 0.001819974 0.00112458 182.0 112.5Netherlands 0.000787218 0.000522311 78.7 52.2
Poland 0.001745275 0.001693969 174.5 169.4Portugal 0.00221199 0.001213221 221.2 121.3Spain 0.000909327 0.000632348 90.9 63.2
UnitedKingdom 0.001054875 0.000726532 105.5 72.7UnitedStates 0.000600084 0.000425269 60.0 42.5
Table6:theaverageHDIandmortalityratesduetostrokeduringthe
years2000and2012
Country Averagehumandevelopmentindex
Mortalityrateduetostrokeper100,000
populationArgentina 0.796 133.7Australia 0.915 29.5Belgium 0.881 75.1Canada 0.889 44.6Chile 0.790 48.7
CzechRepublic 0.844 131.8France 0.867 59.8
Germany 0.885 87.3Greece 0.832 199.3Italy 0.850 108.4Japan 0.872 99.3
Korea(Republicof) 0.857 147.2Netherlands 0.899 65.5
Poland 0.812 172.0Portugal 0.804 171.3Spain 0.850 77.1
UnitedKingdom 0.883 89.1UnitedStates 0.897 51.3ALL TEXTS BELONG TO OWNERS.
TAKEN FROM WWW.INTERNALASSESSMENTS.WORDPRESS.COM
Page 8
8
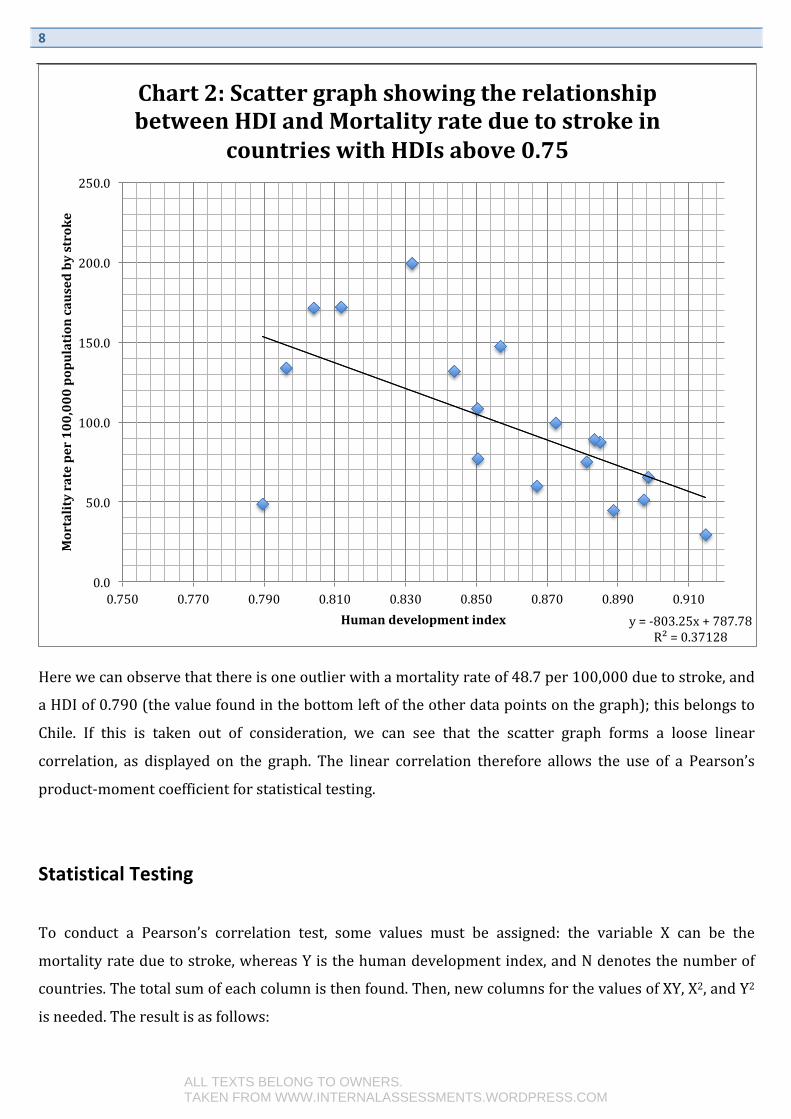
Herewecanobservethatthereisoneoutlierwithamortalityrateof48.7per100,000duetostroke,and
aHDIof0.790(thevaluefoundinthebottomleftoftheotherdatapointsonthegraph);thisbelongsto
Chile. If this is taken out of consideration, we can see that the scatter graph forms a loose linear
correlation, as displayed on the graph. The linear correlation therefore allows the use of a Pearson’s
product-momentcoefficientforstatisticaltesting.
StatisticalTesting
To conduct a Pearson’s correlation test, some values must be assigned: the variable X can be the
mortalityrateduetostroke,whereasYisthehumandevelopmentindex,andNdenotesthenumberof
countries.Thetotalsumofeachcolumnisthenfound.Then,newcolumnsforthevaluesofXY,X2,andY2
isneeded.Theresultisasfollows:
y=-803.25x+787.78R²=0.37128
0.0
50.0
100.0
150.0
200.0
250.0
0.750 0.770 0.790 0.810 0.830 0.850 0.870 0.890 0.910
Mortalityrateper100,000populationcausedbystroke
Humandevelopmentindex
Chart2:ScattergraphshowingtherelationshipbetweenHDIandMortalityrateduetostrokein
countrieswithHDIsabove0.75
ALL TEXTS BELONG TO OWNERS.TAKEN FROM WWW.INTERNALASSESSMENTS.WORDPRESS.COM
Page 9
9
Table7:Pearson’sproductmomentcorrelationtestontheresultsontable5
N X Y XY X2 Y2
1 133.7 0.796 106.425 17875.7 0.634
2 29.5 0.915 26.993 870.3 0.837
3 75.1 0.881 66.163 5640.0 0.776
4 44.6 0.889 39.649 1989.2 0.790
5 48.7 0.790 38.473 2371.7 0.623
6 131.8 0.844 111.239 17371.2 0.712
7 59.8 0.867 51.847 3576.0 0.752
8 87.3 0.885 77.261 7621.3 0.783
9 199.3 0.832 165.818 39720.5 0.692
10 108.4 0.850 92.140 11750.6 0.723
11 99.3 0.872 86.590 9860.5 0.761
12 147.2 0.857 126.15 21667.8 0.734
13 65.5 0.899 58.885 4290.3 0.808
14 172.0 0.812 139.664 29584.0 0.659
15 171.3 0.804 137.725 29343.7 0.647
16 77.2 0.850 65.620 5959.8 0.723
17 89.1 0.883 78.675 7938.8 0.780
18 51.3 0.897 46.016 2631.7 0.805
Sum 1791.1 15.423 1515.333 219997.4 13.241
Fromhere,thefollowingequationisusedtofindthePearson’scorrelationvalue:
𝑟 =𝑛 𝑥𝑦 − ( 𝑥)( 𝑦)
(𝑛 𝑥! − ( 𝑥)!)(𝑛 𝑦! − ( 𝑦)!)
Utilizingthisformula,thefollowingresultmaybefound:
𝑟 =18 1515.333 − (1791.1)(15.423)
18 219997.4 − 1791.1! 18 13.241 − 15.423!
𝑟 = −0.586
Thisvaluemeansthatthereisareasonablystrongnegativecorrelationbetweenthehumandevelopment
indexofadevelopedcountry,andthemortalityratescausedbystroke.Furthermore,itisfoundthatina
Pearson’scorrelationtest,thecriticalvalueforacorrelationwith17degreesoffreedom(foundbythe
numberoftrials,18,minus1),andalevelofconfidenceof0.05,is0.482(StatisticsSolutions,n.d.).Ther
valueobtainedfromthisinvestigationhasahigherabsolutevaluethanthis;therefore,wecanrejectthe
ALL TEXTS BELONG TO OWNERS.TAKEN FROM WWW.INTERNALASSESSMENTS.WORDPRESS.COM
Page 10
10
nullhypothesisandconcludewiththealternativehypothesis,whichstatesthatHDIwillhaveanegative
correlationonthemortalityrateduetostroke.
Conclusion
Torestate the researchquestion:What is the correlation betweenHDI andmortality rate due to
stroke (measured in number of deaths per 100,000 of population), in countrieswith a HDI of
above0.75?
This investigation has found that HDI has a negative correlationwithmortality rate due to stroke in
developedcountries, ina linear trend,supporting thehypothesismadeearlier.Abiologicalexplanation
forthismightbethatstrokesareeasiertotreatthanothernon-communicablediseases,suchascancer.
This means that, even though a greater proportion of people in developed countries will have been
exposed to more risk factors for strokes (such as trans fats, sedentary behavior, etc.), and advanced
healthcare system can still compensate by improving the chance of recovery, whereas another non-
communicable disease such as cancer is much more difficult to treat, and hence is more difficult to
compensatewithgoodhealthcarestandards.Thissaysnothingoftheeconomicandsocialrepercussions
ofcontractingstrokes,evenwhenonerecovers,whichisbestreservedforanotherinvestigation.
ThisissupportedbyastudypublishedonBioMedCentral(Wu,WooandZhang,2013);inthisstudy,a
correlationbetween socioeconomic statusand stroke isbeing tested, rather thanHDI.However, these
two variables are reasonably similar as ameasure of a population’swell-being, and can therefore be
assumed to be somewhat comparable. This study has claimed that, whereas an improvement in
socioeconomicstatus increasedstrokemortality in lessdevelopedareas, theopposite is true formore
developedcountriesandregions,hencesupportingthisinvestigation’sfindings.
Evaluation
Astrengthofthisinvestigationisthestrongreliabilityofthedataused;sincethecountriesusedforthis
investigationarerelativelymodernizedandhavepopulationslargerthan10million,itcanbeexpected
thatthedatacollectedisnotonlyaccurate,butrepresentative.Thereisalsoasufficientrangeanddata
collectedtodrawaconclusionfrom.
However,thisinvestigationdoeshavesomeissues:
ALL TEXTS BELONG TO OWNERS.TAKEN FROM WWW.INTERNALASSESSMENTS.WORDPRESS.COM
Page 11
11
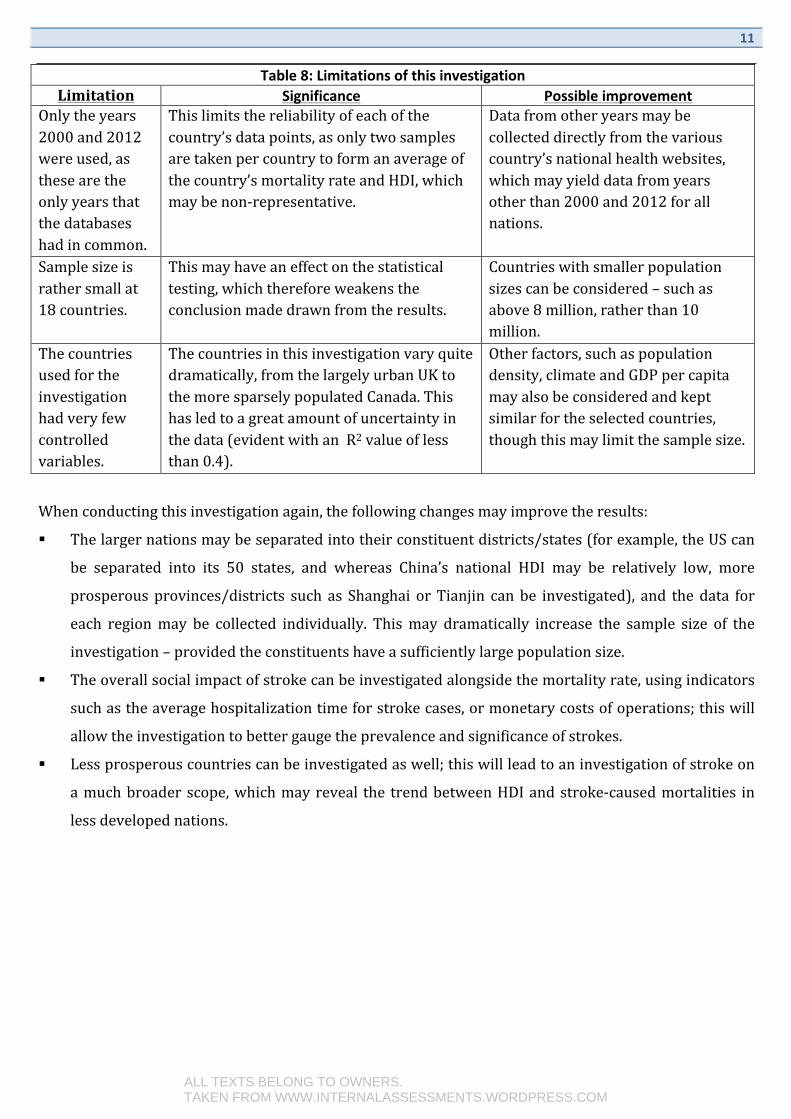
Table8:LimitationsofthisinvestigationLimitation Significance Possibleimprovement
Onlytheyears2000and2012wereused,asthesearetheonlyyearsthatthedatabaseshadincommon.
Thislimitsthereliabilityofeachofthecountry’sdatapoints,asonlytwosamplesaretakenpercountrytoformanaverageofthecountry’smortalityrateandHDI,whichmaybenon-representative.
Datafromotheryearsmaybecollecteddirectlyfromthevariouscountry’snationalhealthwebsites,whichmayyielddatafromyearsotherthan2000and2012forallnations.
Samplesizeisrathersmallat18countries.
Thismayhaveaneffectonthestatisticaltesting,whichthereforeweakenstheconclusionmadedrawnfromtheresults.
Countrieswithsmallerpopulationsizescanbeconsidered–suchasabove8million,ratherthan10million.
Thecountriesusedfortheinvestigationhadveryfewcontrolledvariables.
Thecountriesinthisinvestigationvaryquitedramatically,fromthelargelyurbanUKtothemoresparselypopulatedCanada.Thishasledtoagreatamountofuncertaintyinthedata(evidentwithanR2valueoflessthan0.4).
Otherfactors,suchaspopulationdensity,climateandGDPpercapitamayalsobeconsideredandkeptsimilarfortheselectedcountries,thoughthismaylimitthesamplesize.
Whenconductingthisinvestigationagain,thefollowingchangesmayimprovetheresults:
§ Thelargernationsmaybeseparatedintotheirconstituentdistricts/states(forexample,theUScan
be separated into its 50 states, and whereas China’s national HDI may be relatively low, more
prosperousprovinces/districts such as Shanghai orTianjin canbe investigated), and thedata for
each regionmay be collected individually. Thismay dramatically increase the sample size of the
investigation–providedtheconstituentshaveasufficientlylargepopulationsize.
§ Theoverallsocialimpactofstrokecanbeinvestigatedalongsidethemortalityrate,usingindicators
suchastheaveragehospitalizationtimeforstrokecases,ormonetarycostsofoperations;thiswill
allowtheinvestigationtobettergaugetheprevalenceandsignificanceofstrokes.
§ Lessprosperouscountriescanbeinvestigatedaswell;thiswillleadtoaninvestigationofstrokeon
amuchbroaderscope,whichmayreveal the trendbetweenHDIandstroke-causedmortalities in
lessdevelopednations.
ALL TEXTS BELONG TO OWNERS.TAKEN FROM WWW.INTERNALASSESSMENTS.WORDPRESS.COM
Page 12
12
Bibliography
WorldHealthOrganization,(2015).NoncommunicableDiseases–FactSheet.[online]Availableat:
http://www.who.int/mediacentre/factsheets/fs355/en/
WorldHeartFederation,(2016).Stroke.[online]Availableat:
http://www.world-heart-federation.org/cardiovascular-health/stroke/
NationalStrokeAssociation,(2017).HemorrhagicStroke.[online]Availableat:
http://www.stroke.org/understand-stroke/what-stroke
NationalHealthService,(2015).Whatarecerebrovasculardiseases?[online]Availableat:
http://www.nhs.uk/conditions/cerebrovascular-disease/Pages/Definition.aspx
HumanDevelopmentReports,(2015).HumanDevelopmentData(1980–2015).[online]Availableat:
http://hdr.undp.org/en/data
WorldHealthOrganization,(2017).Estimatesfor2000–2012.[online]Availableat:
http://www.who.int/healthinfo/global_burden_disease/estimates/en/index1.html
TheWorldBank,(2017).Explore.Create.Share:DevelopmentData.[online]Availableat:
http://databank.worldbank.org/data/home.aspx
StatisticsSolutions,(n.d).TableofCriticalValues:PearsonCorrelation.[online]Availableat:
http://statisticssolutions.com/table-of-critical-values-pearson-correlation/
Wu, S., Woo, S., and Zhang, X., (2013). Worldwide socioeconomic status and stroke mortality: an
ecologicalstudy.BioMedCentral.[online].Availableat:
https://www.ncbi.nlm.nih.gov/pmc/articles/PMC3695775/
HumanDevelopmentReports,(2015).HumanDevelopmentIndex(HDI).[online]Availableat:
http://hdr.undp.org/en/content/human-development-index-hdi
ALL TEXTS BELONG TO OWNERS.TAKEN FROM WWW.INTERNALASSESSMENTS.WORDPRESS.COM


![INHALT - CONTENTS - MATIÈRE · RHZ(DW10ATED); (66kW-120kW) 1.6 HDi; 1.6 HDi 110; 1.6 HDi 110 FAP; 1.6 HDi 110 FAP [04]; 1.6 HDi 110FAP; 1.6 HDi 90; 1.6 HDi 90 [04]; 2.0 HDi; 2.0](https://static.documents.pub/doc/80x56/605cc6e9948bf00b8613e09d/inhalt-contents-matire-rhzdw10ated-66kw-120kw-16-hdi-16-hdi-110-16.jpg)


