52


Investigations into the Association of IL28B Genotype and the Metabolic Profile of Patients With and Without Chronic Hepatitis C
A thesis submitted in partial fulfillment of the requirements for the degree of Master of Science at George Mason University
By
Leah Byars Bachelor of Science
University of Virginia, 2011
Director: Ancha Baranova, Associate Professor Department of Molecular and Microbiology
Spring Semester 2013 George Mason University
Fairfax, VA

ii
Copyright 2013 Leah Byars All Rights Reserved

iii
ACKNOWLEDGEMENTS
I would like to express my sincere thanks to my advisors, professors, family, friends, and co-workers. I would especially like to thank Dr. Baranova, for being an excellent and inspirational mentor, and Dr. Estep, for his patience and guidance. I would also like to thank Dr. Birerdinc, Dr. Mehta, Katie Doyle, Maria Keaton, Caitlin Koob, and Ashley Greer, along with the rest of Dr. Baranova’s lab. I appreciate all of your support throughout this process.

iv
TABLE OF CONTENTS
Page List of Tables……………………………………………………………………………v List of Figures…………………………………………………………………………..vi Abstract................................................................................................................……....vii Chapter 1.......................................................................................................................…1 Chapter 2.........................................................................................................................13 Chapter 3.........................................................................................................................20 Chapter 4 ........................................................................................................................31 Chapter 5.........................................................................................................................35 List of References.……………………………………………………………………...37

v
LIST OF TABLES
Table Page ATP III Clinical Identification of Metabolic Syndrome…………………………….……8 WHO Clinical Criteria for Metabolic Syndrome…………………………………………8 Primer Sequences for T-ARMS-PCR……………………………………………………15 Sample Spectrophotometer Results……………………………………………………...20 Metabolic and Demographic Characteristics of Full Cohort of Patients………………...23 Spearman Correlation Between CC Genotype and Investigated Factors in All Patients..25 Spearman Correlation Between CC Genotype and Investigated Factors in HCV Patients…………………………………………………………………………………...27 Spearman Correlation Between CC Genotype and Investigated Factors in NAFLD Patients…………………………………………………………………………………...28 Average Values for Each Investigated Metabolic Factor in NAFLD Patients…………..29
vi
LIST OF FIGURES
Figure Page Allele frequencies of the SNP rs12979860 among different ethnic populations………...10 Location of rs12979860 SNP…………………………………………............………….14 T-ARMS-PCR Primer Amplicons……………………………………………………….16 IL28B Allele Separation Using Gel Electrophoresis…………………………………….16 PCR Protocol…………………………………………………………………………….17 qPCR SNP Genotyping Amplification Graph…………………………………………...19 Comparison of Average Values for Investigated Metabolic Factors in NAFLD Patients.30

ABSTRACT
INVESTIGATIONS INTO THE ASSOCIATION OF IL28B GENOTYPE AND THE METABOLIC PROFILE OF PATIENTS WITH AND WITHOUT CHRONIC HEPATITIS C Leah Byars, MS George Mason University, 2013 Thesis Director: Dr. Ancha Baranova
Hepatitis C Virus (HCV) is a viral infectious disease that affects an estimated
130-170 million people worldwide. Most of those infected (80%) go on to develop a
chronic infection. Until recently, the standard treatment for those with chronic HCV was
a combination of pegylated interferon-α (PEG-IFN-α) and the antiviral ribavirin (RBV).
In treatment-naive genotype 1 HCV patients, the combination of PEG-IFN-α and RBV
typically leads to Sustained Virological Response (SVR) rates between 47% and 54%. In
a number of recent studies, the IL28B gene has been shown to play an important role in
the outcome of HCV treatment. A particular single nucleotide polymorphism (SNP) on
chromosome 19q13 (rs12979860), commonly referred to as the “IL28B variant,” is
strongly associated with SVR or lack of it. Metabolic syndrome (MetS) is a group of
medical disorders usually associated with obesity. Some evidence suggests that HCV
infection exacerbates this condition, possibly by causing increased insulin resistance (IR)

and promoting visceral obesity even further. Metabolic abnormalities have also been
shown to influence patients’ response to HCV treatment. Recent, but not conclusive,
evidence suggests that, in addition to influencing response to HCV treatment and SVR
rates, the IL28B genotypes may be associated with metabolic confounders of HCV such
as insulin resistance and metabolic syndrome. This study investigates a possible
connection between IL28B genotype and MetS components in patients with and without
chronic HCV. As expected, correlations between IL28B genotype and SVR, as well as
between metabolic profile and SVR, were revealed. Further studies of a connection
between IL28B genotype and metabolic outcomes are warranted.

1
CHAPTER 1: INTRODUCTION
1.1 Hepatitis C
Hepatitis C Virus (HCV) is a viral infectious disease that affects an estimated 170 million
people worldwide (Houghton, 2005). Most of those infected (80%) develop chronic
infection known as chronic hepatitis due to HCV (CH-C) (Nelson et al., 2011). HCV is
the most common cause of chronic liver disease, as it accounts for an estimated 27% of
cirrhosis and 25% of primary hepatocellular carcinoma (Alter, 2007). HCV-related
cirrhosis is the most common cause of liver transplantation, however, the virus usually
reappears in the transplant. In fact, recent data suggests that ten percent of transplant
recipients progress to cirrhosis within 3 years of transplant (Berenguer, 2002). HCV can
also cause gastric varices, and, in some cases, esophageal cancer (Fraquelli et al., 2012).
In general, HCV causes inflammation of the liver that can later lead to fibrosis and
ultimately, to the development of cirrhosis. Hepatitis C progresses through several stages
of infection. The first stage, acute infection, causes symptoms in about 15% of cases
(Maheshwari et al., 2008). Initial symptoms are generally mild, involve overall aches and
malaise, and usually do not include jaundice. The virus spontaneously clears in up to 20%
of acute infections, most often in patients who are females (Rao et al., 2012). On the

2
other hand, 80% of those infected with HCV who do not spontaneously clear the virus
progress to the next stage of chronic infection. Oftentimes there are minimal or no
symptoms for many years, or even decades, at the chronic stage. The most common
symptom is fatigue, which can be associated with any number of illnesses, making early
diagnosis more difficult.
Occasionally, infection with HCV can progress to extrahepatic diseases, including
include type 2 diabetes, thrombocytopenia, Sjögren's syndrome, and B-cell
lymphoproliferative disorders. Thrombocytopenia, a decrease in amount of platelets in
the blood, is estimated to occur in up to 45% of those infected with chronic HCV (Louie
et al., 2011). HCV infection is also associated with mixed cryoglobulinemia, which
involves inflammation of small to medium sized blood vessels due to deposits of
cryoglobulins, an immunoglobulin that precipitates at low temperatures and dissolve
upon rewarming (Iannuzzella et al., 2010). The mechanisms that link some of these
diseases with HCV remain unknown; what is clear is that HCV’s effects are not limited
to only the liver.
With time, HCV infection commonly results in cirrhosis. Up to 30% of patients with
chronic HCV, most commonly, males, develop cirrhosis over 30 years (Rosen et al.,
2011). Cirrhosis is also more common in those co-infected with Hepatitis B, HIV, or
alcoholics. Liver cirrhosis is associated with a 20-fold greater risk for hepatocellular
carcinoma; these risks increase to 100-fold in cases of simultaneous excessive alcohol use
3
(Mueller et al., 2009). Cirrhosis is commonly associated with severe symptoms of portal
hypertension, abdominal accumulation of fluid (ascites), jaundice, varices, and hepatic
encephalopathy (Kuske et al., 2012).
The HCV virus is a small, enveloped, single-stranded positive sense RNA virus, and is a
member of the Flaviviridae family. There are seven major genotypes of HCV, which are
indicated by the numbers 1-7. In the United States, the majority of cases, about 70%, are
caused by genotype 1, followed by 20% caused by genotype 2. Genotype 1 is also the
most prevalent in South America and Europe. The remaining genotypes are responsible
for about 1% of U.S. cases each (Nakano et al., 2011).
In the 20th century, due to the increased use of recreational drugs and injectable medical
therapies, the spread of HCV increased to an unprecedented level (Alter, 2007). HCV
infection is often asymptomatic for years, or even decades, making transmission even
more likely. An estimated 3-4 million people are infected with HCV every year, and there
is currently no vaccine available (Soriano et al., 2007).
1.2 Therapies For Chronic Hepatitis C
Until recently, the standard treatment for those with chronic HCV was a combination of
pegylated interferon-α (PEG-IFN-α) and the antiviral ribavirin (RBV). Pegylation
involves the addition of a polyethylene glycol molecule, which gives the drug a longer
half-life, allowing for the convenience of weekly dosing (Glue et al., 2000). Pegylation

4
also has the added benefit of increasing the solubility of the drug while keeping it
biologically active, and in some cases helping to prevent a host immune response to the
drug (Novikov et al., 2010). The initial therapy period is normally 24 to 48 weeks.
Sustained Virologic Response, or SVR, is defined as the absence of detectable HCV
RNA in blood serum after 24 weeks. Initial studies demonstrated that patients that
received pegylated interferon alone for 48 weeks achieved SVR rates approximately
double that of standard interferon, although relapse rates remained high, especially for
those with genotype 1 HCV (Lindsay et al., 2001). The addition of ribavirin to the
treatment substantially decreased the rate of relapses. In previously untreated patients
infected with genotype 1 HCV, the combination of PEG-IFN-α and RBV typically leads
to SVR rates between 47% and 54% (Manns et al., 2001).
1.3 New Treatment Modalities
The recent approval of direct-acting antivirals (DAA) is changing the way HCV is
treated. Treatments modalities are moving away from poorly tolerated subcutaneous
interferon treatments and towards protease inhibitors. DAAs are now commonly used in
conjunction with PEG-IFN-α and RBV. This combination is currently recommended for
patients infected with genotype 1 HCV. Early evidence suggests that these can lead to
SVR rates of over 75% (Soriano et al., 2007).
Bocepevir and telaprevir are two DAAs already approved for HCV treatment. Boceprevir
is an antiprotease that works by directly blocking HCV replication (Habersetzer et al.,

5
2012). Telaprevir works by inhibiting the viral NS3/4A protease, which is key in viral
evasion of the host’s immune system (Kong et al., 2012). Although the new treatments
are very promising, anemia is still a significant obstacle, occurring in up to 50% of
patients, and additional side effects, including fatigue, nausea, and depression, have also
been reported (Habersetzer et al., 2012). Other downsides of multi-component treatment
regimes include increased number of pills for patients to take, more opportunity for side
effects, and increasing costs. These issues highlight the need to develop safer drugs with
greater antiviral activity. It is expected that the first generation DAA’s will soon be
replaced with safer, more effective drugs.
1.4 Metabolic Syndrome
Although treatments for HCV already are promising and continue to improve, the success
of treatment depends on a variety of factors. Some of these include gender, age, presence
or absence of obesity, and ethnicity. Another factor that greatly influences the outcome of
HCV treatment is metabolic syndrome (MetS), a group of medical conditions usually
associated with an increase in visceral adiposity (Table 1, Table 2). MetS components
include high BMI (body mass index), type 2 diabetes, fasting glucose levels greater than
110 mg/dL, high cholesterol, blood pressure greater than 140/90, hepatic steatosis, and
elevated aspartate aminotransferase (AST) and alanine aminotransferase (ALT) levels.
Chronic low-grade inflammatory activity is also commonly seen in MetS patients,
especially those who are obese and/or have type 2 diabetes (di Lorenzo et al., 2013). One
weakness in the current definition of MetS is the lack of consideration of measures of this

6
inflammatory activity. The inflammatory marker C-reactive protein has been shown to be
strongly associated with a number of metabolic disorders (Festa et al., 2000). Several
other proinflammatory markers are known to be elevated in MetS patients, including the
cytokine interleukin-6, tumor necrosis factor-α, and fibrinogen (Pickup et al., 1998).
Importantly, biomarkers of proinflammatory state and oxidative stress do exist, but
currently are not taken into account when MetS is diagnosed by definitions recommended
by ATP III and the WHO.
MetS is considered pandemic, and roughly 25% of people in the United States are
thought to be affected by it (McCullough, 2011). The clinical features of MetS all have
insulin resistance as a common pathogenic mechanism. Importantly, MetS can lead to
other complications including type 2 diabetes, nonalcoholic fatty liver disease (NAFLD),
cardiovascular disease, and multiple types of tumors including hepatocellular carcinoma
(Negro, 2012). Some evidence suggests that chronic HCV infection exacerbates this
condition, possibly by causing increased insulin resistance (IR) and promoting visceral
obesity (Younossi et al., 2009). These metabolic abnormalities have also been shown to
influence patients’ response to HCV treatment. In fact, the presence of IR or obesity
reduces rates of attained SVR by over 25% (Romero-Gomez et al., 2005), while, on the
other hand, success in achieving SVR reduces IR and improves β-cell function treated
patients (Younossi et al., 2009). However, some other studies failed to demonstrate an
association between HCV infection and MetS, concluding that these two conditions do
not occur together at a higher rate than would occur by chance (Shaheen et al., 2007).

7
Although HCV has been linked to type 2 diabetes (Kaddai et al., 2011), the serum lipid
profile of HCV patients shows decreased levels of cholesterol and triglycerides, which is
the opposite to that seen in serum profiles of MetS patients (Bugianesi et al., 2012).
Overall, it appears that HCV infection does interact with lipid and glucose metabolism,
but it is unclear which changes occur first or the mechanism by which they occur (Negro,
2012).
NAFLD, or nonalcoholic fatty liver disease, refers to a range of disorders from hepatic
steatosis to more advanced NASH (nonalcoholic steatohepatitis), which, in turn, can lead
to fibrosis, cirrhosis, and liver failure. NAFLD patients typically have elevated AST and
ALT concentrations, which can indicate reduced liver function (Younossi et al., 2009).
Steatosis is a histological feature of NAFLD impacts outcomes of HCV treatment. It
involves the abnormal accumulation of fat in cells. Steatosis is caused by, and further
augments, alterations of glucose and fat metabolism, including inhibition of glucose-6-
phosphatase or inhibition of fatty acid oxidation; elevated triglyceride levels in the liver
(Romero-Gomez et al., 2005).

8
Table 1: ATP III Clinical Identification of Metabolic Syndrome (Adult Treatment Panel III, 2002)
Risk Factor Defining Level Men >102 cm (>40 in) Abdominal obesity
(given as waist circumference) Women >88 cm (>35 in)
Triglycerides ≥150 mg/dL Men <40 mg/dL HDL cholesterol Women <50 mg/dL
Blood pressure ≥130/≥85 mm Hg Fasting glucose ≥110 mg/dL
Table 2: WHO Clinical Criteria for Metabolic Syndrome (World Health Organization, 1999)
Insulin resistance, identified by 1 of the following: • Type 2 diabetes • Impaired fasting glucose • Impaired glucose tolerance • Or for those with normal fasting glucose levels (<110 mg/dL),
glucose uptake below the lowest quartile for background population under investigation under hyperinsulinemic, euglycemic conditions
Plus any 2 of the following: • Antihypertensive medication and/or high blood pressure (≥140 mm
Hg systolic or ≥90 mm Hg diastolic) • Plasma triglycerides ≥150 mg/dL (≥1.7mmol/L) • HDL cholesterol <35 mg/dL (<0.9 mmol/L) in men or <39 mg/dL
(1.0 mmol/L) in women • BMI > 30 kg/m² and/or waist/hip ratio >0.9 in men, >0.85 in
women • Urinary albumin secretion excretion rate ≥20 µg/min or
albumin/creatinine ratio ≥30 mg/g

9
1.5 IL28B Polymorphisms
In a number of recent studies, the IL28B gene has been shown to play an important role in
the outcome of HCV treatment. A particular single nucleotide polymorphism (SNP) on
chromosome 19q13 (rs12979860) is strongly associated with SVR. This SNP is located
upstream of the IL28B gene, which encodes interferon lambda (IFN-λ3). The CC
genotype of IL28B is associated with a greater than two-fold higher rate of SVR as
compared to the C/T or T/T genotypes (Ge et al., 2009). Numerous studies have
associated the IL28B gene with higher rates of SVR in patients with genotype 1 HCV,
and recent studies have shown a similar impact to SVR rates in patients infected with
other HCV genotypes as well (Mangia et al., 2010; Indolfi et al., 2011; Lindh et al., 2011;
Yu et al., 2011). Additionally, the CC genotype of IL28B has been linked to spontaneous
resolutions of HCV infections (Thomas et al., 2009).
Asian patients have the highest C allele frequency at rs12979860, followed by European
patients and African patients (Ge et al., 2009), while in African cohorts frequencies of
T/T and T/C genotypes are prevalent (Melis et al., 2011). These figures indicate that high
frequency of T allele in African populations provide substantial contribution to the
different SVR rates observed across different population groups (Fig. 1).

10
Figure 1: Allele frequencies of the SNP rs12979860 among different ethnic populations (Balagopal et al., 2010)
Although the IL28B gene clearly plays an important role in the pathogenesis of HCV, the
underlying molecular and cellular mechanism of its action remain unknown. One
hypothesis is that interferon lambda may help create a better immunologic profile that
aids in viral clearance (Urban et al., 2010). Supporting this theory, some studies have
shown that patients with the T allele of IL28B appeared to have a baseline activation of
the Hepatitis C response pathway, while those with the CC genotype only had activation
in this pathway after the beginning of treatment (Younossi et al., 2012). Interestingly, in
normal livers of patients with CC genotype, Interferon Stimulated Genes (ISGs) are
expressed at highest level, CT at intermediate and TT at the lowest. This is opposite to

11
the pattern seen in HCV patients. Principal component analysis of IL28B genotype and
levels of ISG expression revealed that ISG15, HTATIP2, LGALS3BP, IRF2 and BCL2
levels correlate with the presence of C alleles, while IFNα, β, γ, λ3 and CD80 levels
correlate with T alleles (Raglow Z. et al., 2013). Recently, a new dinucleotide variant
ss469415590 (TT or ΔG), which is in high linkage disequilibrium with rs12979860, was
identified upstream of IL28B (Prokunina-Olsson L et al., 2013). ss469415590[ΔG] is a
frameshift variant that creates a novel gene, designated IFNL4, encoding the interferon-
λ4 protein (IFNL4), which is moderately similar to IFNL3 (Prokunina-Olsson L, 2013).
In hepatoma cells, a transient overexpression of IFNL4 induces the expression of ISGs
(Prokunina-Olsson L et al., 2013), which adds yet another piece to the IL28B puzzle.
Although IL28B polymorphisms have been shown to influence the effectiveness of HCV
treatments and SVR rates, their effects on overall metabolic profiles are not clearly
known.
Studies suggest an existence of a complex interplay between metabolic factors, IL28B
SNP status and HCV genotypes. Infection with HCV has been indicated as a risk factor
for developing both IR and metabolic syndrome (Persico et al., 2009). There is also an
association between diabetes, high BMI, and liver fibrosis with steatosis (fat retention in
the liver) in chronic Hepatitis C disease (Persico et al., 2009). IR has been independently
associated with fibrosis and HCV genotypes 1 and 4 regardless of steatosis or serum
HCV RNA levels (Moucari et al., 2008). However, another study shows that HCV is
associated with IR, but the prevalence of metabolic syndrome was not, and was actually

12
higher in patients with non-alcoholic fatty liver disease (Lonardo et al., 2009). One study
showed that IR predicts SVR response to treatment independently of IL28B genotype (del
Campo et al., 2012). Another study, however, showed that a T allele of the IL28B gene is
associated with IR, and may explain a poor outcome to standard PEG-IFN-α and RBV
treatments (Stattermayer et al., 2012). Despite a plethora of studies on this topic, whether
IL28B alleles affect metabolic syndrome, IR, and overall metabolic profile in addition to
response to HCV treatments and SVR rates remains unclear.
Specific Aims
• The Primary Aim of this study is to assess whether there is a relationship between
metabolic syndrome and the presence of the variant IL28B allele.
• The Secondary Aim of this study is to examine the associations between IL28B
variant allele and the metabolic profile of patients with HCV.

13
CHAPTER 2: METHODS AND MATERIALS
Blood Samples
Frozen peripheral blood samples were obtained from a previously collected biobank of
the Inova Fairfax Beatty Liver and Obesity Research Center. Study set included 113
HCV positive and 117 HCV negative patients with NAFLD who provided informed
consent for the study. The study was approved by the Inova IRB.
DNA Extraction
Qiagen QIAamp DNA Mini Kit (Qiagen, USA) was used, as recommended by the
manufacturer, to extract DNA. Manufacturer’s protocol was followed with no
alterations. This kit separates DNA from other macromolecules by differential solubility
followed by “on column” purification and a final elution step. In the final step, Buffer
“AE” was used instead of the option of distilled water to help protect the integrity of the
DNA. This buffer is slightly basic to prevent acid hydrolysis, and contains EDTA, which
minimizes nuclease activity.
The quality of the extracted DNA was checked on a UV-vis spectrophotometer. The
protocol recommends an A260/A280 ratio between 1.7 and 1.9; the protocol also states a

14
DNA yield of 3-12 µg per 200µL of whole blood can be expected. Samples were stored
at -80° C.
Tetraprimer PCR
A tetra-primer amplification refractory mutation system polymerase chain reaction (T-
ARMS-PCR) was used to genotype the IL28B alleles. PCR was conducted according to
the Galmozzi method (Galmozzi et al., 2011) (Fig. 5). This is a single-tube PCR used to
evaluate the presence or absence and allelic state of rs12979860 C>T IL28B single
nucleotide polymorphism that is located 3 kb upstream of the IL28B gene (Fig. 2).
Figure 2: Location of rs12979860 SNP (NCBI, 2013)
15
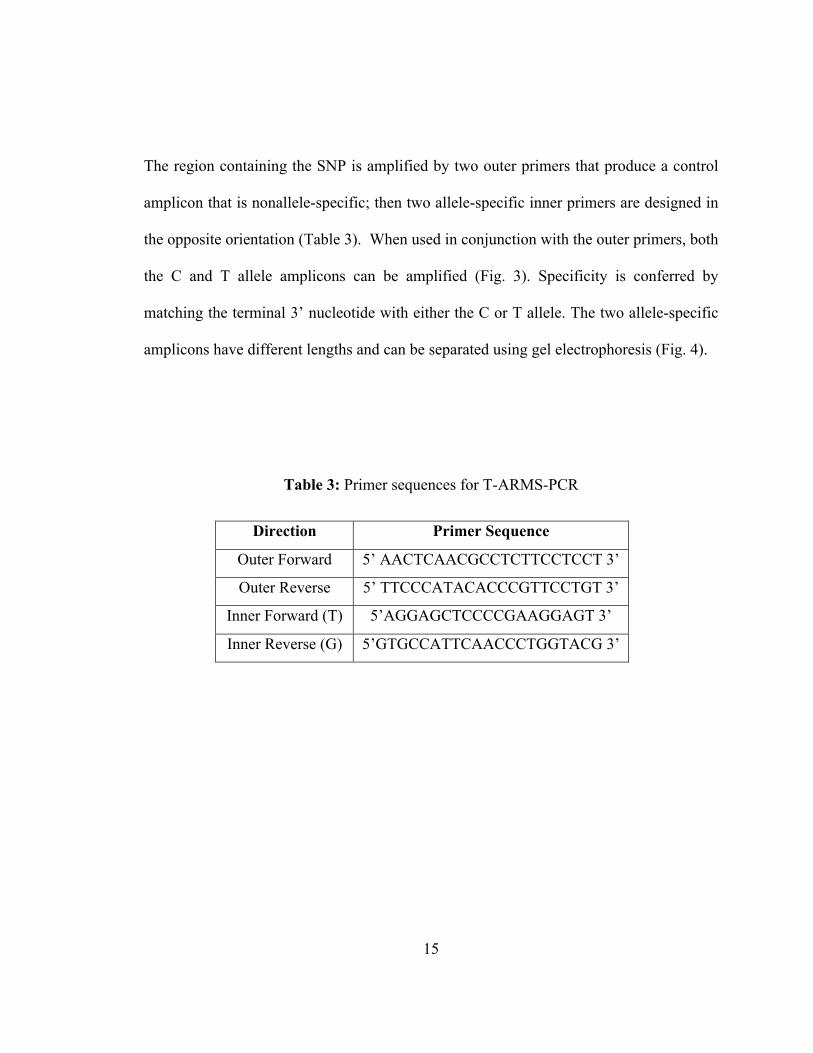
The region containing the SNP is amplified by two outer primers that produce a control
amplicon that is nonallele-specific; then two allele-specific inner primers are designed in
the opposite orientation (Table 3). When used in conjunction with the outer primers, both
the C and T allele amplicons can be amplified (Fig. 3). Specificity is conferred by
matching the terminal 3’ nucleotide with either the C or T allele. The two allele-specific
amplicons have different lengths and can be separated using gel electrophoresis (Fig. 4).
Table 3: Primer sequences for T-ARMS-PCR
Direction Primer Sequence
Outer Forward 5’ AACTCAACGCCTCTTCCTCCT 3’
Outer Reverse 5’ TTCCCATACACCCGTTCCTGT 3’
Inner Forward (T) 5’AGGAGCTCCCCGAAGGAGT 3’
Inner Reverse (G) 5’GTGCCATTCAACCCTGGTACG 3’

16
Figure 3: Scheme of T-ARMS-PCR primer amplicons (Galmozzi et al., 2011)
Figure 4: Typical result of IL28B alleles separation using gel electrophoresis

17
To create the tetraprimer mixture, primers were heated to 65° C for 5 minutes. 25µL of
each primer was added to create a 5µM primer stock. The PCRs were performed in a
volume of 20µL, containing 2µL template of 10-60µg/mL of genomic DNA extracted,
1.6µL of tetraprimer mixture, 10µL HotStarTaq Master Mix (Qiagen, USA), and 6.4µL
water. PCR was performed using the BioRad C1000 Thermal Cycler (BioRad
Laboratories, USA).
Figure 5: PCR protocol- Step 1: 5 minutes of denaturation at 95° C, Step 2: 35 cycles of
95° C for 45 seconds, Step 3: annealing at 58° C for 45 seconds, Step 4: 72° C for 1 minute, Step 5: final extension at 72° C for 5 minutes
Gel Electrophoresis
PCR products were separated using standard gel electrophoresis using a 30mL 1.7%
agarose gel containing 4µL ethidium bromide. 10µL of each sample was added along

18
with 2µL Blue/Orange 6X Loading Dye (Promega, USA). Size discrimination was
accomplished using 8µL of exACT Gene 100bp PCR DNA Ladder (Fisher Scientific,
USA). The gel was run at 75 volts for approximately 90 minutes. Genotypes were then
discriminated using the number and size of bands.
TaqMan SNP Genotyping Using qPCR
To confirm the accuracy of the genotyping from the tetraprimer PCR, real-time PCR
(qPCR) was used with TaqMan GTXpress Master Mix (Applied Biosystems Inc., USA),
used according to protocol, and custom designed TaqMan probes for the rs12979860
SNP (Invitrogen, USA). These probes are oligonucleotides with a fluorescent dye at the
5’ end of the probe and a quencher at the 3’ end. When the probe is intact, the quencher
reduces the fluorescence emitted by the dye. When the specific target sequence (the SNP)
is present in a sample, the probe anneals. During the extension phase of the PCR, the
probe is cleaved by the Taq DNA polymerase. This removes the probe from the target
DNA so that primer extension can continue, but also separates the dye from the quencher.
This causes a fluorescent signal, which increases in intensity with each repeated PCR
cycle. In order to perform the genotyping of the samples, two probes with different dyes
are used, in this case VIC and FAM. One is specific for the C allele (VIC), while the
other is specific for the T allele (FAM). If the assay results in only one fluorescent color,
the sample is homozygous for the corresponding allele. If both fluorescent colors are
present, then that sample is heterozygous. Results are shown on an amplification graph
and can be easily analyzed (Fig. 6).

19
Figure 6: Sample amplification graph from SNP genotyping using real-time PCR. Only
VIC fluorescence is seen indicating presence of C alleles only.
Statistical Tests
According to the result of assessment of the qPCR results, HCV infected and non-HCV
infected NAFLD patients were divided into CC and non-CC genotype groups.
Descriptive, univariate, and multivariate statistical tests were performed. Spearman
correlation analysis was performed. A Spearman correlation measures statistical
dependence between two variables. A correlation coefficient is calculated that falls
between -1 and +1, where -1 and +1 indicate the two variables are perfectly correlated
and dependent upon each other. P-values were calculated for significant r-values.

20
CHAPTER 3: RESULTS
DNA Extraction
Qiagen QIAamp DNA Mini Kit (Qiagen, USA) was used as recommended by the
manufacturer to obtain DNA from the samples. The quality of the extracted DNA was
then evaluated using a UV-vis spectrophotometer. The protocol recommends an
A260/A280 ratio between 1.7 and 1.9; the majority of samples fell within these
parameters (Table 4). The protocol also states a DNA yield of 3-12 µg per 200µL of
whole blood can be expected. The average total yield of the DNA extracted from each
sample was 5.55 µg.
Table 4: Spectrophotometerical quantitation of DNA extracted from blood samples
Number Sample 260/280 ratio Concentration (µg/mL) Total Yield (µg)
1 TR1-001-0202 1.815 36.7 7.34 2 TR1-001-0294-0 1.784 49.5 9.90 3 TR1-001-0301-0 1.792 32.3 6.46 4 TR1-001-0300-0 1.762 27.8 5.56 5 TR1-001-0302-E 1.800 27.0 5.40 6 TR1-001-0299-0 1.857 39.0 7.80 7 TR1-001-0307-0 1.840 34.5 6.90 8 TR1-001-341 1.857 19.5 3.90 9 TR1-001-0308-0 1.852 18.8 3.76
10 TR1-001-0346 1.849 50.6 10.12

21
11 TR1-001-0347 1.827 27.8 5.56 12 TR1-001-0345 1.870 24.2 4.84 13 015-01-0151 1.839 30.0 6.00 14 16-01-0105 1.954 23.8 4.76 15 015-01-0129 1.826 15.8 3.16 16 016-01-0136 1.871 10.9 2.18 17 015-01-0128 1.962 19.5 3.90 18 16-01-1006 1.881 14.8 2.96 19 016-01-1007 1.857 31.7 6.34 20 015-01-0130 1.864 15.4 3.08 21 016-01-0152 1.875 16.9 3.38 22 16-01-1005 1.864 28.3 5.66 23 016-01-0145 1.887 21.9 4.38 24 015-01-0117 1.800 6.7 1.34 25 015-01-0131 1.876 48.2 9.64 26 TR1-001-0214E 1.840 17.3 3.46 27 003-01-0017 1.860 32.4 6.48 28 TR1-001-0224E 1.857 24.4 4.88 29 TR1-001-342 1.857 17.1 3.42 30 003-01-0023 1.806 12.2 2.44 31 TR1-001-0334E 1.885 46.3 9.26 32 TR1-001-376-0 1.878 26.1 5.22 33 TR1-001-0172E 1.899 35.2 7.04 34 TR1-001-0330-0 1.857 41.4 8.28 35 003-01-0034 1.769 38.8 7.76 36 TR1-001-0257-E 1.733 29.2 5.84 37 003-01-0041 1.750 36.8 7.36 38 TR1-001-0332-0 1.742 21.6 4.32 39 003-01-0005 1.831 26.4 5.28 40 TR1-001-0323-0 1.887 25.1 5.02 41 TR1-001-0256-E 1.794 21.2 4.24 42 TR1-001-0322-0 1.855 43.1 8.62
Gel Electrophoresis

22
The T-ARMS-PCR used for genotyping IL28B alleles showed that 54 (31.8%) samples
overall had CC genotype, while the remaining 116 (68.2%) were having CT or TT
(referred to as non-CC) genotypes. Among HCV patients, 40.2% were CC genotype,
while 59.8% were Non-CC genotypes. Among NAFLD patients, 19.3% were CC
genotype, while 80.7% were Non-CC genotypes. This is much lower than the expected
frequency of the CC genotype in the general US population, which is roughly 43%
(NCBI, 2013). This led to the conclusion that there could have been contamination of the
DNA samples during PCR, or human errors when reading unclear gels. To exclude
possible contamination, DNA was re-extracted from the blood samples and genotyping
was confirmed using qPCR SNP genotyping.
qPCR SNP Genotyping
The TaqMan based SNP genotyping, which is more straightforward and more accurate
than the T-ARMS-PCR technique, showed that 88 (38.3%) samples overall were CC
genotype, while the remaining 142 (61.7%) were CT or TT (referred to as non-CC
genotype). According to TaqMan genotyping, among HCV patients, 50.6% were CC
genotype, while 49.4% were Non-CC genotypes. Among NAFLD patients, 48.3% were
CC genotype, while 51.7% were Non-CC genotypes. These percentages are in much
better agreement with the expected frequency of CC genotype in human populations.
This experimental data was compiled with database-extracted data including assessment
for metabolic syndrome components as well as demographic factors.
23
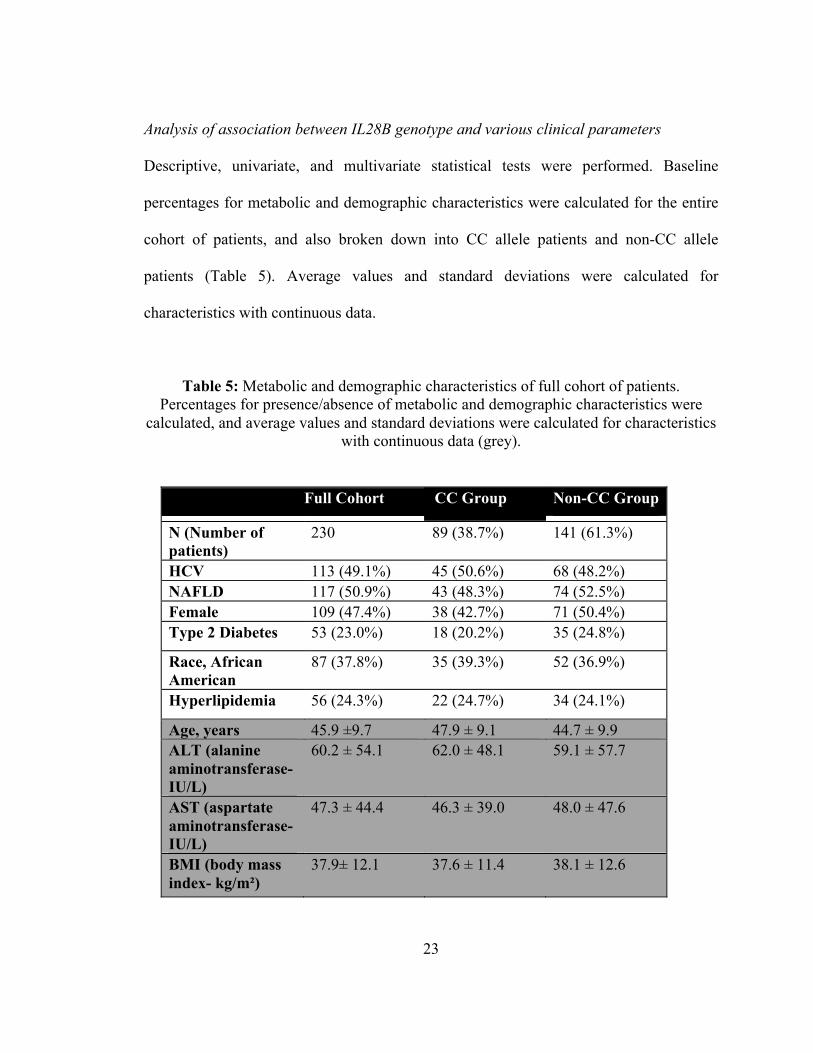
Analysis of association between IL28B genotype and various clinical parameters
Descriptive, univariate, and multivariate statistical tests were performed. Baseline
percentages for metabolic and demographic characteristics were calculated for the entire
cohort of patients, and also broken down into CC allele patients and non-CC allele
patients (Table 5). Average values and standard deviations were calculated for
characteristics with continuous data.
Table 5: Metabolic and demographic characteristics of full cohort of patients. Percentages for presence/absence of metabolic and demographic characteristics were
calculated, and average values and standard deviations were calculated for characteristics with continuous data (grey).
Full Cohort CC Group Non-CC Group
N (Number of patients)
230 89 (38.7%) 141 (61.3%)
HCV 113 (49.1%) 45 (50.6%) 68 (48.2%) NAFLD 117 (50.9%) 43 (48.3%) 74 (52.5%) Female 109 (47.4%) 38 (42.7%) 71 (50.4%) Type 2 Diabetes 53 (23.0%) 18 (20.2%) 35 (24.8%)
Race, African American
87 (37.8%) 35 (39.3%) 52 (36.9%)
Hyperlipidemia 56 (24.3%) 22 (24.7%) 34 (24.1%)
Age, years 45.9 ±9.7 47.9 ± 9.1 44.7 ± 9.9 ALT (alanine aminotransferase- IU/L)
60.2 ± 54.1 62.0 ± 48.1 59.1 ± 57.7
AST (aspartate aminotransferase- IU/L)
47.3 ± 44.4 46.3 ± 39.0 48.0 ± 47.6
BMI (body mass index- kg/m²)
37.9± 12.1 37.6 ± 11.4 38.1 ± 12.6

24
A Pearson’s chi-squared test was calculated for an association between CC genotype and
NAFLD. The frequency of the T allele is 0.339 (38); using the Hardy-Weinberg equation
(p^2 + 2pq + q^2 =1) the estimated frequency of a CC genotype was calculated to be
0.437. Using the standard formula χ^2= (Observed-Expected)^2/Expected to obtain a χ^2
value, and using the observed frequency of 48.3% of NAFLD patients having the CC
genotype, χ^2 was calculated to be 0.005. Using a standard chi-squared probability table
and one degree of freedom, a critical value of 3.84 for p=0.05 was found. Since the χ^2
value is far less than 3.84, it showed these results do not depart from expectation.
Therefore, presence of CC genotype or T allele in IL28B gene is not associated with
presence of NAFLD.
The chi-squared test was repeated for the HCV group using .437 as the expected value
and the observed frequency of 50.6%; χ^2 was calculated to be 0.011. Again, this is far
less than 3.84, so results do not depart from expectation. Therefore, presence of CC
genotype or T allele in IL28B gene is not associated with presence of HCV infection per
se.
Spearman correlations were first calculated for the entire cohort of patients connecting
the presence of CC genotype and age, albumin levels, ALT and AST levels, BMI,
glucose, total bilirubin, and presence or absence of type 2 diabetes, female gender,
hyperlipidemia, African American race, and steatosis (Table 6). P-values were not
significant for any factor except African American race. However, even with a large
sample size, a p-value less than 0.05 may not be a reliable indicator of significance with a

25
low Spearman correlation coefficient. Therefore, we conclude that our results showed
little to no correlation between the metabolic and demographic factors and CC genotype
when all samples were considered.
Table 6: Spearman correlation between CC genotype and investigated factors in all patients. All P-values are non-significant (P>0.05) except for African American Race.
Clinical or Demographic
Parameter
Spearman’s Rank Correlation Coefficient
Age, years 0.1789 Albumin, g/dL 0.1378 ALT, IU/L 0.1066 AST, IU/L 0.0214 BMI -0.0104 Type 2 Diabetes -0.0106 Female Gender -0.0701 Glucose, mg/dL -0.1251 Hyperlipidemia -0.0067 African American Race -0.2452 Steatosis -0.0214 Total Bilirubin, mg/dL -0.0645
In the next round of analysis, samples were separated into HCV and non-HCV/NAFLD
cohorts, studies of correlation were performed for each of the groups separately.
Spearman correlations and p-values were calculated.

26
The null hypothesis, that the two factors in any given comparison were independent of
each other, would be rejected if p<0.05. The HCV samples showed significant
correlations between the CC genotype and several metabolic factors, including SVR
rates, hypertension, BUN, and creatinine (Table 7). Results showed that, as expected, the
CC-group patients had significantly higher rates of SVR, but this did not correspond with
the other factors examined. The presence of CC alleles positively correlated with
hypertension, BUN, and creatinine. In Table 7, statistically significant p-values are
highlighted in yellow. In non-CC patients, achievement of SVR negatively correlated
with elevated AST, ALT, glucose, BUN, direct bilirubin, and steatosis.

27
Table 7: Spearman correlation between CC genotype and investigated factors in HCV patients. NS = non-significant factor (P>0.05).
Clinical or Demographic Parameter
Spearman’s Rank Correlation Coefficient
P-Value
Age, years 0.0540 NS SVR 0.4263 2.778E-06 ALT, IU/L 0.0483 NS AST, IU/L -0.0341 NS BMI -0.0014 NS BP Diastolic, mmHg 0.1162 NS BP Systolic, mmHg 0.0791 NS BUN, mg/dL 0.4296 0.0200 Creatinine, mg/dL 0.3667 0.0463 Diabetes (type 2) -0.1437 NS Glucose, mg/dL -0.1257 NS Hypertension 0.2428 0.0197 Hyperlipidemia -0.0015 NS Steatosis -0.0201 NS
When Spearman correlations and p-values were calculated for the NAFLD samples, there
were no correlations between the presence of the T allele alleles and any metabolic
factor. None of the p-values were below the 0.05 cutoff (Table 8).

28
Table 8: Spearman correlation between CC genotype and investigated factors in NAFLD patients. All P-values are non-significant (P>0.05).
Clinical or Demographic Parameter
Spearman’s Rank Correlation Coefficient
Age, years 0.2943 ALT, IU/L 0.1751 AST, IU/L 0.0665 Cirrhosis -0.1009 Diabetes 0.1042 HDL, mg/dL -0.0510 LDL, mg/dL -0.1386 Total Cholesterol, mg/dL
-0.0708
Hyperlipidemia 0.0013 Hypertension 0.0314 Triglycerides, mg/dL
-0.0647
After separating the NAFLD patients into a CC-group and a Non-CC-group, average
values for each metabolic factor were calculated (Table 9). 95% confidence intervals
were calculated. The data shows no statistically significant differences between the CC
and Non-CC groups that fall within a 95% confidence interval (Fig. 7).

29
Table 9: Average values for each investigated metabolic factor in NAFLD patients with 95% confidence interval
Clinical or
Demographic
Parameter
CC Group Non-CC Group
N 43 74
Age, years 46.4±10.3 41.5±10.7
ALT, IU/L 42.3±29.2 35.5±28.8
AST, IU/L 30.8±25.6 27.7±22.9
BMI 46.0±9.1 46.6±11.1
HDL, mg/dL 43.7±11.5 44.1±13.7
Total Cholesterol,
mg/dL
172.1±38.9 191.8±56.7
Triglycerides, mg/dL 135.0±84.6 150.3±82.8

30
Figure 7: Comparison of average values and standard deviations for investigated metabolic factor in NAFLD patients with
0 50 100 150 200 250 300
Age
ALT (Alanine Aminotransferase)
AST (Aspartate Aminotransferase)
BMI (Body Mass Index)
HDL (High Density Lipoprotein)
Total Cholesterol
Triglycerides
Average Values for Each Inves3gated Metabolic Factor in NAFLD Pa3ents
Non-‐CC-‐group
CC-‐group
31
CHAPTER 4: DISCUSSION
Hepatitis C Virus (HCV) is a viral infectious disease that affects an estimated 130-170
million people worldwide. Most of those infected (80%) do not spontaneously clear the
virus and go on to develop a chronic infection. In a number of recent studies, the IL28B
gene has been shown to play an important role in the outcome of HCV treatment. A
particular single nucleotide polymorphism (SNP) on chromosome 19q13 (rs12979860),
commonly referred to as “IL28B” is strongly associated with SVR.
Metabolic syndrome (MetS) is a group of medical disorders usually associated with
visceral fat. It is not known whether or not IL28B genotypes affect overall patient
outcomes, including metabolic syndrome, insulin resistance, and overall metabolic profile
in addition to response to HCV treatments and SVR rates. It is also not known whether or
not IL28B genotype affects metabolic profiles of patients without HCV but having other
liver diseases, such as NAFLD.
In the course of this study, 113 HCV positive and 117 HCV negative patients were
genotyped for IL28B allele by tetraprimer-PCR. These patients were chosen for the
purpose of this study due to availability of well-documented, extensive medical history.
IL28B genotype frequencies were defined experimentally. After genotyping was

32
complete, 89 samples overall were determined to be CC genotype, while the remaining
141 were CT or TT (referred to as non-CC genotype). Genotypes were correlated to
clinical and demographic parameters, such as BMI, presence of type 2 diabetes, and
hypertension. Spearman correlation coefficients were calculated and p-values were
assessed. This data was compiled with assessment for metabolic syndrome components
as well as demographic factors. Results showed little to no correlation between any of the
metabolic or demographic factors and CC genotype when all samples were considered.
Presence of CC genotype or T allele in IL28B gene was not associated with presence of
NAFLD or HCV infection per se.
When samples were separated into HCV and non-HCV/NAFLD cohorts, the HCV
samples showed significant correlation between the presence of CC genotype and several
metabolic factors, including SVR rates, hypertension, blood urea nitrogen (BUN), and
creatinine (p-values within the 95% confidence interval). Results showed that, as
expected, the CC-group patients had significantly higher rates of SVR, but this did not
associate with the any other metabolic factors examined. CC alleles positively correlated
with hypertension, BUN, and creatinine, possibly indicating reduced liver and renal
function in CC carriers. In the non-CC group, achievement of SVR negatively correlated
with elevated AST, ALT, glucose, BUN, direct bilirubin, and steatosis. There might be a
connection between the degree of liver and, possibly, renal, function and the achievement
of SVR, as well as a potential association between IL28B alleles and metabolic
parameters. All together, our data indicate that when T allele is present, a patient’s

33
metabolic profile is important in determining whether or not they will be able to achieve
SVR.
Importantly, an analysis of genotype distribution within the NAFLD cohort failed to
reveal any correlation between CC allele and any metabolic factor analyzed. This is
surprising given the number of samples and number of factors assessed. When average
values for each metabolic factor assessed were calculated for NAFLD patients, again
there was no significant difference between CC-group and Non-CC-group. This
reinforces the finding that in non-HCV patients, there is no correlation between IL28B
alleles and components of MetS.
This study has several inherent limitations that should be taken into consideration when
interpreting results. The sample size of patients is relatively small given the number of
factors being considered. This can result in a type II error during statistical analysis,
where the null hypothesis is false but fails to be rejected. The patient population is also
biased in that all non-HCV patients are NAFLD patients. An additional weakness of this
study is that it consisted of analyzing data and looking for correlations, rather than
experimentation on the effects of IL28B alleles.
Future directions of this study should include larger groups of non-HCV patients, and
possibly non-NAFLD patients as well. A comparison of CC groups versus non-CC
groups in healthy population-based cohort with no liver disease would be interesting.

34
Examining effects of IL28B alleles during the course of treatment for MetS components
could also provide valuable insight. More studies are warranted to determine the effects
of IL28B genotypes on treatment outcomes in liver disease patients.

35
CHAPTER 5: CONCLUSION
In HCV patients, there is a significant correlation between the presence of CC genotype
and several metabolic factors. In non-HCV patients with NAFLD, no such correlation
was found. The metabolic profiles of the CC and Non-CC groups of NAFLD patients
were also not different from each other. The beneficial effects of CC genotype on
metabolic profiles may only be conferred after incidental infection with HCV, or after the
treatment with antiviral therapy. IL28B genotyping in larger groups of non-HCV patients
is warranted to determine the true effect of IL28B genotypes on metabolic outcomes.

36
REFERENCES

37
REFERENCES Houghton M. The long and winding road leading to the identification of the hepatitis C virus. Journal of Hepatology 2009 Nov;51(5):939–948.[cited 2012 Nov 18 ].
Nelson P, Mathers B, Cowie B, Hagan H, Jarlais DD, Horyniak D, Degenhardt L. The epidemiology of viral hepatitis among people who inject drugs: Results of global systematic reviews. Lancet 2011 Aug;378(9791):571–583.[cited 2012 Nov 18 ].
Alter MJ: Epidemiology of hepatitis C virus infection. World J Gastroenterol 2007, 13:2436-2441.
Berenguer M. Natural history of recurrent hepatitis C. Liver Transplantation 2002;8(10B):s14–s18.[cited 2013 Jan 31 ]
Fraquelli M, Rigamonti C, Colombo M. Spleen stiffness measured by transient elastography accurately predicts esophageal varices in liver cirrhosis. Gastroenterology 2012 Oct;143(4):e23; author reply e23–24.
Maheshwari A, Ray S, Thuluvath PJ. Acute hepatitis C. The Lancet Jul;372(9635):321–332.[cited 2013 Feb 24 ]
Rao H-Y, Sun D-G, Jiang D, Yang R-F, Guo F, Wang J-H, Liu F, Zhang H-Y, Zhang H-H, Du S-C, Jin Q, Qin H, Lok A-S-F, Wei L. IL28B genetic variants and gender are associated with spontaneous clearance of hepatitis C virus infection. Journal of Viral Hepatitis 2012;19(3):173–181.[cited 2013 Jan 25 ]
Louie KS, Micallef JM, Pimenta JM, Forssen UM. Prevalence of thrombocytopenia among patients with chronic hepatitis C: a systematic review. Journal of Viral Hepatitis 2011;18(1):1–7.[cited 2013 Feb 24 ]
Iannuzzella F, Vaglio A, Garini G. Management of Hepatitis C Virus-related Mixed Cryoglobulinemia. The American Journal of Medicine 2010 May;123(5):400–408.[cited 2013 Feb 24 ]
Rosen HR. Chronic Hepatitis C Infection. New England Journal of Medicine 2011;364(25):2429–2438.[cited 2013 Feb 24 ]

38
Mueller S, Millonig G, Seitz HK. Alcoholic liver disease and hepatitis C: A frequently underestimated combination. World J Gastroenterol 2009 Jul;15(28):3462–3471.[cited 2013 Feb 24 ]
Kuske L, Mensen A, Müllhaupt B, Negro F, Semela D, Moradpour D, Malé P, Heim M, Malinverni R, Cerny A, Dufour J. Characteristics of patients with chronic hepatitis C who develop hepatocellular carcinoma [Internet]. Swiss Medical Weekly 2012 Aug;[cited 2013 Jan 25] Available from: http://www.smw.ch/content/smw-2012-13651/
Nakano, T; Lau, GM; Lau, GM et al. (December 2011). "An updated analysis of hepatitis C virus genotypes and subtypes based on the complete coding region". Liver Int. 32 (2): 339–45.
Soriano V, Labarga P, Fernández-Montero JV, Benito JM, Poveda E, Rallon N, Sánchez C, Vispo E, Barreiro P. The changing face of hepatitis C in the new era of direct-acting antivirals. Antiviral Res. 2012 Nov. World J Gastroenterol 2007, 13:2436-2441.
Glue P, Fang JW, Rouzier-Panis R, Raffanel C, Sabo R, Gupta SK, Salfi M, Jacobs S. Pegylated interferon-alpha2b: pharmacokinetics, pharmacodynamics, safety, and preliminary efficacy data. Hepatitis C Intervention Therapy Group. Clin. Pharmacol. Ther. 2000 Nov;68(5):556–567.
Novikov BN, Grimsley JK, Kern RJ, Wild JR, Wales ME. Improved pharmacokinetics and immunogenicity profile of organophosphorus hydrolase by chemical modification with polyethylene glycol. Journal of Controlled Release 2010 Sep;146(3):318–325.[cited 2013 Jan 31 ]
Lindsay KL, Trepo C, Heintges T, Shiffman ML, Gordon SC, Hoefs JC, Schiff ER, Goodman ZD, Laughlin M, Yao R, Albrecht JK. A randomized, double-blind trial comparing pegylated interferon alfa-2b to interferon alfa-2b as initial treatment for chronic hepatitis C. Hepatology 2001;34(2):395–403.[cited 2013 Jan 31 ]
Manns MP, McHutchison JG, Gordon SC, Rustgi VK, Shiffman M, Reindollar R, Goodman ZD, Koury K, Ling M, Albrecht JK: Peginterferon alfa-2b plus ribavirin compared with interferon alfa-2b plus ribavirin for initial treatment of chronic hepatitis C: a randomised trial. Lancet 2001, 358:958-965.
Habersetzer F, Leboeuf C, Doffoël M, Baumert TF. Boceprevir and personalized medicine in hepatitis C virus infection. Pharmgenomics Pers Med 2012 Sep;5:125–137.[cited 2013 Jan 31 ]
Kong Y, Wang X, Shang Y, Schroder PM, Liang W, Ling X, Guo Z, He X. Efficacy and Tolerability of Telaprevir for Chronic Hepatitis Virus C Genotype 1 Infection: A Meta-

39
Analysis [Internet]. PLoS One 2012 Dec;7(12)[cited 2013 Jan 31] Available from: http://www.ncbi.nlm.nih.gov/pmc/articles/PMC3527389/
Third report of the National Cholesterol Education Program (NCEP) expert panel on detection, evaluation, and treatment of high blood cholesterol in adults (Adult Treatment Panel III). Final report. Circulation. 2002; 106: 3143–3421.
World Health Organization. Definition, diagnosis and classification of diabetes mellitus and its complications: report of a WHO Consultation. Part 1: diagnosis and classification of diabetes mellitus. Geneva, Switzerland: World Health Organization; 1999. Available at: http://whqlibdoc.who.int/hq/1999/WHO_NCD_NCS_99.2.pdf.
Younossi Z, McCullough A: Metabolic Syndrome, Non-Alcoholic Fatty Liver Disease and Hepatitis C Virus: Impact on Disease Progression and Treatment Response. Liver Int 2009, 29(Suppl. 2):3-12.
Romero-Gómez M, Del Mar Viloria M, Andrade RJ, Salmerón J, Diago M, Fernández-Rodríguez CM, Corpas R, Cruz M, Grande L, Vázquez L, Muñoz-De-Rueda P, López-Serrano P, Gila A, Gutiérrez ML, Pérez C, Ruiz-Extremera A, Suárez E, Castillo J. Insulin resistance impairs sustained response rate to peginterferon plus ribavirin in chronic hepatitis C patients. Gastroenterology 2005 Mar;128(3):636–641.
Ge D, Fellay J, Thompson AJ, Simon JS, Shianna KV, Urban TJ, Heinzen EL, Qiu P, Bertelsen AH, Muir AJ, Sulkowski M, McHutchison JG, Goldstein DB: Genetic variation in IL28B predicts hepatitis C treatment-induced viral clearance. Nature 2009, 461(7262):399-401.
Mangia A, Thompson AJ, Santoro R, Piazzolla V, Tillmann HL, Patel K, Shianna KV, Mottola L, Petruzzellis D, Bacca D, Carretta V, Minerva N, Goldstein DB, McHutchison JG: An IL28B polymorphism determines treatment response of hepatitis C virus genotype 2 or 3 patients who do not achieve a rapid virologic response. Gastroenterology 2010, 139(3):821-7. 827.e1
Indolfi G, Sambrotta M, Moriondo M, Azzari C, Resti M: Genetic variation in IL28B locus is associated with spontaneous clearance of HCV in children with Non-1 viral genotype infection. Hepatology 2011.
Lindh M, Lagging M, Färkkilä M, Langeland N, Mørch K, Nilsson S, Norkrans G, Pedersen C, Buhl MR, Westin J, Hellstrand K: Interleukin 28B Gene Variation at rs12979860 Determines Early Viral Kinetics During Treatment in Patients Carrying Genotypes 2 or 3 of Hepatitis C Virus. J Infect Dis 2011, 203(12):1748-52.
Yu ML, Huang CF, Huang JF, Chang NC, Yang JF, Lin ZY, Chen SC, Hsieh MY, Wang LY, Chang WY, Li YN, Wu MS, Dai CY, Juo SH, Chuang WL: Role of interleukin-28B

40
polymorphisms in the treatment of hepatitis C virus genotype 2 infection in Asian patients. Hepatology 2011, 53(1):7-13.
Thomas DL, Thio CL, Martin MP, Qi Y, Ge D, O'Huigin C, Kidd J, Kidd K, Khakoo SI, Alexander G, Goedert JJ, Kirk GD, Donfield SM, Rosen HR, Tobler LH, Busch MP, McHutchison JG, Goldstein DB, Carrington M: Genetic variation in IL28B and spontaneous clearance of hepatitis C virus. Nature 2009, 461(7265):798-801.
Urban TJ, Thompson AJ, Bradrick SS, Fellay J, Schuppan D, Cronin KD, Hong L, McKenzie A, Patel K, Shianna KV, McHutchison JG, Goldstein DB, Afdhal N: IL28B genotype is associated with differential expression of intrahepatic interferon-stimulated genes in patients with chronic hepatitis C. Hepatology 2010, 52(6):1888-96.
Younossi, Z. M., Birerdinc, A., Estep, M., Stepanova, M., Afendy, A., & Baranova, A. The impact of IL28B genotype on the gene expression profile of patients with chronic hepatitis C treated with pegylated interferon alpha and ribavirin. (2012): 25.
Persico M, Masarone M, Mura VL, Persico E, Moschella F, Svelto M, Bruno S, Torella R. Clinical expression of insulin resistance in hepatitis C and B virus-related chronic hepatitis: Differences and similarities. World J Gastroenterol 2009 Jan;15(4):462–466.[cited 2012 Nov 16 ].
Moucari R, Asselah T, Cazals-Hatem D, Voitot H, Boyer N, Ripault M-P, Sobesky R, Martinot-Peignoux M, Maylin S, Nicolas-Chanoine M-H, Paradis V, Vidaud M, Valla D, Bedossa P, Marcellin P. Insulin resistance in chronic hepatitis C: association with genotypes 1 and 4, serum HCV RNA level, and liver fibrosis. Gastroenterology 2008 Feb;134(2):416–423.
Lonardo A, Ballestri S, Adinolfi LE, Violi E, Carulli L, Lombardini S, Scaglioni F, Ricchi M, Ruggiero G, Loria P. Hepatitis C virus-infected patients are “spared” from the metabolic syndrome but not from insulin resistance. A comparative study of nonalcoholic fatty liver disease and hepatitis C virus-related steatosis. Can. J. Gastroenterol. 2009 Apr;23(4):273–278.
del Campo JA, Ampuero J, Rojas L, Conde M, Rojas Á, Maraver M, Millán R, García-Valdecasas M, García-Lozano JR, González-Escribano MF, Romero-Gómez M. Insulin resistance predicts sustained virological response to treatment of chronic hepatitis C independently of the IL28B rs12979860 polymorphism. Alimentary Pharmacology & Therapeutics 2012;n/a–n/a.[cited 2012 Nov 16 ].
Stättermayer AF, Rutter K, Beinhardt S, Scherzer T-M, Stadlmayr A, Hofer H, Wrba F, Steindl-Munda P, Krebs M, Datz C, Trauner M, Ferenci P. Association of the IL28B genotype with insulin resistance in patients with chronic hepatitis C. Journal of Hepatology 2012 Sep;57(3):492–498.[cited 2012 Nov 18 ].

41
"Reference SNP(refSNP) Cluster Report: Rs12979860." NCBI. U.S. National Library of Medicine, n.d. Web. 03 Mar. 2013.
Galmozzi E, Del Menico B, Rametta R, Dongiovanni P, Fracanzani AL, Benedan L, Borroni V, Maggioni P, Fargion S, Valenti L. A tetra-primer amplification refractory mutation system polymerase chain reaction for the evaluation of rs12979860 IL28B genotype. J. Viral Hepat. 2011 Sep;18(9):628–630.
Festa, R. D'Agostino, G. Howard, L. Mykkänen, R. P. Tracy, and S. M. Haffner, “Chronic subclinical inflammation as part of the insulin resistance syndrome: the insulin resistance atherosclerosis study (IRAS),” Circulation, vol. 102, no. 1, pp. 42–47, 2000. Pickup, J.C. Cook, M.A., “Is type II diabetes mellitus a disease of the innate immune system?” Diabetologia, vol. 41, no. 10, pp. 1241–1248, 1998. M. Shaheen, D. Echeverry, M.G. Oblad et al. “Hepatitis C, metabolic syndrome, and inflammatory markers: results from the Third National Health and Nutrition Examination Survey [NHANES III]” Diabetes Res Clin Pract, 75 (2007), pp. 320–326. E. Bugianesi, F. Salamone, F. Negro “The interaction of metabolic factors with HCV infection: does it matter?” J Hepatol, 56 (Suppl 1) (2012), pp. S56–S65. Kaddai V, Negro F. Current understanding of insulin resistance in hepatitis C. Expert Review of Gastroenterology & Hepatology 2011 Jul;5(4):503–516.[cited 2013 Apr 9 ].
McCullough AJ. Epidemiology of the metabolic syndrome in the USA. Journal of Digestive Diseases 2011;12(5):333–340.[cited 2013 Apr 9 ].
Negro F. HCV Infection and Metabolic Syndrome: Which Is the Chicken and Which Is the Egg? Gastroenterology 2012 May;142(6):1288–1292.[cited 2013 Apr 8 ].
Di Lorenzo C, Dell’Agli M, Colombo E, Sangiovanni E, Restani P. Metabolic Syndrome and Inflammation: A Critical Review of In Vitro and Clinical Approaches for Benefit Assessment of Plant Food Supplements. Evidence-Based Complementary and Alternative Medicine 2013;2013:1–10.[cited 2013 Apr 8 ]. Prokunina-Olsson L, Muchmore B, Tang W, Pfeiffer RM, Park H, Dickensheets H, Hergott D, Porter-Gill P, Mumy A, Kohaar I, Chen S, Brand N, Tarway M, Liu L, Sheikh F, Astemborski J, Bonkovsky HL, Edlin BR, Howell CD, Morgan TR, Thomas DL, Rehermann B, Donnelly RP, O’Brien TR. A variant upstream of IFNL3 (IL28B) creating a new interferon gene IFNL4 is associated with impaired clearance of hepatitis C virus. Nat Genet 2013 Feb;45(2):164–171.[cited 2013 May 5 ].

42
Balagopal A, Thomas DL, Thio CL. IL28B and the control of hepatitis C virus infection. Gastroenterology 2010 Dec;139(6):1865–1876.
Raglow Z, Thoma-Perry C, Gilroy R, Wan Y-JY. IL28B genotype and the expression of ISGs in normal liver. Liver Int. 2013 Mar.
Melis R, Fauron C, McMillin G, Lyon E, Shirts B, Hubley LM, Slev PR. Simultaneous genotyping of rs12979860 and rs8099917 variants near the IL28B locus associated with HCV clearance and treatment response. J Mol Diagn 2011 Jul;13(4):446–451.

43
CURRICULUM VITAE Leah Byars graduated from Bishop Denis J. O’Connell High School, Arlington, Virginia, in 2007. She received her Bachelor of Science in Biology from the University of Virginia in 2011. While completing her master’s degree, she worked as a manager for Atlantic Pool Company, Annandale, Virginia.


