Prepared in cooperation with the U.S. Environmental Protection Agency Investigations of the Groundwater System and Simulation of Regional Groundwater Flow for North Penn Area 7 Superfund Site, Montgomery County, Pennsylvania 75°15' 75°20' 40°15' 40°10' EXPLANATION Selected cells of model— Stream in layer 1 and pumping well in underlying layer Pumping well Stream Model boundary North Penn Area 7 boundary Discharge to stream 0 1 2 KILOMETERS 0 1 2 MILES Scientific Investigations Report 2013–5045 Version 1.1, April 2015 U.S. Department of the Interior U.S. Geological Survey
Transcript
Prepared in cooperation with the U.S. Environmental Protection Agency
Investigations of the Groundwater System and Simulation of Regional Groundwater Flow for North Penn Area 7 Superfund Site, Montgomery County, Pennsylvania
75°15' 75°20'
40°15'
40°10'
EXPLANATION
Selected cells of model—
Stream in layer 1 andpumping well in underlying layer
Pumping well
StreamModel boundary
North Penn Area 7boundary Discharge to stream
0 1 2 KILOMETERS
0 1 2 MILES
Scientific Investigations Report 2013–5045Version 1.1, April 2015
U.S. Department of the InteriorU.S. Geological Survey
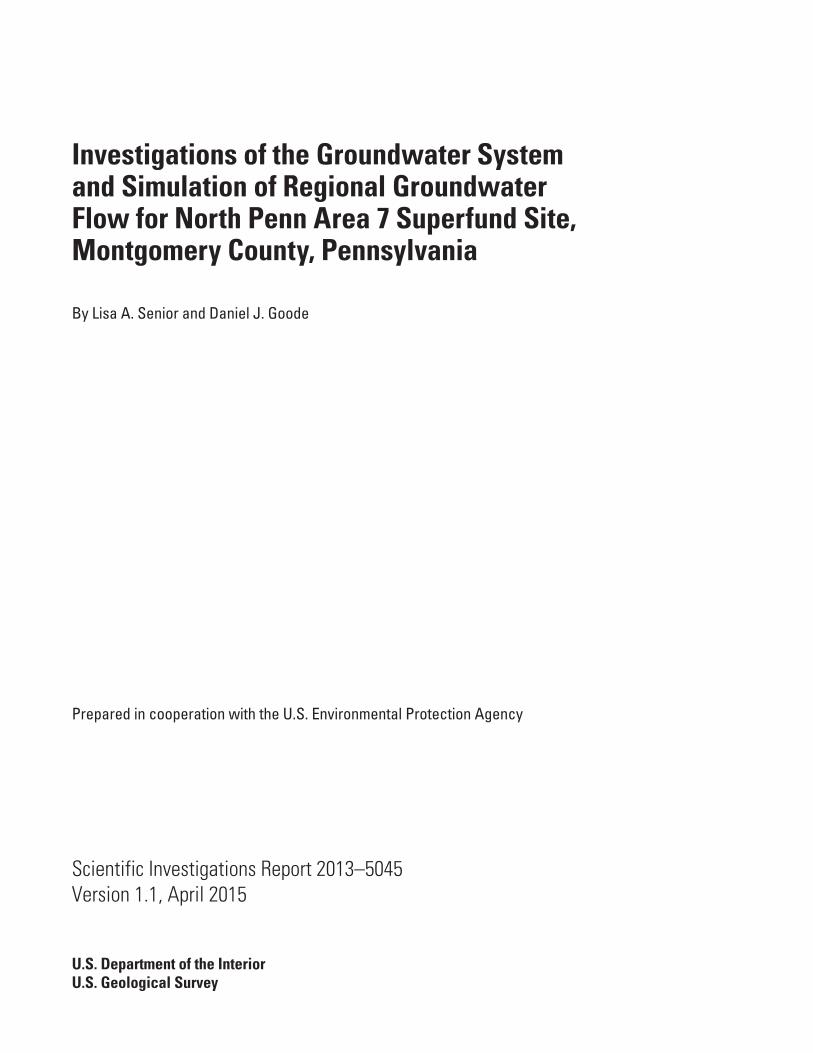
Front cover. Model boundary, streams cells, and pumped well cells for model of North Penn Area 7 Superfund site, Upper Gwynedd Township and vicinity, Montgomery County, Pennsylvania.
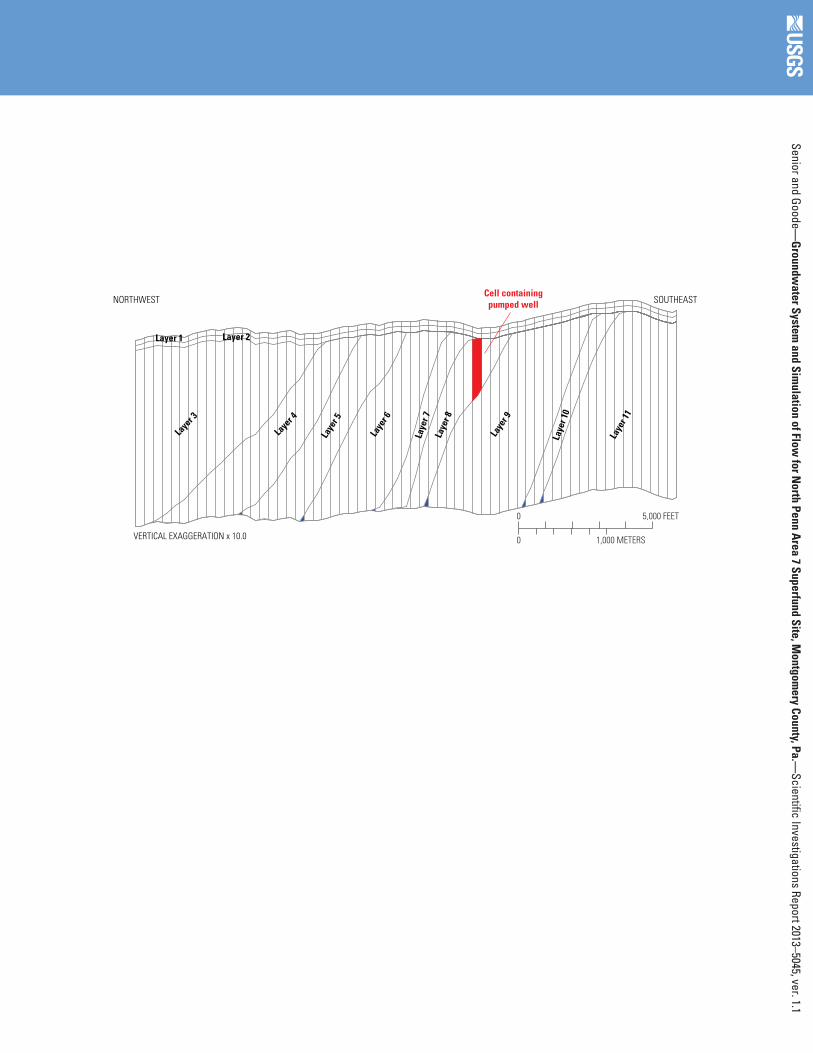
Back cover. Cross section in the dip direction of model grid for North Penn Area 7 Superfund site, Upper Gwynedd Township and vicinity, Montgomery County, Pennsylvania. (See figure 33 for location of line of section.)
Investigations of the Groundwater System and Simulation of Regional Groundwater Flow for North Penn Area 7 Superfund Site, Montgomery County, Pennsylvania
By Lisa A. Senior and Daniel J. Goode
Prepared in cooperation with the U.S. Environmental Protection Agency
Scientific Investigations Report 2013–5045Version 1.1, April 2015
U.S. Department of the InteriorU.S. Geological Survey
U.S. Department of the InteriorKEN SALAZAR, Secretary
U.S. Geological SurveySuzette M. Kimball, Acting Director
U.S. Geological Survey, Reston, Virginia: 2013 Revised: April 2015
For more information on the USGS—the Federal source for science about the Earth, its natural and living resources, natural hazards, and the environment, visit http://www.usgs.gov or call 1–888–ASK–USGS.
For an overview of USGS information products, including maps, imagery, and publications, visit http://www.usgs.gov/pubprod
To order this and other USGS information products, visit http://store.usgs.gov
Any use of trade, firm, or product names is for descriptive purposes only and does not imply endorsement by the U.S. Government.
Although this information product, for the most part, is in the public domain, it also may contain copyrighted materials as noted in the text. Permission to reproduce copyrighted items must be secured from the copyright owner.
Suggested citation:Senior, L.A., and Goode, D.J., 2013, Investigations of groundwater system and simulation of regional groundwater flow for North Penn Area 7 Superfund site, Montgomery County, Pennsylvania (ver. 1.1, April 2015: U.S. Geological Survey Scientific Investigations Report 2013–5045, 95 p.
AcknowledgmentsThe authors wish to thank the U.S. Geological Survey personnel who contributed
substantially to this report. Philip H. Bird conducted borehole video logging, and Allan J. Ruddy and Leif E. Olson conducted water-level and streamflow measurements. Peter J. Cinotto, Leif E. Olson, and Robert Rosman conducted aquifer-interval isolation (packer) testing. Randall W. Conger conducted geophysical logging. J. Jeffrey Starn provided guidance on probabilistic modeling, and Richard B. Winston provided guidance on model preprocessing.
The authors gratefully acknowledge the assistance of U.S. Environmental Protection Agency (USEPA) project managers Deanna Moultrie-Jackson and David Turner, the guidance of USEPA hydrogeologist Kathy Davies, and the cooperation of CDM Federal Programs Corporation (USEPA contractor) consultants Andrew Hopton, Aaron Frantz, and Andrea Soo. Property and well owners in the study area are thanked for giving permission to access sampling locations.
Purpose and scope ...............................................................................................................................4Previous Investigations........................................................................................................................4Well-Identification System ..................................................................................................................5
Geologic and Hydrogeologic Setting ..........................................................................................................5Geologic Setting ....................................................................................................................................5Hydrogeologic Setting .........................................................................................................................8
Summary of Field Investigations of Groundwater System at North Penn Area 7 .............................11Geophysical Logs ................................................................................................................................11Aquifer Tests ........................................................................................................................................16
Groundwater Levels ...........................................................................................................................26Streamflow Measurements and Groundwater/Surface-Water Relations ................................28Groundwater Quality at North Penn Area 7 ...................................................................................30
Groundwater Quality in Isolated Intervals ............................................................................30Groundwater Quality in Existing and New Monitor Wells ..................................................31
Volatile Organic Compounds and Metals .....................................................................33Selected Inorganic Constituents ...................................................................................33
Inorganic Constituents as Tracers or Indicator of Lithology .....................................43Simulation of Regional Groundwater Flow ..............................................................................................43
Estimation of Regional-Scale Aquifer Hydraulic Properties ......................................................43Numerical Simulation of Regional Groundwater Flow .................................................................43
Conceptual Model .....................................................................................................................44Model Structure and Boundary Conditions ...........................................................................44Calibration Methods ..................................................................................................................48Recharge and Discharge ..........................................................................................................49Measured and Simulated Water Levels in Wells .................................................................51Estimated Aquifer Hydraulic Properties and Recharge Rates ...........................................58
Regional Groundwater-Flow Paths ..................................................................................................61Simulated Flow Paths, Contributing Areas, and Uncertainty ......................................................61Groundwater-Flow Paths in 1990 .....................................................................................................63Groundwater-Flow Paths in 1996 .....................................................................................................66Groundwater-Flow Paths in 2000 .....................................................................................................66
v
Groundwater-Flow Paths in 2005 .....................................................................................................71Groundwater/Surface-Water Interactions .....................................................................................71Simulated Shutdown of Well MG-202 ..............................................................................................71Relation Between Water Quality and Groundwater Flow ............................................................76
Inferred Flow Paths from Distribution of Measured Contaminants .................................76Inferred Flow Paths from Observed Inorganic Constituent Distribution ..........................82
Limitations and Uncertainties in Predictive Simulations .............................................................85Summary and Conclusions .........................................................................................................................85References Cited..........................................................................................................................................87
Figures 1. Map showing location of the North Penn Area 7 Superfund site and selected wells,
Upper Gwynedd Township and vicinity, Montgomery County, Pennsylvania .....................3 2. Map showing physiographic provinces in southeastern Pennsylvania .............................6 3. Map showing units of bedrock underlying North Penn Area 7 Superfund site and
model boundary for North Penn Area 6 , Upper Gwynedd Township and vicinity, Montgomery County, Pennsylvania ...........................................................................................7
4. Map showing preliminary revised lithologic mapping of bedrock geology at and near North Penn Area 7 Superfund site, Upper Gwynedd Township and vicinity, Montgomery County, Pennsylvania ...........................................................................................9
5. A, cross section showing conceptual groundwater-flow system in dipping-bed fractured sedimentary rock aquifer and B, schematic cross section showing numerical simulation of groundwater flow in conceptual dipping-bed sedimentary rock aquifer with layered units of high and low permeability .............................................10
6. Map showing location of existing and new monitor wells with geophysical logs and packer tests conducted by U.S. Geological Survey at and near the North Penn Area 7 Superfund site, Upper Gwynedd Township and vicinity, Montgomery County, Pennsylvania, 2000–2005 ...........................................................................................................14
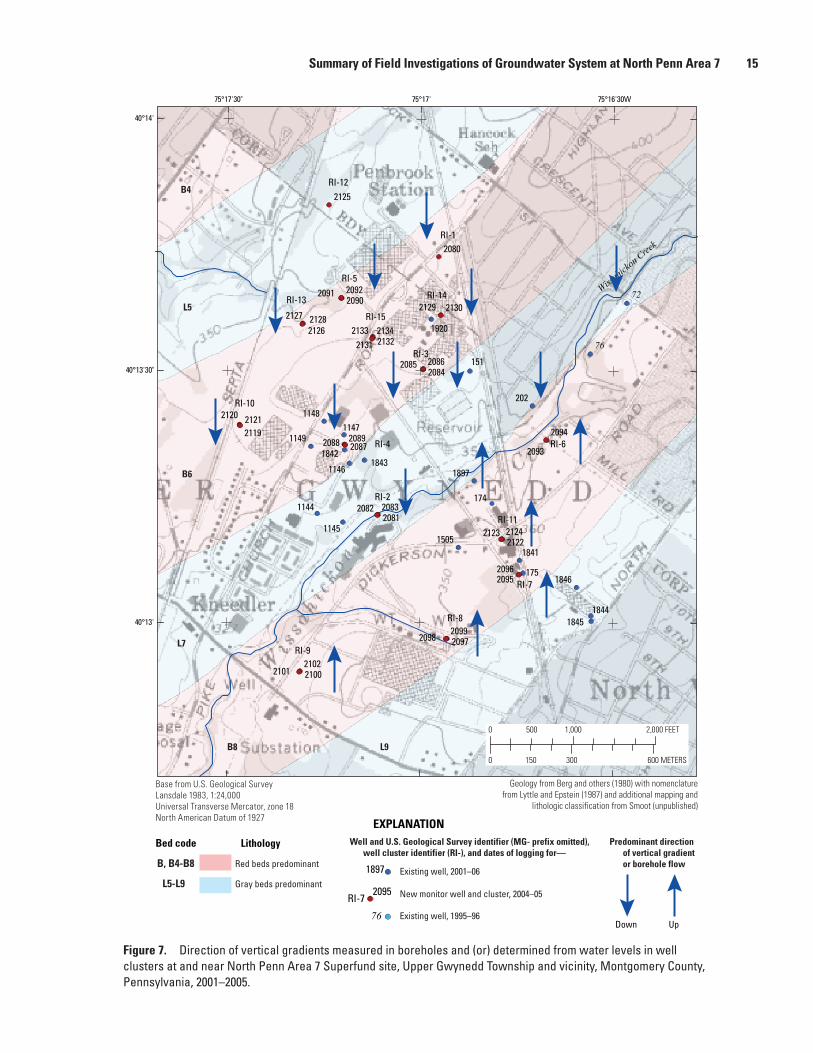
7. Map showing direction of vertical gradients measured in boreholes and (or) determined from water levels in well clusters at and near North Penn Area 7 Superfund site, Upper Gwynedd Township and vicinity, Montgomery County, Pennsylvania, 2001–2005 ...........................................................................................................15
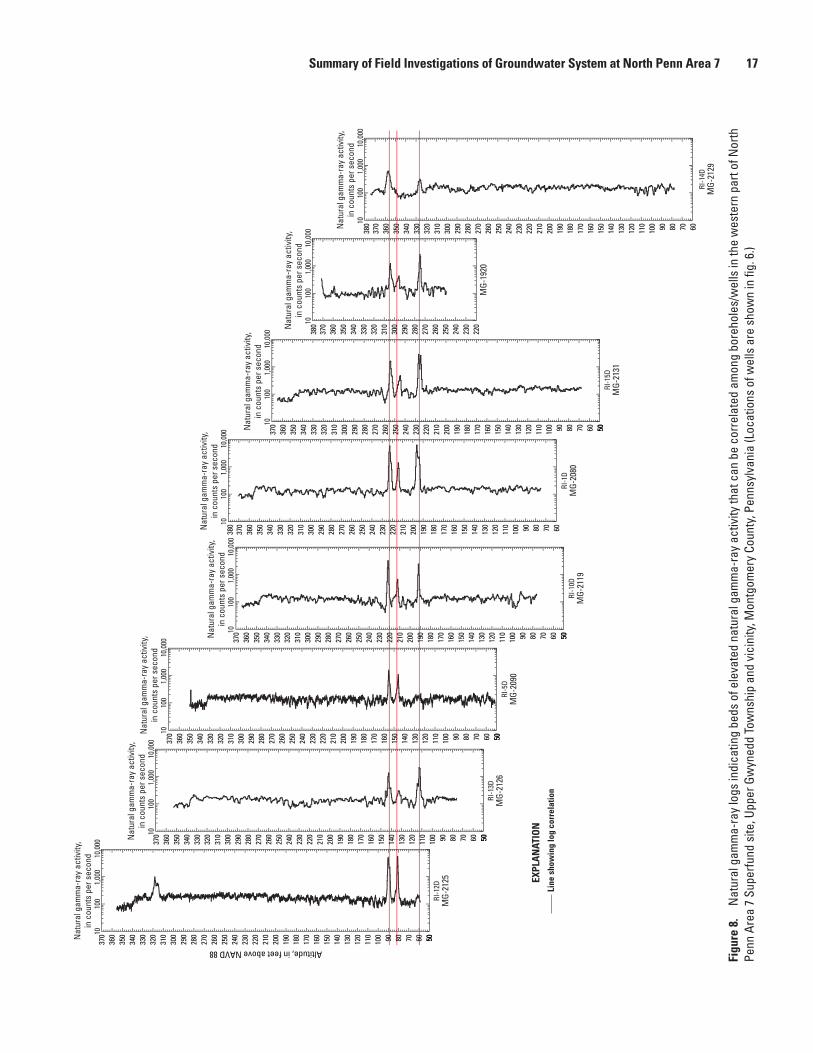
8. Natural gamma-ray logs indicating beds of elevated natural gamma-ray activity that can be correlated among boreholes/wells in the western part of North Penn Area 7 Superfund site, Upper Gwynedd Township and vicinity, Montgomery County, Pennsylvania ...............................................................................................................................17
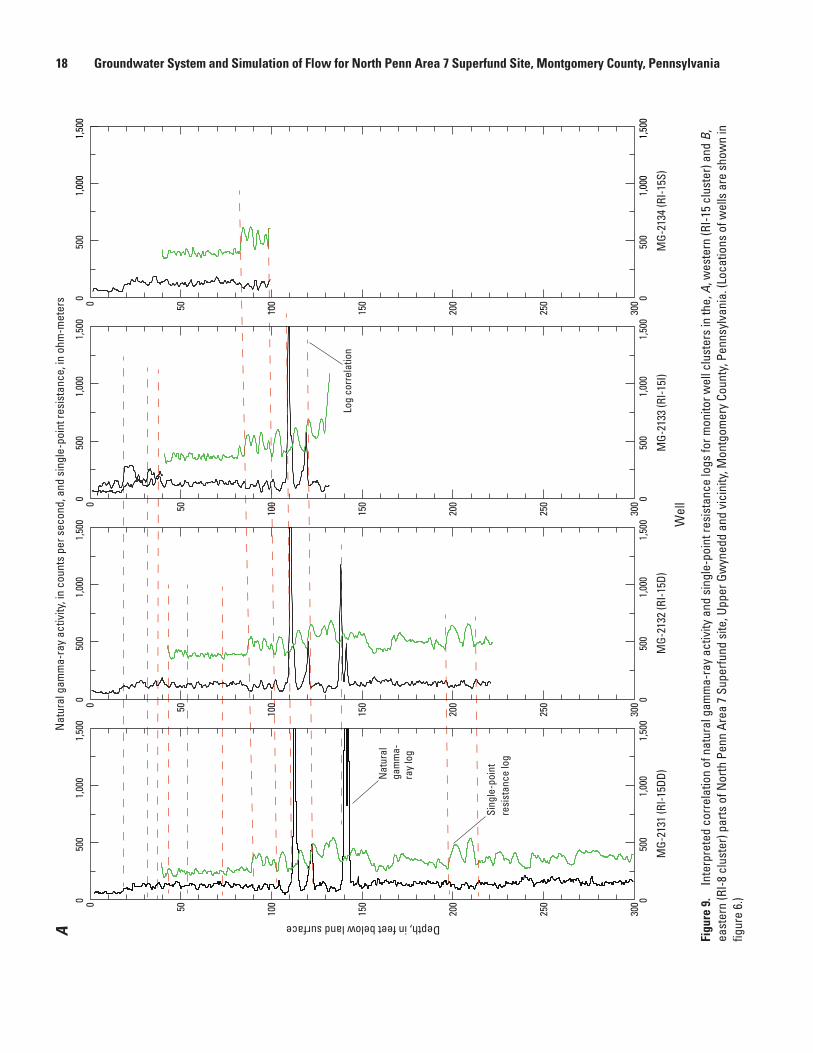
9. Interpreted correlation of natural gamma-ray activity and single-point resistance logs for monitor well clusters in the A, western (RI-15 cluster) and B, eastern (RI-8 cluster) parts of North Penn Area 7 Superfund site, Upper Gwynedd and vicinity, Montgomery County, Pennsylvania .........................................................................................18
10. Graph showing water levels in the isolated interval of 193 to 215 ft below land surface and adjacent intervals in well MG-2131 (RI-15DD) during the single-well packer tests, North Penn Area 7 Superfund site, Upper Gwynedd Township and vicinity, Montgomery County, Pennsylvania, June 10, 2005 ................................................20
vi
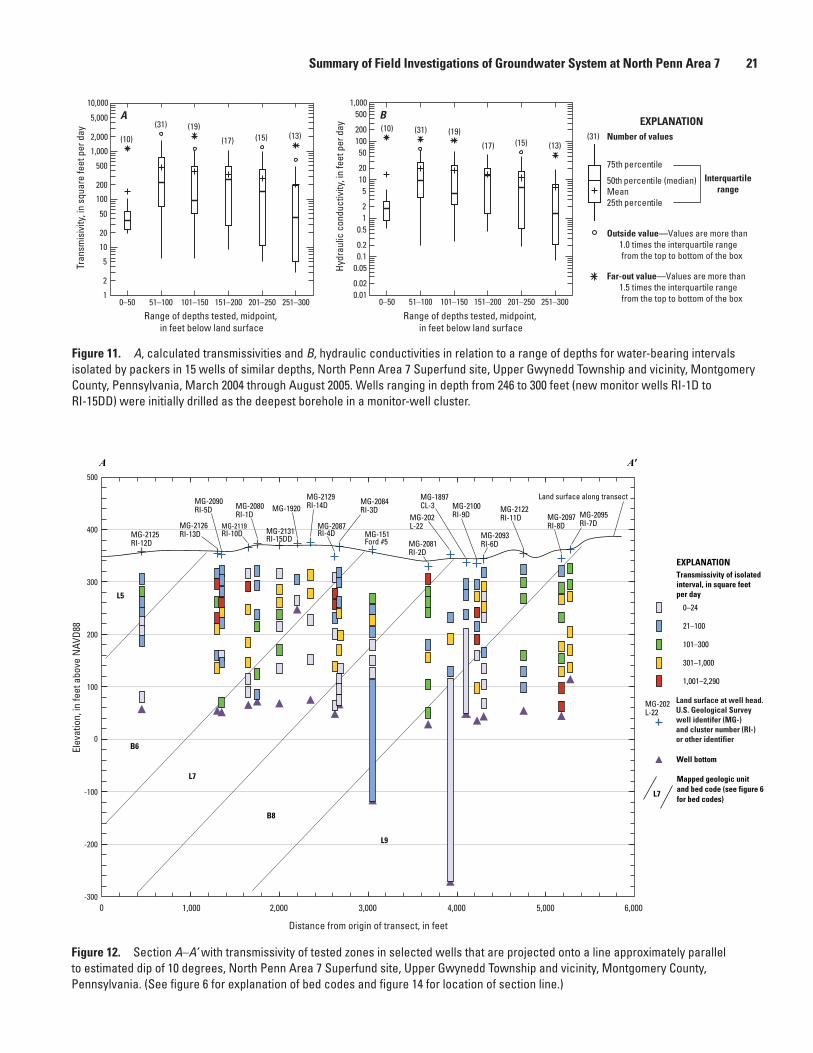
11. Boxplots showing A, calculated transmissivities and B, hydraulic conductivities in relation to a range of depths for water-bearing intervals isolated by packers in 15 wells of similar depths, North Penn Area 7 Superfund site, Upper Gwynedd Township and vicinity, Montgomery County, Pennsylvania, March 2004 through August 2005 ..................................................................................................................................21
12. Section A–A’ with transmissivity of tested zones in selected wells that are projected onto a line approximately parallel to estimated dip of 10 degrees, North Penn Area 7 Superfund site, Upper Gwynedd Township and vicinity, Montgomery County, Pennsylvania ...............................................................................................................................21
13. Boxplots showing A, calculated transmissivities and B, hydraulic conductivities, by mapped geologic unit, for water-bearing intervals isolated by packers in 15 wells of similar depths, North Penn Area 7 Superfund site, Upper Gwynedd Township and vicinity, Montgomery County, Pennsylvania, March 2004 through August 2005 ..............22
14. Map showing location of pumped production and observation wells used for multiple well aquifer tests, and lines of section A–A’ and B–B’, at North Penn Area 7 Superfund site, Upper Gwynedd Township and vicinity, Montgomery County, Pennsylvania, 2002–2005 ...........................................................................................................23
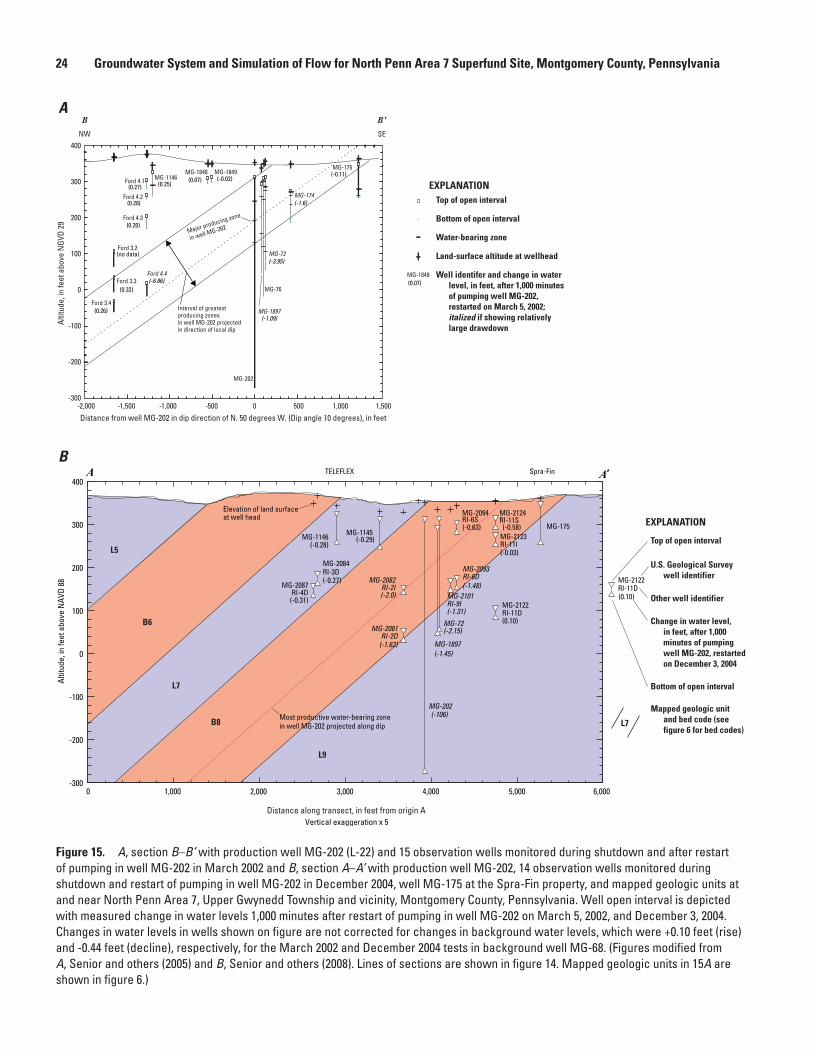
15. A, section A–A’ with production well MG-202 (L-22) and 15 observation wells monitored during shutdown and after restart of pumping in well MG-202 in March 2002 and B, section B–B’ with production well MG-202, 14 observation wells monitored during shutdown and restart of pumping in well MG-202 in December 2004, well MG-175 at the Spra-Fin property, and mapped geologic units at and near North Penn Area 7, Upper Gwynedd Township and vicinity, Montgomery County, Pennsylvania ...............................................................................................................................24
16. Water-level responses to pumping of isolated intervals in well MG-2131 (RI-15DD) in June 2005, North Penn Area 7 Superfund site, Upper Gwynedd Township and vicinity, Montgomery County, Pennsylvania ...................................................................25
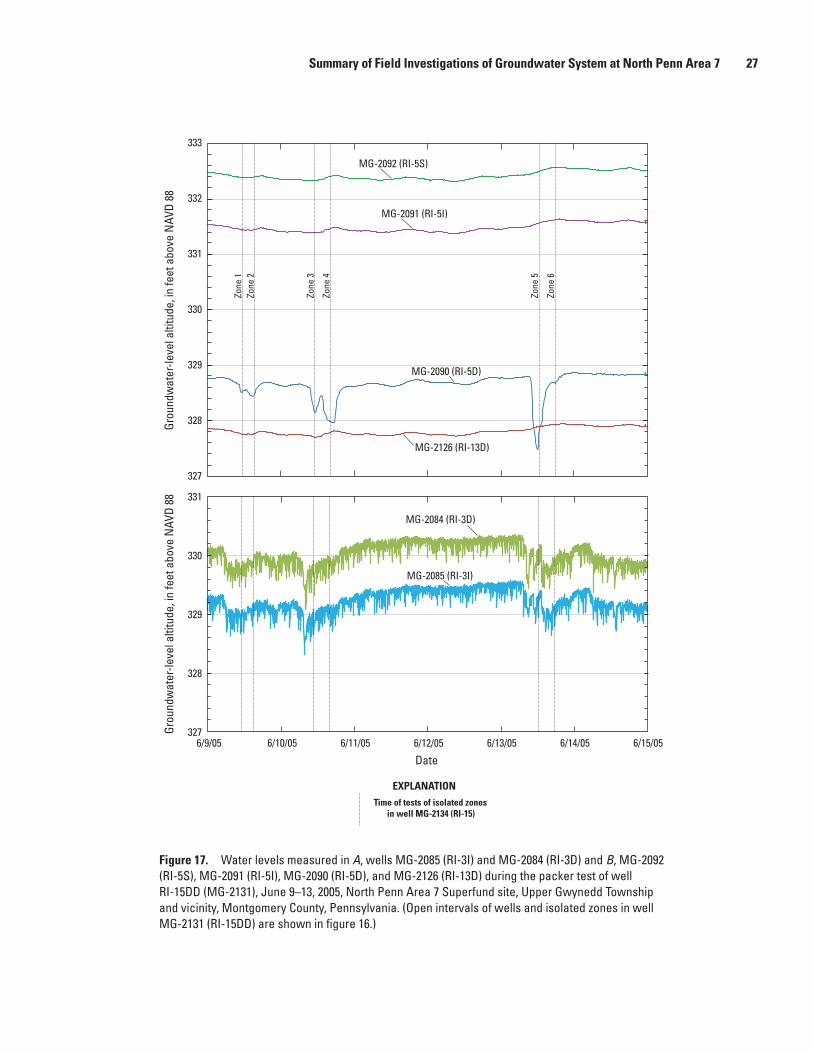
17. Graphs showing water levels measured in A, wells MG-2085 (RI-3I) and MG-2084 (RI-3D) and B, MG-2092 (RI-5S), MG-2091 (RI-5I), MG-2090 (RI-5D), and MG-2126 (RI-13D) during the packer test of well RI-15DD (MG-2131), June 9–13, 2005, North Penn Area 7 Superfund site, Upper Gwynedd Township and vicinity, Montgomery County, Pennsylvania .........................................................................................27
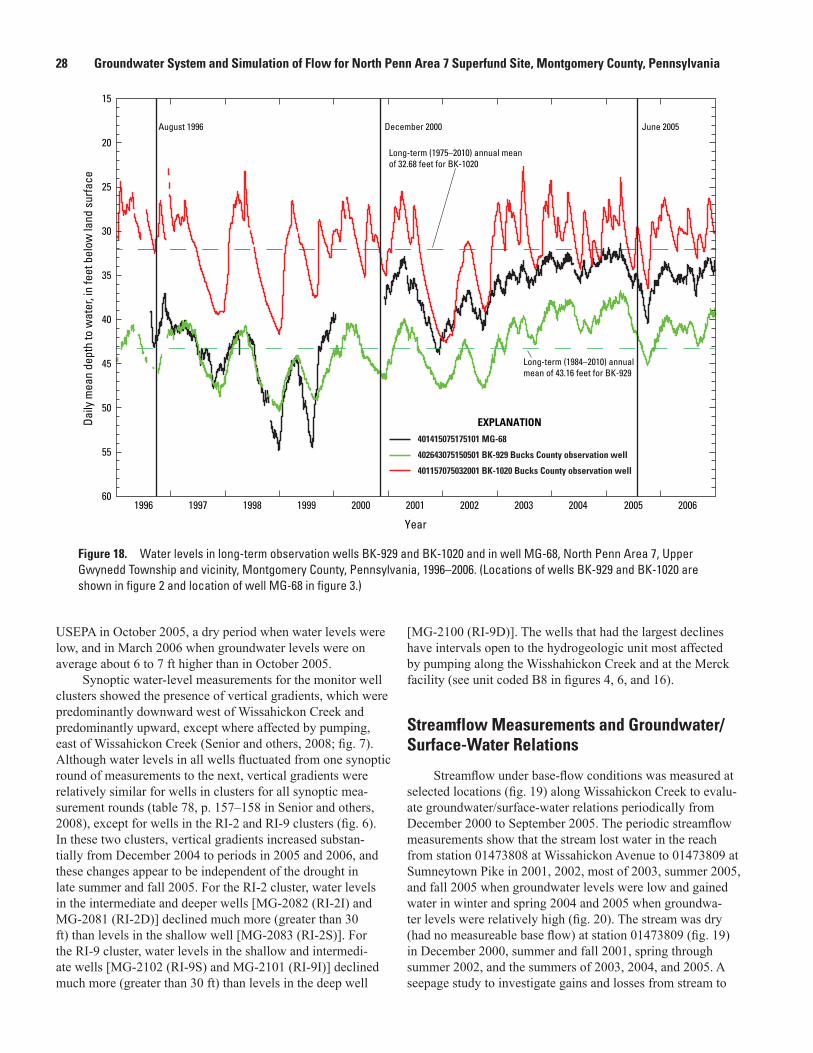
18. Graph showing water levels in long-term observation wells BK-929 and BK-1020 and in well MG-68, North Penn Area 7, Upper Gwynedd Township and vicinity, Montgomery County, Pennsylvania, 1996–2006 .....................................................................28
19. Map showing location of pumped wells with pumping rates, observation wells, and streamflow-measurement sites for the June 2003 seepage investigation on Wissahickon Creek and lithology at and near North Penn Area 7, Upper Gwynedd Township and vicinity, Montgomery County, Pennsylvania .................................................29
20. Graph showing measured groundwater levels (shown as altitudes) in wells MG-72, MG-1145, and MG-1146 and estimated altitudes of the streambed of Wissahickon Creek near the wells, at and near North Penn Area 7 Superfund site, Upper Gwynedd Township and vicinity, Montgomery County, Pennsylvania, December 2000–November 2006 ..............................................................................................30
21. Graphs showing specific conductance, acid neutralizing capacity as estimate of alkalinity, pH, and concentrations of dissolved oxygen, nitrate, and sulfate measured in the field in water samples from isolated zones in 15 deep monitor wells, North Penn Area 7 Superfund site, Upper Gwynedd Township and vicinity, Montgomery County, Pennsylvania, March 2004 through August 2005 ............................32
vii
22. Map showing chloride concentrations in samples collected in spring 2006 from monitor well clusters and open-hole wells and line of section A–A’, North Penn Area 7 Superfund site, Upper Gwynedd Township and vicinity, Montgomery County, Pennsylvania ...............................................................................................................................34
23. Locations of monitor wells projected onto a line parallel to dip and chloride concentrations in samples collected from the monitor wells in spring 2006, North Penn Area 7 Superfund site, Upper Gwynedd Township and vicinity, Montgomery County, Pennsylvania .........................................................................................35
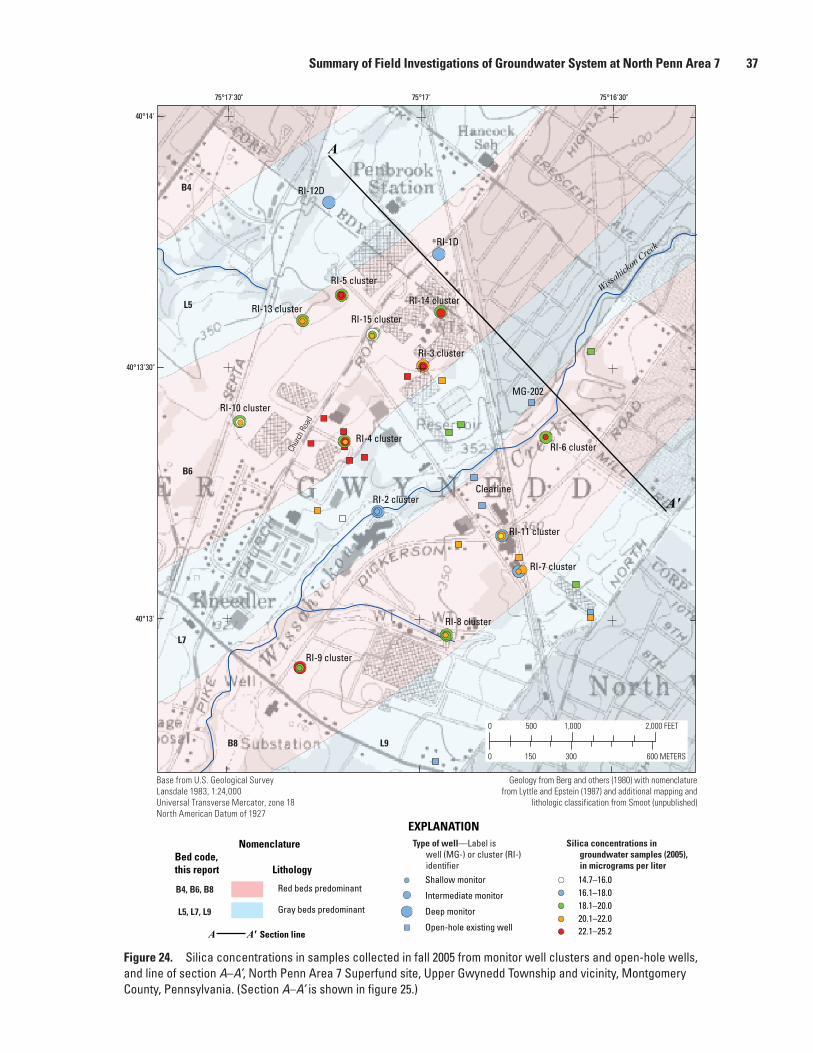
24. Map showing silica concentrations in samples collected in fall 2005 from monitor well clusters and open-hole wells, and line of section A–A’, North Penn Area 7 Superfund site, Upper Gwynedd Township and vicinity, Montgomery County, Pennsylvania ...............................................................................................................................37
25. Graph showing locations of monitor wells projected onto a line parallel to dip and silica concentrations in samples collected from the monitor wells in fall 2005, North Penn Area 7 Superfund site, Upper Gwynedd Township and vicinity, Montgomery County, Pennsylvania .........................................................................................38
26. Map showing boron concentrations in samples collected in spring 2006 from monitor well clusters and open-hole wells, and line of section A–A’, North Penn Area 7 Superfund site, Upper Gwynedd Township and vicinity, Montgomery County, Pennsylvania ...............................................................................................................................39
27. Graph showing locations of monitor wells projected onto a line parallel to dip and boron concentrations in samples collected from the monitor wells in spring 2006, North Penn Area 7 Superfund site, Upper Gwynedd Township and vicinity, Montgomery County, Pennsylvania ...................................................................40
28. Graph showing chloride/bromide mass ratio in relation to chloride concentration in water samples collected in March 2006 from monitor wells at and near North Penn Area 7 Superfund site, Upper Gwynedd Township and vicinity, Montgomery County, Pennsylvania .................................................................................................................41
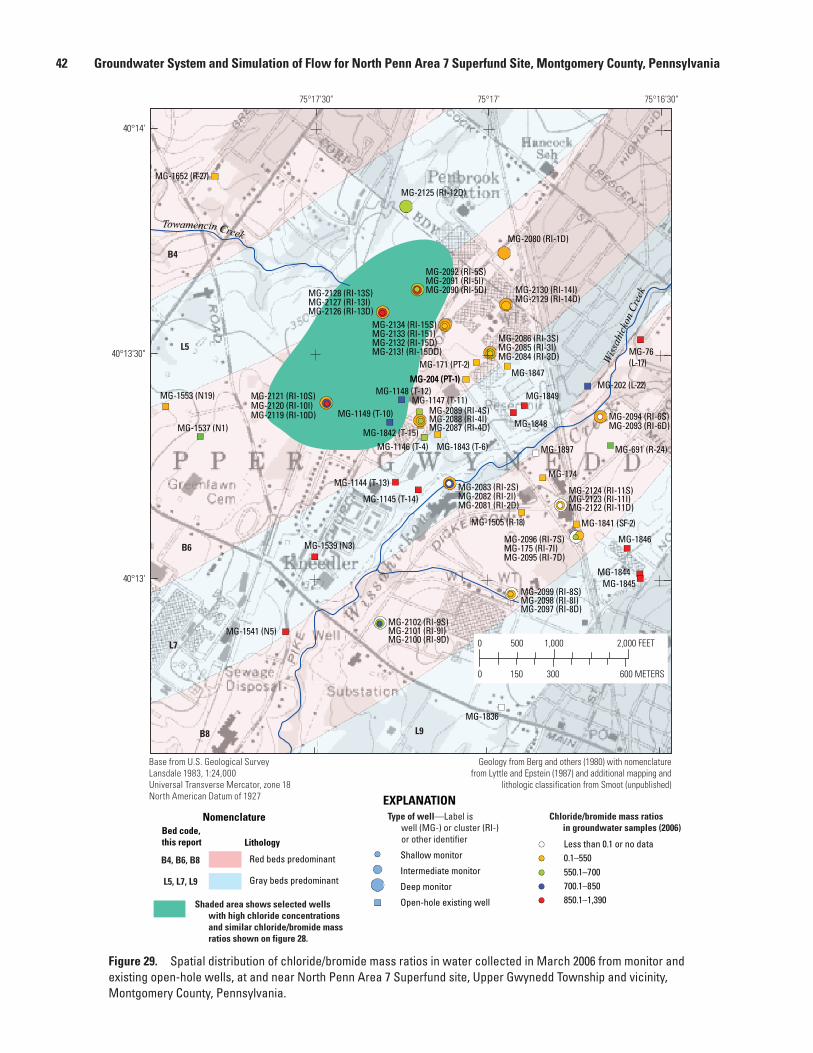
29. Map showing spatial distribution of chloride/bromide mass ratios in water collected in March 2006 from monitor and existing open-hole wells, at and near North Penn Area 7 Superfund site, Upper Gwynedd Township and vicinity, Montgomery County, Pennsylvania ...............................................................................................................................42
30. Map showing model boundary, streams cells, and pumped well cells for model of North Penn Area 7 Superfund site, Upper Gwynedd Township and vicinity, Montgomery County, Pennsylvania .........................................................................................45
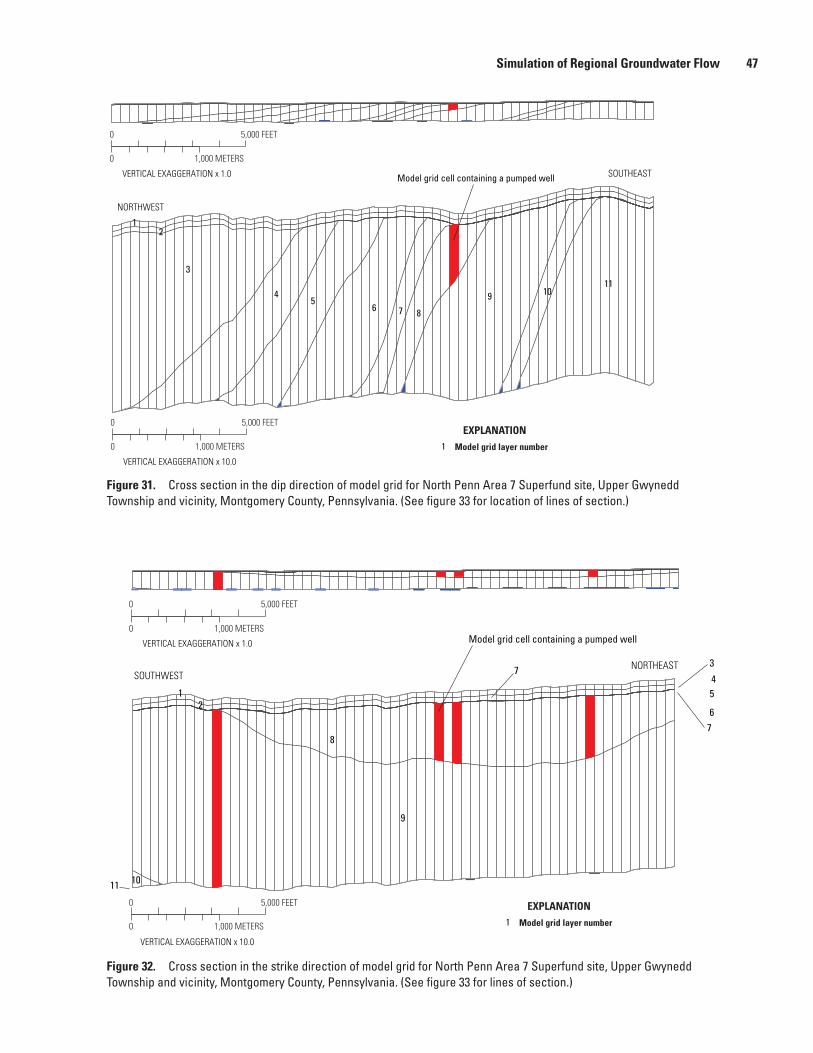
31. Cross section in the dip direction of model grid for North Penn Area 7 Superfund site, Upper Gwynedd Township and vicinity, Montgomery County, Pennsylvania ..........47
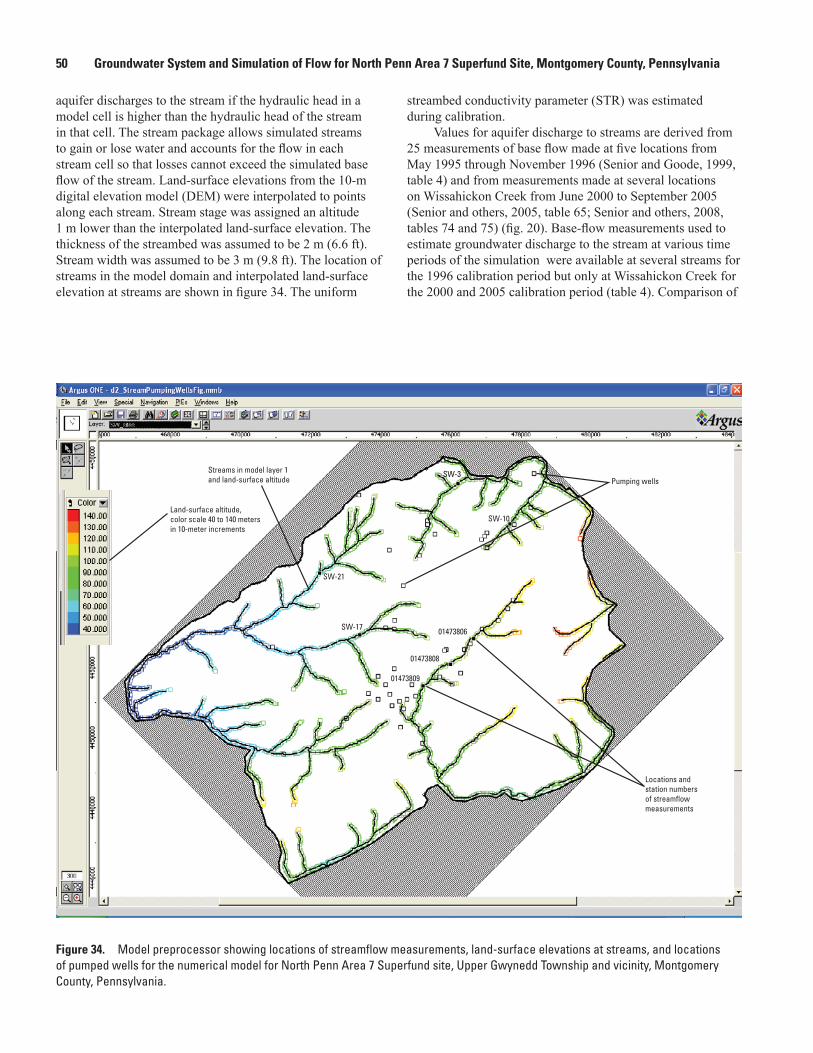
32. Cross section in the strike direction of model grid for North Penn Area 7 Superfund site, Upper Gwynedd Township and vicinity, Montgomery County, Pennsylvania ..........47
33. Screen capture of model preprocessor showing structural contours for top of bed B4 (projected), layer 10 thickness for the model, and lines of section, North Penn Area 7 Superfund site, Upper Gwynedd Township and vicinity, Montgomery County, Pennsylvania ...............................................................................................................................48
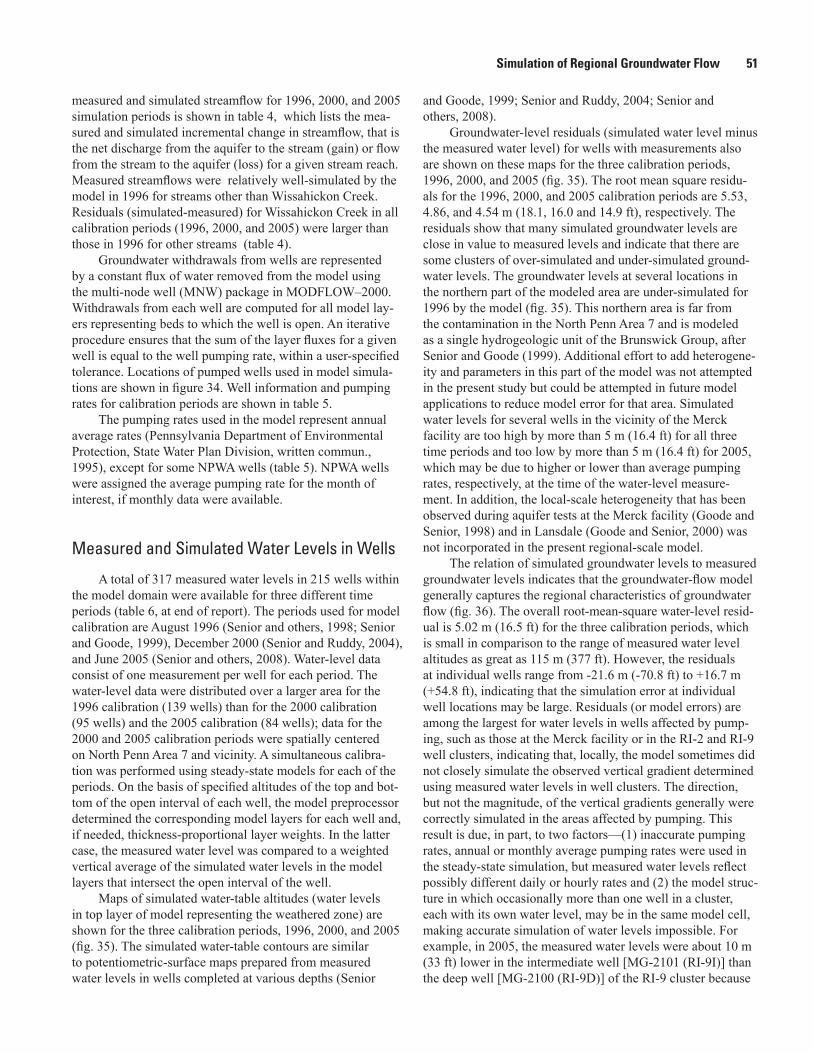
34. Screen capture of model preprocessor showing locations of streamflow measurements, land-surface elevations at streams, and locations of pumped wells for the numerical model for North Penn Area 7 Superfund site, Upper Gwynedd Township and vicinity, Montgomery County, Pennsylvania .................................................50
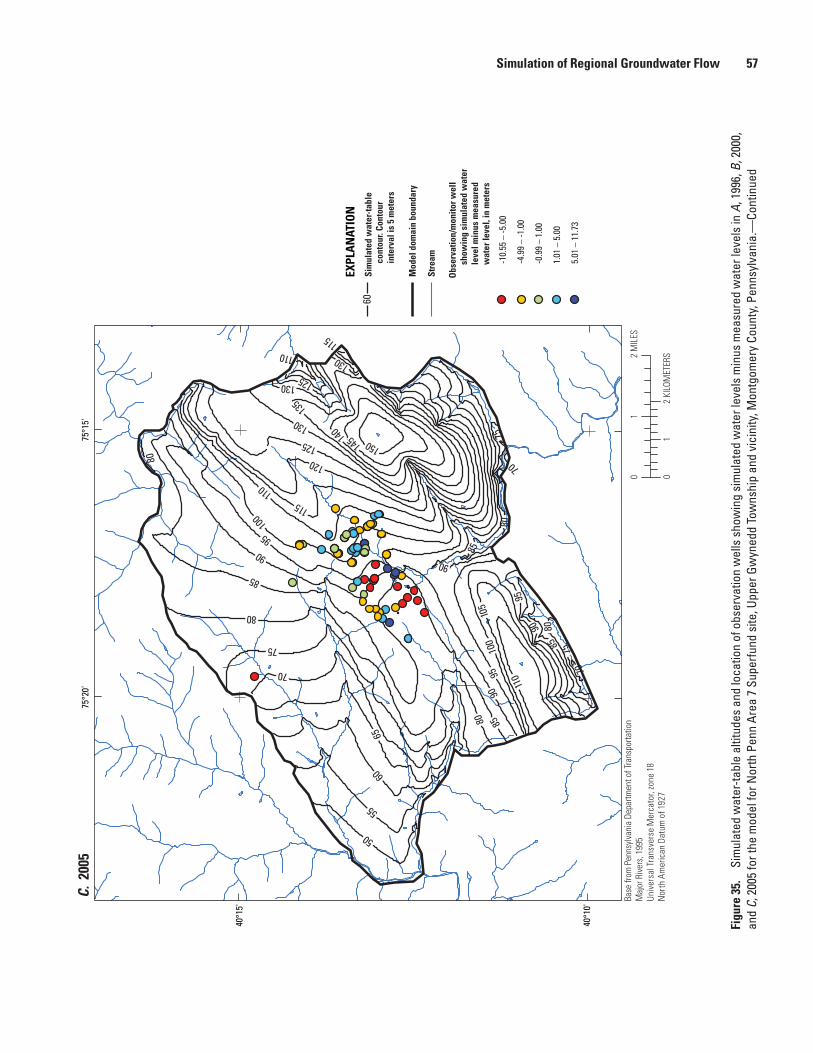
35. Map showing simulated water-table altitudes and location of observation wells showing simulated water levels minus measured water levels in A, 1996, B, 2000, and C, 2005 for the model for North Penn Area 7 Superfund site, Upper Gwynedd Township and vicinity, Montgomery County, Pennsylvania .................................................55
viii
36. Graph showing relation of measured groundwater-level altitudes to groundwater- level altitudes simulated by the numerical model for North Penn Area 7 Superfund site, Upper Gwynedd Township and vicinity, Montgomery County, Pennsylvania ..........58
37. Graph showing sensitivity of model calibration to model parameters for groundwater-flow simulation of North Penn Area 7 Superfund site and vicinity, Upper Gwynedd Township and vicinity, Montgomery County, Pennsylvania ...................60
38. Map showing simulated groundwater-flow paths extending from contaminant source areas to pumped wells for pumping conditions in 1990 for North Penn Area 7 Superfund site, Upper Gwynedd Township and vicinity, Montgomery County, Pennsylvania ...............................................................................................................................64
39. Map showing simulated area contributing recharge to well MG-202 (L-22) for pumping conditions in 1990 for North Penn Area 7 Superfund site, Upper Gwynedd Township and vicinity, Montgomery County, Pennsylvania ...................65
40. Map showing simulated groundwater-flow paths extending from contaminant source areas to pumped wells for pumping conditions in 1996 for North Penn Area 7 Superfund site, Upper Gwynedd Township and vicinity, Montgomery County, Pennsylvania .........................................................................................67
41. Map showing simulated area contributing recharge to well MG-202 (L-22) for pumping conditions in 1996 for North Penn Area 7 Superfund site, Upper Gwynedd Township and vicinity, Montgomery County, Pennsylvania ...................68
42. Map showing simulated groundwater-flow paths extending from contaminant source areas to pumped wells for pumping conditions in 2000 for North Penn Area 7 Superfund site, Upper Gwynedd Township and vicinity, Montgomery County, Pennsylvania .........................................................................................69
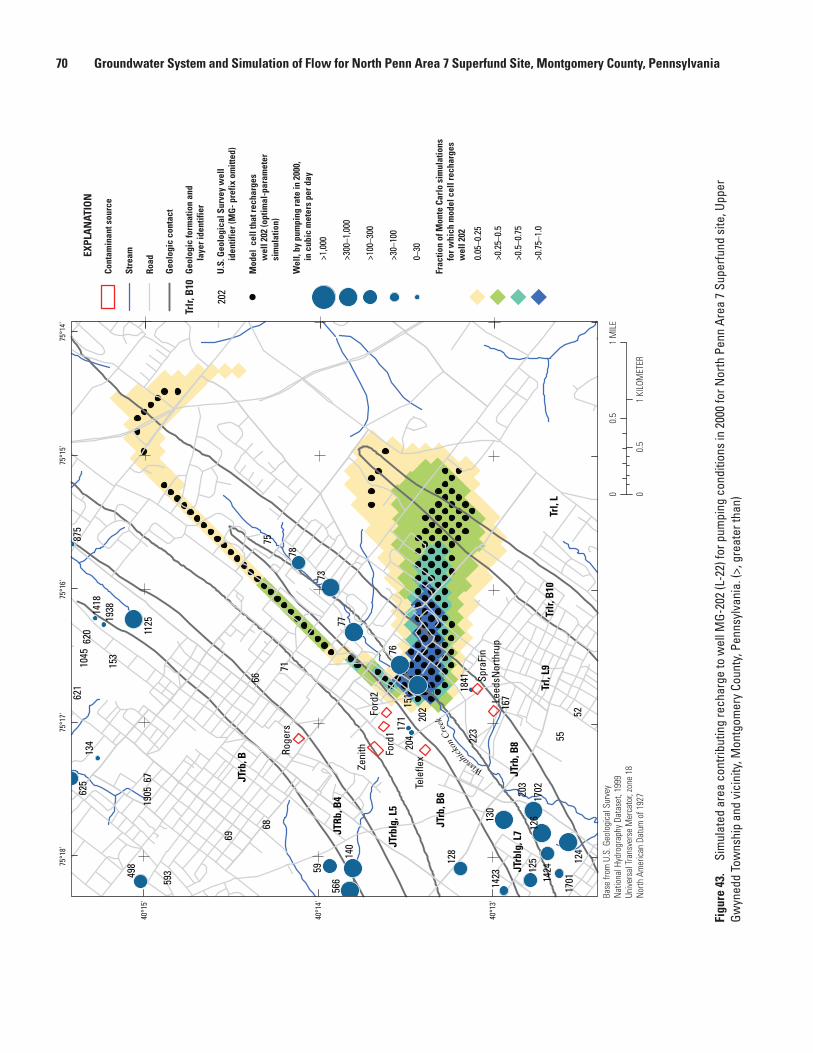
43. Map showing simulated area contributing recharge to well MG-202 (L-22) for pumping conditions in 2000 for North Penn Area 7 Superfund site, Upper Gwynedd Township and vicinity, Montgomery County, Pennsylvania ...................70
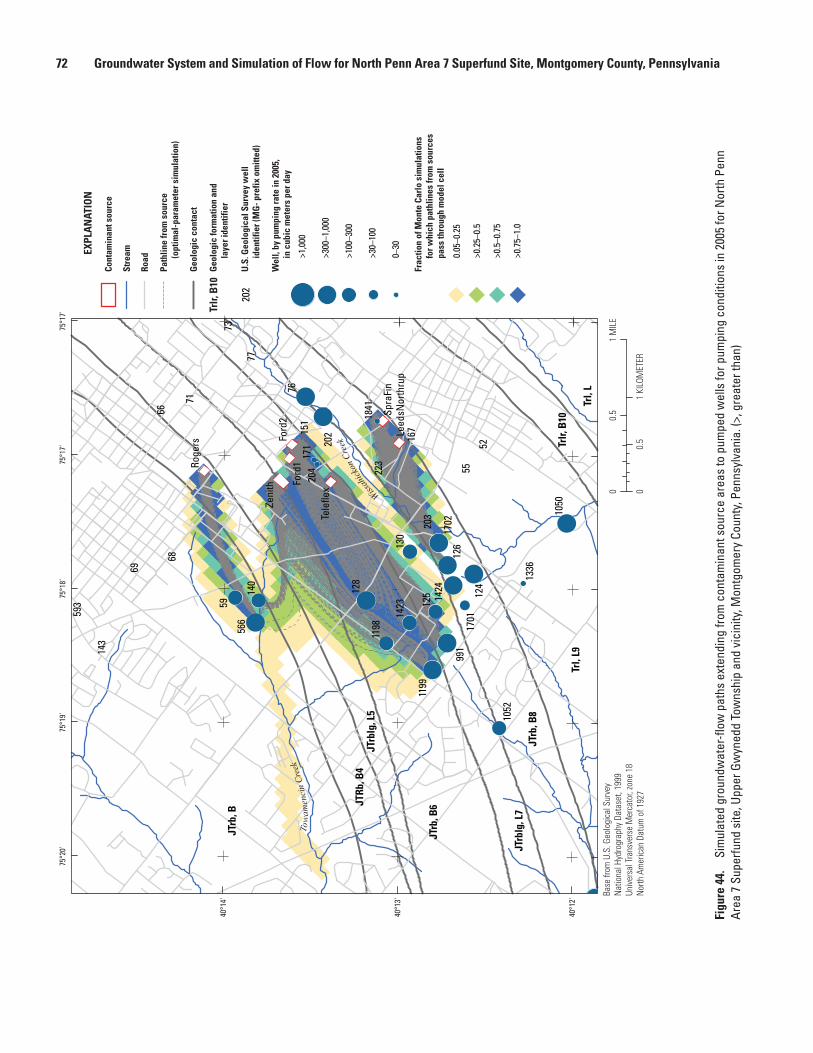
44. Map showing simulated groundwater-flow paths extending from contaminant source areas to pumped wells for pumping conditions in 2005 for North Penn Area 7 Superfund site, Upper Gwynedd Township and vicinity, Montgomery County, Pennsylvania .........................................................................................72
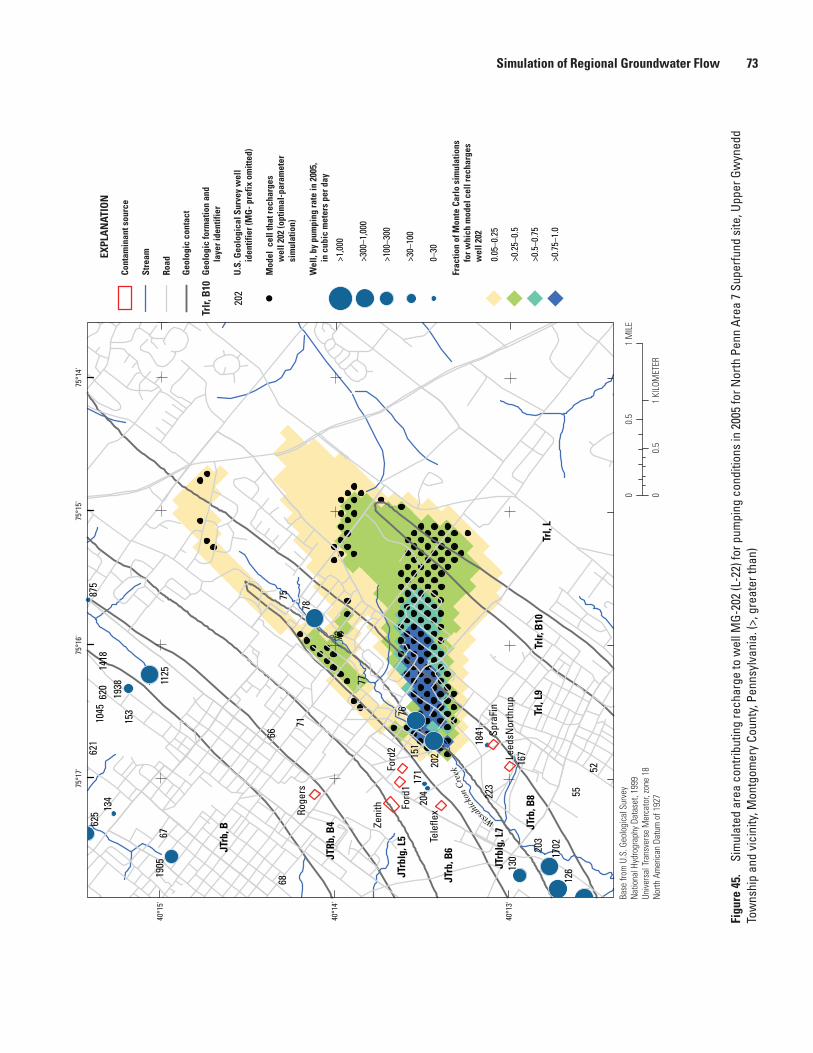
45. Map showing simulated area contributing recharge to well MG-202 (L-22) for pumping conditions in 2005 for North Penn Area 7 Superfund site, Upper Gwynedd Township and vicinity, Montgomery County, Pennsylvania ...................73
46. Map showing simulated stream loss and stream gain for the Upper Wissahickon Creek and other streams, and pumping rates for selected wells, in 2005, for the model for North Penn Area 7 Superfund site, Upper Gwynedd Township and vicinity, Montgomery County, Pennsylvania ...................................................................74
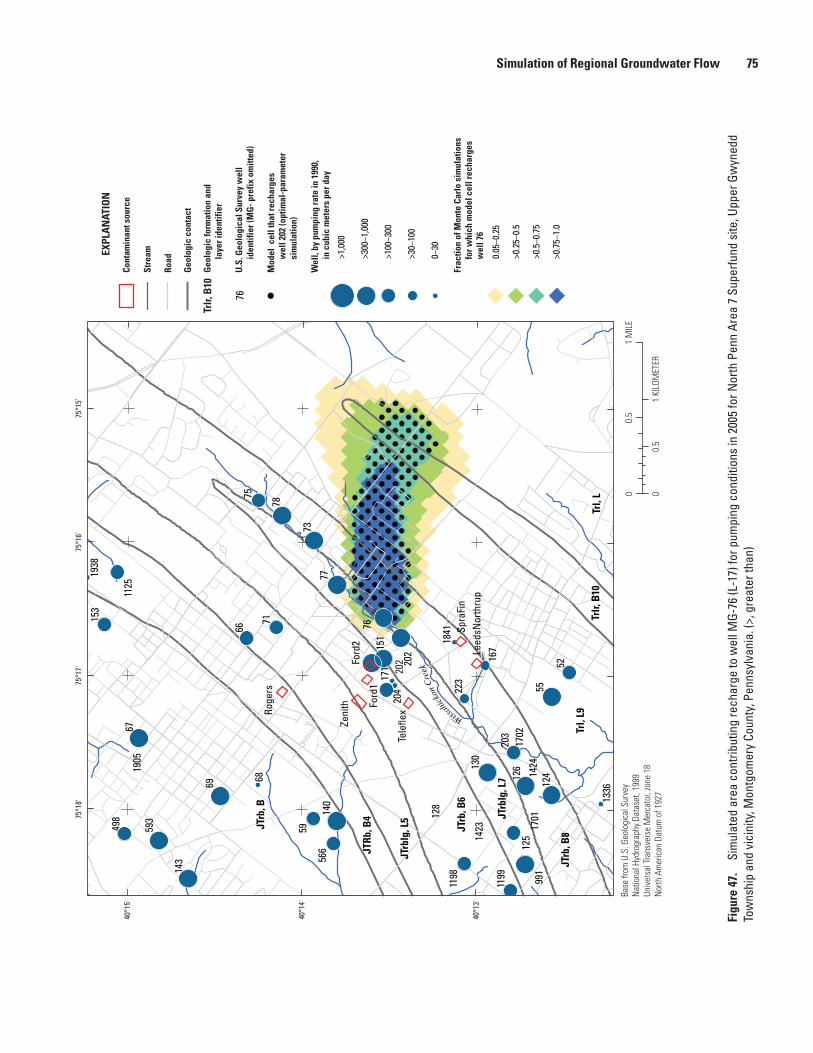
47. Map showing simulated area contributing recharge to well MG-76 (L-17) for pumping conditions in 2005 for North Penn Area 7 Superfund site, Upper Gwynedd Township and vicinity, Montgomery County, Pennsylvania ...................75
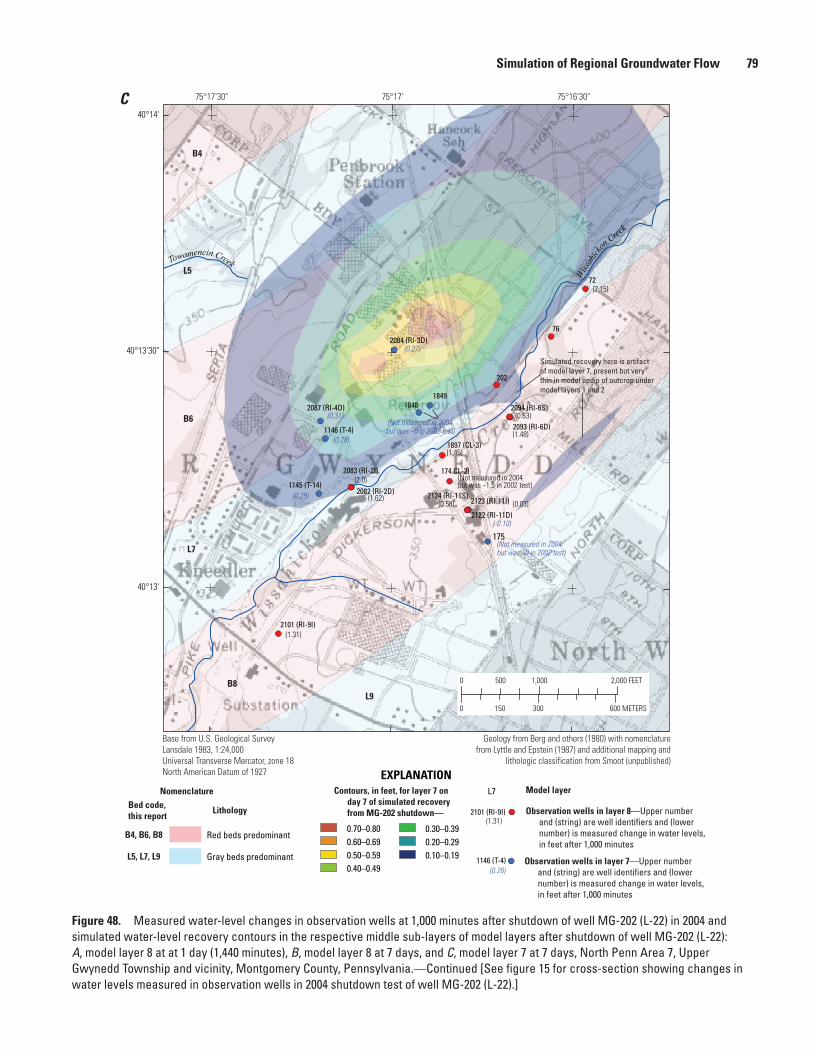
48. Maps showing measured water-level changes in observation wells at 1,000 minutes after shutdown of well MG-202 (L-22) in 2004 and simulated water-level recovery contours in the respective middle sub-layers of model layers after shutdown of well MG-202 (L-22): A, model layer 8 at at 1 day (1,440 minutes), B, model layer 8 at 7 days, and C, model layer 7 at 7 days, North Penn Area 7, Upper Gwynedd Township and vicinity, Montgomery County, Pennsylvania ..........................................................................77
ix
49. Maps showing simulated groundwater-flow paths for conditions in A, 2005 and B, 1990, and measured TCE concentrations in samples collected from observation wells in fall 2005, North Penn Area 7 Superfund site, Upper Gwynedd Township and vicinity, Montgomery County, Pennsylvania ...................................................................80
50. Maps showing simulated groundwater-flow paths for conditions in 2005 and measured concentrations of A, CFC-11 and B, CFC-113 in samples collected from observation wells in fall 2005, North Penn Area 7 Superfund site, Upper Gwynedd Township and vicinity, Montgomery County, Pennsylvania ...................83
Tables 1. Characteristics of wells with geophysical logs collected and aquifer-interval-
isolation (packer) tests conducted by the U.S. Geological Survey at and near North Penn Area 7 Superfund site, Upper Gwynedd Township and vicinity, Montgomery County, Pennsylvania, 2000–2005. ....................................................................12
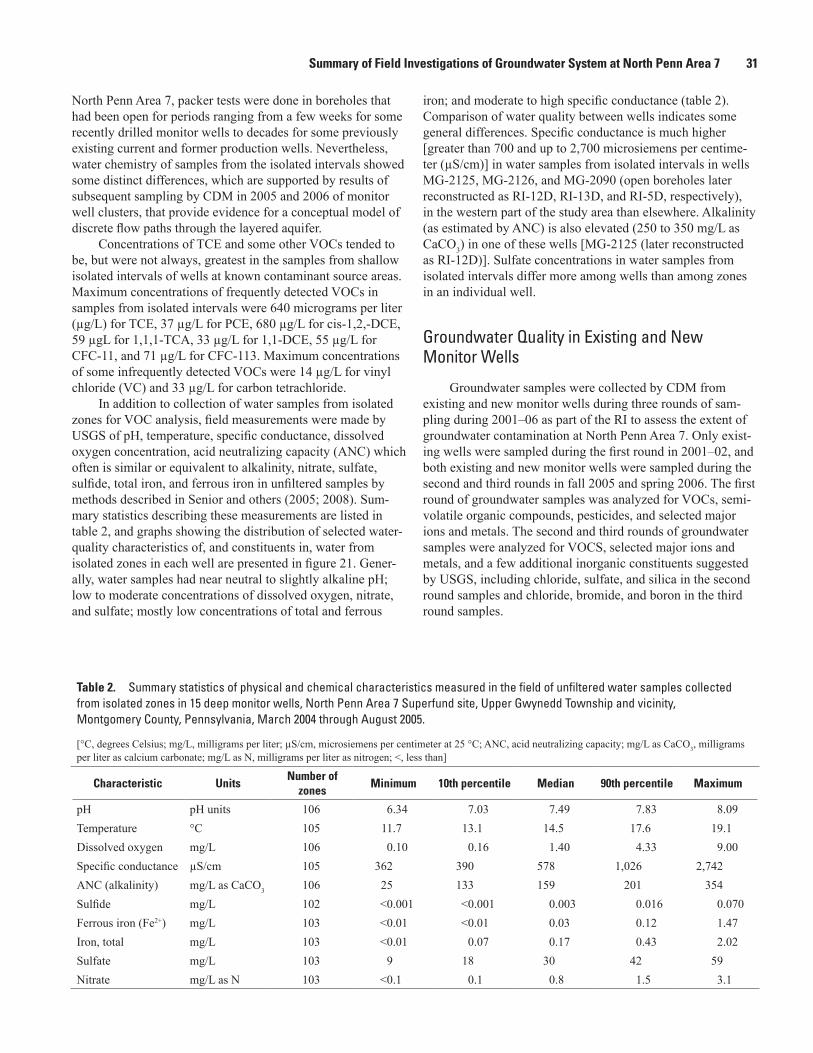
2. Summary statistics of physical and chemical characteristics measured in the field of unfiltered water samples collected from isolated zones in 15 deep monitor wells, North Penn Area 7 Superfund site, Upper Gwynedd Township and vicinity, Montgomery County, Pennsylvania, March 2004 through August 2005 ............................31
3. Hydrostratigraphy used in the groundwater model for North Penn Area 7 Superfund site, Upper Gwynedd Township and vicinity, Montgomery County, Pennsylvania ...............................................................................................................................46
4. Measured and simulated groundwater discharge to stream reaches for the calibrated numerical model of groundwater flow in the North Penn Area 7 Superfund site, Upper Gwynedd Township and vicinity, Montgomery County, Pennsylvania ...............................................................................................................................52
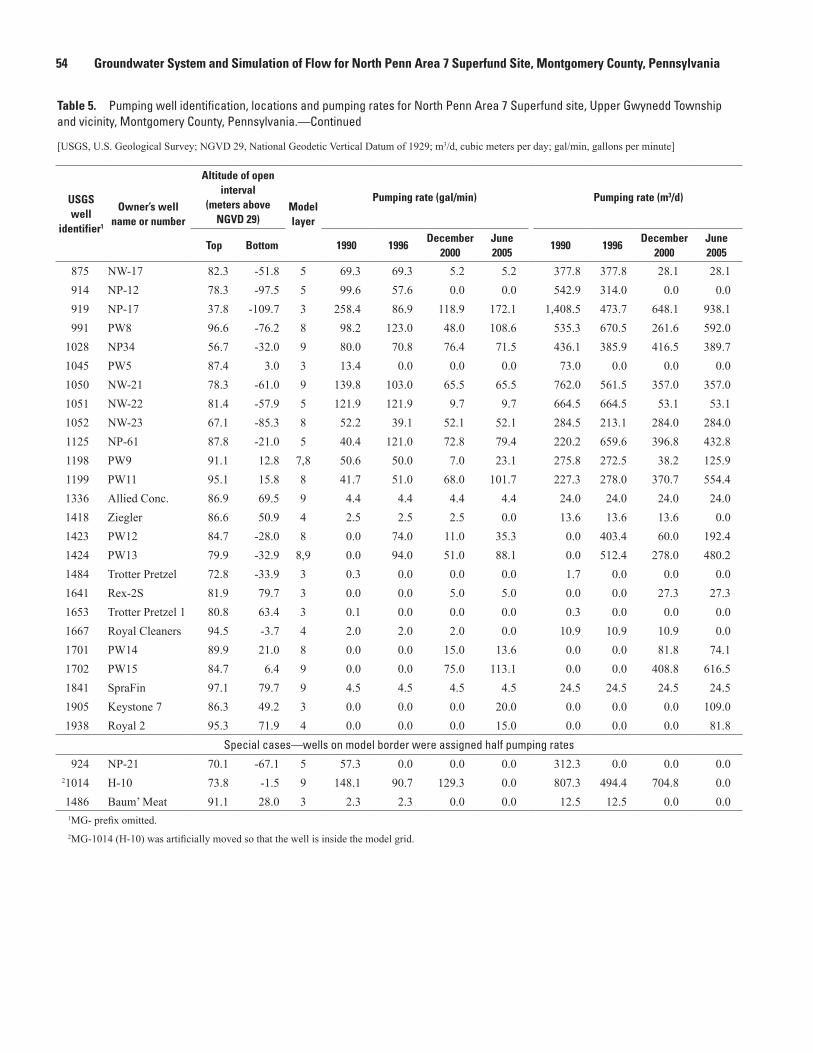
5. Pumping well identification, locations and pumping rates for North Penn Area 7 Superfund site, Upper Gwynedd Township and vicinity, Montgomery County, Pennsylvania ...............................................................................................................................53
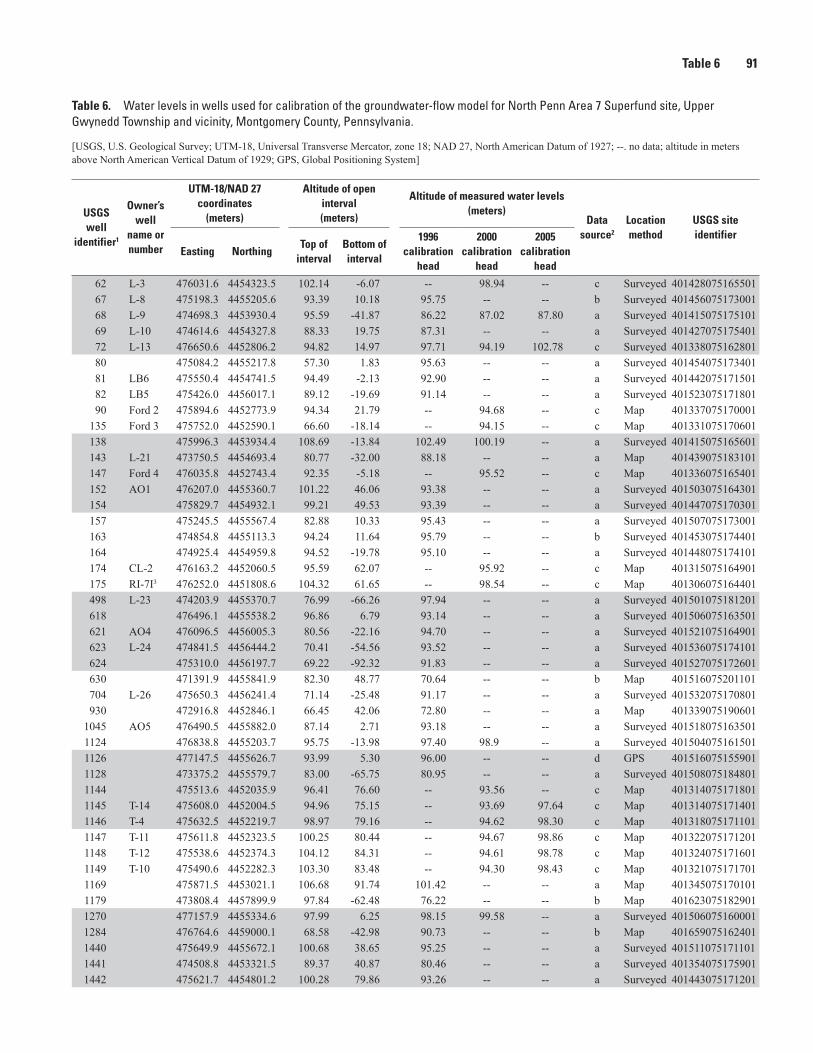
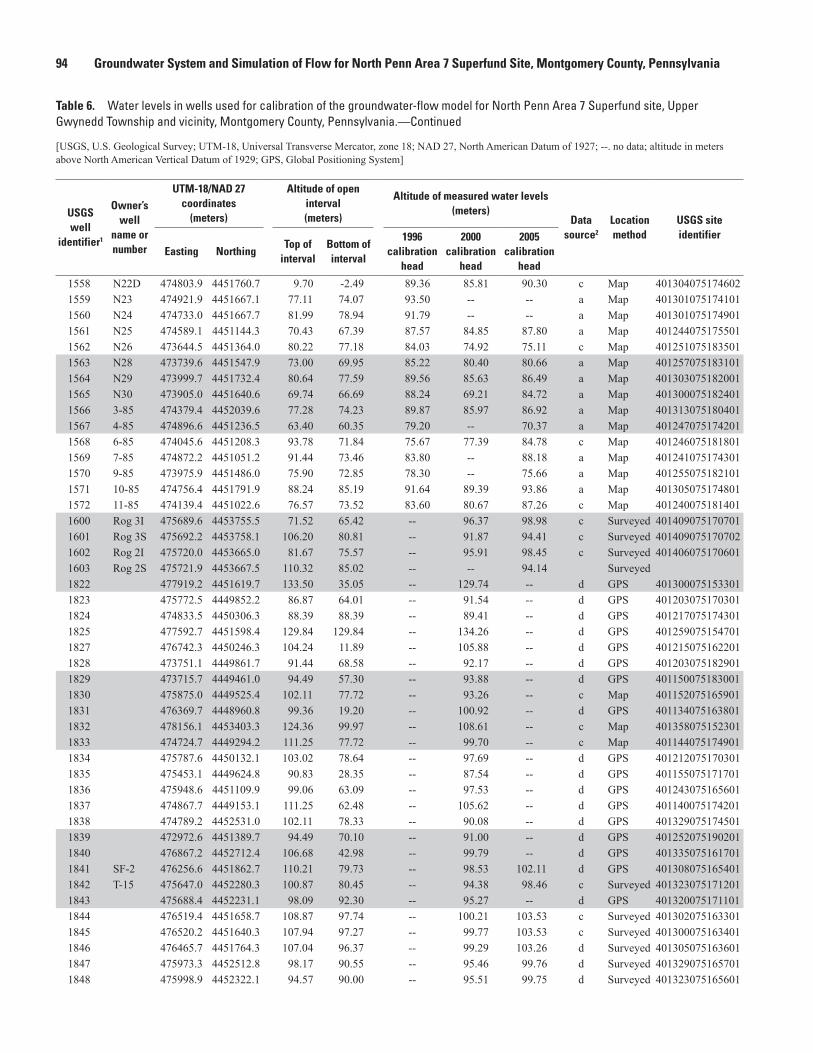
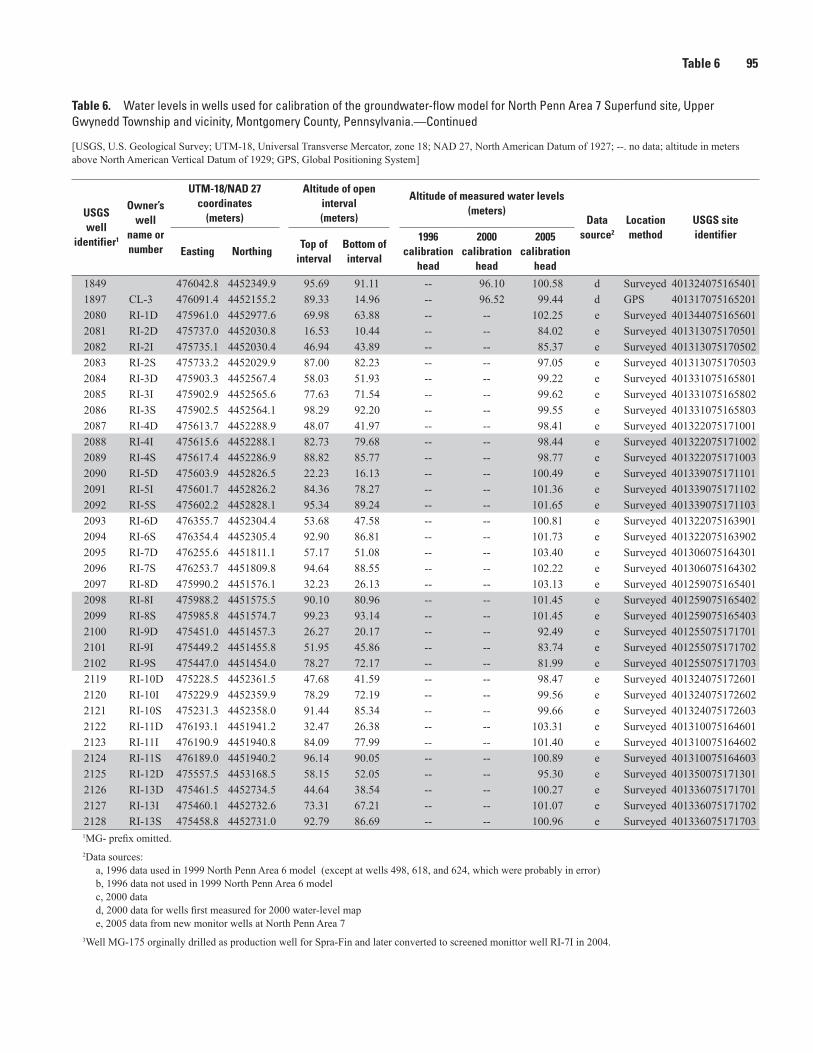
6. Water levels in wells used for calibration of the groundwater-flow model for North Penn Area 7 Superfund site, Upper Gwynedd Township and vicinity, Montgomery County, Pennsylvania .........................................................................................91
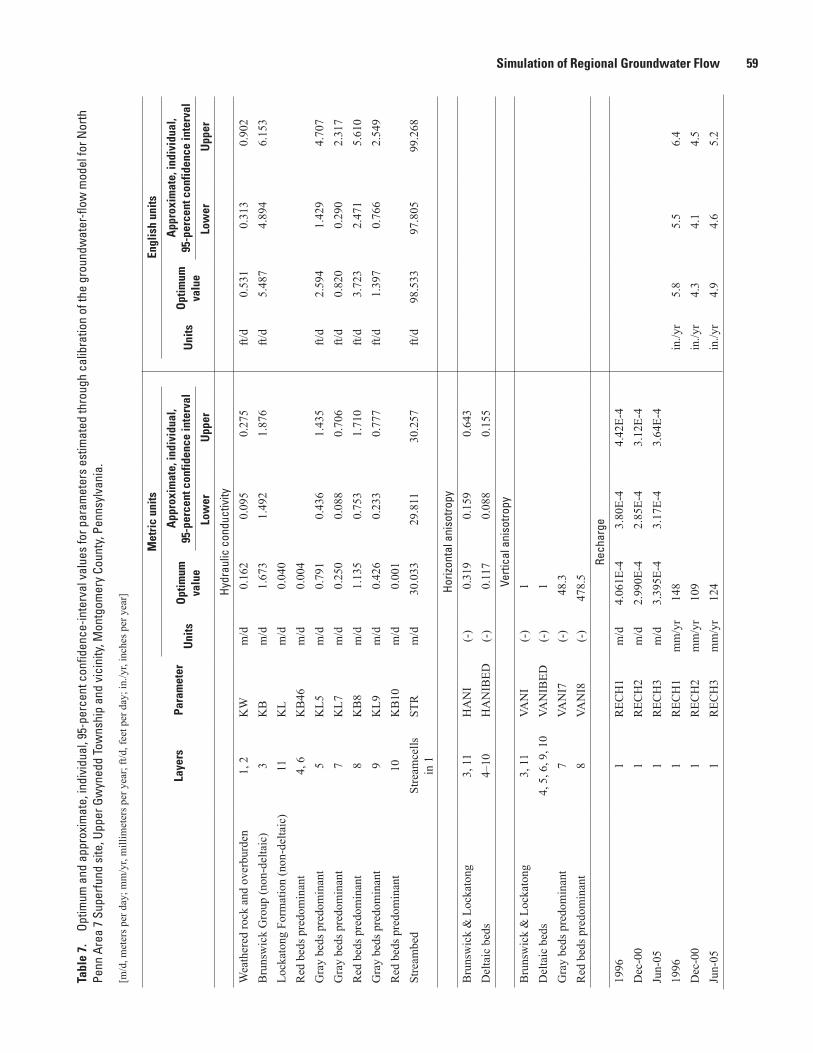
7. Optimum and approximate, individual, 95-percent confidence-interval values for parameters estimated through calibration of the groundwater-flow model for North Penn Area 7 Superfund site, Upper Gwynedd Township and vicinity, Montgomery County, Pennsylvania .........................................................................................59
8. Simulated water budgets for calibration periods 1996, 2000, and 2005 for model area and North Penn Area 7 Superfund site, Upper Gwynedd Township and vicinity, Montgomery County, Pennsylvania ..........................................................................61
9. Correlation and variance/covariance matrices for generation of probabilistic parameters ...................................................................................................................................62
x
Conversion Factors and Datums
Inch/Pound to SI
Multiply By To obtainLength
inch (in) 2.54 centimeter (cm)inch (in) 25.4 millimeter (mm)foot (ft) 0.3048 meter (m)mile (mi) 1.609 kilometer (km)
Volumegallon (gal) 3.785 liter (L) gallon (gal) 0.003785 cubic meter (m3) gallon (gal) 3.785 cubic decimeter (dm3) million gallons (Mgal) 3,785 cubic meter (m3)cubic foot (ft3) 28.32 cubic decimeter (dm3) cubic foot (ft3) 0.02832 cubic meter (m3)
Flow ratefoot per day (ft/d) 0.3048 meter per day (m/d)cubic foot per second (ft3/s) 0.02832 cubic meter per second (m3/s)cubic foot per second per square
mile [(ft3/s)/mi2] 0.01093 cubic meter per second per square
kilometer [(m3/s)/km2]cubic foot per day (ft3/d) 0.02832 cubic meter per day (m3/d)gallon per minute (gal/min) 0.06309 liter per second (L/s)gallon per day (gal/d) 0.003785 cubic meter per day (m3/d)gallon per day per square mile
[(gal/d)/mi2] 0.001461 cubic meter per day per square
kilometer [(m3/d)/km2]million gallons per day (Mgal/d) 0.04381 cubic meter per second (m3/s)inch per year (in/yr) 25.4 millimeter per year (mm/yr)
Specific capacitygallon per minute per foot
[(gal/min)/ft)] 0.2070 liter per second per meter [(L/s)/m]
Hydraulic conductivityfoot per day (ft/d) 0.3048 meter per day (m/d)
Hydraulic gradientfoot per mile (ft/mi) 0.1894 meter per kilometer (m/km)
Transmissivity*foot squared per day (ft2/d) 0.09290 meter squared per day (m2/d)
Leakancefoot per day per foot [(ft/d)/ft] 1 meter per day per meterinch per year per foot [(in/yr)/ft] 83.33 millimeter per year per meter
[(mm/yr)/m]
xi
Temperature in degrees Celsius (°C) may be converted to degrees Fahrenheit (°F) as follows:
°F=(1.8×°C)+32
Temperature in degrees Fahrenheit (°F) may be converted to degrees Celsius (°C) as follows:
°C=(°F-32)/1.8
Vertical coordinate information is referenced to the North American Vertical Datum of 1988 (NAVD 88) for data shown in feet, unless specified otherwise. Model input and output shown in meters are referenced to the National Geodetic Vertical Datum of 1929 (NGVD 29).
Horizontal coordinate information is referenced to the North American Datum on 1927 (NAD 27) for model input and output. Other data, unless otherwise specified, are referenced to the North American Datum of 1983 (NAD 83).
Altitude, as used in this report, refers to distance above the vertical datum.
*Transmissivity: The standard unit for transmissivity is cubic foot per day per square foot times foot of aquifer thickness [(ft3/d)/ft2]ft. In this report, the mathematically reduced form, foot squared per day (ft2/d), is used for convenience.
Specific conductance is given in microsiemens per centimeter at 25 degrees Celsius (μS/cm at 25 °C).
Concentrations of chemical constituents in water are given either in milligrams per liter (mg/L) or micrograms per liter (μg/L).
NOTE TO USGS USERS: Use of hectare (ha) as an alternative name for square hectometer (hm2) is restricted to the measurement of small land or water areas. Use of liter (L) as a special name for cubic decimeter (dm3) is restricted to the measurement of liquids and gases. No prefix other than milli should be used with liter. Metric ton (t) as a name for megagram (Mg) should be restricted to commercial usage, and no prefixes should be used with it.
xii
Investigations of the Groundwater System and Simulation of Regional Groundwater Flow for North Penn Area 7 Superfund Site, Montgomery County, Pennsylvania
By Lisa A. Senior and Daniel J. Goode
Abstract
Groundwater in the vicinity of several industrial facili-ties in Upper Gwynedd Township and vicinity, Montgomery County, in southeast Pennsylvania has been shown to be contaminated with volatile organic compounds (VOCs), the most common of which is the solvent trichloroethylene (TCE). The 2-square-mile area was placed on the National Priorities List as the North Penn Area 7 Superfund site by the U.S. Environmental Protection Agency (USEPA) in 1989. The U.S. Geological Survey (USGS) conducted geophysi-cal logging, aquifer testing, and water-level monitoring, and measured streamflows in and near North Penn Area 7 from fall 2000 through fall 2006 in a technical assistance study for the USEPA to develop an understanding of the hydrogeologic framework in the area as part of the USEPA Remedial Investigation. In addition, the USGS developed a groundwater-flow computer model based on the hydrogeo-logic framework to simulate regional groundwater flow and to estimate directions of groundwater flow and pathways of groundwater contaminants.
The study area is underlain by Triassic- and Jurassic-age sandstones and shales of the Lockatong Formation and Bruns-wick Group in the Mesozoic Newark Basin. Regionally, these rocks strike northeast and dip to the northwest. The sequence of rocks form a fractured-sedimentary-rock aquifer that acts as a set of confined to partially confined layers of differing permeabilities. Depth to competent bedrock typically is less than 20 ft below land surface. The aquifer layers are recharged locally by precipitation and discharge locally to streams. The general configuration of the potentiometric surface in the aqui-fer is similar to topography, except in areas affected by pump-ing. The headwaters of Wissahickon Creek are nearby, and the stream flows southwest, parallel to strike, to bisect North Penn Area 7. Groundwater is pumped in the vicinity of North Penn Area 7 for industrial use, public supply, and residential supply.
Results of field investigations by USGS at the site and results from other studies support, and are consistent with, a
conceptual model of a layered leaky aquifer where the dip of the beds has a strong control on hydraulic connections in the groundwater system. Connections within and (or) parallel to bedding tend to be greater than across bedding.
Transmissivities of aquifer intervals isolated by pack-ers ranged over three orders of magnitude [from about 2.8 to 2,290 square feet per day (ft2/d) or 0.26 to 213 square meters per day (m2/d)], did not appear to differ much by mapped geologic unit, but showed some relation to depth being relatively smaller in the shallowest and deepest intervals (0 to 50 ft and more than 250 ft below land surface, respectively) compared to the intermediate depth intervals (50 to 250 ft below land surface) tested. Transmissivities estimated from multiple-observation well aquifer tests ranged from about 700 to 2,300 ft2/d (65 to 214 m2/d). Results of chemical analyses of water from isolated intervals or monitoring wells open to short sections of the aquifer show vertical differences in con-centrations; chloride and silica concentrations generally were greater in shallow intervals than in deeper intervals. Chloride concentrations greater than 100 milligrams per liter (mg/L), combined with distinctive chloride/bromide ratios, indicate a different source of chloride in the western part of North Penn Area 7 than elsewhere in the site.
Groundwater flow at a regional scale under steady-state conditions was simulated by use of a numerical model (MOD-FLOW-2000) for North Penn Area 7 with different layers representing saprolite/highly weathered rock near the surface and unweathered competent bedrock. The sedimentary forma-tions that underlie the study area were modeled using dipping model layers for intermediate and deep zones of unweathered, fractured rock. Horizontal cell model size was 100 meters (m) by 100 meters (328 ft by 328 ft), and model layer thickness ranged from 6 m (19.7 ft) representing shallow weathered rock and saprolite up to 200 m (656 ft) representing deeper dipping bedrock. The model did not include detailed structure to account for local-scale differences in hydraulic properties, with the result that local-scale groundwater flow may not be well simulated. Additional detailed multi-well aquifer tests would be needed to establish the extent of interconnection
2 Groundwater System and Simulation of Flow for North Penn Area 7 Superfund Site, Montgomery County, Pennsylvania
between intervals at the local scale to address remediation of contamination at each source area.
This regional groundwater-flow model was calibrated against measured groundwater levels (1996, 2000, and 2005) and base flow estimated from selected streamflow measure-ments by use of nonlinear-regression parameter-estimation algorithms to determine hydraulic conductivity and anisotropy of hydraulic conductivity, streambed hydraulic conductiv-ity, and recharge during calibration periods. Results of the simulation using the calibrated regional model indicate that the aquifer appears to be anisotropic where hydraulic conductivity is greatest parallel to the orientation of bedding of the forma-tions underlying the area and least in the cross-bed direction. The maximum hydraulic conductivity is aligned with the aver-age regional strike of the formations, which is “subhorizontal” in the model because the altitudes of the beds and model cells vary in the strike, as well as dip, direction. Estimated subhori-zontal hydraulic conductivities (in strike direction parallel to dipping beds) range from 0.001 to 1.67 meters per day (0.0032 to 5.5 feet per day). The ratio of minimum (dip direction) to maximum (strike direction) subhorizontal hydraulic conduc-tivity ranges from 1/3.1 to 1/8.6, and the ratio of vertical to horizontal hydraulic conductivity ranges from 1/1 to 1/478. However, limited available field data precluded rigorous cali-bration of vertical anisotropy in the model. Estimated recharge rates corresponding to calibration periods in 1996, 2000, and 2005 are 150, 109, and 124 millimeters per year (5.9, 4.3, and 4.9 inches per year), respectively.
The calibrated groundwater-flow model was used to simulate groundwater flow under steady-state conditions dur-ing periods of relatively high withdrawals (pumpage) (1990) and relatively low withdrawals (2000 and 2005). Groundwa-ter-flow paths originating from recharge areas near known areas of soil contamination (sources) were simulated. Pumped industrial and production wells captured more groundwater from several of these sources during 1990 than after 1990 when pumping declined or ceased and greater amounts of con-taminated groundwater moved away from North Penn Area 7 Superfund site to surrounding areas. Uncertainty in simulated groundwater-flow paths from contaminant sources and con-tributing areas, resulting from uncertainty in estimated hydrau-lic properties of the model, was illustrated through Monte Carlo simulations. The effect of uncertainty in the vertical anisotropy was not included in the Monte Carlo simulations.
Contributing areas indicating the general configuration of groundwater flow towards production well MG-202 (L-22) in the study area also were simulated for the different time periods; as simulated, the flow paths do not pass through any identified contaminant source in North Penn Area 7. How-ever, contributing areas to wells, such as MG-202, located near many pumped wells are particularly complex and, in some cases, include areas that contribute flow to streams that subsequently recharge the aquifer through stream loss. In these cases, water-quality constituents, including contaminants that are present in surface water may be drawn into the aquifer to
nearby pumped wells. Results of a simulated shutdown of well MG-202 under steady-state 2005 conditions showed that the area contributing recharge for nearby production well MG-76 (L-17), when MG-202 is not pumping, shifts downstream and is similar to the area contributing recharge for MG-202 when both wells are pumping.
Concentrations of constituents in groundwater samples collected in fall 2005 or spring 2006 were compared to simu-lated groundwater-flow paths for the year 2005 to provide a qualitative assessment of model results. The observed spatial distribution of selected constituents, including TCE, CFC-11, and CFC-113 in groundwater in 2005 and the chloride/bromide mass ratios in 2006, generally were consistent with the model results of the simulated 2005 groundwater-flow paths at North Penn Area 7, indicating the presence of several separate sources of contaminants within North Penn Area 7.
IntroductionGroundwater in and around Lansdale Borough and Upper
Gwynedd Township, Montgomery County, Pennsylvania, was found to be contaminated with organic chemicals, such as trichloroethylene (TCE) and tetrachloroethylene (PCE), in 1979. The contamination was discovered by the North Penn Water Authority (NPWA), which at that time relied entirely on groundwater to supply public drinking water. The U.S. Envi-ronmental Protection Agency (USEPA) investigated sources of soil and groundwater contamination in the vicinity of Lansdale and subdivided the areas of contamination into groups of prop-erties. The group of contaminated properties in the vicinity of production well L-22 (MG-202) in Upper Gwynedd Township, southeast of Lansdale and northwest of North Wales, was desig-nated North Penn Area 7 and covers about 2 square miles (mi2)
(fig. 1). Well L-22 (MG-202) is one of several production wells near the headwaters of Wissahickon Creek located in an area shown as the Wissahickon well field on figure 1. The USEPA began its investigation at North Penn Area 7 in June 1986, and the site was placed on the National Priorities List (NPL) on March 31, 1989 (CH2M Hill, 1992). North Penn Area 7 is southeast from and nearly adjacent to the NPL (also known as Superfund) site North Penn Area 6 centered in Lansdale (fig. 1).
The North Penn Area 7 Superfund site encompasses six industrial facilities (fig. 1) reported to have used volatile organic compounds (VOCs). The most commonly used VOCs were the solvents TCE, PCE, 1,1,1-trichloroethane (1,1,1-TCA), methylene chloride (MC), trichloromonofluoromethane (Freon-11 or CFC-11), and dichlorofluoromethane (Freon-21) (CH2M-Hill, Inc., 1992, p. 2-1 to 2-6). Contaminants of con-cern detected in groundwater in the vicinity of the site include TCE, PCE, 1,1,1-TCA, 1,1-dichloroethylene (1,1-DCE), 1,2-dichloroethylene (1,2-DCE), cis-1,2,-DCE, trans-1,2-DCE, vinyl chloride (VC), and carbon tetrachloride. Similar con-tamination also was detected in soils on at least six properties (CH2M-Hill, 1992).
Introduction 3
PENNSYLVANIA
STUDY AREA
-202G
-
(MG-56)
(MG-203)
Approximate area ofWissahickon well field
0 0.5 KILOMETER
0 0.5 MILE
75°17'30"
40°13'45"
40°12'30"
75°16'30"
(MG-56)
L-22 (MG-202)
Approximate area ofWissahickon well field
(MG-203)
-
Base from U.S. Geological SurveyLansdale 1983, 1:24,000Universal Transverse Mercator, zone 18North American Datum of 1927
EXPLANATION
L-22 (MG-202)
Approximate preliminary boundaryof North Penn Area 7 in 1986
Well and Identifier (U.S. Geological Survey identifier)
Figure 1. Location of the North Penn Area 7 Superfund site and selected wells, Upper Gwynedd Township and vicinity, Montgomery County, Pennsylvania.
4 Groundwater System and Simulation of Flow for North Penn Area 7 Superfund Site, Montgomery County, Pennsylvania
Groundwater in the vicinity of North Penn Area 7 has been used and continues to be used for industrial, public, and private supply. Although some wells were abandoned after contamination was discovered, other wells remain active, in some cases such as well L-22 (MG-202), equipped with air strippers to remove VOCs. Abandoned wells include two contaminated North Wales Water Authority (NWWA) produc-tion wells just south of North Penn Area 7 (MG-56, MG-203) and five industrial wells at the former FERCO property in the northern part of the site (fig. 1). As of fall 2006, groundwa-ter pumping in the vicinity (within 0.5 miles) of North Penn Area 7 continued in NPWA wells along Wissahickon Creek near well L-22 (MG-202) to the northeast of the site, wells at Precision Tube near the center of the site, and wells at the West Point facility of Merck & Co., Inc., southwest of the North Penn Area 7 (fig. 1).
The USEPA requested technical assistance from the U.S. Geological Survey (USGS) to provide hydrogeologic data and interpretation of the data to be used in the Remedial Investigation (RI) for the North Penn Area 7 Superfund site. In fall 2000, the USGS, in cooperation with USEPA and in coordination with USEPA’s contractor CDM Federal Programs Corporation (CDM in this report; renamed CDMSmith in late 2011), began to collect data as part of the technical assistance. The data were used to describe the groundwater system and to provide a basis for the simulation of groundwater flow. The first phase of work, completed in September 2002, included geophysical logging of existing wells, aquifer tests of iso-lated intervals in existing wells, streamflow measurements, and groundwater-level mapping and monitoring (Senior and others, 2005; Senior and Ruddy, 2004). The second phase of work from October 2002 through December 2006 included geophysical logging of existing production and monitor wells and new monitor wells drilled for the RI, aquifer tests of isolated intervals in previously constructed and new moni-tor wells, streamflow measurements, and groundwater-level monitoring (Senior and others, 2008). In addition to collection and interpretation of data, the USGS also developed a com-puter model, described in this report, to simulate groundwater flow at and near North Penn Area 7. The groundwater-flow simulation is used to evaluate the effect of pumping on the directions of groundwater flow and transport of contaminants in groundwater.
Purpose and scope
This report describes the hydrogeologic setting and groundwater system on the basis of previous studies and find-ings from two phases of data collection and investigations by the USGS at the North Penn Area 7 Superfund site and vicinity. In addition, a computer-based numerical model that was constructed to simulate regional-scale groundwater flow is described. This model was used to estimate values for aquifer properties and simulate groundwater-flow directions under different conditions.
Data collected by USGS during the two phases—Decem-ber 2000 through September 2002 and October 2002 through September 2006—to help describe the hydrogeologic system at and near the site are summarized. These data include results of geophysical logs of existing production wells and existing and new monitor wells, aquifer characteristics determined from pumping tests of aquifer intervals isolated by pack-ers (packer tests) in selected existing and new wells, results of water-quality analyses of groundwater samples from the packer tests, results of aquifer tests involving multiple observation wells, streamflow measurements, continuous groundwater levels in selected observation wells, and sets of synoptic measurements of groundwater levels in wells at and near the site. In addition, inorganic water-quality con-stituents in groundwater samples collected by CDM during October 2005 and March 2006 are discussed in relation to the hydrogeologic system.
Aquifer properties of transmissivity, hydraulic conduc-tivity, and (or) storage were estimated when possible from the field data at the local scale (aquifer tests) and from a computer-based numerical simulation of groundwater flow at the regional scale. The basis of the numerical simulation of regional groundwater flow is described, including the concep-tual model, model structure and boundaries, and calibration using regression-based parameter estimation (optimization) techniques. Data used for calibration include sets of synoptic groundwater levels and streamflow measurements from 1996 to 2005.
The calibrated model is used to simulate groundwater-flow paths from known and suspected sources of contamina-tion for selected periods from 1990 to 2005 that correspond to various industrial and water-supply pumping rates and locations (scenarios). The uncertainty associated with model simulation of flow paths determined using a Monte Carlo approach is shown with the flow paths simulated using opti-mized parameters. Similarly, the area contributing recharge to a contaminated production well and associated uncer-tainty of that area are simulated for the same periods. Simu-lated groundwater-flow paths from contaminant sources are compared to measured concentrations of selected VOCs in well-water samples collected in 2005 for qualitative assess-ment of model results. In addition, the distribution of selected inorganic constituents (boron, bromide, chloride, sulfate, and silica) analyzed in samples collected in fall 2005 and spring 2006 are discussed in relation to the hydrogeologic framework and groundwater-flow paths.
Previous Investigations
Groundwater studies in and near Lansdale Borough and Upper Gwynedd Township have been prompted by concern about limited groundwater availability during periods of drought, by discovery of contaminated drinking water from production wells, and by interest in commercial and industrial uses of the groundwater. Rima (1955), Longwill and Wood
Geologic and Hydrogeologic Setting 5
(1965), and Newport (1971) provide well-characteristic and groundwater-quality data and describe groundwater resources in Montgomery County, Pa., including the Lansdale and Upper Gwynedd Township area. Longwill and Wood (1965) compiled a geologic map, which in the Lansdale area was based almost entirely on unpublished manuscripts by Dean B. McLaughlin of the Pennsylvania Geological Survey. Lyttle and Epstein (1987) compiled a geologic map of the Newark 1° x 2° Quadrangle that updates and revises the geologic nomenclature for the area. Biesecker and others (1968) describe the water resources of the Schuylkill River Basin, which drains part of the study area. Barton and others (2003) describe a case study to determine contributing area for a pro-duction well in Lansdale that is near North Penn Area 7.
Investigations of groundwater contamination after 1979 by the USEPA and others are summarized in a report to the USEPA by CH2MHill (1992). An evaluation of groundwater withdrawals at the Merck & Co., Inc., (hereinafter “Merck”) West Point plant was done by Geraghty & Miller, Inc. (1993). Investigations of groundwater quality at the Ford Electronics and Refrigeration Corporation (FERCO) facility in North Penn Area 7 are described by Converse Consultants East (1994). Sources of groundwater contamination in the nearby North Penn Area 6 site also are identified in other reports to the USEPA by Black & Veatch Waste Science, Inc. (1994; 1999). Investigations since 2000 further delineated soils contaminated with TCE and other VOCs at Spra-Fin (CDM Federal Pro-grams Corporation, 2003), former FERCO (Golder Associates, Inc. 2003), and Teleflex (Turner, 2006) properties.
A map of groundwater levels in 1996 in the vicinity of Lansdale that includes groundwater levels within North Penn Area 7 was done by Senior and others (1998) to support groundwater investigations at the nearby North Penn Area 6 site (fig. 1). Goode and Senior (1998) present a review of aquifer tests done in the Lansdale area from 1980 through 1995, including tests done in industrial supply wells at manu-facturing facilities in and near North Penn Area 7. Senior and Goode (1999) describe the groundwater system and simula-tion of groundwater flow for the North Penn Area 6 site and vicinity. The model domain for previous North Penn Area 6 (shown later in report on fig. 3) groundwater-flow simulations (Senior and Goode, 1999; Goode and Senior, 2000) extended into North Penn Area 7 and was bounded by Wissahickon Creek. Studies (Senior and Goode,1999; Goode and Senior, 2000) that investigated the control on groundwater flow by the hydrogeologic structure of dipping sedimentary beds through field studies and flow modeling for North Penn Area 6 provide a basic framework for subsequent USGS work in the Lansdale area, including North Penn Area 7.
The study discussed in this report included two phases of data collection. Data collected during phase 1 (December 2000–September 2002) were published by Senior and others (2005), including a map showing groundwater levels in and near North Penn Area 7 in December 2000 (Senior and Ruddy, 2004). Data collected during phase 2 (October 2002–Septem-ber 2006) were published by Senior and others (2008).
Well-Identification System
This report uses the USGS local well number as the primary well identification and the owner-assigned well number as the secondary well identification. The USGS local well number consists of a two-letter county-abbreviation prefix followed by a sequentially assigned number. The prefix MG denotes a well in Montgomery County. The USGS also assigns each well a unique 15-digit site number based on latitude and longitude in degrees, minutes, and seconds and a 2-digit sequence number. The 15-digit site number is the primary identifier in the USGS databases. Some wells have other names or numbers assigned by owners or used in the CH2M-Hill report (1992). The owner assigned well number commonly has a prefix consisting of a letter or letters followed by a sequentially assigned number; the new monitor wells drilled by USEPA in clusters for the remedial investigation (RI) use the prefix RI and a number for the cluster and are further identified as shallow (S), intermediate (I), deep (D), or extra-deep (DD). Listings of USGS local well and site num-bers and owner-assigned well numbers for most wells cited in this report are given in tables 67, 79, and 22, at the end of the two previous data reports for North Penn Area 7 (Senior and others, 2005; 2008) and a report for North Penn Area 6 (Senior and Goode, 1999).
Geologic and Hydrogeologic SettingThe composition and structure of bedrock underlying
North Penn Area 7 and surrounding areas is a controlling fac-tor that affects topography, character of the groundwater sys-tem, and stream network. The general geologic and hydrogeo-logic setting of the study area described below is based mostly on previous work by others and on work done by USGS at North Penn Area 7 and nearby North Penn Area 6 Superfund sites. Nomenclature (code) assigned to geologic units used in the simulation of regional groundwater flow presented in this report is described. Detailed investigations of the groundwater system at the local or borehole-scale that were done at and near North Penn Area 7 from December 2000 through Septem-ber 2006 are summarized in a separate section of this report and presented completely in two previous reports (Senior and others, 2005; 2008).
Geologic Setting
The study area in and near Lansdale and Upper Gwynedd Township is in the Gettysburg–Newark Lowlands section of the Piedmont Physiographic Province (Berg and others, 1989; fig. 2). The area is underlain by sedimentary rocks of the Lockatong Formation and lower beds of the Brunswick Group of the Newark Supergroup (Lyttle and Epstein, 1987; fig. 3). Sediments of the Newark Supergroup were deposited in a rift basin during the Triassic and Jurassic ages (about 260 million
6 Groundwater System and Simulation of Flow for North Penn Area 7 Superfund Site, Montgomery County, Pennsylvania
PENNSYLVANIA
NEW YORK
NEWJERSEY
MARYLAND DELAWARE
77° 76° 75°
40°
41°
42°
Newark Basin
Valley and RidgePhysiographic Province
Piedmont Physiographic Province
Appalachian PlateausPhysiographic Province
Reading Prong of the New EnglandPhysiographic Province
Atlantic Coastal PlainPhysiographic Province
Reading Prong of the New EnglandPhysiographicProvince
Gettysb
urg Basin
BK-929BK-1020
1
2
3
4 5
Studyarea
PENNSYLVANIA
STUDY AREA
(Gettysburg-NewarkLowland Section)
(Piedmont Section)
0 20 40 60 MILES
0 4020 60 KILOMETERS
Physiographic provinces from Sevon (2000)Base from Pennsylvania Bureau of Topographic and Geologic SurveyPhysiographic Provinces, 1995, 1:100,000-scale digital dataUniversal Transverse Mercator, zone 18
Observation well and U.S. Geological Survey identifier
National Oceanic and Atmospheric Administration precipitation station and identifier
Figure 2. Physiographic Provinces in southeastern Pennsylvania.
Geologic and Hydrogeologic Setting 7
Wissah
ickon
Creek
Stony Cree
k
Neshaminy Creek
Towamencin Creek
917
01473900
Trs
Trl
Trb
Trl
Cl
Trb
Cch
Trb
Cch
Trl TrsTrb
Trl
Trb
TrlTrl
TrbTrlTrlTrb
Trl
Trl
Hatfield
MontgomeryTowamencin
Upper Gwynedd
New Britain
Franconia
Warrington
Lansdale
Lower Salford
Hilltown
Hatfield
New Britain
North Wales
Doylestown
Whitpain
Worcester
Horsham
Upper Dublin
Lower Gwynedd
East Norriton
WhitemarshPlymouth
Norristown
Ambler
West Norriton
Springfield
Chalfont
EXPLANATION
Municipal boundary
Stream
Well and U.S. Geological Survey identifier (MG- prefix omitted)
Streamflow-measurement station and U.S. Geological Surveystation identification number
68
01473900
Boundary for North Penn Area 6 model (Senior and Goode, 1999)Geologic unit
Brunswick Group
Chickies Formation
Ledger Formation
Lockatong Formation
Stockton FormationTrs
Trl
Cl
Cch
Trb
0 1 2 MILES
0 1 2 KILOMETERS
Approximate boundaryof North Penn Area 7
Boundary for North Penn Area 6 model (Senior and Goode, 1999)
Area of figure 4
Geology from Berg and others (1980)based on Longwill and Wood (1965)
75°20' 75°15'
40°10'
40°15'
68
202
Base from Pennsylvania Geological SurveyBedrock Geology of Pennsylvania, 2001Universal Transverse Mercator, zone 18North American Datum of 1927
Figure 3. Units of bedrock underlying North Penn Area 7 Superfund site and model boundary for North Penn Area 6 , Upper Gwynedd Township and vicinity, Montgomery County, Pennsylvania.
8 Groundwater System and Simulation of Flow for North Penn Area 7 Superfund Site, Montgomery County, Pennsylvania
years ago). Following deposition, sediments in the Newark Basin were buried, lithified, tilted, and faulted. The oldest sediments in the Newark Basin compose the Stockton Forma-tion, mainly sandstones with some shale deposited along the southern margin on Paleozoic and older rocks. Overlying the Stockton Formation are the generally finer-grained Lockatong Formation and Brunswick Group rocks, which underlie the study area. The Lockatong Formation typically is relatively resistant to erosion and tends to form ridges that rise above flat or rolling topography. This flat or rolling topography is underlain by sedimentary rocks of the Brunswick Group that are younger than and may be interfingered with the Lockatong Formation.
The Lockatong Formation consists of detrital sequences (cycles) of gray to black calcareous shale and siltstone, with some pyrite, and chemical sequences (cycles) of gray to black dolomitic siltstone and marlstone with lenses of pyritic lime-stone, overlain by massive gray to red siltstone with anacline (Van Houten, 1962; Lyttle and Epstein, 1987). Interbeds of reddish-brown, sandy siltstone have been mapped in the Lock-atong Formation south of Lansdale (Lyttle and Epstein, 1987). Contacts between the Lockatong Formation and the overlying Brunswick Group are conformable and gradational, and the two formations may interfinger (Lyttle and Epstein, 1987). The lower beds of the Brunswick Group consist predomi-nantly of homogeneous, soft, red to reddish-brown and gray to greenish-gray mudstones and clay- and mud-shales, with some fine-grained sandstones and siltstones. Bedding is irregular and wavy. Some beds are micaceous. Interbedded silt-shales and siltstones are moderately well sorted. Mud cracks, ripple marks, crossbeds, and worm burrows are common in all the beds. The Brunswick Group rocks contain detrital cycles of medium- to dark-gray and olive- to greenish-gray, thin-bedded and evenly bedded shale and siltstone, similar to those of the underlying Lockatong Formation.
Unpublished lithologic maps (Joseph Smoot, U.S. Geo-logical Survey, written commun., 2005) indicate that deltaic and fluvial sequences are present in the geologic units mapped in the study area (fig. 4). This preliminary lithologic map-ping retains geologic contacts presented in earlier mapping (Longwill and Wood, 1965) (fig. 3) but adds a new contact delimiting the extent of deltaic sequences in the lower part of the Brunswick Group rocks. The lithologic mapping identified interbedded fluvial to deltaic sandstone and conglomerate and lacustrine cyclic siltstone and shale that are predominantly red (TrS/Sic) or predominantly gray (TrS/ Sicg) (fig. 4). For the purposes of this report, these bedding units are assigned codes: B4, B6, B8, and B10 refer to units with the predominantly red lithology labeled TrS/Sic; L5, L7, and L9 refer to units with the predominantly gray lithology labeled TrS/Sicg; B refers to the predominantly red non-deltaic lower Brunswick Group rocks labeled TrSic [equivalent to Trb of Longwill and Wood (1965)]; and L refers to the predominantly gray non-deltaic Lockatong Formation rocks labeled TrSicg [equivalent to the Trl of Longwill and Wood (1965)]. Prior to the unpublished mapping by Smoot, Lyttle and Epstein (1987) had reclassified
the predominantly gray beds mapped by Longwill and Wood (1965) as interfingered Lockatong Formation within the Brunswick Group (fig. 3) as part of the lower Brunwick Group (see units labeled Trblg in fig. 4) and the predominantly red beds mapped as interfingered Brunswick Group with the Lockatong Formation (fig. 3) as part of the Lockatong Forma-tion (see unit labeled Trlr in fig. 4).
Bedding in the Newark Basin regionally strikes north-east and dips to the northwest. The regional homoclinal dip has been cut by normal and strike-slip faults and warped by transverse folds (Schlische, 1992). Many faults with small displacements have not been mapped. Locally, the beds of the Brunswick Group and Lockatong Formation generally strike northeast and dip shallowly to the northwest in the vicinity of the North Penn Area 7 site with a gradual shift in strike from northeast in central Lansdale to east-northeast in the area south of Lansdale near North Wales (fig. 3) (Longwill and Wood, 1965). Thin shale marker beds in the Brunswick Group identi-fied by elevated natural gamma-ray activity on geophysical logs can be correlated in wells and boreholes over distances of 1,000 ft or more. High natural gamma-ray activity typically is associated with thin dark gray or black shale beds. Correlation of natural gamma-ray activity in well and borehole logs col-lected by USGS in and near Lansdale shows that these shale beds strike N. 48° to 60° E. and dip 6° to 30° NW. with an average dip of about 11° (Conger, 1999). In the western part of the North Penn Area 7 site, a strike of N. 57° E. with dip of 9° to 10° NW. was determined from correlation of beds with elevated natural gamma-ray activity among wells and bore-holes (Senior and others, 2008).
Hydrogeologic Setting
The conceptual model of the groundwater system in the study area consists of dipping, layered fractured rocks with groundwater flow occurring within openings developed primarily along or in the orientation of bedding planes (Senior and Goode, 1999). These openings are either low-angle bedding-plane partings or high-angle fractures and joint sets orthogonal to bedding that form a network parallel to bed-ding. High-angle or nearly vertical fractures generally do not cut extensively across beds but may provide local routes of groundwater flow or leakage between beds.
Groundwater to depths of probably about 1,000 ft below land surface in the rocks underlying the North Penn Area 7 site originates from infiltration of local precipitation. After infil-trating through soil and saprolite (extensively weathered rock), groundwater moves through near-vertical and bedding-plane fractures in the shale and siltstone bedrock (fig. 5A). Depth to competent bedrock commonly is less than 20 ft below land surface. The soil, saprolite, and individual beds of the sedi-mentary bedrock form a layered aquifer, with varying degrees of hydraulic connection between the layers. Hydraulic proper-ties of the soil, saprolite, and fracture networks in individual beds of the underlying sedimentary bedrock differ. Primary
Geologic and Hydrogeologic Setting 9
TrSic
TrS/Sic
TrS/Sicg
TrS/Sic
TrS/Sic
TrS/Sic
TrS/Sicg
TrS/SicgTrSicg
(JTrb)
(JTrb)
(JTrblg)
(JTrb)
(Trl)(Trl)
(Trlr)(JTrb)
(JTrblg)
Tr
BB4
L5
B6
L7
B8
L9
B10
L
Wissahick
on Creek
Approximate boundaryof North Penn Area 7
Towamencin Creek
75°18'0" 75°17'0" 75°16'0"
40°13'0"
40°14'0"
Geology from Berg and others (1980) with nomenclaturefrom Lyttle and Epstein (1987) and additional mapping and
lithologic classification from Smoot (unpublished)
0 400 800 METERS200
0 1,000 2,000 3,000 FEET500
Base from U.S. Geological SurveyLansdale 1983, 1:24,000Universal Transverse Mercator, zone 18North American Datum of 1927
72
202
1146
1145
68
69
76
EXPLANATION
Lithology
Brunswick Group (non-deltaic)
Gray beds predominant (deltaic)
Contact in BrunswickGroup with deltaic units
StreamRed beds predominant (deltaic)
TrSic
TrS/Sic
TrS/Sicg
Lockatong Formation (non-deltaic)TrSicg
JTrb
Trl
JTrblg, Trl
B
B4, B6, B8, B10
L5, L7, L9
L
Nomenclature
Smoot(unpublished)
Bed code,this report
Lyttle and Epstein(1987)
JTrb, Trlr
Well and U.S. Geological Survey identifier(MG- prefix omitted)
72
Figure 4. Preliminary revised lithologic mapping of bedrock geology at and near North Penn Area 7 Superfund site, Upper Gwynedd Township and vicinity, Montgomery County, Pennsylvania.
10 Groundwater System and Simulation of Flow for North Penn Area 7 Superfund Site, Montgomery County, Pennsylvania
Figure 5. A, Conceptual groundwater-flow system in dipping-bed fractured sedimentary rock aquifer (from Senior and Goode, 1999) and B, schematic cross section showing numerical simulation of groundwater flow in conceptual dipping-bed sedimentary rock aquifer with layered units of high and low permeability (modified from Risser and Bird, 2003).
Summary of Field Investigations of Groundwater System at North Penn Area 7 11
porosity, permeability, and storage in the Triassic to Jurassic age sedimentary bedrock are very low.
Groundwater in the shallowest part of the sedimentary-rock aquifer may be under unconfined (water-table) or par-tially confined conditions; the unconfined part of the aquifer probably is thin and is difficult to delineate. In some areas, perched water is present at shallow depths (less than 50 ft). Groundwater in the deeper part of the aquifer generally is con-fined or partially confined, resulting in artesian conditions.
Shallow and deep groundwater-flow paths may be present at the site. Generally, groundwater flows in a direction similar to the topographic gradient, although flow paths may be com-plex, as illustrated by a numerical simulation of the conceptual hydrogeologic setting (fig. 5B). The conceptual simulation shows that, in settings west of the stream, groundwater can flow updip in high permeability layers to discharge to the stream, but in settings east of the stream, groundwater gener-ally flows downdip in high permeability layers to discharge to the stream. Water from the shallow part of the system likely discharges locally to streams or leaks downward to the deeper part of the groundwater-flow system. Deep groundwater dis-charges to streams or to pumped wells with the natural direc-tion of shallow to deep groundwater flow altered by pumping. Pumping from deep zones may induce downward flow from shallow zones. Cones of depression caused by pumping have been observed to extend preferentially along strike of bedding planes or in the direction of fracture orientation in the Triassic to Jurassic age sedimentary rocks of the Brunswick Group and the Lockatong Formation (Longwill and Wood, 1965). A simi-lar cone of depression associated with pumping at an industrial property (Merck & Co.) southwest of, and adjacent to, North Penn Area 7 is described by Geraghty & Miller, Inc. (1993) and Goode and Senior (1998).
The North Penn Area 7 site is on relatively flat terrain that is bisected by Wissahickon Creek. The site extends past the surface-water divide between the Wissahickon Creek Basin and the Towamencin Creek Basin to the west (fig. 3). Church Road (fig. 4) runs along the approximate location of this surface-water divide. The location of the associ-ated groundwater divide, estimated from a map of regional groundwater levels measured in open-hole wells in the vicinity of North Penn Area 7 in December 2000 (Senior and Ruddy, 2004) probably is near the surface-water divide between the Towamencin Creek and Wissahickon Creek Basins.
Summary of Field Investigations of Groundwater System at North Penn Area 7
Information about the local-scale groundwater system at selected locations at and near North Penn Area 7 was obtained through collection of data in field investigations by USGS and others. Borehole geophysical logging provided data on
the distribution of water-bearing zones, vertical gradients, and lithology. Packer tests provided data on the transmissivity and water chemistry of isolated water-bearing intervals, extent of hydraulic connection between isolated aquifer intervals, and vertical gradients. Water levels measured in wells provided data that could be used to determine depth to water from land surface, to evaluate vertical and horizontal gradients, to evalu-ate relations between groundwater levels and stream gain or loss, and to calibrate the groundwater-flow model. Measure-ments of streamflow under base-flow conditions provided data to evaluate groundwater/surface-water relations (including identification of gaining and losing reaches of Wissahickon Creek) and to calibrate the groundwater-flow model. Results of each type of data collection effort are summarized in the following sections.
Geophysical Logs
Geophysical logs were collected in wells at and near North Penn Area 7 to determine the location of water-bearing fractures, direction of vertical borehole flow (and, therefore, presence of vertical hydraulic gradients), and orientation of beds. From 2001 through 2005, USGS collected borehole geophysical logs in 19 existing production and monitor wells and 39 new monitor wells drilled for the RI (table 1; fig. 6) (Senior and others, 2005; 2008). The depths of existing bore-holes, including 12 relatively shallow (less than 90-ft deep) monitor wells, 1 deep monitor well, and 6 deep current and former production wells, range from 37.5 to 623 ft. depth. The 39 new monitor wells drilled for the RI from 2003 through 2005 were installed in 15 well clusters on the basis of water-bearing zones identified by logs of the first and deepest well in each cluster. The deepest monitor well was initially drilled to a depth of about 300 ft in 11 of the 15 clusters and to depths ranging from 246 to 290 ft in the other four clusters. Shallower wells in the clusters subsequently were drilled to depths rang-ing from 40 to 230 ft. After logging and other testing, all new monitor wells were reconstructed with 20- to 40-ft screens to isolate water-bearing zones. The number of new monitor wells at each cluster are as follows: one well (2 locations); two wells (2 locations); two wells and reconstruction of an existing well (1 location); three wells (9 locations); and four wells (1 loca-tion) (table 1; fig. 6).
Results of geophysical logging show active water-bearing zones occur throughout the aquifer from depths of about 20 to at least 370 ft below land surface (in well MG-151, former Ford 5). Measured directions of vertical borehole flow tended to be upward east of Wissahickon Creek and downward west of Wissahickon Creek or near areas of active pumping. The distribution of vertical gradients indicated by borehole-flow directions was confirmed by water levels measured in isolated zones in packer tests and in well clusters (fig. 7); the distribu-tion of vertical gradients probably is related to the dipping-bed structure, except in areas of pumping. Higher heads in deep water-bearing zones than in shallower water-bearing zones can been inferred from a numerical simulation of
12 Groundwater System and Simulation of Flow for North Penn Area 7 Superfund Site, Montgomery County, Pennsylvania
Table 1. Characteristics of wells with geophysical logs collected and aquifer-interval-isolation (packer) tests conducted by the U.S. Geological Survey at and near North Penn Area 7 Superfund site, Upper Gwynedd Township and vicinity, Montgomery County, Pennsylvania, 2000–2005.—Continued
[USGS, U.S. Geological Survey; ft, feet; ft bls, feet below land surface; T, transmissivity; ft2/d, feet squared per day; ft/d, feet per day; --, not available]
Summary of Field Investigations of Groundwater System at North Penn Area 7 13
Table 1. Characteristics of wells with geophysical logs collected and aquifer-interval-isolation (packer) tests conducted by the U.S. Geological Survey at and near North Penn Area 7 Superfund site, Upper Gwynedd Township and vicinity, Montgomery County, Pennsylvania, 2000–2005.—Continued
[USGS, U.S. Geological Survey; ft, feet; ft bls, feet below land surface; T, transmissivity; ft2/d, feet squared per day; ft/d, feet per day; --, not available]
14 Groundwater System and Simulation of Flow for North Penn Area 7 Superfund Site, Montgomery County, Pennsylvania
B4
L5
B6
L7
B8 L9
Leeds and Northrup
75°16'30W75°17'75°17'30"
40°14'
40°13'30"
40°13'
Wissahick
on Creek
Zenith
Teleflex
FERCO
Spra-Fin
Geology from Berg and others (1980) with nomenclaturefrom Lyttle and Epstein (1987) and additional mapping and
lithologic classification from Smoot (unpublished)
Base from U.S. Geological SurveyLansdale 1983, 1:24,000Universal Transverse Mercator, zone 18North American Datum of 1927
175
2134213321322131
21302129
212821272126
2125
212421232122
212121202119
210221012100
209920982097
20962095
20942093
209220912090
208920882087
208620852084
208320822081
2080
RI-9
RI-8
RI-7
RI-11
RI-2
RI-10
RI-13
RI-5
RI-4
RI-3
RI-15
RI-12
RI-1
RI-14
RI-6
202
174
1897
1846
1845
1844
18431842
1841
1505
1149
1148
1146
1145
1144
1147
151
1920
76
72
0 1,000 2,000 FEET500
0 300 600 METERS150
2095
1897
76
Existing well, 2001–06
New monitor well and cluster, 2004–05
Existing well, 1995–96
Well and U.S. Geological Survey identifier (MG- prefix omitted),well cluster identifier (RI-), and dates of logging for—
EXPLANATION
Lithology
Red beds predominant
Gray beds predominant
B, B4-B8
L5-L9
Bed code,this report
RI-7
Figure 6. Location of existing and new monitor wells with geophysical logs and packer tests conducted by U.S. Geological Survey at and near the North Penn Area 7 Superfund site, Upper Gwynedd Township and vicinity, Montgomery County, Pennsylvania, 2000–2005. (See table 1 for list of wells with packer tests.)
Summary of Field Investigations of Groundwater System at North Penn Area 7 15
B4
L5
B6
L7
B8 L9
75°16'30W75°17'75°17'30"
40°14'
40°13'30"
40°13'
Wissahick
on Creek
Geology from Berg and others (1980) with nomenclaturefrom Lyttle and Epstein (1987) and additional mapping and
lithologic classification from Smoot (unpublished)
Base from U.S. Geological SurveyLansdale 1983, 1:24,000Universal Transverse Mercator, zone 18North American Datum of 1927
0 1,000 2,000 FEET500
0 300 600 METERS150
21302129
2125
2080
RI-12
RI-1
RI-14
202
151
1920
76
72
2134213321322131
21282127
2126
21212120
2119
209220912090
2088
208620852084
RI-10
RI-13
RI-5
RI-3
RI-15
1842
1149
1148
175
212421232122
20962095
2094
209320892087
RI-7
RI-11
RI-4 RI-6
174
1846
18451844
1843
18411505
1146
1147
21022101 2100
20992098 2097
208320822081
RI-9
RI-8
RI-2
1897
1145
1144
2095
1897
76
Existing well, 2001–06
New monitor well and cluster, 2004–05
Existing well, 1995–96
Well and U.S. Geological Survey identifier (MG- prefix omitted),well cluster identifier (RI-), and dates of logging for—
EXPLANATION
Lithology
Red beds predominant
Gray beds predominant
B, B4-B8
L5-L9
Bed code
RI-7
Predominant direction of vertical gradientor borehole flow
Down Up
Figure 7. Direction of vertical gradients measured in boreholes and (or) determined from water levels in well clusters at and near North Penn Area 7 Superfund site, Upper Gwynedd Township and vicinity, Montgomery County, Pennsylvania, 2001–2005.
16 Groundwater System and Simulation of Flow for North Penn Area 7 Superfund Site, Montgomery County, Pennsylvania
groundwater-flow paths in a conceptual model of the geologic setting (fig. 5B)
The borehole geophysical logs show the presence of relatively thin (less than 15-ft thick) zones with elevated natu-ral gamma-ray activity that can be correlated between wells and that can be used to estimate sedimentary bed orientation (Senior and others, 2005; 2008). Bedding generally strikes northeast and dips about 10 degrees to the northwest in the vicinity of North Penn Area 7, although the dip angle may not be uniform throughout the area as a result of minor fault-ing. Reported estimates of the dip angle range from about 6 to 12 degrees at and near the location of North Penn Area 7 (Longwill and Wood, 1965; Conger, 1999; Senior and oth-ers, 2005; 2008). The relatively thin zones of elevated natural gamma-ray activity commonly are associated with dark gray to black sedimentary layers in the central and western part of North Penn Area 7 site (fig. 8), which probably are lake deposits that are laterally continuous over several thousands of feet. Although zones of elevated natural gamma-ray activity were measured in wells logged in the eastern part of North Penn Area 7 (east from Wissahickon Creek), these zones could be correlated to similar zones on logs in nearby wells, such as in well clusters that were less than 100 ft apart, but did not appear to correlate between logs of wells more than about 300 ft apart. The apparent lack of correlation of zones with elevated natural gamma-ray activity between wells more than a few hundred ft apart in the eastern part of North Penn Area 7 may be related to changes in the sedimentary environment that either limited or disrupted lateral continuity. In addition, litho-logic differences across the site are inferred from an apparent greater abundance of coarser bedded material, as indicated by single-point resistance logs, in wells in the eastern part of the study area than in wells in the western part of the study area. The lithologic characteristics in the eastern part of the study area may be attributed to the presence of deltaic deposits mapped by Smoot (Joseph P. Smoot, U.S. Geological Survey, written commun., 2005).
Single-point resistance logs for deep (300 ft) wells sepa-rated by hundreds to thousands of feet were correlated in the western part of North Penn Area 7, as was done with the natu-ral gamma-ray logs. Correlations of elevated resistance among well logs indicate laterally continuous deposits of probable relatively coarser-grained sediments (siltstone or sandstone). In the central to eastern part of the study area, only a few thick zones of high resistivity that are probably indicative of sandstone beds could be correlated among wells (Senior and others, 2005); the zones do not appear to be laterally continu-ous over distances of more than a few hundred feet.
In the monitor well clusters throughout the study area, correlation of natural gamma-ray and single-point resistance logs indicate that bedding is laterally continuous over the small horizontal distances (typically less than 30 ft) between the deep, intermediate, and shallow wells. Examples of logs showing interpreted lithologic correlations in monitor-well clusters in the western (RI-15 cluster) and eastern (RI-8 clus-ter) parts of North Penn Area 7 are shown in figure 9.
Aquifer Tests
Packer tests of single wells provided information about local-scale hydraulic properties and water chemistry of iso-lated intervals of the aquifer. Aquifer tests involving a pump-ing well with multiple observation wells provided information about hydraulic properties over a larger area around the tested well than the single-well packer tests.
Single-Well Packer TestsPacker tests were conducted by USGS in wells at and
near North Penn Area 7 to obtain hydraulic and water-quality data in isolated intervals of the aquifer. During these single-well tests, individual water-bearing zones, consisting of one or more fractures, were isolated by use of straddle packers to obtain hydraulic information, such as the extent of hydrau-lic connection between isolated intervals and transmissivity and hydraulic heads in isolated zones, and to obtain water samples to estimate the vertical distribution of contaminants and water-quality characteristics. Tests were conducted on a total of 152 intervals in 26 wells ranging in depth from 85 to 622 ft (9 wells in phase 1 and 17 wells in phase 2 of field investigations) (Senior and others, 2005; 2008). Water-quality data for zones isolated by packers are discussed in the sec-tion “Groundwater Quality in Isolated Intervals” farther on in this report.
Methods used for single-well packer tests done at North Penn Area 7 by USGS are explained in previous reports (Senior and others, 2005; 2008). Water-bearing intervals selected for testing typically were isolated by packers placed about 20 to 30 ft apart. The transmissivity of each interval was calculated from pumping and drawdown data. The transmis-sivity (T) values when divided by the thickness of the isolated interval can be converted to hydraulic conductivity (K).
Results of packer tests revealed that isolated intervals had little to no vertical hydraulic connection to adjacent intervals, as indicated by differences in hydraulic heads in isolated inter-vals after packer inflation and little water-level response in adjacent isolated intervals to pumping of the isolated interval. For example, water-level responses in the isolated interval of 193 to 215 ft below land surface and adjacent intervals in well MG-2131 (RI-15DD; fig. 10) were typical of many isolated zones tested in most wells. The differences in hydraulic heads after packer inflation under static conditions generally con-firmed the direction of vertical gradients indicated by borehole flow measured during logging. These findings support the con-ceptual model of a leaky layered aquifer where water-bearing layers, typically less than 20 ft in thickness, are separated by low-permeability layers that vary in thickness.
Because of similarity in depth and diameter, the hydraulic properties from 15 deep monitor wells were could be com-pared without bias for those characteristics across North Penn Area 7. Transmissivity values calculated from pumping rates and drawdown in the isolated intervals in the 15 deepest new monitor wells ranged over three orders of magnitude (2.8 to
Summary of Field Investigations of Groundwater System at North Penn Area 7 17
RI-1
2DM
G-21
25
RI-1
3DM
G-21
26RI
-5D
MG-
2090
RI-1
0DM
G-21
19
RI-1
DM
G-20
80
RI-1
5DM
G-21
31
MG-
1920
RI-1
4DM
G-21
29
1010
01,
000
10,0
00
Nat
ural
gam
ma-
ray
activ
ity,
in c
ount
s pe
r sec
ond
1010
01,
000
10,0
00
Nat
ural
gam
ma-
ray
activ
ity,
in c
ount
s pe
r sec
ond
1010
01,
000
10,0
00
Nat
ural
gam
ma-
ray
activ
ity,
in c
ount
s pe
r sec
ond
1010
01,
000
10,0
00
Nat
ural
gam
ma-
ray
activ
ity,
in c
ount
s pe
r sec
ond
1010
01,
000
10,0
00
Nat
ural
gam
ma-
ray
activ
ity,
in c
ount
s pe
r sec
ond
1010
01,
000
10,0
00
Nat
ural
gam
ma-
ray
activ
ity,
in c
ount
s pe
r sec
ond
1010
01,
000
10,0
00
Nat
ural
gam
ma-
ray
activ
ity,
in c
ount
s pe
r sec
ond
1010
01,
000
10,0
00
Nat
ural
gam
ma-
ray
activ
ity,
in c
ount
s pe
r sec
ond
50370 5060708090100
110
120
130
140
150
160
170
180
190
200
210
220
230
240
250
260
270
280
290
300
310
320
330
340
350
360
50370 5060708090100
110
120
130
140
150
160
170
180
190
200
210
220
230
240
250
260
270
280
290
300
310
320
330
340
350
360
Altitude, in feet above NAVD 88
50370 5060708090100
110
120
130
140
150
160
170
180
190
200
210
220
230
240
250
260
270
280
290
300
310
320
330
340
350
360
50370 5060708090100
110
120
130
140
150
160
170
180
190
200
210
220
230
240
250
260
270
280
290
300
310
320
330
340
350
360
50370 5060708090100
110
120
130
140
150
160
170
180
190
200
210
220
230
240
250
260
270
280
290
300
310
320
330
340
350
360
370
380 60708090100
110
120
130
140
150
160
170
180
190
200
210
220
230
240
250
260
270
280
290
300
310
320
330
340
350
360
370
380 60708090100
110
120
130
140
150
160
170
180
190
200
210
220
230
240
250
260
270
280
290
300
310
320
330
340
350
360
370
380
220
230
240
250
260
270
280
290
300
310
320
330
340
350
360
EXPL
AN
ATIO
NLi
ne s
how
ing
log
corr
elat
ion
Figu
re 8
. N
atur
al g
amm
a-ra
y lo
gs in
dica
ting
beds
of e
leva
ted
natu
ral g
amm
a-ra
y ac
tivity
that
can
be
corr
elat
ed a
mon
g bo
reho
les/
wel
ls in
the
wes
tern
par
t of N
orth
Pe
nn A
rea
7 Su
perfu
nd s
ite, U
pper
Gw
yned
d To
wns
hip
and
vici
nity
, Mon
tgom
ery
Coun
ty, P
enns
ylva
nia
(Loc
atio
ns o
f wel
ls a
re s
how
n in
fig.
6.)
18 Groundwater System and Simulation of Flow for North Penn Area 7 Superfund Site, Montgomery County, Pennsylvania
Depth, in feet below land surface
Wel
l
Nat
ural
gam
ma-
ray
activ
ity, i
n co
unts
per
sec
ond,
and
sin
gle-
poin
t res
ista
nce,
in o
hm-m
eter
s
Sing
le-p
oint
resi
stan
ce lo
g
Nat
ural
gam
ma-
ray
log
Log
corr
elat
ion
050
01,
000
1,50
00
500
1,00
01,
500
050
01,
000
1,50
00
500
1,00
01,
500
0 50 100
150
200
250
300
MG-
2132
(RI-1
5D)
MG-
2133
(RI-1
5I)
MG-
2134
(RI-1
5S)
MG-
2131
(RI-1
5DD)
050
01,
000
1,50
00
500
1,00
01,
500
050
01,
000
1,50
00
500
1,00
01,
500
0 50 100
150
200
0 50 100
150
200
0 50 200
250
300
250
300
100
150
250
300
A Figu
re 9
. In
terp
rete
d co
rrel
atio
n of
nat
ural
gam
ma-
ray
activ
ity a
nd s
ingl
e-po
int r
esis
tanc
e lo
gs fo
r mon
itor w
ell c
lust
ers
in th
e, A
, wes
tern
(RI-1
5 cl
uste
r) an
d B,
ea
ster
n (R
I-8 c
lust
er) p
arts
of N
orth
Pen
n Ar
ea 7
Sup
erfu
nd s
ite, U
pper
Gw
yned
d an
d vi
cini
ty, M
ontg
omer
y Co
unty
, Pen
nsyl
vani
a. (L
ocat
ions
of w
ells
are
sho
wn
in
figur
e 6.
)
Summary of Field Investigations of Groundwater System at North Penn Area 7 19
020
040
060
080
01,
000
020
040
060
080
01,
000
020
040
060
080
01,
000
Depth, in feet below land surface
MG-
2097
(RI-8
D)M
G-20
98 (R
I-8I)
Wel
lM
G-20
99 (R
I-8S)
020
040
060
080
01,
000
0 50 100
150
200
250
300
020
040
060
080
01,
000
020
040
060
080
01,
000
0 50 100
150
200
250
300
0 50 100
150
200
250
300
Nat
ural
gam
ma-
ray
activ
ity, i
n co
unts
per
sec
ond,
and
sin
gle-
poin
t res
ista
nce,
in o
hm-m
eter
s
Sing
le-p
oint
resi
stan
ce lo
g
Nat
ural
gam
ma-
ray
log
Log
corr
elat
ion
B Figu
re 9
. In
terp
rete
d co
rrel
atio
n of
nat
ural
gam
ma-
ray
activ
ity a
nd s
ingl
e-po
int r
esis
tanc
e lo
gs fo
r mon
itor w
ell c
lust
ers
in th
e A,
wes
tern
(RI-1
5 cl
uste
r) an
d B,
ea
ster
n (R
I-8 c
lust
er) p
arts
of N
orth
Pen
n Ar
ea 7
Sup
erfu
nd s
ite, U
pper
Gw
yned
d an
d vi
cini
ty, M
ontg
omer
y Co
unty
, Pen
nsyl
vani
a.—
Cont
inue
d (L
ocat
ions
of w
ells
ar
e sh
own
in fi
gure
6.)
20 Groundwater System and Simulation of Flow for North Penn Area 7 Superfund Site, Montgomery County, Pennsylvania
EXPLANATION
Water level above isolated interval
Water level in isolated interval
Water level below isolated interval
Dept
h to
wat
er, in
feet
bel
ow la
nd su
rface
45
44
43
42
41
40
39
Time elapsed since test began, in minutes0 40 80 120 160 200 240 280
Inflate upper packer
Pump on
Inflatelowerpacker
Pump off
Deflatelowerpacker
Deflate upper packer
MG-2131 (RI-15DD) Zone 5 (193–215 feet below land surface)
Figure 10. Water levels in the isolated interval of 193 to 215 ft below land surface and adjacent intervals in well MG-2131 (RI-15DD) during the single-well packer tests, North Penn Area 7 Superfund site, Upper Gwynedd Township and vicinity, Montgomery County, Pennsylvania, June 10, 2005.
2,290 ft2/d) (Senior and others, 2008). These transmissivity values, however, showed some relation to depth over the range of depths tested, although the full range of transmissivities was measured throughout the 300-ft thickness of the aquifer. When transmissivities of tested intervals were grouped by depth in ranges of 50 ft (fig. 11A), the transmissivities of the shallowest zones and deepest zones tested (interval midpoints of 0 to 50 and 251 to 300 ft below land surface, respectively) were sta-tistically significantly different (smaller) from transmissivities of intermediate depths, as determined by the non-parametric Kruskall-Wallis test using a p-value of 0.05 (statistically sig-nificant at a 95-percent confidence level). Transmissivities of tested zones at intermediate depths (interval midpoints ranging from 51 to 250 ft below land surface) were statistically similar to each other. The hydraulic conductivity of tested intervals, calculated by dividing transmissivity by the length of the tested interval, shows the same relation to depth as transmis-sivity (fig. 11B). Results of the evaluation of differences in transmissivity with depth suggests that weathering may reduce the permeability of the shallowest interval tested (0 to 50 ft below land surface) and that the frequency of high-permea-bility zones decreases with depth below 250 ft. The transmis-sivities of water-bearing zones in the existing production and monitor wells tested mostly during phase 1 of field activities (Senior and others, 2005) ranged from 1.2 to 795 ft2/d (0.11 to 146 m2/d) and were similar to those determined for the 15 new
deep monitor wells. Transmissivities of tested zones for deep monitor and existing production wells are shown in a cross-section (fig. 12) where well locations have been projected onto the section line oriented in the dip direction.
Transmissivities and associated hydraulic conductivi-ties of individual tested zones did not differ statistically by geologic unit (fig. 13A), as determined by the non-parametric Kruskall-Wallis test using a p-value of 0.05. These hydraulic properties ranged over the same three orders of magnitude for the four geologic units with more than four water-bearing zones tested. Mean and median values of hydraulic conductiv-ity determined in packer tests of individual isolated zones in geologic units ranged from 5.7 to 18.4 ft/d (1.7 to 5.6 m/d) and 3.0 to 5.1 ft/d (0.9 to 1.6 m/d), respectively (fig. 13B). Esti-mates of bulk or average hydraulic conductivity for geologic units calculated by dividing the total transmissivity of water-bearing zones by the total open interval of the geologic unit intersected by a borehole were slightly less than average of the hydraulic conductivities determined for individual zones because the bulk calculation included very low permeabil-ity sections of the aquifer that were not tested with packers. For data collected from the 15 new deep monitor wells, bulk hydraulic conductivity ranged from 0.1 to 26.4 ft/d (0.03 to 8.0 m/d), and average estimates of bulk conductivity for geologic units L5, B6, L7, B8, L9 were 3.7, 8.8, 7.6, 5.2, and 9.4 ft/d (1.1, 2.7, 2.3, 1.6, and 2.9 m/d), respectively.
Summary of Field Investigations of Groundwater System at North Penn Area 7 21
75th percentile
Number of values
Outside value—Values are more than 1.0 times the interquartile range from the top to bottom of the box
Far-out value—Values are more than 1.5 times the interquartile range from the top to bottom of the box
50th percentile (median)Mean25th percentile
Interquartilerange
EXPLANATION(31)
A B
Tran
smis
ivity
, in
squa
re fe
et p
er d
ay
Hydr
aulic
con
duct
ivity
, in
feet
per
day
1
2
5
10
20
50
100
200
500
1,000
2,000
5,000
10,000
0.010.02
0.050.10.2
0.512
51020
50100200
5001,000
(31) (19)
(17) (15) (13)(10)
Range of depths tested, midpoint, in feet below land surface
0–50 51–100 101–150 151–200 201–250 251–300
(31) (19)
(17) (15) (13)
(10)
Range of depths tested, midpoint, in feet below land surface
0–50 51–100 101–150 151–200 201–250 251–300
Figure 11. A, calculated transmissivities and B, hydraulic conductivities in relation to a range of depths for water-bearing intervals isolated by packers in 15 wells of similar depths, North Penn Area 7 Superfund site, Upper Gwynedd Township and vicinity, Montgomery County, Pennsylvania, March 2004 through August 2005. Wells ranging in depth from 246 to 300 feet (new monitor wells RI-1D to RI-15DD) were initially drilled as the deepest borehole in a monitor-well cluster.
MG-2125RI-12D MG-2081
RI-2D
MG-151Ford #5
A A'
B8
L7
B6
L5
L9
EXPLANATION
MG-202L-22
0–24
21–100
101–300
301–1,000
1,001–2,290
Transmissivity of isolated interval, in square feet per day
Well bottom
L7
Mapped geologic unitand bed code (see figure 6for bed codes)
Land surface at well head. U.S. Geological Survey well identifer (MG-)and cluster number (RI-) or other identifier
-300
-200
-100
0
100
200
300
400
500
0 1,000 2,000 3,000 4,000 5,000 6,000
Elev
atio
n, in
feet
abo
ve N
AVD8
8
Distance from origin of transect, in feet
Land surface along transect
MG-2126RI-13D
MG-2090RI-5D
MG-2119RI-10D
MG-2080RI-1D
MG-1920
MG-2131RI-15DD
MG-2129RI-14D MG-2084
RI-3D
MG-2087RI-4D
MG-202L-22
MG-1897CL-3
MG-2095RI-7D
MG-2097RI-8D
MG-2122RI-11D
MG-2093RI-6D
MG-2100RI-9D
Figure 12. Section A–A’ with transmissivity of tested zones in selected wells that are projected onto a line approximately parallel to estimated dip of 10 degrees, North Penn Area 7 Superfund site, Upper Gwynedd Township and vicinity, Montgomery County, Pennsylvania. (See figure 6 for explanation of bed codes and figure 14 for location of section line.)
22 Groundwater System and Simulation of Flow for North Penn Area 7 Superfund Site, Montgomery County, Pennsylvania
75th percentile
Number of values
Outside value—Values are more than 1.0 times the interquartile range from the top to bottom of the box
Far-out value—Values are more than 1.5 times the interquartile range from the top to bottom of the box
50th percentile (median)Mean25th percentile
Interquartilerange
EXPLANATION(31)
1
2
5
10
20
50
100
200
500
1,000
2,000
5,000
10,000
0.010.02
0.050.10.2
0.512
51020
50100200
5001,000
Tran
smis
ivity
of i
sola
ted
aqui
fer i
nter
val,
in s
quar
e fe
et p
er d
ay
Hydr
aulic
con
duct
ivity
of i
sola
ted
aqui
fer i
nter
val,
in fe
et p
er d
ayGeologic unit bed code Geologic unit bed code
L5 B6 L7 B8 L9 L5 B6 L7 B8 L9
(4)
(31)(26)
(24) (21)
(4)
(31) (26)
(24) (21)
A B
Figure 13. A, calculated transmissivities and B, hydraulic conductivities, by mapped geologic unit, for water-bearing intervals isolated by packers in 15 wells of similar depths, North Penn Area 7 Superfund site, Upper Gwynedd Township and vicinity, Montgomery County, Pennsylvania, March 2004 through August 2005. Wells ranging in depth from 246 to 300 feet (RI-1D to RI-15DD) were initially drilled as the deepest boreholes in monitor-well clusters. (See figures 4 and 6 for explanation of geologic unit bed codes.)
Multiple-Well Aquifer Tests
In 2002 and 2004, the production well MG-202 (L-22) (fig. 2) was shut down for periods of a few days, providing an opportunity to measure water-level response in nearby wells to the shutdown and restart of pumping. Data collected for these shutdown tests at multiple observation wells are presented in detail by Senior and others (2005) and Senior and others (2008). Locations of pumped and observation wells used for these tests are shown in figure 14. The 623-ft deep production well MG-202 (L-22) was pumped at rates from about 75 to 125 gallons per minute (gal/min) during routine operation. The primary purpose of the tests was to determine the spatial dis-tribution of hydraulic responses rather than to estimate aquifer properties of transmissivity and storage. However, drawdown and recovery data for observation wells obtained during the two tests were analyzed by use of Theis (1935) solution for confined aquifers, a method that is not strictly appropriate for these dipping-bed fractured-rock leaky aquifers but was considered useful as a first approximation and to evaluate the extent of deviation from the Theis solution. This analysis yielded estimates of transmissivity that ranged from 712 to 2,286 ft2/d (66 to 212 m2/d) and of storage that ranged from 0.00003 to 0.0071 (Senior and others, 2005; 2008).
Wells that responded to changes in pumping of well MG-202 (L-22) generally were along strike or open to the projected dip of the thickness of aquifer intersected by water-producing zones in well MG-202 (L-22). Water levels in wells that were open to the structurally projected thickness of the main producing interval of well MG-202 (L-22), located
from 53 to 260 ft below land surface with the main produc-ing zone at about 150 ft below land surface, reflected changes in pumping at well MG-202 (L-22), whereas water levels in wells that were not open to the structurally projected thick-ness of the main producing interval in well MG-202 (L-22) did not reflect changes during the 2002 or the 2004 shutdown tests (fig. 15). The changes in water levels shown on figure 15 were not corrected for changes in background water levels, which were +0.10 ft (rise) and -0.44 ft (decline), respectively, for the March 2002 and December 2004 tests in background well MG-68. The schematic cross-sections (fig. 15) assume a dip angle of 10 degrees to the northwest and depict the general pattern of wells that respond to pumping in well MG-202 (L-22). However, the dip angle may not be uniform throughout the area as a result of minor faulting. Previous estimates of the dip angle determined from log correlation range from about 6 to 10 degrees in the area (Conger, 1999; Senior and others, 2005; 2008); therefore, actual bedding planes of geologic units may differ from those shown in this schematic and other cross sections presented in this report.
A pattern of water-level responses, indicating similar structural/stratigraphic controls on hydraulic connections, was observed in nearby wells during the June 2005 packer test of the deep well MG-2131 (RI-15DD) when water-levels were monitored in wells MG-2085 (RI-3I) , MG-2084 (RI-3D), MG-2092 (RI-5S), MG-2091 (RI-5I), MG-2090 (RI-5D), and MG-2126 (RI-13D) (fig. 16). These data, which are not presented in previous reports, show that only well MG-2090 (RI-5D), which is open downdip from the tested isolated interval at 193 to 215 ft below land surface in well MG-2131
Summary of Field Investigations of Groundwater System at North Penn Area 7 23
0.0–1.01.1–10.010.1–40.0
40.1–80.0
80.1–141.8
Stream
Observation well and U.S. Geological Survey (USGS) well identifier(s) (MG- prefix omitted) monitored in December 2004 and(or) in March 2002
Observation well and USGS well identifier(s) (MG- prefix omitted) monitored in March 2002
Pumping well and USGS well identifier(s)
2101
175
202
Pumping rate in wellin December 2004,in gallons per minute
B8 L9
B4
L5
B6
L7
75°16'30"75°17'75°17'30"
40°14'
40°13'30"
40°13'
Wissahick
on Creek
Geology from Berg and others (1980) with nomenclaturefrom Lyttle and Epstein (1987) and additional mapping and
lithologic classification from Smoot (unpublished)
Base from U.S. Geological SurveyLansdale 1983, 1:24,000Universal Transverse Mercator, zone 18North American Datum of 1927
2101
2087
2084
1146
204
1841
171
135 (Ford 3)
147 (Ford 4)
175
20942093
2082
1897
1145
72
77
76
202
174
212421232122
1848 1849
2083
B
A
B'
A'
0 1,000 2,000 FEET500
0 300 600 METERS150
EXPLANATION
Lithology
Red beds predominant
Gray beds predominant
B4, B6, B8
L5, L7, L9
Bed code,this report
A A' Section lineNomenclature
Figure 14. Location of pumped production and observation wells used for multiple well aquifer tests, and lines of section A–A’ and B–B’, at North Penn Area 7 Superfund site, Upper Gwynedd Township and vicinity, Montgomery County, Pennsylvania, 2002–2005. Cross sections for A–A’ and B–B’ lines shown in figure 15.
24 Groundwater System and Simulation of Flow for North Penn Area 7 Superfund Site, Montgomery County, PennsylvaniaAl
titud
e, in
feet
abo
ve N
AVD
88
400
300
200
100
0
-200
-300
-100
0 1,000 2,000 3,000 4,000 5,000 6,000
A A’
L5
B6
L7
B8
L9
RI-3D
RI-4D
MG-1146 MG-1145
RI-2I
RI-2D
MG-72
MG-202
MG-1897
RI-9I
RI-6D
RI-6S RI-11S
RI-11I
RI-11D
MG-175
TELEFLEX Spra-Fin
Vertical exaggeration x 5
(-106)
(-1.45)(-1.62)
(-0.63) (-0.58)
(-2.0)
(-1.31)
(-0.03)
(-2.15)
(-1.48)
(-0.29)(-0.28)
(-0.31)
(0.10)
(-0.27)
Most productive water-bearing zonein well MG-202 projected along dip
Elevation of land surfaceat well head
MG-175
MG-174
MG-202
MG-72
MG-76
MG-1897
MG-1849MG-1848MG-1146
Ford 4.4
Ford 4.3
Ford 4.2
Ford 4.1
Ford 3.2
Ford 3.3
Ford 3.4
Major producing zone
in well MG-202
Interval of greatestproducing zones in well MG-202 projectedin direction of local dip
(-1.6)
(-1.09)
(-0.11)
(-6.86)
(0.26)
(0.32)
(-0.02)(0.07)
(-3.95)
(0.25)
(0.28)
(0.27)
(0.20)
(no data)
Distance along transect, in feet from origin A
MG-2084
MG-2087MG-2082
MG-2081
MG-2094 MG-2124
MG-2123
RI-11DMG-2122
(0.10) Other well identifier
Change in water level, in feet, after 1,000 minutes of pumping well MG-202, restarted on December 3, 2004
Top of open interval
EXPLANATION
Bottom of open interval
MG-2093
MG-2101MG-2122
U.S. Geological Survey well identifier
EXPLANATIONTop of open interval
Bottom of open interval
Water-bearing zone
Land-surface altitude at wellhead
Well identifer and change in water level, in feet, after 1,000 minutes of pumping well MG-202, restarted on March 5, 2002; italized if showing relatively large drawdown
MG-1848(0.07)
L7
Mapped geologic unit and bed code (see figure 6 for bed codes)
400
-300
-200
-100
0
100
200
300
Altit
ude,
in fe
et a
bove
NGV
D 29
1,500000,10050005-000,1-005,1-
Distance from well MG-202 in dip direction of N. 50 degrees W. (Dip angle 10 degrees), in feet000,2-
NW SE
B’B
B
A
Figure 15. A, section B–B’ with production well MG-202 (L-22) and 15 observation wells monitored during shutdown and after restart of pumping in well MG-202 in March 2002 and B, section A–A’ with production well MG-202, 14 observation wells monitored during shutdown and restart of pumping in well MG-202 in December 2004, well MG-175 at the Spra-Fin property, and mapped geologic units at and near North Penn Area 7, Upper Gwynedd Township and vicinity, Montgomery County, Pennsylvania. Well open interval is depicted with measured change in water levels 1,000 minutes after restart of pumping in well MG-202 on March 5, 2002, and December 3, 2004. Changes in water levels in wells shown on figure are not corrected for changes in background water levels, which were +0.10 feet (rise) and -0.44 feet (decline), respectively, for the March 2002 and December 2004 tests in background well MG-68. (Figures modified from A, Senior and others (2005) and B, Senior and others (2008). Lines of sections are shown in figure 14. Mapped geologic units in 15A are shown in figure 6.)
Summary of Field Investigations of Groundwater System at North Penn Area 7 25
MG-2125RI-12D
MG-2128,2127,2126RI-13S,13I,13D
MG-2092, 2091,2090RI-5S,5I,5D
MG-2080MG-1920RI-1D
MG-2121,2120,2119RI-10S,10I,10D
MG-2131RI-15DD
MG-2130,2129RI-14I,14D
MG-2083,2082,2081RI-2S,2I,2D
MG-202L-22
MG-2089,2088,2087RI-4S,4I,4D
A A'
B8
L7
B6
L5
L9
0–25
51–75
76–100
No apparent water-level response
to testsWater-level response
No data
Transmissivity of isolated interval, in square feet per day
Wells monitored during aquifer-interval isolation tests in well MG-2131 (RI-15DD)
EXPLANATION
L7
MG-202L-22
Zone number
Mapped geologic unit and bed code (see figure 6 for bed codes)
Land surface at well head. U.S. Geological Survey well identifer (MG-)and cluster number (RI-) or other identifier
z1
-300
-200
-100
0
100
200
300
400
500
0 1,000 2,000 3,000 4,000 5,000 6,000
Altit
ude,
in fe
et a
bove
NAV
D 88
Distance from origin of transect, in feet
Land surface along transect
Plane throughisolated intervalprojected along dip
z2
z1
z4
z5
z6
z7
z3
MG-1897CL-3
MG-2102,2101,2100RI-9S,9I,9D
MG-2094,2093RI-6S,6D
MG-2124,2123,2122RI-11S,11I,11D
MG-2099,2098,2097RI-8S,8I,8D
MG-2096,175,2095RI-7S,7I,7D
MG-2086, 2085,2084RI-3S,3I,3D
Figure 16. Water-level responses to pumping of isolated intervals in well MG-2131 (RI-15DD) in June 2005, North Penn Area 7 Superfund site, Upper Gwynedd Township and vicinity, Montgomery County, Pennsylvania. (Locations of wells are shown in figure 6, and measured water levels are shown in figure 17. Line of section is shown in figure 14.)
26 Groundwater System and Simulation of Flow for North Penn Area 7 Superfund Site, Montgomery County, Pennsylvania
(RI-15DD) (zone 5 in Senior and others, 2008), responds measurably to pumping (fig. 17). The water-level responses in MG-2090 (RI-5D) track water-level changes resulting from both pumping and packer inflation in any interval in MG-2131 (RI-15DD) that included fractures at 193 to 215 ft below land surface. Thus, the two wells were connected through the frac-tures at 193 to 215 ft below land surface while well MG-2131 (RI-15DD) was an open borehole during the packer testing and before reconstruction. Wells located nearby but not open updip or downdip from the 193 to 215 ft interval and other tested intervals in well MG-2131 (RI-15DD) did not respond. Long open sections of boreholes can act as short circuits to connect fractures in layers of the aquifer that under natural conditions are separated.
The spatial distribution and magnitude of hydraulic con-nections of water-bearing fractures will vary at the local scale from site to site and are likely to be specific to each site at the local scale. Additional multi-well aquifer tests would be needed to establish extent of interconnection between inter-vals at the local scale to address remediation or migration of contamination at each source area.
Groundwater Levels Water levels were measured by USGS in existing and
new monitor wells in synoptic rounds in 2000, 2005, and 2006 to provide information on horizontal and vertical gradients and depth to water throughout North Penn Area 7. Data on the synoptic water levels, water levels measured by USGS in 1996, and water levels measured and reported by Merck & Co. in 2000 and 2005 for about 40 observation wells on and near the Merck facility in West Point, Pa., were used in the cali-bration of the groundwater-flow model. Also, water levels in four wells were measured continuously by USGS for various long-term periods from 2000 through 2006 to provide infor-mation about groundwater conditions during the RI. Three of the four wells (MG-72, MG-1145, MG-1146) are within the boundary of the North Penn Area 7 (fig. 4) or within about 1,000 ft of the boundary, and the fourth well (MG-68) is about 3,500 ft to the northwest (figs. 3 and 4). Well MG-68 provided background water-level data because the well did not appear to be directly affected by pumping in the area after early 2000 when a nearby production well (MG-69, fig. 4) in Lansdale was shutdown.
Depths to static water levels in wells in North Penn Area 7 from December 2000 through September 2006 ranged from about 6 to 83 ft below land surface, generally were least in shallow wells near streams or springs, and were greatest in wells affected by nearby pumping or on hilltops. Water levels fluctuated seasonally in response to changes in recharge and were lowest during dry periods in 2001 and 2002. Regionally, groundwater levels, as mapped in 2000 (Senior and Ruddy, 2004) and measured in the synoptic rounds from 2000 through 2005, indicate a potentiometric surface similar to the topog-raphy, except in areas affected by relatively large amounts of pumping.
In the December 2000 synoptic round, water levels were measured by USGS in 56 existing non-pumping residential, production, and monitor wells; those water levels combined with water levels reported by Merck & Co. in 40 observation wells on or near their West Point facility were used to estimate the altitude and configuration of the regional potentiometric surface at and near North Penn Area 7 (Senior and Ruddy, 2004). These existing mostly, open-hole wells range in depth from less than 50 ft to more than 400 ft, although most wells (about 70 percent) range in depth from 50 to 200 ft. Wells for residential, industrial, and water supply typically are con-structed as open holes (surface casing only) in competent bed-rock aquifers and frequently have more than one water-bearing zone; therefore, measured water levels in these wells typically represent composite heads. Cones of depression are indicated in an area at and near the Merck facility where numerous wells pump a total of about 1 million gallons per day (Mgal/d). The regional potentiometric surface estimated from measured water levels appears relatively flat at North Penn Area 7 with water-level altitudes within the approximate site boundary (fig. 4) ranging from 301 to 323 ft above NAVD 88 in 2000.
Comparison of water levels measured in the same wells in August 1996, December 2000, and June 2005 indicates that levels generally were 1 to 15 ft higher in 1996 and 2005 than in 2000, except in some areas where water levels were locally affected by nearby pumping that appeared to vary over time. For example, differences in water levels between measurement periods were as large as 69 ft at the Merck facility, probably because of different rates of nearby pumping at the time of measurement. Evaluation of water-level records for the nearest USGS observation wells completed in similar geologic units (BK-929 and BK-1020 in Bucks County, fig. 2) shows levels were close to long-term annual mean water levels in August 1996 but about 2 to 3 ft lower than the long-term annual means in December 2000 (fig. 18). These long-term records indicate that regional water levels were below average for fall-to-winter periods during 2000–02 and fall 2005 and generally above average from early 2003 to mid-2005 and 2006.
Several additional rounds of synoptic water-level mea-surements were made in new monitor and existing wells in the immediate vicinity of North Penn Area 7 from late fall 2004 through spring of 2006. Water levels in 76 wells were mea-sured during December 2004, 82 wells during June 2005, 83 wells during September 2005, 49 wells during October 2005, and 90 wells during March 2006. Water levels measured in December 2004, June 2005, and March 2006 when compared to long-term data (wells BK-929 and BK-1020) were slightly higher than or close to long-term annual means. Water levels typically exhibit seasonal fluctuations and are lowest in the fall, but water levels measured in September and October 2005 were lower than long-term seasonal and long-term annual means. Although 2005 overall was a relatively normal year in terms of annual precipitation, precipitation was below normal from April to October, and water levels in wells declined by as much as 15 ft during this relatively dry period. As part of the RI, groundwater samples were collected by CDM for the
Summary of Field Investigations of Groundwater System at North Penn Area 7 27
MG-2092 (RI-5S)
MG-2090 (RI-5D)
MG-2126 (RI-13D)
MG-2084 (RI-3D)
MG-2085 (RI-3I)
MG-2091 (RI-5I)
Time of tests of isolated zones in well MG-2134 (RI-15)
Figure 17. Water levels measured in A, wells MG-2085 (RI-3I) and MG-2084 (RI-3D) and B, MG-2092 (RI-5S), MG-2091 (RI-5I), MG-2090 (RI-5D), and MG-2126 (RI-13D) during the packer test of well RI-15DD (MG-2131), June 9–13, 2005, North Penn Area 7 Superfund site, Upper Gwynedd Township and vicinity, Montgomery County, Pennsylvania. (Open intervals of wells and isolated zones in well MG-2131 (RI-15DD) are shown in figure 16.)
28 Groundwater System and Simulation of Flow for North Penn Area 7 Superfund Site, Montgomery County, Pennsylvania
401415075175101 MG-68
402643075150501 BK-929 Bucks County observation well
401157075032001 BK-1020 Bucks County observation well
15
20
25
30
35
40
45
50
55
60
Daily
mea
n de
pth
to w
ater
, in
feet
bel
ow la
nd s
urfa
ce
Long-term (1984–2010) annual mean of 43.16 feet for BK-929
Long-term (1975–2010) annual meanof 32.68 feet for BK-1020
Figure 18. Water levels in long-term observation wells BK-929 and BK-1020 and in well MG-68, North Penn Area 7, Upper Gwynedd Township and vicinity, Montgomery County, Pennsylvania, 1996–2006. (Locations of wells BK-929 and BK-1020 are shown in figure 2 and location of well MG-68 in figure 3.)
USEPA in October 2005, a dry period when water levels were low, and in March 2006 when groundwater levels were on average about 6 to 7 ft higher than in October 2005.
Synoptic water-level measurements for the monitor well clusters showed the presence of vertical gradients, which were predominantly downward west of Wissahickon Creek and predominantly upward, except where affected by pumping, east of Wissahickon Creek (Senior and others, 2008; fig. 7). Although water levels in all wells fluctuated from one synoptic round of measurements to the next, vertical gradients were relatively similar for wells in clusters for all synoptic mea-surement rounds (table 78, p. 157–158 in Senior and others, 2008), except for wells in the RI-2 and RI-9 clusters (fig. 6). In these two clusters, vertical gradients increased substan-tially from December 2004 to periods in 2005 and 2006, and these changes appear to be independent of the drought in late summer and fall 2005. For the RI-2 cluster, water levels in the intermediate and deeper wells [MG-2082 (RI-2I) and MG-2081 (RI-2D)] declined much more (greater than 30 ft) than levels in the shallow well [MG-2083 (RI-2S)]. For the RI-9 cluster, water levels in the shallow and intermedi-ate wells [MG-2102 (RI-9S) and MG-2101 (RI-9I)] declined much more (greater than 30 ft) than levels in the deep well
[MG-2100 (RI-9D)]. The wells that had the largest declines have intervals open to the hydrogeologic unit most affected by pumping along the Wisshahickon Creek and at the Merck facility (see unit coded B8 in figures 4, 6, and 16).
Streamflow Measurements and Groundwater/Surface-Water Relations
Streamflow under base-flow conditions was measured at selected locations (fig. 19) along Wissahickon Creek to evalu-ate groundwater/surface-water relations periodically from December 2000 to September 2005. The periodic streamflow measurements show that the stream lost water in the reach from station 01473808 at Wissahickon Avenue to 01473809 at Sumneytown Pike in 2001, 2002, most of 2003, summer 2005, and fall 2005 when groundwater levels were low and gained water in winter and spring 2004 and 2005 when groundwa-ter levels were relatively high (fig. 20). The stream was dry (had no measureable base flow) at station 01473809 (fig. 19) in December 2000, summer and fall 2001, spring through summer 2002, and the summers of 2003, 2004, and 2005. A seepage study to investigate gains and losses from stream to
Summary of Field Investigations of Groundwater System at North Penn Area 7 29
0 400 800 METERS200
0 1,000 2,000 3,000 FEET500
Wissah
ickon
Creek
Geology from Berg and others (1980) with nomenclaturefrom Lyttle and Epstein (1987) and additional mapping and
lithologic classification from Smoot (unpublished)
Base from U.S. Geological SurveyLansdale 1983, 1:24,000Universal Transverse Mercator, zone 18North American Datum of 1927
5B
4A
97
2
11A
3A
72
68
2021146
1145
01473809
01473808
01473807
01473806
75°17' 75°16'
40°13'
40°14'
EXPLANATIONLithology—
Red beds predominant
Gray beds predominant
Lower Brunswick contact with deltaic units
Stream
Well and U.S. Geological Survey identifier (MG- prefix omitted)
Streamflow-measurement site and identifier01473806
Pumping rate in well in June 2003, in gallons per minute
0.0–0.1
0.1–20.0
20.1–50.0
50.1–100.0
100.1–131.91145
Mainstem streamflow gain measured at site on June 30, 2003
Mainstem streamflow loss measured at site on June 30, 2003
Seepage study streamflow-measurement site and identifier7
Figure 19. Location of pumped wells with pumping rates, observation wells, and streamflow-measurement sites for the June 2003 seepage investigation on Wissahickon Creek and lithology at and near North Penn Area 7, Upper Gwynedd Township and vicinity, Montgomery County, Pennsylvania.
30 Groundwater System and Simulation of Flow for North Penn Area 7 Superfund Site, Montgomery County, Pennsylvania
MG-1146
Wat
er-le
vel a
ltitu
de, i
n fe
et a
bove
NAV
D 88
MG-72
Estimated altitude of streambed near well MG-72
350
340
330
320
310
300
290
MG-1145
Year
Estimated altitude of streambed near wells MG-1145 and MG-1146
2001 2005 200620042002 2003
Figure 20. Measured groundwater levels (shown as altitudes) in wells MG-72, MG-1145, and MG-1146 and estimated altitudes of the streambed of Wissahickon Creek near the wells, at and near North Penn Area 7 Superfund site, Upper Gwynedd Township and vicinity, Montgomery County, Pennsylvania, December 2000–November 2006.
groundwater was conducted in late June 2003. Synoptic mea-surements of streamflow on June 30 and July 3, 2003 (Senior and others, 2005), indicate loss of streamflow in reaches with production wells near Wissahickon Creek (between sites 1 and 2 and between sites 01473806 and 01473807 in fig. 19). The June 2003 seepage study indicated a gain in streamflow between sites 2 and 01473806, the latter being very near well MG-72. Streamflow measurements are described in detail in reports by Senior and others (2005; 2008).
Groundwater Quality at North Penn Area 7
Data on groundwater quality at and near North Penn Area 7 were collected by USGS for isolated intervals of the aquifer during packer tests of existing wells and new deep monitor wells during 2001–05 (Senior and others, 2005; Senior and others, 2008); CDM sampled existing open-hole production, supply, and monitor wells and screened inter-vals of new monitor wells during 2001–06 (CDM Federal Programs Corporation 2011). Analyses for concentrations of volatile organic compounds (VOCs) and other contaminants in all groundwater samples were conducted by laboratories under contract to CDM and USEPA; complete results for these analyses are reported and interpreted in CDM (2011)
and only briefly discussed in this report. Concentrations of VOCs in water samples collected from intervals isolated dur-ing packer tests were used to investigate the vertical extent of contamination in groundwater and to guide completion depths of nested wells in clusters. The spatial extent of VOCs and other contaminants at North Penn Area 7 were determined by CDM through sampling rounds in 2001, 2005, and spring 2006. Contaminant concentrations in groundwater generally were greatest for TCE and PCE at the site, but numerous other VOCs were detected, including 1,1,1-trichloroethane (TCA), 1,1-diochloroethene (DCE), 1,2-DCE, cis-1,2,-DCE, trans-1,2-DCE, vinyl chloride (VC), carbon tetrachloride, and the chlorofluorocarbons CFC-11 and CFC-113.
Groundwater Quality in Isolated Intervals Water samples were collected from the isolated intervals
in the fractured-rock aquifer for use as screening values only because the samples potentially were affected by the condition of open boreholes. In open boreholes, water from producing fractures may travel in the borehole to exit in receiving frac-tures, and thus, water samples collected from the interval with receiving fractures may represent a mixture of water from that interval and other producing intervals in the open borehole. At
Summary of Field Investigations of Groundwater System at North Penn Area 7 31
North Penn Area 7, packer tests were done in boreholes that had been open for periods ranging from a few weeks for some recently drilled monitor wells to decades for some previously existing current and former production wells. Nevertheless, water chemistry of samples from the isolated intervals showed some distinct differences, which are supported by results of subsequent sampling by CDM in 2005 and 2006 of monitor well clusters, that provide evidence for a conceptual model of discrete flow paths through the layered aquifer.
Concentrations of TCE and some other VOCs tended to be, but were not always, greatest in the samples from shallow isolated intervals of wells at known contaminant source areas. Maximum concentrations of frequently detected VOCs in samples from isolated intervals were 640 micrograms per liter (µg/L) for TCE, 37 µg/L for PCE, 680 µg/L for cis-1,2,-DCE, 59 µgL for 1,1,1-TCA, 33 µg/L for 1,1-DCE, 55 µg/L for CFC-11, and 71 µg/L for CFC-113. Maximum concentrations of some infrequently detected VOCs were 14 µg/L for vinyl chloride (VC) and 33 µg/L for carbon tetrachloride.
In addition to collection of water samples from isolated zones for VOC analysis, field measurements were made by USGS of pH, temperature, specific conductance, dissolved oxygen concentration, acid neutralizing capacity (ANC) which often is similar or equivalent to alkalinity, nitrate, sulfate, sulfide, total iron, and ferrous iron in unfiltered samples by methods described in Senior and others (2005; 2008). Sum-mary statistics describing these measurements are listed in table 2, and graphs showing the distribution of selected water-quality characteristics of, and constituents in, water from isolated zones in each well are presented in figure 21. Gener-ally, water samples had near neutral to slightly alkaline pH; low to moderate concentrations of dissolved oxygen, nitrate, and sulfate; mostly low concentrations of total and ferrous
iron; and moderate to high specific conductance (table 2). Comparison of water quality between wells indicates some general differences. Specific conductance is much higher [greater than 700 and up to 2,700 microsiemens per centime-ter (µS/cm)] in water samples from isolated intervals in wells MG-2125, MG-2126, and MG-2090 (open boreholes later reconstructed as RI-12D, RI-13D, and RI-5D, respectively), in the western part of the study area than elsewhere. Alkalinity (as estimated by ANC) is also elevated (250 to 350 mg/L as CaCO3) in one of these wells [MG-2125 (later reconstructed as RI-12D)]. Sulfate concentrations in water samples from isolated intervals differ more among wells than among zones in an individual well.
Groundwater Quality in Existing and New Monitor Wells
Groundwater samples were collected by CDM from existing and new monitor wells during three rounds of sam-pling during 2001–06 as part of the RI to assess the extent of groundwater contamination at North Penn Area 7. Only exist-ing wells were sampled during the first round in 2001–02, and both existing and new monitor wells were sampled during the second and third rounds in fall 2005 and spring 2006. The first round of groundwater samples was analyzed for VOCs, semi-volatile organic compounds, pesticides, and selected major ions and metals. The second and third rounds of groundwater samples were analyzed for VOCS, selected major ions and metals, and a few additional inorganic constituents suggested by USGS, including chloride, sulfate, and silica in the second round samples and chloride, bromide, and boron in the third round samples.
Table 2. Summary statistics of physical and chemical characteristics measured in the field of unfiltered water samples collected from isolated zones in 15 deep monitor wells, North Penn Area 7 Superfund site, Upper Gwynedd Township and vicinity, Montgomery County, Pennsylvania, March 2004 through August 2005.
[°C, degrees Celsius; mg/L, milligrams per liter; µS/cm, microsiemens per centimeter at 25 °C; ANC, acid neutralizing capacity; mg/L as CaCO3, milligrams per liter as calcium carbonate; mg/L as N, milligrams per liter as nitrogen; <, less than]
Characteristic UnitsNumber of
zonesMinimum 10th percentile Median 90th percentile Maximum
32 Groundwater System and Simulation of Flow for North Penn Area 7 Superfund Site, Montgomery County, Pennsylvania
0
100
50
150
200
250
300
350
400
Alka
linity
, in
mill
igra
ms
per l
iter
as c
alci
um c
arbo
nate
0
1
2
3
4
5
6
7
8
9
12 13 5 10 1 15 14 4 3 2 9 6 11 8 7RI-
Diss
olve
d ox
ygen
,in
mill
igra
ms
per l
iter
Dissolved Oxygen
0.0
0.5
1.0
1.5
2.0
2.5
3.0
3.5
12 13 5 10 1 15 14 4 3 2 9 6 11 8 7RI-
Nitr
ate,
in m
illig
ram
s pe
r lite
ras
nitr
ogen
Nitrate
0
500
1,000
1,500
2,000
2,500
3,000
12 13 5 10 1 15 14 4 3 2 9 6 11 8 7RI-
Spec
ific
cond
ucta
nce,
in m
icro
siem
ens
per c
entim
eter
at 2
5 de
gree
s Ce
lsiu
s Specific Conductance
6.0
6.5
7.0
7.5
8.0
8.5
9.0
12 13 5 10 1 15 14 4 3 2 9 6 11 8 7RI-
pH, i
n pH
uni
ts
pH
0
10
20
30
40
50
60
70
12 13 5 10 1 15 14 4 3 2 9 6 11 8 7RI-
Sulfa
te, i
n m
illig
ram
s pe
r lite
r
Deepest monitor well, as open well, in each cluster(suffixes not shown)
Deepest monitor well, as open well, in each cluster(suffixes not shown)
Sulfate
12 13 5 10 1 15 14 4 3 2 9 6 11 8 7RI-
Alkalinity
Figure 21. Specific conductance, acid neutralizing capacity as estimate of alkalinity, pH, and concentrations of dissolved oxygen, nitrate, and sulfate measured in the field in water samples from isolated zones in 15 deep monitor wells, North Penn Area 7 Superfund site, Upper Gwynedd Township and vicinity, Montgomery County, Pennsylvania, March 2004 through August 2005. Results are plotted in order of wells projected onto line parallel to dip.
Summary of Field Investigations of Groundwater System at North Penn Area 7 33
Volatile Organic Compounds and MetalsThe main contaminants identified in groundwater from
the three rounds of sampling are VOCs, of which TCE was the VOC most frequently detected and measured at the high-est concentrations [up to 650 µg/L in monitor well RI-11S (MG-2124)] (CDM Federal Programs Corporation, 2011). Other VOCs detected include, but are not limited to, PCE, cis-1,2-DCE, 1,1,1-TCA, 1,1-DCE, VC, CFC-11, and CFC-113. The highest VOC concentration measured from 2001 to 2006 was 1,700 µg/L for cis-1,2-DCE in one sample from well MG-1841 (SF-1) in 2001, although concentrations of cis-1,2-DCE were less than 330 µg/L for all other samples (CDM Fed-eral Programs Corporation, 2011). Arsenic, chromium, iron, lead, manganese, and mercury are the metals most frequently measured in concentrations greater than health-screening lev-els, as reported by CDM (2011). The occurrence and distribu-tion of VOCs and metals are described and discussed in detail in the RI report prepared by CDM (2011).
Selected Inorganic Constituents As part of the assessment of the spatial distribution of
contaminants in groundwater in wells at and near North Penn Area 7, water samples collected by CDM in fall 2005 (sec-ond round) and spring 2006 (third round) were also analyzed for one or more selected inorganic constituents, including chloride, boron, bromide, silica, and sulfate. These inorganic constituents were thought to be potentially useful in under-standing the groundwater-flow system and (or) determining potential contaminant sources and pathways. In addition, chloride and sulfate were analyzed to identify the ions causing the high specific conductance, determined through geophysi-cal logging of some wells, as concentrations of these anions commonly are elevated in water that has high specific con-ductance. Acid neutralizing capacity (ANC), a field measure that is approximately equivalent to alkalinity (and of the bicarbonate ion), was determined by USGS during packer tests during 2002–04 and, in general, was not found to differ much between wells, ranging mostly from about 130 to 200 mg/L as CaCO3 with and without high fluid conductance identified dur-ing logging. The exceptions are samples from well MG-2125 (RI-12), which had the highest ANC (alkalinity) values of up to 354 mg/L as CaCO3 (fig. 14). In fall 2005, samples from all reconstructed monitor wells were analyzed for chloride, silica, and sulfate. In spring 2006, samples were analyzed for chloride, boron, and bromide.
Evaluation of chloride, nitrate, and sulfate concentrations and other data not collected during the RI, such as hydrogen or ethane concentrations, may be helpful in understanding the extent of possible PCE or TCE degradation at North Penn Area 7. A detailed assessment of the potential for degradation of PCE and TCE is beyond the scope of this report.
Chloride
Chloride is a naturally occurring constituent in the environment but also can be artificially introduced by various
human activities. Once dissolved, chloride is a relatively conservative anion (not degraded, readily adsorbed, or pre-cipitated) and may be used as a tracer in groundwater and surface-water flow. At North Penn Area 7, chloride concentra-tions greater than natural background levels could originate from several sources. In urban and suburban areas, a com-mon source of chloride released on the land surface is road salt used for de-icing. Sodium chloride is the most common component of road salt, but other compounds, such as calcium chloride, are used. Chloride may also be released into ground-water as part of degradation processes of halogenated organic compounds, such as TCE.
Most chloride concentrations measured during fall 2005 and spring 2006 rounds of sampling by CDM at North Penn Area 7 did not differ much between sampling rounds and were within the range of 10 to 50 mg/L in about half of the samples, slightly to moderately elevated above natural background concentrations in southeastern Pennsylvania, estimated to be about 10 mg/L or less (Senior and other, 1997). Across the site at North Penn Area 7, chloride concentrations generally decreased with depth of water samples from monitor well clusters, indicating near-surface or surface sources of chloride (figs. 22, 23).
Samples from some monitor wells had substantially elevated chloride concentrations—greater than 100 mg/L to as high as 350 mg/L. The highest chloride concentrations were in samples from shallow- and intermediate-depth monitor wells [MG-2092 (RI-5S), MG-2091 (RI-5I), MG-2128 (RI-13S), MG-2127 (RI-13I), MG-2121 (RI-10S), MG-2120 (RI-10I)] west of Church Road on the former Zenith and adjacent-properties, one shallow monitor well [MG-2086 (RI-3S)] on the former Ford property (figs. 22 and 23), and two shallow open-hole wells (MG-1844, MG-1845) at an industrial facility along North Wales Road (fig. 22). Sources of the substantially elevated chloride concentrations in groundwater are unknown, but road salt is a likely source for wells near North Wales Road and a possible contributing source for the wells west of Church Road, as these latter wells are near parking lots. However, water from other wells near roads and parking lots elsewhere at North Penn Area 7 typically do not have such high chloride concentrations, suggesting an additional source of chloride for the wells west of Church Road.
SulfateSulfate concentrations were used to identify the source
of elevated specific conductance and to assess the poten-tial for, and extent of, anaerobic degradation of chlorinated solvents, such as TCE, in groundwater. Sulfate concentra-tions in samples collected from reconstructed monitor wells in North Penn Area 7 ranged from 10 to 68.6 mg/L, were between 20 and 35 mg/L in samples from most wells, gener-ally were not elevated above background levels estimated from regional studies (Sloto and Schreffler, 1994; Durlin and Schaffstall, 2000, p. 599), and showed no strong pattern in relation to depth or spatial distribution. The reported sulfate concentrations in the samples collected in fall 2005 confirmed
34 Groundwater System and Simulation of Flow for North Penn Area 7 Superfund Site, Montgomery County, Pennsylvania
B4
L5
B6
L7
B8 L9
75°16'30"75°17'75°17'30"
40°14'
40°13'30"
40°13'
Wissahick
on Creek
Geology from Berg and others (1980) with nomenclaturefrom Lyttle and Epstein (1987) and additional mapping and
lithologic classification from Smoot (unpublished)
Base from U.S. Geological SurveyLansdale 1983, 1:24,000Universal Transverse Mercator, zone 18North American Datum of 1927
A
A'
MG-202
RI-12D
RI-1D
RI-6 cluster
RI-3 cluster
RI-2 cluster
RI-14 cluster
RI-7 cluster
RI-11 cluster
RI-5 cluster
RI-13 clusterRI-15 cluster
Chur
ch R
oad
RI-10 cluster
RI-4 cluster
RI-8 cluster
RI-9 cluster
MG-1844
MG-1845
0 1,000 2,000 FEET500
0 300 600 METERS150
EXPLANATION
Lithology
Red beds predominant
Gray beds predominant
B4, B6, B8
L5, L7, L9
Bed code,this report
A A' Section line
11.7–25.025.1–50.050.1–75.075.1–100.0100.1–304.0
Chloride concentrations in groundwater samples (2006),in micrograms per liter
Shallow monitor
Intermediate monitor
Deep monitor
Open-hole existing well
Type of well—Label is well (MG-) or cluster (RI-) identifier
Nomenclature
Figure 22. Chloride concentrations in samples collected in spring 2006 from monitor well clusters and open-hole wells and line of section A–A’, North Penn Area 7 Superfund site, Upper Gwynedd Township and vicinity, Montgomery County, Pennsylvania. (Section A–A’ is shown in figure 23.)
Summary of Field Investigations of Groundwater System at North Penn Area 7 35
A A'
Land surface along transect
B8
L7
B6
L5
L9
Whole-well sample concentration
11–25
26–50
51–75
76–100
100–304
Chloride concentration in 2006 groundwater sample, in micrograms per liter
EXPLANATION
L7
MG-202L-22
Mapped geologic unit and bed code (see figure 6 for bed codes)
Land surface at well head. U.S. Geological Survey well identifer (MG-)and cluster number (RI-) or other identifier
Figure 23. Locations of monitor wells projected onto a line parallel to dip and chloride concentrations in samples collected from the monitor wells in spring 2006, North Penn Area 7 Superfund site, Upper Gwynedd Township and vicinity, Montgomery County, Pennsylvania. (See figure 22 for location of line of section.)
36 Groundwater System and Simulation of Flow for North Penn Area 7 Superfund Site, Montgomery County, Pennsylvania
concentrations previously estimated using a field spectro-photometer for analysis of samples from packer tests (Senior and others, 2008). The moderate sulfate concentrations and alkalinity indicate chloride is the main anion associated with high specific conductance measured in some wells at North Penn Area 7.
During anaerobic degradation under sulfate-reducing conditions of VOCs, sulfate concentrations may decrease and sulfide concentrations concurrently increase (Chapelle and Bradley, 1998), although sulfide may precipitate out of solution if iron is present (Kennedy and others, 1998). Sulfide concentrations measured in samples collected during packer tests using a field spectrophotometer were less than 0.06 mg/L (Senior and others, 2005; 2008); these low concentrations indicate some, but relatively little, reduction of sulfate and associated concurrent degradation of chlorinated solvents. At concentrations greater than 20 mg/L, sulfate may compete with the reductive pathway for degradation of VOCs (Wiede-meier and others, 1998). Heimann and others (2005) report that sulfate concentrations greater than 2.5 millimolar (mM) (or 240 mg/L) may limit microbial dechlorination of TCE and other chlorinated solvents. At North Penn Area 7, sulfate concentrations in groundwater were frequently in the range of 20 to 35 mg/L and as high as to 69 mg/L and, therefore, could be, but not necessarily are, limiting for anaerobic degradation of VOCs.
Many zones tested during packer tests at North Penn Area 7 (Senior and others, 2005; 2008) had low concentra-tions (less than 1 mg/L) of dissolved oxygen and nitrate, and a few had elevated concentrations (1 to 2 mg/L) of ferrous iron, consistent with reducing conditions that may be associ-ated with degradation of chlorinated ethenes. The detection of PCE and TCE degradation products in groundwater, such as cis-1,2-DCE across the site and VC detected at Spra-Fin property, indicate that degradation occurs in the areas sampled but that sulfate reduction does not appear to be a main part of the process.
Silica
Silica may accumulate in groundwater as a product of mineral weathering, and concentrations have sometimes been found to correlate with residence time (Burns and others, 2003). Silica concentrations in samples from the monitor well clusters ranged from about 14.7 to 26.4 mg/L and tended to be higher in samples from the shallow or intermediate well than from the deep well in each cluster (figs. 24, 25). This finding indicates the following possible explanation. Shallow ground-water follows different flow paths than deeper groundwater, and water reacts more extensively with minerals because of greater surface area and more reactive geochemical environ-ment in the shallow weathered zone and less extensively with minerals in fractures at depth. Also, groundwater may travel more slowly in the shallow weathered zone with relatively higher porosity than in fracture networks at depth. Some water at depth may be recharged relatively rapidly through
preferential paths, reducing transit time through the shallow weathered zone; however, variability in groundwater chemis-try (such as pH) and mineral composition of aquifer materials will affect, and may alternatively explain, the distribution of dissolved silica in groundwater. From limited analyses of the chemical data, it is unclear whether or not silica concentrations reflect residence time in the hydrogeologic setting at North Penn Area 7.
BoronBoron is a naturally occurring trace element that occurs
in elevated concentrations (up to about 5,000 µg/L) in min-eralized areas of the Newark Basin (Senior and Sloto, 2006), but natural background concentrations typically are less than 40 µg/L in non-mineralized areas. Elevated boron concentra-tions in groundwater of as much as 24,700 µg/L were found to be associated with the Salford Quarry site, located about 10 mi northwest of North Penn Area 7 and used by several industries including the former American Olean Tile of Lansdale for waste disposal (U.S. Environmental Protection Agency, 2010). Boron was selected for analysis as a possible indicator of industrial waste after broken waste tile from American Olean was observed in disturbed fill on the former Clearline property (between wells MG-174 and MG-1897, fig. 6) in North Penn Area 7.
Boron concentrations in water samples from wells at North Penn Area 7 ranged from less than 20 to 220 µg/L and were highest in the RI-6 well cluster and wells along the strike from that cluster (figs. 26, 27). Boron concentra-tions were greater than or about equal to 100 µg/L in water from five wells, four of which are along the strike in the same geologic unit, denoted as B8, [181 µg/L in well MG-2094 (RI-6S); 220 µg/L in well MG-2093 (RI-6D); 122 µg/L in well MG-2081 (RI-2D); and 94 µg/L in well MG-1541 (N5)] and one of which is in a separate unit, denoted as L7, [110 µg/L in well MG-2090 (RI-5D)] (figs. 26, 27). The highest boron con-centrations were near, but not at, wells on the former Clearline property (MG-174 and MG-1897), and thus, the data do not clearly support an association of elevated boron in ground-water with the occurrence of waste tile in disturbed soil. The source of slightly elevated boron concentrations in groundwa-ter (greater than the estimated background of about 40 µg/L) is unknown. The spatial distribution of the slightly elevated boron concentrations may be related to a natural occurrence in the geologic formation that follows geologic structure (bed-ding orientation) or may follow groundwater transport partly controlled by geologic structure from a natural or anthropo-genic source (such as one related to waste-disposal activities).
BromideBromide is a relatively soluble halide anion, like chlo-
ride. Chloride/bromide molar or mass ratios have been used to distinguish sources of salinity (Edmunds, 1996; Davis and others, 1998; Vengosh and Pankratov, 1998; Davis and others 2004) and were selected by USGS for analysis to possibly
Summary of Field Investigations of Groundwater System at North Penn Area 7 37
B4
L5
B6
L7
B8 L9
75°16'30"75°17'75°17'30"
40°14'
40°13'30"
40°13'
Wissahick
on Creek
Geology from Berg and others (1980) with nomenclaturefrom Lyttle and Epstein (1987) and additional mapping and
lithologic classification from Smoot (unpublished)
Base from U.S. Geological SurveyLansdale 1983, 1:24,000Universal Transverse Mercator, zone 18North American Datum of 1927
A
A'
MG-202
RI-12D
RI-1D
RI-6 cluster
RI-3 cluster
RI-2 cluster
RI-14 cluster
RI-7 cluster
RI-11 cluster
Clearline
RI-5 cluster
RI-13 clusterRI-15 cluster
Chur
ch R
oad
RI-10 cluster
RI-4 cluster
RI-8 cluster
RI-9 cluster
0 1,000 2,000 FEET500
0 300 600 METERS150
EXPLANATION
Lithology
Red beds predominant
Gray beds predominant
B4, B6, B8
L5, L7, L9
Bed code,this report
A A' Section line
14.7–16.016.1–18.018.1–20.020.1–22.022.1–25.2
Silica concentrations ingroundwater samples (2005),in micrograms per liter
Shallow monitor
Intermediate monitor
Deep monitor
Open-hole existing well
Type of well—Label is well (MG-) or cluster (RI-) identifier
Nomenclature
Figure 24. Silica concentrations in samples collected in fall 2005 from monitor well clusters and open-hole wells, and line of section A–A’, North Penn Area 7 Superfund site, Upper Gwynedd Township and vicinity, Montgomery County, Pennsylvania. (Section A–A’ is shown in figure 25.)
38 Groundwater System and Simulation of Flow for North Penn Area 7 Superfund Site, Montgomery County, Pennsylvania
A A'
Land surface along transect
B8
L7
B6
L5
L9
Whole-well sample concentration
No data
14–16
16.1–18
18.1–20
20.1–22
22.1–26
Silica concentration in 2005 groundwater sample, in micrograms per liter
EXPLANATION
L7
MG-202L-22
Mapped geologic unit and bed code (see figure 6 for bed codes)
Land surface at well head. U.S. Geological Survey well identifer (MG-)and cluster number (RI-) or other identifier
-300
-200
-100
0
100
200
300
400
500
0 1,000 2,000 3,000 4,000 5,000 6,000
Altit
ude,
in fe
et a
bove
NAV
D 88
Distance from origin of transect, in feet
MG-2128,2127,2126RI-13S,13I,13D
MG-2092,2091,2090RI-5S,5I,5D
MG-2080RI-1D
MG-2121,2120,2119RI-10S,10I,10D
MG-2134,2133,2132,2131RI-15S,15I,15D,15DD
MG-2130,2129RI-14I,14D
MG-2102,2101,2100RI-9S,9I,9D
MG-2083,2082,2081RI-2S,2I,2D
MG-202L-22 MG-2094,2093
RI-6S,6D
MG-2124,2123,2122RI-11S,11I,11D
MG-2096,175,2095RI-7S,7I,7D
MG-1897CL-3
MG-2125RI-12D
MG-2099,2098,2097RI-8S,8I,8D
MG-2089,2088,2087RI-4S,4I,4D
MG-2086,2085,2084RI-3S,3I,3D
Figure 25. Locations of monitor wells projected onto a line parallel to dip and silica concentrations in samples collected from the monitor wells in fall 2005, North Penn Area 7 Superfund site, Upper Gwynedd Township and vicinity, Montgomery County, Pennsylvania. (See figure 24 for line of section A–A’.)
Summary of Field Investigations of Groundwater System at North Penn Area 7 39
B4
L5
B6
L7
B8 L9
75°16'30"75°17'75°17'30"
40°14'
40°13'30"
40°13'
Wissahick
on Creek
Geology from Berg and others (1980) with nomenclaturefrom Lyttle and Epstein (1987) and additional mapping and
lithologic classification from Smoot (unpublished)
Base from U.S. Geological SurveyLansdale 1983, 1:24,000Universal Transverse Mercator, zone 18North American Datum of 1927
A
A'
MG-202
RI-12D
RI-1D
RI-6 cluster
RI-3 cluster
RI-2 cluster
RI-14 cluster
RI-7 cluster
RI-11 cluster
Clearline
RI-5 cluster
RI-13 clusterRI-15 cluster
Chur
ch R
oad
RI-10 cluster
RI-4 cluster
RI-8 cluster
RI-9 cluster
0 1,000 2,000 FEET500
0 300 600 METERS150
EXPLANATION
Lithology
Red beds predominant
Gray beds predominant
B4, B6, B8
L5, L7, L9
Bed code,this report
A A' Section line
0–2021–4041–6061–80
81–100101–150151–230
Boron concentrations ingroundwater samples (2006),in micrograms per liter
Shallow monitor
Intermediate monitor
Deep monitor
Open-hole existing well
Type of well—Label is well (MG-) or cluster (RI-) identifier
Nomenclature
Figure 26. Boron concentrations in samples collected in spring 2006 from monitor well clusters and open-hole wells, and line of section A–A’, North Penn Area 7 Superfund site, Upper Gwynedd Township and vicinity, Montgomery County, Pennsylvania.
40 Groundwater System and Simulation of Flow for North Penn Area 7 Superfund Site, Montgomery County, Pennsylvania
A A'
Land surface along transect
B8
L7
B6
L5
L9
Whole-well sample concentration
Less than 20
21–40
41–60
61–80
81–100
101–150
151–229
Boron concentration in 2006 groundwater sample, in micrograms per liter
EXPLANATION
L7
MG-202L-22
Mapped geologic unit and bed code (see figure 6 for bed codes)
Land surface at well head. U.S. Geological Survey well identifer (MG-)and cluster number (RI-) or other identifier
-300
-200
-100
0
100
200
300
400
500
0 1,000 2,000 3,000 4,000 5,000 6,000
Altit
ude,
in fe
et a
bove
NAV
D 88
Distance from origin of transect, in feet
MG-2128,2127,2126RI-13S,13I,13D
MG-2092,2091,2090RI-5S,5I,5D
MG-2080RI-1D
MG-2121,2120,2119RI-10S,10I,10D
MG-2134,2133,2132,2131RI-15S,15I,15D,15DD
MG-2130,2129RI-14I,14D
MG-2102,2101,2100RI-9S,9I,9D
MG-2083,2082,2081RI-2S,2I,2D
MG-202L-22 MG-2094,2093
RI-6S,6D
MG-2124,2123,2122RI-11S,11I,11D
MG-2096,175,2095RI-7S,7I,7D
MG-1897CL-3
MG-2125RI-12D
MG-2099,2098,2097RI-8S,8I,8D
MG-2089,2088,2087RI-4S,4I,4D
MG-2086,2085,2084RI-3S,3I,3D
Figure 27. Locations of monitor wells projected onto a line parallel to dip and boron concentrations in samples collected from the monitor wells in spring 2006, North Penn Area 7 Superfund site, Upper Gwynedd Township and vicinity, Montgomery County, Pennsylvania. (See figure 26 for location of line of section.)
Summary of Field Investigations of Groundwater System at North Penn Area 7 41
identify different sources of elevated chloride at North Penn Area 7. Davis and others (1998) state that chloride/bromide mass ratios generally range from 50 to 150 in atmospheric precipitation, from 100 to 200 in shallow ground water, from 300 to 600 in domestic sewage, from 1,000 to 10,000 in water affected by dissolution of halite, and from 10 to 100 in sum-mer runoff from urban streets.
In water samples collected from 70 wells at North Penn Area 7 in 2006, bromide concentrations were quantified in samples from 60 wells, ranging from 0.075 to 1.59 mg/L, and concentrations were less than detection levels in samples from 10 wells (less than 0.075 mg/L in samples from 8 wells and less than 0.1 mg/L in samples 2 wells). In samples that had bromide concentrations reported at greater than the detection level, the 2006 chloride/bromide mass ratios ranged from 144 to 1,386 in two main groups of samples—those in which the chloride/bromide mass ratios increased almost linearly in rela-tion to chloride concentrations and those in which chloride/bromide mass ratios were relatively constant and (or) were
independent of chloride concentration (fig. 28). The group for which the chloride/bromide mass ratios were independent of chloride concentration include shallow- and intermediate-depth monitor wells west of Church Road [MG-2092 (RI-5S), MG-2091 (RI-5I), MG-2121 (RI-10S), MG-2120 (RI-10I), MG-2128 (RI-13S), and MG-2127 (RI-13I)] and shallow open-hole wells along, but east of, Church Road at the Teleflex facility [MG-1149 (T-10), MG-1148 (T-12),] (figs. 28, 29). The spatial clustering of these wells indicates similar sources of chloride. Other groundwater samples with chloride/bro-mide mass ratios that appear relatively less strongly related to chloride concentrations were from several shallow wells at the Teleflex facility [MG-1146 (T-4), MG-1147 (T-11), MG-1842 (T-15), MG-1843 (T-6), and MG-2089 (RI-4S)], three nearby shallow wells [MG-2086 (RI-3S), MG-1847, and MG-2134 (RI-15S)], one well to the southwest of the RI-10 well cluster [MG-1537 (N1)], and two shallow wells east of Wissahickon Creek [MG-2099 (RI-8S) and MG-2102 (RI-9S) (figs. 28, 29). The spatial distribution of these other wells indicates (1) some
RI-13I
RI-10S
RI-10I and duplicate
RI-5I
RI-5S
RI-3S
RI-13S
RI-13D
RI-12D
RI-9S
RI-4SRI-3I
RI-11I
RI-15DRI-15I
RI-1D, RI-6D
RI-8I, RI-7IRI-14S
RI-14I
RI-2I
RI-9IRI-4D RI-7S
RI-10D
RI-3D
RI-8SRI-15S, RI-4I
T10
T12
T14
N5
T13
MG-1848
T15
N1T15 duplicate
MG-1847
T6
T4T11
N3
MG-1849
L-17
L-22
MG-1846
MG-1845
MG-1844
PT-2R-27
PT1R-18
R-21
SF-2
R-24
N19
Wells with high chloride concentrations and similar chloride/bromide mass ratios
EXPLANATION
RI-9I
RI-15I
East - monitor well in cluster and identifier
Mid - monitor well in cluster and identifier
West - monitor well in cluster and identifier
East - open well and identifier
Mid and west - open well and identifier
Location on North Penn Area 7 site, relative to Wissahickon Creek with Mid near but slightly west of Wissackon Creek, and type of well, defined as monitor if reconstructed with a short-screened interval and open if borehole is left open in competent rock—
T13
L-22
RI-13I
0
200
400
600
800
1,000
1,200
1,400
1,600
0 50 100 150 200 250 300 350
Chlo
ride/
brom
ide
mas
s ra
tio
Chloride, in milligrams per liter
Figure 28. Chloride/bromide mass ratio in relation to chloride concentration in water samples collected in March 2006 from monitor wells at and near North Penn Area 7 Superfund site, Upper Gwynedd Township and vicinity, Montgomery County, Pennsylvania. (See figure 29 for location of wells.)
42 Groundwater System and Simulation of Flow for North Penn Area 7 Superfund Site, Montgomery County, Pennsylvania
B4
L5
B6
L9B8
L7
Wiss
ahick
on C
reek
75°16'30"75°17'75°17'30"
40°14'
40°13'30"
40°13'
Towamencin Creek
0 1,000 2,000 FEET500
0 300 600 METERS150
Geology from Berg and others (1980) with nomenclaturefrom Lyttle and Epstein (1987) and additional mapping and
lithologic classification from Smoot (unpublished)
Base from U.S. Geological SurveyLansdale 1983, 1:24,000Universal Transverse Mercator, zone 18North American Datum of 1927
MG-1148 (T-12)
MG-1149 (T-10)
MG-1847
MG-1843 (T-6)
MG-1537 (N1)
MG-1541 (N5)
MG-1539 (N3)
MG-1553 (N19)
MG-2134 (RI-15S)
MG-2089 (RI-4S)
MG-2092 (RI-5S)MG-2091 (RI-5I)
MG-2121 (RI-10S)MG-2120 (RI-10I)
MG-2128 (RI-13S)MG-2127 (RI-13I)
MG-2099 (RI-8S)
MG-2102 (RI-9S)
MG-2086 (RI-3S)
MG-2080 (RI-1D)
MG-2125 (RI-12D)
MG-202 (L-22)
MG-76(L-17)
MG-1846
MG-1844MG-1845
MG-171 (PT-2)
MG-1848
MG-1849
MG-1144 (T-13)
MG-1146 (T-4)
MG-1145 (T-14)
MG-1841 (SF-2)
MG-1147 (T-11)
MG-1842 (T-15)
MG-1505 (R-18)
MG-174
MG-2130 (RI-14I)MG-2129 (RI-14D)
MG-2090 (RI-5D)
MG-2126 (RI-13D)
MG-2119 (RI-10D)
MG-2133 (RI-151)MG-2132 (RI-15D)MG-213! (RI-15DD)
MG-2088 (RI-4I)MG-2087 (RI-4D)
MG-2085 (RI-3I)MG-2084 (RI-3D)
MG-2083 (RI-2S)MG-2082 (RI-2I)MG-2081 (RI-2D)
MG-2096 (RI-7S)MG-175 (RI-7I)MG-2095 (RI-7D)
MG-2098 (RI-8I)MG-2097 (RI-8D)
MG-2101 (RI-9I)MG-2100 (RI-9D)
MG-204 (PT-1)
MG-1652 (R-27)
MG-204 (PT-1)
MG-691 (R-24)
MG-2124 (RI-11S)MG-2123 (RI-11I)MG-2122 (RI-11D)
MG-2094 (RI-6S)MG-2093 (RI-6D)
MG-1897
MG-1836
EXPLANATION
Lithology
Red beds predominant
Gray beds predominant
B4, B6, B8
L5, L7, L9
Bed code,this report
Chloride/bromide mass ratiosin groundwater samples (2006)
Shallow monitor
Intermediate monitor
Deep monitor
Open-hole existing well
Type of well—Label is well (MG-) or cluster (RI-) or other identifier
Nomenclature
Less than 0.1 or no data0.1–550550.1–700700.1–850850.1–1,390Shaded area shows selected wells
with high chloride concentrations and similar chloride/bromide mass ratios shown on figure 28.
Figure 29. Spatial distribution of chloride/bromide mass ratios in water collected in March 2006 from monitor and existing open-hole wells, at and near North Penn Area 7 Superfund site, Upper Gwynedd Township and vicinity, Montgomery County, Pennsylvania.
Simulation of Regional Groundwater Flow 43
mixing of chloride sources occurs at and near the Teleflex facility, (2) unique sources of chloride are near MG-2086 (RI-3S) and MG-2099 (RI-8S); and (3) groundwater flow is from shallow sources near the RI-5, RI-10, and RI-13 well clusters toward the southwest near well MG-1537 (N1). The remaining wells belong to the group for which chloride/bromide mass ratios increased almost linearly in relation to chloride concen-trations, likely reflecting the introduction of bromide-poor salt, such as road salt or halite (sodium chloride), to the groundwa-ter that has a natural background chloride/bromide mass ratio in the range of 100 to 150.
Inorganic Constituents as Tracers or Indicator of LithologyThe 2005 and 2006 water samples from discrete isolated
zones represented by the monitor well clusters at North Penn Area 7 showed that silica concentrations generally decreased with depth, indicating the presence of mechanisms for rapid recharge and (or) more reactive surfaces in shallower materi-als. Differences in silica concentrations across the site may be attributable to lithology to some extent, concentrations being higher overall in one of the predominantly red beds.
Like silica, chloride concentrations generally were higher in shallow zones. Chloride concentrations greater than the esti-mated natural background of about 10 mg/L were measured in most deep zones, indicating transport of recharge affected by surface applications of chloride (such as road salt or septic systems) to depths. The presence of chloride from surface sources may be used as a tracer and (or) surrogate for organic compounds or other constituents at the surface. Chloride/bromide mass ratios indicate that sources of chloride in water from wells west of and along Church Road appear to differ from sources at other locations at North Penn Area 7 and prob-ably include substances other than road salt.
Elevated boron concentrations (greater than 100 µg/L and up to 220 µg/L in RI-6D cluster) may be associated with flow paths from a source area or be associated with the lithology of beds that occur along Wissahickon Creek. The spatial distribu-tion of boron concentrations in well-water samples appears to be related to the geologic structure, with the highest concen-trations measured in samples from wells completed in units L7 and B8 (fig. 27), although it is unknown whether controls on the distribution are lithologic or hydrologic.
Simulation of Regional Groundwater Flow
A model using numerical simulation of regional ground-water flow at North Penn Area 7 was developed to (1) esti-mate regional-scale aquifer properties to better understand and describe the groundwater system and (2) provide a tool to estimate directions of groundwater flow (and contaminants transported in groundwater) under various historical and pre-dictive scenarios.
Estimation of Regional-Scale Aquifer Hydraulic Properties
Hydraulic conductivity and storage are aquifer proper-ties that may vary spatially because of geologic heterogeneity. Transmissivity, the hydraulic conductivity multiplied by the saturated thickness of the aquifer, represents a vertical average of hydraulic conductivities that may vary with depth. Estima-tion of these properties allows a quantitative prediction of the hydraulic response of the aquifer to recharge, pumping, and other hydrologic changes. Storage coefficients are important for understanding hydraulic response to transient stresses on aquifers. These properties can be estimated on a local scale by analysis of data from aquifer tests, such as single-well or mul-tiple-well aquifer tests or on a regional scale by a numerical simulation of groundwater flow by use of a computer-based model. The local scale ranges from tens of feet to hundreds of feet. The regional scale is characterized by lengths of hundreds to thousands of feet.
Most of the analytical techniques used to estimate the hydraulic properties of aquifers were developed for porous media, such as unconsolidated sediments. These techniques may provide reasonable estimates of hydraulic properties in fractured rocks when the hydraulic response of the fractured-rock aquifers approximates porous media at the scale of interest. Previous application of this approach near the North Penn Area 7 Superfund site by Senior and Goode (1999) demonstrates that regional groundwater-flow properties can be estimated using porous media methods.
The regional-scale groundwater-flow model for North Penn Area 7 and vicinity described in this report assumes steady-state conditions and, therefore, can be used to esti-mate regional-scale hydraulic conductivities but not storage properties. Once hydraulic properties have been estimated, groundwater flow (and inferred advective transport of con-taminants in groundwater) may be simulated to help describe and determine effects of pumping on the spatial distribution of contaminants in groundwater.
In the following section describing the model, both metric units and inch/pound units are given for convenience. Metric units were used for model input and output. However, all data used to construct and calibrate the model, except elevations from the digital elevation model (DEM), originally were collected, and in some cases presented elsewhere in this and previous reports, in inch/pound units.
Numerical Simulation of Regional Groundwater Flow
A three-dimensional finite-difference numerical model, MODFLOW-2000 (Harbaugh and others, 2000), was used to simulate regional steady-state flow. Model data were prepared using the Argus-ONE preprocessor (Agrus Interware, 1997) with a customized interface for preparing input files for and displaying model results from MODFLOW (Winston, 2000).
44 Groundwater System and Simulation of Flow for North Penn Area 7 Superfund Site, Montgomery County, Pennsylvania
The model was calibrated using automatic, nonlinear regres-sion-based parameter estimation (optimization) and sensitivity algorithms incorporated in MODFLOW-2000 (Hill and others, 2000). Model parameters were adjusted to reduce the model error, which was computed from the differences between measured and simulated water levels and streamflow. MOD-PATH (Pollock, 1994) was used to calculate groundwater-flow paths and to plot the groundwater-flow paths on maps. S-Plus statistical software (Insightful Corporation, 2008) was used for Monte Carlo simulation using procedures developed by Starn and others (2010). ArcGIS (ESRI, 2006) was used to prepare maps of simulation results.
Conceptual ModelThe model structure is based on a simplified conceptu-
alization of the groundwater-flow system as understood from field investigations at North Penn Area 7 and previous studies. The weathered and fractured-rock formations are modeled as equivalent porous media, such as unconsolidated granu-lar deposits. Thus, it is assumed that groundwater flow can be described using a three-dimensional flow equation based on Darcy’s Law. In this approach, the hydraulic conductivi-ties used in the model represent the bulk properties of the fractured-rock formations. Water flux, which may pass through only a small fraction of the rock mass occupied by fractures, is simulated as if it were distributed throughout all parts of the formations.
The regional-scale model presented here incorporates the effect of bed-oriented anisotropy, with generally lower hydraulic conductivity perpendicular to beds, by modeling the dipping stratigraphic beds (such as shown in fig. 15) with dip-ping model layers, as described by Goode and Senior (2000). Anisotropy refers to a dependence of hydraulic conductiv-ity on direction. In contrast, under isotropic conditions, the hydraulic conductivity does not depend on direction. On the basis of field testing described in the previous section, the vertical hydraulic conductivity that is normal to the plane of bedding or “cross bed” is expected to be less than the subhori-zontal hydraulic conductivity, which is oriented in the bedding plane. In addition, subhorizontal hydraulic conductivity anisot-ropy with different hydraulic conductivities in the dip and strike directions was incorporated for some parts of the model. As shown by Senior and Goode (1999), use of horizontal anisotropy approximates some features of groundwater flow in dipping sedimentary formations. The entire thickness of rock represented by each model layer is assumed to be saturated. This approximation means that the transmissivity, the product of the hydraulic conductivity and the saturated thickness, of the top model layer is assumed to be independent of the com-puted hydraulic head. In fact, the transmissivity of the shallow weathered zone is proportional to the saturated thickness of this unit. However, the model results are relatively insensitive to minor changes in the transmissivity of the weathered zone because most flow is in the deeper parts of the groundwater system. Where not affected by pumping, the depth to water in
wells in the study area typically was less than 15 meters (m; 50 ft) and was less than 9 m (30 ft) in about half of the wells measured in August 1996 (Senior and others, 1998).
As used here, MODFLOW-2000 calculates optimum values of model parameters, such as recharge rate and hydrau-lic conductivity, for a particular model structure on the basis of overall differences between simulated and observed water levels and streamflow. The model structure includes all quan-titative information that establishes the functional relation between model parameters and simulated water levels and streamflow. Although properties of model cells can be speci-fied individually, the approach used here was to group cells with similar properties into zones with uniform parameters. This approach significantly reduced the number of model parameters and improved the reliability of parameter esti-mates, although it generally reduced the model fit (Hill and Tiedeman, 2007). Zones, in this case primarily model lay-ers, were delineated on the basis of hydrogeologic informa-tion, namely the regional bedrock geology as mapped at land surface, and the estimated regional dip angles for the rock formations. During model calibration, further grouping of model layers which are expected on the basis of hydrogeo-logic information to be similar and which are less sensitive to the observations, reduced the number of separate parameters. In addition, some model parameters that are shown to be very insensitive to the observations were removed from the automatic optimization for final calibration and sensitivity calculations. Thus, although the model in general calculates the optimum parameter values for each simulation, significant hydrogeologic judgment was used during the model construc-tion and calibration to guide and control the calibration
Model Structure and Boundary ConditionsThe model grid is aligned parallel to the regional strike
of the dipping sedimentary beds (45 degrees NE) and corre-sponds to the assumed major axis of anisotropy of horizontal hydraulic conductivity (figs. 3 and 30). The assumed minor axis of anisotropy, therefore, is oriented generally in the dip direction. Cell dimensions of the horizontal model grid are 100 m × 100 m (328 ft × 328 ft). Lateral boundaries of the model are defined as zero-flux (no flow) cells that include streams (discharge boundaries) and topographic divides that are assumed to be groundwater divides (fig. 30). Definition of the lateral boundaries is based, in part, on maps of water levels in the area (Senior and others, 1998; Senior and Ruddy, 2004).
The altitude of the top surface of the model is derived from 30-m digital-elevation-model (DEM) data with 30-m (100-ft) grid spacing. The top of the model is defined as a constant flux boundary, where the flux into the model domain equals the recharge rate. The top two hydrogeologic units are conceptualized as a soil or colluvium unit and a highly weathered rock unit. These units have uniform thicknesses of 6 m (19.7 ft).
Beneath the subhorizontal soil and highly weathered rock units, the regional-scale model has a vertical structure
Simulation of Regional Groundwater Flow 45
75°15' 75°20'
40°15'
40°10'
0 1 2 KILOMETERS
0 1 2 MILES
Base from U.S. Geological SurveyReading, Pennsylvania-New Jersey 1984, 1:100,000
EXPLANATION
Selected cells of model—
Stream in layer 1 andpumping well in underlying layer
Pumping well
Stream
Model boundary
Boundary of North Penn Area 7 for model water budget Discharge to stream
Figure 30. Model boundary, streams cells, and pumped well cells for model of North Penn Area 7 Superfund site, Upper Gwynedd Township and vicinity, Montgomery County, Pennsylvania.
46 Groundwater System and Simulation of Flow for North Penn Area 7 Superfund Site, Montgomery County, Pennsylvania
that mimics the dipping stratigraphy of the geologic units, as defined by geologic mapping in the area and by correla-tions between borehole logs (Senior and others, 2008). The model preprocessor computes appropriate layer elevations and thicknesses and assigns the corresponding model parameters. The geologic structure is simulated using contours of eleva-tion on the top of the uppermost (to the NW) dipping bed, B4, corresponding to model layer 4 (table 3). The contour lines were digitized from the surface geology map of Smoot (Joseph P. Smoot, written communication, 2006). Starting from the contact contour of the top of bed B4, which is at the elevation of the land surface, the assumed regional dip of 10 degrees to the NW was used to extrapolate the elevation of the top of bed B4 throughout the model domain, updip and downdip from the contact contour. Note that in updip areas parts or all of this bed have been eroded. Approximate bed thicknesses were calcu-lated geometrically for each bed from the geologic-contact contour horizontal spacings. These thicknesses were used to compute the structural contour elevations for the top of the each bed.
Using the depth of the weathered zone and the assumed lower boundary of the model, the model layers representing
the beds are truncated at the top and bottom (figs. 31, 32). The upper truncation occurs where each bed represented by a model layer subcrops below the subhorizontal highly weath-ered rock layer or 12 m (39.4 ft) below the land surface. At this interface, truncated bedrock layers are assigned a thick-ness of 0.01 m (0.033 ft), and the hydraulic properties are those of the overlying highly weathered rock layer. In areas where model layers representing beds are truncated near the surface, the thickness of the overlying highly weathered rock unit is thus slightly increased, but the increase does not significantly affect the estimation of aquifer properties or regional flow results. The lower truncation is at the bot-tom of the model, 200 m (656 ft) beneath the bottom of the highly weathered rock layer, or 212 m (695 ft) below the land surface. Model cells truncated at the bottom are inactive cells and are not included in the simulation. The bottom layer of the model is defined as a no-flow boundary.
In summary, the model structure is similar to the regional-scale model of Senior and Goode (1999) but with dipping model layers to represent mapped dipping sedimen-tary units. Computations of model layer top and bottom eleva-tions and specification of model cell properties are performed
Table 3. Hydrostratigraphy used in the groundwater model for North Penn Area 7 Superfund site, Upper Gwynedd Township and vicinity, Montgomery County, Pennsylvania.
1Lyttle and Epstein, 1987.2Joseph Smoot, U.S. Geological Survey, unpublished mapping, 2005.3Thickness used in model for layers 3–11 depends on location with respect to dipping beds. Maximum stratigraphic thickness of layer listed. Total thickness
of layers 3–11 is limited to 200 m.4Hydraulic conductivity in the dip direction divided by the value in the strike direction.5Hydraulic conductivity in the strike direction divided by the value in the vertical direction.
Simulation of Regional Groundwater Flow 47
12
4
3
56
11109
87
Model grid cell containing a pumped well
NORTHWEST
SOUTHEAST
EXPLANATION
VERTICAL EXAGGERATION x 1.0
0 1,000 METERS
0 5,000 FEET
VERTICAL EXAGGERATION x 10.0
0 1,000 METERS
0 5,000 FEET
Model grid layer number1
Figure 31. Cross section in the dip direction of model grid for North Penn Area 7 Superfund site, Upper Gwynedd Township and vicinity, Montgomery County, Pennsylvania. (See figure 33 for location of lines of section.)
EXPLANATION
12
4
3
5
6
11 10
9
87
Model grid cell containing a pumped well
SOUTHWESTNORTHEAST7
VERTICAL EXAGGERATION x 1.0
VERTICAL EXAGGERATION x 10.0
0 1,000 METERS
0 5,000 FEET
0 1,000 METERS
0 5,000 FEET
Model grid layer number1
Figure 32. Cross section in the strike direction of model grid for North Penn Area 7 Superfund site, Upper Gwynedd Township and vicinity, Montgomery County, Pennsylvania. (See figure 33 for lines of section.)
48 Groundwater System and Simulation of Flow for North Penn Area 7 Superfund Site, Montgomery County, Pennsylvania
by a preprocessor using a programmed geographic information system (GIS) (Winston, 2000). This approach yields dip-ping model layers whose geometry conforms to the mapped geologic units in the study area (fig. 33) and are pinched out where these beds have been eroded or subcrop within the weathered zone.
This model is constructed to simulate regional features of groundwater flow in the study area and is not designed to sim-ulate features of groundwater flow observed during local-scale testing. In contrast to the model of Goode and Senior (2000), in which thin dipping layers a couple of meters thick represent individual bed-oriented flow features, the present model has dipping layers that represent larger hydyrostratigraphic units
and do not represent individual high-transmissivity zones. The thinnest model layer (representing fractured-bedrock units) used here is 47 m thick, whereas field testing indicates that high-transmissivity features in boreholes are generally less than 1 m thick.
Calibration MethodsThe numerical model is calibrated by use of parameter-
estimation components of MODFLOW-2000 (Hill and others, 2000) that minimize model error through a linearized gradient method. During parameter estimation, an iterative procedure is used to adjust aquifer hydraulic properties in the model
Contours of altitude of top ofbed B4 (projected), in metersafter map of Smoot (unpublished).Interval is variable.
-385
-190
080
16330
3
360
434
667
714 926
1138
Contacts of surficialoutcrop of bed B10,after map of Smoot (unpublished)
Thickness of model layer 10, representing bed B10:color scale 0 to 50 meters in 5-meter increments(uncolored less than 0.1 meter)
Thickness of model layer
10, representing bed B10
Locations of cross sections
Northwest
Northeast
Southeast
Southwest
Figure 33. Model preprocessor showing structural contours for top of bed B4 (projected), layer 10 thickness for the model, and lines of section, North Penn Area 7 Superfund site, Upper Gwynedd Township and vicinity, Montgomery County, Pennsylvania. Cross sections for depicted section lines shown on figure 31.
Simulation of Regional Groundwater Flow 49
in such a way as to minimize an overall model error. Model error is defined as the sum of squared, weighted residuals, where residuals are the differences between measured and simulated hydraulic head (water level) and streamflow. These residuals are weighted to account for differences in units, for example between units of meters for water-level measure-ments and units of cubic meters per day (m3/d) for streamflow. The weight for all water-level measurements is 1.0 (in units of 1/m), and the weight for all streamflow residuals is 0.058 [in units of days per cubic meter (d/m3)] (Senior and Goode, 1999, p. 76).
The model was calibrated using measured groundwater levels (317 values), measured streamflows (10 values), and specified pumping rates for three time periods. The calibra-tion procedure computes the total model error as the sum of the errors for each simulation period and uses a consistent set of hydraulic parameters for all simulations. The time periods used for model calibration were August 1996 (Senior and others, 1998; Senior & Goode, 1999), December 2000 (Senior and Ruddy, 2004), and June 2005 (Senior and oth-ers, 2008). Although water levels fluctuate seasonally and typically are lowest in late summer/early fall and highest in spring, the pattern of rainfall prior to each set of synoptic measurements evened out the differences related to seasonal timing of measurements. The regional groundwater levels in each set of synoptic measurements were near long-term (30-year) annual averages (fig. 19). Compared to the long-term (30-year) precipitation normals, the hydrologic conditions during these periods were relatively wet prior to August 1996 and near the long-term average prior to December 2000 and June 2005 (Senior and others, 2008). During calibration, the recharge during the three time periods (1996, 2000, and 2005) was specified as three independent model parameters. The conductivity of the streambed, which controls the head gradi-ent between the aquifer and the stream, provided the stream is flowing, was an estimated model parameter.
External procedures were used to guide and control the parameter estimation process. During initial calibration, several model parameters were identified that were rela-tively insensitive to the observations. That is, large changes in the model parameter value had relatively small effects on the overall model error. For example, the limited observa-tions (14 monitor well clusters) of the vertical head gradient limits the sensitivity of the model error to vertical anisotropy. Hydrogeologic judgment was used to remove such parameters from the automatic calibration. In several cases, initial calibra-tions were used to identify a model parameter value that was reasonable on the basis of hydrogeologic judgment and field observations and that yielded a low model error. Subsequently, these parameter values were fixed and removed from the calibration process. Parameters estimated using this procedure also were not used in Monte Carlo simulations. The estimates of these parameters are considered to have high uncertainty.
Final parameter values were estimated using a combina-tion of manual and automatic optimization procedures. Auto-matic calibration successfully reduced the overall model error
by adjusting parameters from their initial values. However, near the optimum, the gradient search method failed to con-verge. There may be several aspects of this particular applica-tion that cause this, including numerous and sometimes poorly constrained parameters and nonlinear behavior of the ground-water-flow model and optimization. Separate optimizations were conducted with many different sets of parameters fixed, and in some cases, all but one parameter was fixed. However, even in this case the overall model error increased during the automatic calibration when starting close to the optimum value. The final parameter values presented here were eventu-ally identified by picking, by hand, the model parameter set that produced the lowest overall model error from among the trials conducted near the optimum. Although these values are not guaranteed to be the absolute optimum parameter values possible, the parameter values identified are considered close enough to the true optimum to be used for reasonably accurate simulation. This uncertainty is considered acceptable given the other uncertainties in the model. It may be possible to use alterative optimization procedures beyond the gradient search method that may yield slightly different optimum parameter values, but the application presented here is limited to the procedures in MODFLOW-2000 (Hill and others, 2000).
Recharge and DischargeThe components of the water budget for the saturated
zone that are included in the model are (1) uniform recharge to the water table, (2) discharge to pumped wells, and (3) discharge to, and infiltration from, streams. The steady-state assumption implies that these fluxes are in equilibrium and that hydraulic head is not changing in time. In reality, these fluxes, particularly pumping rates and recharge, are chang-ing in time, and hydraulic head changes in response to these fluctuations. The steady-state model corresponds to the average flow conditions for the time period of interest and approximates the average fluxes and hydraulic head during that period. Thus, the steady-state model does not and cannot simulate instantaneous flow conditions.
Recharge to the saturated zone is assumed to be spatially uniform because detailed spatial information on factors affect-ing infiltration is not available for the study area. On average, recharge to the water table is precipitation minus surface run-off and evapotranspiration. Areal recharge enters through the top model layer, and the magnitude of recharge is determined from calibration. An average, the annual recharge rate of 210.8 millimeters per year (mm/yr; 8.3 inches per year (in/yr)) estimated by Senior and Goode (1999) for the Lansdale area, was used as an initial estimate in this model. Recharge was not varied spatially according to differences in land use or topog-raphy. Three separate parameters were used for the recharge in 1996, 2000, and 2005, named Rech1996, Rech2000, and Rech2005, respectively.
Streams are simulated in the model by use of the stream package (Prudic, 1989) as modified for MODFLOW–2000. Streams are in the shallow top layer of the model, and the
50 Groundwater System and Simulation of Flow for North Penn Area 7 Superfund Site, Montgomery County, Pennsylvania
aquifer discharges to the stream if the hydraulic head in a model cell is higher than the hydraulic head of the stream in that cell. The stream package allows simulated streams to gain or lose water and accounts for the flow in each stream cell so that losses cannot exceed the simulated base flow of the stream. Land-surface elevations from the 10-m digital elevation model (DEM) were interpolated to points along each stream. Stream stage was assigned an altitude 1 m lower than the interpolated land-surface elevation. The thickness of the streambed was assumed to be 2 m (6.6 ft). Stream width was assumed to be 3 m (9.8 ft). The location of streams in the model domain and interpolated land-surface elevation at streams are shown in figure 34. The uniform
streambed conductivity parameter (STR) was estimated during calibration.
Values for aquifer discharge to streams are derived from 25 measurements of base flow made at five locations from May 1995 through November 1996 (Senior and Goode, 1999, table 4) and from measurements made at several locations on Wissahickon Creek from June 2000 to September 2005 (Senior and others, 2005, table 65; Senior and others, 2008, tables 74 and 75) (fig. 20). Base-flow measurements used to estimate groundwater discharge to the stream at various time periods of the simulation were available at several streams for the 1996 calibration period but only at Wissahickon Creek for the 2000 and 2005 calibration period (table 4). Comparison of
SW-17 01473806
SW-21
01473808
01473809
SW-3
SW-10 Land-surface altitude, color scale 40 to 140 metersin 10-meter increments
Figure 34. Model preprocessor showing locations of streamflow measurements, land-surface elevations at streams, and locations of pumped wells for the numerical model for North Penn Area 7 Superfund site, Upper Gwynedd Township and vicinity, Montgomery County, Pennsylvania.
Simulation of Regional Groundwater Flow 51
measured and simulated streamflow for 1996, 2000, and 2005 simulation periods is shown in table 4, which lists the mea-sured and simulated incremental change in streamflow, that is the net discharge from the aquifer to the stream (gain) or flow from the stream to the aquifer (loss) for a given stream reach. Measured streamflows were relatively well-simulated by the model in 1996 for streams other than Wissahickon Creek. Residuals (simulated-measured) for Wissahickon Creek in all calibration periods (1996, 2000, and 2005) were larger than those in 1996 for other streams (table 4).
Groundwater withdrawals from wells are represented by a constant flux of water removed from the model using the multi-node well (MNW) package in MODFLOW–2000. Withdrawals from each well are computed for all model lay-ers representing beds to which the well is open. An iterative procedure ensures that the sum of the layer fluxes for a given well is equal to the well pumping rate, within a user-specified tolerance. Locations of pumped wells used in model simula-tions are shown in figure 34. Well information and pumping rates for calibration periods are shown in table 5.
The pumping rates used in the model represent annual average rates (Pennsylvania Department of Environmental Protection, State Water Plan Division, written commun., 1995), except for some NPWA wells (table 5). NPWA wells were assigned the average pumping rate for the month of interest, if monthly data were available.
Measured and Simulated Water Levels in Wells
A total of 317 measured water levels in 215 wells within the model domain were available for three different time periods (table 6, at end of report). The periods used for model calibration are August 1996 (Senior and others, 1998; Senior and Goode, 1999), December 2000 (Senior and Ruddy, 2004), and June 2005 (Senior and others, 2008). Water-level data consist of one measurement per well for each period. The water-level data were distributed over a larger area for the 1996 calibration (139 wells) than for the 2000 calibration (95 wells) and the 2005 calibration (84 wells); data for the 2000 and 2005 calibration periods were spatially centered on North Penn Area 7 and vicinity. A simultaneous calibra-tion was performed using steady-state models for each of the periods. On the basis of specified altitudes of the top and bot-tom of the open interval of each well, the model preprocessor determined the corresponding model layers for each well and, if needed, thickness-proportional layer weights. In the latter case, the measured water level was compared to a weighted vertical average of the simulated water levels in the model layers that intersect the open interval of the well.
Maps of simulated water-table altitudes (water levels in top layer of model representing the weathered zone) are shown for the three calibration periods, 1996, 2000, and 2005 (fig. 35). The simulated water-table contours are similar to potentiometric-surface maps prepared from measured water levels in wells completed at various depths (Senior
and Goode, 1999; Senior and Ruddy, 2004; Senior and others, 2008).
Groundwater-level residuals (simulated water level minus the measured water level) for wells with measurements also are shown on these maps for the three calibration periods, 1996, 2000, and 2005 (fig. 35). The root mean square residu-als for the 1996, 2000, and 2005 calibration periods are 5.53, 4.86, and 4.54 m (18.1, 16.0 and 14.9 ft), respectively. The residuals show that many simulated groundwater levels are close in value to measured levels and indicate that there are some clusters of over-simulated and under-simulated ground-water levels. The groundwater levels at several locations in the northern part of the modeled area are under-simulated for 1996 by the model (fig. 35). This northern area is far from the contamination in the North Penn Area 7 and is modeled as a single hydrogeologic unit of the Brunswick Group, after Senior and Goode (1999). Additional effort to add heterogene-ity and parameters in this part of the model was not attempted in the present study but could be attempted in future model applications to reduce model error for that area. Simulated water levels for several wells in the vicinity of the Merck facility are too high by more than 5 m (16.4 ft) for all three time periods and too low by more than 5 m (16.4 ft) for 2005, which may be due to higher or lower than average pumping rates, respectively, at the time of the water-level measure-ment. In addition, the local-scale heterogeneity that has been observed during aquifer tests at the Merck facility (Goode and Senior, 1998) and in Lansdale (Goode and Senior, 2000) was not incorporated in the present regional-scale model.
The relation of simulated groundwater levels to measured groundwater levels indicates that the groundwater-flow model generally captures the regional characteristics of groundwater flow (fig. 36). The overall root-mean-square water-level resid-ual is 5.02 m (16.5 ft) for the three calibration periods, which is small in comparison to the range of measured water level altitudes as great as 115 m (377 ft). However, the residuals at individual wells range from -21.6 m (-70.8 ft) to +16.7 m (+54.8 ft), indicating that the simulation error at individual well locations may be large. Residuals (or model errors) are among the largest for water levels in wells affected by pump-ing, such as those at the Merck facility or in the RI-2 and RI-9 well clusters, indicating that, locally, the model sometimes did not closely simulate the observed vertical gradient determined using measured water levels in well clusters. The direction, but not the magnitude, of the vertical gradients generally were correctly simulated in the areas affected by pumping. This result is due, in part, to two factors—(1) inaccurate pumping rates, annual or monthly average pumping rates were used in the steady-state simulation, but measured water levels reflect possibly different daily or hourly rates and (2) the model struc-ture in which occasionally more than one well in a cluster, each with its own water level, may be in the same model cell, making accurate simulation of water levels impossible. For example, in 2005, the measured water levels were about 10 m (33 ft) lower in the intermediate well [MG-2101 (RI-9I)] than the deep well [MG-2100 (RI-9D)] of the RI-9 cluster because
52 Groundwater System and Simulation of Flow for North Penn Area 7 Superfund Site, Montgomery County, PennsylvaniaTa
ble
4.
Mea
sure
d an
d si
mul
ated
gro
undw
ater
dis
char
ge to
stre
am re
ache
s fo
r the
cal
ibra
ted
num
eric
al m
odel
of g
roun
dwat
er fl
ow in
the
Nor
th P
enn
Area
7 S
uper
fund
site
, Up
per G
wyn
edd
Tow
nshi
p an
d vi
cini
ty, M
ontg
omer
y Co
unty
, Pen
nsyl
vani
a.
[See
figu
re 3
4 fo
r loc
atio
n of
stre
am-m
easu
rem
ent s
ites.
USG
S, U
.S. G
eolo
gica
l Sur
vey;
m3 /d
, cub
ic m
eter
s per
day
; m, m
eter
s]
USG
S st
atio
n nu
mbe
rSi
te n
umbe
rSt
ream
site
loca
tion
Mea
sure
men
t dat
esM
odel
ca
libra
tion
year
Bas
e-flo
w
mea
sure
men
t ty
pe1
Gro
undw
ater
dis
char
ge to
str
eam
reac
h en
ding
at
mea
sure
men
t site
(m3 /d
)W
eigh
ted
resi
dual
4M
easu
red
gain
or
loss
2
Sim
ulat
ed
gain
or
loss
2
Resi
dual
(s
imul
ated
m
inus
m
easu
red)
Nor
mal
ized
re
sidu
al3
Stre
ams
othe
r tha
n W
issa
hick
on C
reek
SW-2
1Tr
ibut
ary
to T
owam
enci
n C
reek
at
Trox
ell R
d.M
ay 1
995–
Nov
embe
r 199
619
96Es
timat
ed fr
om 5
m
easu
rem
ents
245
333
87.7
0.3
5.08
SW-3
Trib
utar
y to
W. B
ranc
h N
esha
min
y C
reek
at C
owpa
th R
d ne
ar K
ulp
Rd
May
199
5–N
ovem
ber 1
997
1996
Estim
ated
from
5
mea
sure
men
ts-8
32-7
2310
90.
146.
35
SW-1
0Tr
ibut
ary
to W
. Bra
nch
Nes
ham
iny
Cre
ek n
ear L
ine
& C
owpa
th R
dM
ay 1
995–
Nov
embe
r 199
819
96Es
timat
ed fr
om 5
m
easu
rem
ents
00
00
0
SW-1
7To
wam
enci
n C
reek
at S
umne
ytow
n Pi
keM
ay 1
995–
Nov
embe
r 200
019
96Es
timat
ed fr
om 5
m
easu
rem
ents
685
817
132
0.18
7.66
Wis
sahi
ckon
Cre
ek01
4738
06
(and
014
7380
8)SW
-13
(a
nd S
W-1
3A)
Wis
sahi
ckon
Cre
ek a
t Han
cock
St.
(and
at W
issa
hick
on A
ve.)
May
199
5–N
ovem
ber 1
999
1996
Estim
ated
from
5
mea
sure
men
ts5
9831
-67
-1.0
4-3
.89
0147
3806
Wis
sahi
ckon
Cre
ek a
t Han
cock
St.
June
200
3–Se
ptem
ber 2
005
2005
Estim
ated
from
7
mea
sure
men
ts0
131
131
27.
58
0147
3808
W
issa
hick
on C
reek
at W
issa
hick
on
Ave.
Dec
embe
r 11,
200
020
001
mea
sure
men
t51
.80
-51.
8-2
-3
0147
3808
W
issa
hick
on C
reek
at W
issa
hick
on
Ave.
Dec
embe
r 200
2–Se
ptem
ber 2
005
2005
Estim
ated
from
9
mea
sure
men
ts0
-15.
4-1
5.4
-2-0
.9
0147
3809
W
issa
hick
on C
reek
at S
umne
ytow
n Pi
keD
ecem
ber 1
1, 2
000
2000
1 m
easu
rem
ent
-95.
4-4
3.6
51.8
0.75
3
0147
3809
W
issa
hick
on C
reek
at S
umne
ytow
n Pi
keD
ecem
ber 2
002–
Sept
embe
r 200
620
05Es
timat
ed fr
om 9
m
easu
rem
ents
-43.
6-2
4.5
19.1
0.56
1.11
1 Mea
sure
men
ts fr
om S
enio
r and
Goo
de (1
999)
and
Sen
ior a
nd o
ther
s (20
07).
2 (+) i
ndic
ates
gai
n of
gro
undw
ater
dis
char
ge to
stre
am; (
-) in
dica
tes s
tream
loss
to g
roun
dwat
er.
3 Cal
cula
ted
as re
sidu
al/[|
(mea
sure
d+si
mul
ated
)|/2]
.4 A
ll st
ream
flow
resi
dual
s are
wei
ghte
d by
0.0
58 (d
ay /
m3 )
and
thus
are
dim
ensi
onle
ss.
5 Firs
t tw
o m
easu
rem
ents
wer
e at
site
014
7380
6 an
d re
mai
nder
wer
e at
014
7380
8.
Simulation of Regional Groundwater Flow 53
Table 5. Pumping well identification, locations and pumping rates for North Penn Area 7 Superfund site, Upper Gwynedd Township and vicinity, Montgomery County, Pennsylvania.—Continued
[USGS, U.S. Geological Survey; NGVD 29, National Geodetic Vertical Datum of 1929; m3/d, cubic meters per day; gal/min, gallons per minute]
54 Groundwater System and Simulation of Flow for North Penn Area 7 Superfund Site, Montgomery County, Pennsylvania
Table 5. Pumping well identification, locations and pumping rates for North Penn Area 7 Superfund site, Upper Gwynedd Township and vicinity, Montgomery County, Pennsylvania.—Continued
[USGS, U.S. Geological Survey; NGVD 29, National Geodetic Vertical Datum of 1929; m3/d, cubic meters per day; gal/min, gallons per minute]
Special cases—wells on model border were assigned half pumping rates
924 NP-21 70.1 -67.1 5 57.3 0.0 0.0 0.0 312.3 0.0 0.0 0.021014 H-10 73.8 -1.5 9 148.1 90.7 129.3 0.0 807.3 494.4 704.8 0.01486 Baum’ Meat 91.1 28.0 3 2.3 2.3 0.0 0.0 12.5 12.5 0.0 0.01MG- prefix omitted.2MG-1014 (H-10) was artificially moved so that the well is inside the model grid.
Simulation of Regional Groundwater Flow 55
EXPL
AN
ATIO
N
Mod
el d
omai
n bo
unda
ry
Stre
am -21.
58 –
-5.0
0
-4.9
9 –
-1.0
0
-0.9
9 –
1.00
1.01
– 5
.00
5.01
– 1
0.01
Sim
ulat
ed w
ater
-tab
le
cont
our.
Cont
our
inte
rval
is 5
met
ers
Obs
erva
tion/
mon
itor w
ell
show
ing
sim
ulat
ed w
ater
le
vel m
inus
mea
sure
d w
ater
leve
l, in
met
ers
60
45
60
A.
1996
6560
55
50
8085
9010
010
511
0
45
115
120
110115
120125
155150
145
75
80
70
80
85
9095
105
105
8080
85
95
9590
8580
70
75
9085
100
130
135
140
80
70
125 120130
110
75°1
5'75
°20'
40°1
5'
40°1
0'
01
2 M
ILES
01
2 KI
LOM
ETER
S
Base
from
Pen
nsyl
vani
a De
partm
ent o
f Tra
nspo
rtatio
nM
ajor
Riv
ers,
199
5Un
iver
sal T
rans
vers
e M
erca
tor,
zone
18
Nor
th A
mer
ican
Dat
um o
f 192
7
Figu
re 3
5.
Sim
ulat
ed w
ater
-tabl
e al
titud
es a
nd lo
catio
n of
obs
erva
tion
wel
ls s
how
ing
sim
ulat
ed w
ater
leve
ls m
inus
mea
sure
d w
ater
leve
ls in
A, 1
996,
B, 2
000,
an
d C,
200
5 fo
r the
mod
el fo
r Nor
th P
enn
Area
7 S
uper
fund
site
, Upp
er G
wyn
edd
Tow
nshi
p an
d vi
cini
ty, M
ontg
omer
y Co
unty
, Pen
nsyl
vani
a.
56 Groundwater System and Simulation of Flow for North Penn Area 7 Superfund Site, Montgomery County, Pennsylvania
EXPL
AN
ATIO
N
Mod
el d
omai
n bo
unda
ry
Stre
am -18.
48 –
-5.0
0
-4.9
9 –
-1.0
0
-0.9
9 –
1.00
1.01
– 5
.00
5.01
– 1
6.49
Sim
ulat
ed w
ater
-tab
le
cont
our.
Cont
our
inte
rval
is 5
met
ers
Obs
erva
tion/
mon
itor w
ell
show
ing
sim
ulat
ed w
ater
le
vel m
inus
mea
sure
d w
ater
leve
l, in
met
ers
60
B.
2000
80
70
45
110
6560
55
50
75
80
70
80
80 8590
100
105
110
110115
120
125
130
145140
85
9095
100
45
90
8580
7570
135
125 120 130
115
90
85
95
9580
7575°1
5'75
°20'
40°1
5'
40°1
0'
Base
from
Pen
nsyl
vani
a De
partm
ent o
f Tra
nspo
rtatio
nM
ajor
Riv
ers,
199
5Un
iver
sal T
rans
vers
e M
erca
tor,
zone
18
Nor
th A
mer
ican
Dat
um o
f 192
7
01
2 M
ILES
01
2 KI
LOM
ETER
S
Figu
re 3
5.
Sim
ulat
ed w
ater
-tabl
e al
titud
es a
nd lo
catio
n of
obs
erva
tion
wel
ls s
how
ing
sim
ulat
ed w
ater
leve
ls m
inus
mea
sure
d w
ater
leve
ls in
A, 1
996,
B, 2
000,
an
d C,
200
5 fo
r the
mod
el fo
r Nor
th P
enn
Area
7 S
uper
fund
site
, Upp
er G
wyn
edd
Tow
nshi
p an
d vi
cini
ty, M
ontg
omer
y Co
unty
, Pen
nsyl
vani
a.—
Cont
inue
d
Simulation of Regional Groundwater Flow 57
EXPL
AN
ATIO
N
Mod
el d
omai
n bo
unda
ry
Stre
am -10.
55 –
-5.0
0
-4.9
9 –
-1.0
0
-0.9
9 –
1.00
1.01
– 5
.00
5.01
– 1
1.73
Sim
ulat
ed w
ater
-tab
le
cont
our.
Cont
our
inte
rval
is 5
met
ers
Obs
erva
tion/
mon
itor w
ell
show
ing
sim
ulat
ed w
ater
le
vel m
inus
mea
sure
d w
ater
leve
l, in
met
ers
60
C. 2
005
80
70
110
6560
55
50
75
80
70
80 8590
100
105
110
110
115
120125
135
150145
85
9095
100
90
8580
7570
140
130 125130
115
9085
95
9580
7575°1
5'75
°20'
40°1
5'
40°1
0'
130Ba
se fr
om P
enns
ylva
nia
Depa
rtmen
t of T
rans
porta
tion
Maj
or R
iver
s, 1
995
Univ
ersa
l Tra
nsve
rse
Mer
cato
r, zo
ne 1
8N
orth
Am
eric
an D
atum
of 1
927
01
2 M
ILES
01
2 KI
LOM
ETER
S
Figu
re 3
5.
Sim
ulat
ed w
ater
-tabl
e al
titud
es a
nd lo
catio
n of
obs
erva
tion
wel
ls s
how
ing
sim
ulat
ed w
ater
leve
ls m
inus
mea
sure
d w
ater
leve
ls in
A, 1
996,
B, 2
000,
an
d C,
200
5 fo
r the
mod
el fo
r Nor
th P
enn
Area
7 S
uper
fund
site
, Upp
er G
wyn
edd
Tow
nshi
p an
d vi
cini
ty, M
ontg
omer
y Co
unty
, Pen
nsyl
vani
a.—
Cont
inue
d
58 Groundwater System and Simulation of Flow for North Penn Area 7 Superfund Site, Montgomery County, Pennsylvania
of nearby pumping (Senior, 2008, table 78), but the structure of the model placed the intermediate and deep well in the same model cell. Residuals for 2005 measurements in and near the North Penn Area 7 Superfund site range from -10.5 m (-34.4 ft) to +11.7 m (+38.4 ft), but except for selected wells in the RI-2 and RI-9 clusters, the residuals are smaller within the boundary of North Penn Area 7, ranging from -3.9 m (-13.0 ft) to 4.1 m (+13.4 ft). Two of the three wells in the RI-2 and RI-9 clusters are affected by pumping, resulting in large vertical gradients not well simulated by the model, and residuals in these clusters range from -0.9 to 9.8 m (-3.0 to 32 ft). The highly heterogeneous fractured-rock aquifer is simulated only approximately by this regional-scale model; however, it is judged that the model accuracy is adequate for simulation of overall regional patterns in groundwater flow and for simula-tion of flow paths at the regional scale.
Estimated Aquifer Hydraulic Properties and Recharge Rates
The hydraulic properties and other features of the groundwater-flow system were represented by parameters of the calibrated numerical model (table 7) that were determined by parameter estimation, a process in which the parameters are adjusted until the simulated water levels and groundwater discharge to streams reasonably match the measured water levels and groundwater discharge to streams. In this way, the numerical model mimics features of the real groundwater-system, as characterized by the measurements, and the model parameters are considered estimates of the regional-scale hydraulic properties of the groundwater-flow system. As described above, model parameters were assigned by layers, and further grouped during calibration. Some trial parameters, such as vertical anisotropy ratios for individual layers, could not be estimated because the parameter value had no effect on the model error. Some of these parameters were assumed to be equal to other similar parameters, such as the vertical anisot-ropy of another layer in this example. Even with this reduced set, some parameters could not be estimated by the automatic algorithm and were manually adjusted, as discussed in previ-ous sections.
The top two layers of the model are assumed to be isotropic in all cases because extensive fracture features are less likely to be important in highly weathered rock and saprolite and because preliminary model evaluation indicated the simulated water levels in underlying layers, where water levels have been measured, are not sensitive to the anisotropy of model layers 1 and 2. The model parameter describing the horizontal anisotropy is designated HANI for layers 3 and 11, and HANIBED for layers 4 to 10. Model layers 3 and 11 represent bulk properties of the various beds to the northwest (layer 3) and southeast (layer 11), whereas layers 4 to 10 are dipping layers representing individual mapped hydrostrati-graphic units. The parameter is the hydraulic conductivity in the dip direction (northwest direction in model) divided by
Figure 36. Relation of measured groundwater-level altitudes to groundwater-level altitudes simulated by the numerical model for North Penn Area 7 Superfund site, Upper Gwynedd Township and vicinity, Montgomery County, Pennsylvania.
the hydraulic conductivity in the strike direction (northeast direction in model) (or HANI = Kdip/Kstrike). In aniso tropic cases, the hydraulic conductivity parameters listed in table 7 for model layers 3 to 11 are the hydraulic conductivities in the strike direction; therefore, for example, the Brunswick Group parameter KB = KBstrike, and the Lockatong Forma-tion parameter KL = KLstrike. The hydraulic conductivity in the dip direction is the value in the strike direction multiplied by HANI.
The vertical anisotropy is parameterized in a similar, but different, manner in MODFLOW-2000. The vertical anisot-ropy parameter, designated VANI, is the ratio of the vertical hydraulic conductivity to the hydraulic conductivity in the strike direction; VANI = Kstrike/Kvertical. Thus, to compute the vertical hydraulic conductivity, the hydraulic conductivity in the strike direction is divided by the ratio VANI.
Other model parameters include the vertical hydraulic conductivity of streambeds, STR, which controls the con-ductance between layer 1 of the model and the stream. The simplified approach here is to assume that all streams have uniform width (3 m) and uniform streambed thickness (2 m) and that the hydraulic conductivity of the streambed is also uniform. Another model parameter estimated by calibration is the uniform recharge rate, designated RECH, which is speci-fied separately for the three different calibration time periods (table 7).
The optimum parameter values and approximate indi-vidual 95-percent confidence intervals are shown in table 7.
Simulation of Regional Groundwater Flow 59Ta
ble
7.
Optim
um a
nd a
ppro
xim
ate,
indi
vidu
al, 9
5-pe
rcen
t con
fiden
ce-in
terv
al v
alue
s fo
r par
amet
ers
estim
ated
thro
ugh
calib
ratio
n of
the
grou
ndw
ater
-flow
mod
el fo
r Nor
th
Penn
Are
a 7
Supe
rfund
site
, Upp
er G
wyn
edd
Tow
nshi
p an
d vi
cini
ty, M
ontg
omer
y Co
unty
, Pen
nsyl
vani
a.
[m/d
, met
ers p
er d
ay; m
m/y
r, m
illim
eter
s per
yea
r; ft/
d, fe
et p
er d
ay; i
n./y
r, in
ches
per
yea
r]
Laye
rsPa
ram
eter
Met
ric
units
Engl
ish
units
Uni
tsO
ptim
um
valu
e
App
roxi
mat
e, in
divi
dual
, 95
-per
cent
con
fiden
ce in
terv
alU
nits
Opt
imum
va
lue
App
roxi
mat
e, in
divi
dual
, 95
-per
cent
con
fiden
ce in
terv
al
Low
erU
pper
Low
erU
pper
Hydr
aulic
con
duct
ivity
Wea
ther
ed ro
ck a
nd o
verb
urde
n1,
2K
Wm
/d0.
162
0.09
50.
275
ft/d
0.53
10.
313
0.90
2B
runs
wic
k G
roup
(non
-del
taic
)3
KB
m/d
1.67
31.
492
1.87
6ft/
d5.
487
4.89
46.
153
Lock
aton
g Fo
rmat
ion
(non
-del
taic
)11
KL
m/d
0.04
0R
ed b
eds p
redo
min
ant
4, 6
KB
46m
/d0.
004
Gra
y be
ds p
redo
min
ant
5K
L5m
/d0.
791
0.43
61.
435
ft/d
2.59
41.
429
4.70
7G
ray
beds
pre
dom
inan
t7
KL7
m/d
0.25
00.
088
0.70
6ft/
d0.
820
0.29
02.
317
Red
bed
s pre
dom
inan
t8
KB
8m
/d1.
135
0.75
31.
710
ft/d
3.72
32.
471
5.61
0G
ray
beds
pre
dom
inan
t9
KL9
m/d
0.42
60.
233
0.77
7ft/
d1.
397
0.76
62.
549
Red
bed
s pre
dom
inan
t10
KB
10m
/d0.
001
Stre
ambe
dSt
ream
cells
in
1ST
Rm
/d30
.033
29.8
1130
.257
ft/d
98.5
3397
.805
99.2
68
Horiz
onta
l ani
sotro
py
Bru
nsw
ick
& L
ocka
tong
3, 1
1H
AN
I(-
)0.
319
0.15
90.
643
Del
taic
bed
s4–
10H
AN
IBED
(-)
0.11
70.
088
0.15
5Ve
rtica
l ani
sotro
py
Bru
nsw
ick
& L
ocka
tong
3, 1
1VA
NI
(-)
1D
elta
ic b
eds
4, 5
, 6, 9
, 10
VAN
IBED
(-)
1G
ray
beds
pre
dom
inan
t7
VAN
I7(-
)48
.3R
ed b
eds p
redo
min
ant
8VA
NI8
(-)
478.
5Re
char
ge
1996
1R
ECH
1m
/d4.
061E
-43.
80E-
44.
42E-
4D
ec-0
01
REC
H2
m/d
2.99
0E-4
2.85
E-4
3.12
E-4
Jun-
051
REC
H3
m/d
3.39
5E-4
3.17
E-4
3.64
E-4
1996
1R
ECH
1m
m/y
r14
8in
./yr
5.8
5.5
6.4
Dec
-00
1R
ECH
2m
m/y
r10
9in
./yr
4.3
4.1
4.5
Jun-
051
REC
H3
mm
/yr
124
in./y
r4.
94.
65.
2
60 Groundwater System and Simulation of Flow for North Penn Area 7 Superfund Site, Montgomery County, Pennsylvania
All but the top two model layers representing weathered rock/saprolite are anisotropic with respect to subhorizontal hydrau-lic conductivity. The optimum value for hydraulic conductivity listed in table 7 for model layers 3–10, representing dipping bedrock units, is subhorizontal and in the strike direction. In the set of optimum parameters, the ratio of minimum (dip direction) to maximum (strike direction) subhorizontal hydrau-lic conductivity ranges from 1/3.1 to 1/8.6 (horizontal anisot-ropy of 0.319 to 0.117). The ratio of vertical to horizontal hydraulic conductivity ranges from 1/1 (manually set during calibration for some model layers) to the optimized value of 1/478 (table 7).
The optimum parameter values yield the minimum model error for the model structure, boundary conditions, and observations used. The approximate confidence intervals are estimated from a linear statistical model with the calibrated model and assumed error variances of the observations (Hill and Tiedeman, 2007). Confidence intervals are shown only for parameters that are included in the final calibration. Model adjustments focused on parameters that, when changed, caused the greatest proportional change in simulated water levels and flow, which are indicated by their composite scaled sensitivities (fig. 37). The composite scaled sensitivity is the rate of change in the parameter-estimation optimization objec-tive function for incremental changes in the parameter value, normalized by the optimum parameter value. Thus, the overall model error changes the most for (proportional) changes in parameters with the highest composite scaled sensitivities (Hill and others, 2000; Hill and Tiedeman, 2007). Changes to the values of parameters that have low composite scaled sensitivity will cause small changes in the model error. Com-pared to other parameters, the vertical hydraulic conductivity model parameters are less constrained by the measured water levels, which are relatively well distributed in horizontal space but less well distributed in vertical space and thus, provide less information about vertical head gradients to constrain the model than they do about horizontal gradients. Values for which confidence intervals are not shown in table 7 are to be considered more uncertain. During calibration, the optimiza-tion process tended to yield values for vertical anisotropy (VANI) that were less than 1 for some beds; however, values of VANI less than 1 are not consistent with the low hydraulic connections across beds observed during local-scale packer tests. The model, as structured, was not sensitive to changes in values for the parameter VANI, and therefore, the estimated value of 1 was set for the parameter VANI for beds 3 to 6 and 9 to 11 (table 7) to minimize model error and maintain some consistency with observed hydraulic properties of the aquifer.
Estimated hydraulic conductivity is comparable to previ-ous estimates made using aquifer-test results and regional flow models. Senior and Goode (1999) estimated hydraulic conductivities of the weathered zone (0.05 m/d or 0.16 ft/d), Lockatong Formation (0.34 m/d or 1.1 ft/d in strike), and the Brunswick Group (1.6 m/d or 5.2 ft/d in strike) by calibra-tion of a steady-state regional-scale model that included the current model area west of Wissahickon Creek using water
Automatic calibration
Manual calibration
Type of parameter calibration EXPLANATION
10 3
10 2
101
10 0
10 -1
10 -2
Com
posi
te s
cale
d se
nsiti
vity
STR
RECH
2
RECH
1
KB8
KB
RECH
3
VAN
I8
KL5
KL9
KW KL7
HAN
I
HAN
IBED KL
VAN
I
VAN
I7
VAN
IBED
KB46
KB10
Model parameter
Figure 37. Sensitivity of model calibration to model parameters for groundwater-flow simulation of North Penn Area 7 Superfund site and vicinity, Upper Gwynedd Township and vicinity, Montgomery County, Pennsylvania. (Model parameters are described in table 7.)
levels during 1996. The optimum hydraulic conductivity for the weathered zone (KW) is 0.16 m/d (0.53 ft/d), about 3 times higher than the results from Senior and Goode (1999). The optimum hydraulic conductivities for the (non-deltaic) Lockatong Formation (KL) and Brunswick Group (KB) for the present study are 0.040 and 1.67 m/d (0.13 and 5.5 ft/d) in strike, respectively. For the present study, the area for which the bulk Lockatong Formation hydraulic conductivity (KL) was estimated is to the south and east of the area considered by Senior and Goode (1999) and is an area for which few water-level measurements are available. The predominantly gray beds farthest north in the present model have an optimum hydraulic conductivity (KL5) of 0.79 m/d (2.6 ft/d) in strike, which is slightly larger than the Lockatong Formation value estimated by Senior and Goode (1999) for rocks in the same geographic location. Hydraulic conductivities estimated using the numerical groundwater-flow model are within the range of those estimated from results of the packer tests for isolated aquifer intervals at North Penn Area 7 (Senior and others, 2008). Estimates of bulk hydraulic conductivties from packer tests calculated by dividing the total transmissivity of water-bearing zones by the total open interval of the geologic unit intersected by a borehole ranged from about 0.03 to 8.0 m/d (0.1 to 26.4 ft/d). Mean and median values of hydraulic con-ductivity for discrete aquifer intervals determined in packer tests of individual isolated zones in geologic units ranged from 1.7 to 5.6 m/d (5.7 to 18.4 ft/d) and 0.9 to 1.6 m/d (3.0 to 5.1 ft/d), respectively (fig. 13B). However, hydraulic conduc-tivities estimated from local-scale packer tests do not appear to differ as much by geologic unit as those regional values estimated from the numerical groundwater-flow model.
Recharge rates estimated for the three simulation periods range from 109 to 148 mm/yr (4.3 to 5.9 in/yr) in 2000 and 1996, respectively (table 7). The higher recharge values corre-spond to general features of the water levels in the study area:
Simulation of Regional Groundwater Flow 61
compared to the long-term average, water levels were similar or slightly higher in 1996 and slightly lower in December 2000 and June 2005 (fig. 19). The assumption of steady-state flow also has some effect on the estimated recharge values (Halford, 1999). The natural flow system is not at steady state for any of the time periods because of variations in time of recharge, pumping rates, and evapotranspiration. Halford (1999) found that the long-term average recharge rate was bracketed by “effective” recharge rates determined from the calibration of steady-state flow models using synoptic water levels and streamflow. In the present case, the variability of the effective recharge rate is enhanced by the low storage of the fractured-rock aquifer system. The range of recharge rates estimated in this study is similar to but about 25 percent smaller than the value of 208 mm/yr (8.2 in/yr) estimated from a different steady-state regional-flow model calibration for 1996 conditions (Senior and Goode, 1999) for a model area that included a portion of current model area west of Wissa-hickon Creek (see North Penn Area 6 model boundary, fig. 3). The lower value identified here may reflect that the geology underlying the current model is less dominated by the Bruns-wick Group and more affected by properties of the Lockatong Formation. The Lockatong Formation generally has lower per-meability and, hence, may have less recharge. A single value of recharge is assumed to be representative of the entire model area for this study. Recharge rates may be estimated from, and compared to, stream base flow. White and Sloto (1990) used 1959 to 1972 streamflow records for two streams overlying Triassic sedimentary rocks in southeastern Pennsylvania and estimated average annual base flows of 148 and 201 mm/yr (5.8 and 7.9 in/yr).
The water budgets are different for each calibration period of the North Penn Area 7 model (table 8). Withdraw als from and recharge to the entire modeled area vary similarly, with highest rates in 1996 and lowest rates in 2000. Local withdrawals in the immediate vicinity of North Penn Area 7 (area shown by dashed boundary in figure 30) change in a similar manner.
Regional Groundwater-Flow Paths
The groundwater-flow model can be used to evaluate groundwater-flow paths under different hydrologic conditions and recharge/discharge relations. Groundwater-flow paths were simulated under conditions representative of differ-ent periods when industries using water or those identified as probable contaminant source areas were and (or) still are active in the vicinity of North Penn Area 7. The changes in hydrologic conditions considered in this report are (1) changes in pumping rates at wells and (2) changes in recharge rates, during calibration periods. For hydrologic conditions in 1990, the average of the recharge values determined for the three calibration periods (1996, 2000, and 2005), 128 mm/yr (5.0 in./yr), is used.
Table 8. Simulated water budgets for calibration periods 1996, 2000, and 2005 for model area and North Penn Area 7 Superfund site, Upper Gwynedd Township and vicinity, Montgomery County, Pennsylvania. Area for water-budget calculation delineated by North Penn Area 7 boundary as shown in figure 30.
[m3/d, cubic meters per day]
UnitsSimulation period
1996 2000 2005
Entire model
Inflows
Recharge m3/d 41,642 30,256 34,508Stream loss m3/d 2,361 2,904 2,863
Outflows
Withdrawal by pumping wells m3/d 11,743 9,207 9,991Stream gain m3/d 32,259 23,953 27,380
Withdrawal by pumping wells m3/d 693 468 658Stream gain m3/d 107 0 31Ground-water outflow m3/d 1,836 1,729 2,289
The model was used to evaluate groundwater-flow paths and areas contributing recharge to wells under several steady-state scenarios corresponding to historic and current hydrologic conditions of recharge and withdrawals in 1990, 1996, 2000, and 2005. Results from historic groundwater-flow path simulations were compared to selected measured constituent concentrations in water samples from monitor and pumped wells that may be used to infer possible contaminant migration pathways.
Simulated Flow Paths, Contributing Areas, and Uncertainty
Model simulations were conducted under steady-state conditions to estimate groundwater-flow paths and contribut-ing areas. Steady-state simulations give results that represent the average position of groundwater-flow paths and contribut-ing areas on the basis of the values of average groundwater recharge and withdrawals assigned to the model. Changes caused by seasonal variations in recharge or operational vari-ability of withdrawals were not simulated.
62 Groundwater System and Simulation of Flow for North Penn Area 7 Superfund Site, Montgomery County, Pennsylvania
A probabilistic method is used to approximate uncer-tainty in simulated regional groundwater-flow paths because of model hydraulic-parameter uncertainty (Starn and others, 2010). Deterministic groundwater-flow paths are simulated using the optimal calibrated values for all model parameters. However, these parameters are not exactly known. The amount of uncertainty in parameter values is estimated during the automatic calibration procedure, and these results can be car-ried through the groundwater-flow path simulation to produce probabilistic groundwater-flow paths. A Monte Carlo proce-dure developed by Starn and others (2010) is used in which 1,000 realizations of different parameter sets are produced, based on the probabilistic model of the parameters and their uncertainty. This method incorporates the individual parameter uncertainty and the correlation between estimated parameters. This method was recently applied by Lindsey (2005) to a carbonate fractured-rock aquifer in Pennsylvania.
Although recharge values for 1996, 2000, and 2005, and their respective estimation variances, were estimated, these parameters are considered exactly known for the analysis here. Thus, this analysis illustrates the uncertainty that is due to selected hydraulic properties alone. A variance/covariance matrix for this uncertainty analysis is generated by the sensi-tivity calculations with all model parameters at their respective optimal values and with the recharge values considered known and removed from the sensitivity calculation. The resulting variance/covariance of the selected hydraulic parameters alone (table 9) is used to generate realizations of model parameters that sample the assumed lognormal parameter distribution and that preserve the estimated covariances between param-eters. Many assumptions underlie the probabilistic theory for this method (Neupauer and Wilson, 2004; Starn and others, 2010), and this model may not meet all those assumptions.
For example, only 1,000 realizations were simulated for each case, and more realizations may be necessary to accu-rately represent low-frequency features. Nonetheless, this systematic approach does allow illustration of the effect that uncertainty in the model-selected hydraulic parameters has on model predictions, in this case regional groundwater-flow paths (Starn and others, 2010).
Groundwater-flow paths are presented on areal maps showing both deterministic and probabilistic results. The deterministic results are obtained by simulating groundwater-flow paths using the optimal parameter values identified during calibration. Deterministic groundwater-flow paths from probable contaminant sources in North Penn Area 7 are shown as gray dashed lines (for example, see figure 38 farther on in this report). Contributing areas for the pumped production well MG-202 (L-22) (fig. 4) are shown as black dots indicating model cells from which recharge flows to the pumped well (for example, see figure 39 farther on in this report).
For probabilistic results, model cell color indicates frequency, which is expressed as a fraction ranging from 0 to 1.0. For contributing areas of water for pumped well MG-202 (L-22), the colors correspond to the frequency of simulations for which recharge from the indicated model cell at the top of the saturated zone flowed to the pumped well. For example, if 800 of the 1,000 simulations resulted in flow to the pumped well from a particular cell, then that cell would be the color corresponding to a frequency of 0.8. For the groundwater-flow-path simulations, the color map indicates the frequency at which particles from source locations flowed through the area covered by the model cell. This result is vertically integrated in that groundwater-flow paths through the cell area are counted regardless of which vertical model layer the
Table 9. Correlation and variance/covariance matrices for generation of probabilistic parameters.
[Correlations are in shaded part of table. Both matrices are symmetric, so the upper or lower diagonal of either matrix is the transpose of the part of the matrix shown. Correlations of parameters with themselves are equal to 1.0 and are not shown. The logarithm of the parameter value is used in the regression for all parameters. These covariances and correlations are for the parameters in the regression space]
groundwater-flow path occurs in. For example, if 400 of the 1,000 simulations resulted in at least one groundwater-flow path from any of the sources passing through any layer at a model cell location, then that color of the cell corresponds to a frequency of 0.4.
In general, the probabilistic groundwater-flow-path results resemble a diffuse cloud around the deterministic groundwater-flow paths. Simulations of contributing area to a pumped well have high frequencies in the middle of the deterministic contributing area and close to the pumped well. Frequencies are lower at greater distances from the pumped well and at the edges of the contributing area. Similar features occur for groundwater-flow-path results where frequencies are high near source locations; however, the features may occur far from the source location near large pumped wells as a result of the convergence of groundwater-flow paths near the large well or well field.
In the following sections, deterministic groundwater-flow paths and contributing areas simulated using optimal model parameters are discussed for each period. Uncertainty associated with flow paths estimated using the Monte Carlo method is shown in figures with results of the deterministic simulations for each time period but is not discussed at length. In general, probabilistic groundwater-flow paths simulated using uncertain model parameters (Monte Carlo method) pass through similar, but expanded, areas around deterministic flow paths simulated using optimal model parameters.
Groundwater-Flow Paths in 1990
Groundwater withdrawals in the study area were rela-tively high in 1990, and more wells in the vicinity of North Penn Area 7 were pumped for industrial and public supply than in subsequent periods. Using optimal model parameters, simulated deterministic groundwater-flow paths from contami-nant sources in North Penn Area 7 ultimately reach local wells at the industrial facilities, with the exception of groundwater-flow paths from the source at Leeds & Northrup and some of the groundwater-flow paths from the source at Spra-Fin, which discharge to wells such as well MG-130 at the Merck facility immediately southwest of North Penn Area 7 (fig. 38). Proba-bilistic simulations also show most groundwater-flow paths extend from contaminant sources towards local pumped wells in the vicinity of North Penn Area 7. Simulated deterministic groundwater-flow paths from sources at the Zenith, Teleflex, and Ford facilities discharge to pumped wells at Ford. The frequencies of probabilistic groundwater-flow paths extending from contaminant sources to areas at and near Ford are higher than 0.75. Simulated groundwater-flow paths from the source at Spra-Fin travel beneath the upper Wissahickon Creek and discharge to industrial wells at other properties in the vicinity of North Penn Area 7, including pumped wells at Ford and well MG-130 at Merck. Groundwater flow from the source
at the Rogers facility (a named contaminant source in NPL site North Penn Area 6) is generally southwest, away from North Penn Area 7, towards pumped production wells MG-59, MG-566, and MG-140. Some probabilistic simulations result in groundwater-flow paths extending east from the Rogers facility to nearby pumped wells MG-66 and MG-71, although the frequencies are less than 0.25.
The production well MG-202 (L-22) does not capture any groundwater-flow paths from identified contaminant sources at North Penn Area 7 in the deterministic simulation using opti-mal model parameters (fig. 38). For the probabilistic simula-tions, the frequency of groundwater-flow paths extending from contaminant sources to areas near well MG-202 ranges from 0.05 to 0.25.
Modeled contaminant source locations do not appear likely to be in the contributing area of recharge flowing to well MG-202 under conditions in 1990 (fig. 39). The fre-quency of probabilistic simulations for which recharge from modeled contaminant source cells flows to MG-202 is less than 0.05. The deterministic simulated contributing area for water pumped from MG-202 is east of the pumped well. For probabilistic simulations, the frequency of recharge flowpaths discharging to well MG-202 (L-22) decreases with distance away from the well to the east. Under simulated steady-state conditions, some water flowing to the well is recharged beyond the contributing area for nearby well MG-76 (L-17). The contributing area for well MG-76 (L-17) is surrounded by areas that contribute flow to MG-202 (L-22).
The complex shape of the contributing area to MG-202 (L-22) is caused by the juxtaposition of contributing areas of other nearby wells and the complex groundwater/surface-water interaction in the headwaters of the Wissahickon Creek. In addition to capturing groundwater recharge through the aquifer, well MG-202 (L-22) also captures flow from the Wis-sahickon Creek. This flow originates as recharge to groundwa-ter near the stream, discharges to the stream, and then returns to the aquifer near well MG-202 (L-22). Thus, both groundwa-ter and surface water contribute flow to this well. Contaminant sources in areas that discharge to Wissahickon Creek could be sources of contamination to well MG-202 (L-22), pro-vided that the discharge to the stream occurs upstream from the area where the stream loses water to the aquifer near well MG-202 (L-22).
Although the deterministic groundwater-flow paths indicate that a thin ring of surface area contributes recharge to the well, the probabilistic plume indicates that a much larger area could potentially contribute recharge to the well, but the frequency for any particular spot as a contaminant source is relatively low. In general, these probabilistic results do not incorporate all uncertainty in the predictive methods used for groundwater-flow simulations, but only the uncertainty associ-ated with specific parameter values for the specific regional-scale model developed for North Penn Area 7 and described in this report.
64 Groundwater System and Simulation of Flow for North Penn Area 7 Superfund Site, Montgomery County, Pennsylvania
78
76
59
7773
69
55
71
66
52
68
566
128
140
125
130
171
223
151
143
593
203
1702
1423
1198
1841
991
126
167
1199
1424
1050
1052
1701
1336
202
124
75°1
6'75
°17'
75°1
8'75
°19'
75°2
0'
40°1
4'
40°1
3'
40°1
2'
JTrb
, B6
JTRb
, B4
JTrb
lg, L
5
JTrb
lg, L
7
JTrb
, B8
Trl,
L9
Trlr,
B10
JTrb
, B
Trl,
L
Zeni
th
Ford
2Fo
rd1Ro
gers
Tele
flex
Spra
Fin
Leed
sNor
thru
p
204
Wissah
ickon
Cree
kTo
wam
enci
n Cr
eek
Base
from
U.S
. Geo
logi
cal S
urve
yN
atio
nal H
ydro
grap
hy D
atas
et, 1
999
Univ
ersa
l Tra
nsve
rse
Mer
cato
r, zo
ne 1
8N
orth
Am
eric
an D
atum
of 1
927
EXPL
AN
ATIO
N
Cont
amin
ant s
ourc
e
Stre
am >1,0
00
>300
–1,0
00
>100
–300
>30–
100
0–30
Road
Geo
logi
c co
ntac
t
Geo
logi
c fo
rmat
ion
and
laye
r ide
ntifi
er
0.05
–0.2
5
>0.2
5–0.
5
>0.5
–0.7
5
>0.7
5–1.
0
Wel
l, by
pum
ping
rate
in 1
990,
in c
ubic
met
ers
per d
ay
202
Frac
tion
of M
onte
Car
lo s
imul
atio
nsfo
r whi
ch p
athl
ines
from
sou
rces
pass
thro
ugh
mod
el c
ell
U.S
. Geo
logi
cal S
urve
y w
ell
iden
tifie
r (M
G- p
refix
om
itted
)
Path
line
from
sou
rce
(opt
imal
-par
amet
er s
imul
atio
n)
Trlr,
B10
00.
51
KILO
MET
ER
00.
51
MIL
E
Figu
re 3
8.
Sim
ulat
ed g
roun
dwat
er-fl
ow p
aths
ext
endi
ng fr
om c
onta
min
ant s
ourc
e ar
eas
to p
umpe
d w
ells
for p
umpi
ng c
ondi
tions
in 1
990
for N
orth
Pen
n Ar
ea 7
Sup
erfu
nd s
ite, U
pper
Gw
yned
d To
wns
hip
and
vici
nity
, Mon
tgom
ery
Coun
ty, P
enns
ylva
nia.
(>, g
reat
er th
an)
Simulation of Regional Groundwater Flow 6575
°15'
75°1
6'75
°17'
75°1
8'
40°1
5'
40°1
4'
40°1
3'
JTrb
, B6
JTRb
, B4
JTrb
lg, L
5
JTrb
lg, L
7
JTrb
, B8
Trl,
L9
Trlr,
B10
JTrb
, B
Trl,
L
Zeni
thFo
rd2
Ford
1
Roge
rs
Tele
flex
Spra
Fin
Leed
sNor
thru
p
Wissah
ickon
Cree
k
78
73
75
71
66
69
67
68
153
1125
1905
1938
498
143
593
76
59
55
991
12412
6
566
128
140
125
130
171
204 22
3
16715
1
203
1702
1424
1423
1198
1701
1841
1336
77
Base
from
U.S
. Geo
logi
cal S
urve
yN
atio
nal H
ydro
grap
hy D
atas
et, 1
999
Univ
ersa
l Tra
nsve
rse
Mer
cato
r, zo
ne 1
8N
orth
Am
eric
an D
atum
of 1
927
Mod
el c
ell t
hat r
echa
rges
wel
l 202
(opt
imal
-par
amet
er
sim
ulat
ion)
EXPL
AN
ATIO
N
Cont
amin
ant s
ourc
e
Stre
am >1,0
00
>300
–1,0
00
>100
–300
>30–
100
0–30
Road
Geo
logi
c co
ntac
t
Geo
logi
c fo
rmat
ion
and
laye
r ide
ntifi
er
0.05
–0.2
5
>0.2
5–0.
5
>0.5
–0.7
5
>0.7
5–1.
0
Wel
l, by
pum
ping
rate
in 1
990,
in c
ubic
met
ers
per d
ay
202
Frac
tion
of M
onte
Car
lo s
imul
atio
nsfo
r whi
ch m
odel
cel
l rec
harg
esw
ell 2
02
U.S
. Geo
logi
cal S
urve
y w
ell
iden
tifie
r (M
G- p
refix
om
itted
)
Trlr,
B10
00.
51
KILO
MET
ER
00.
51
MIL
E
52202
Figu
re 3
9.
Sim
ulat
ed a
rea
cont
ribut
ing
rech
arge
to w
ell M
G-20
2 (L
-22)
for p
umpi
ng c
ondi
tions
in 1
990
for N
orth
Pen
n Ar
ea 7
Sup
erfu
nd s
ite, U
pper
Gw
yned
d To
wns
hip
and
vici
nity
, Mon
tgom
ery
Coun
ty, P
enns
ylva
nia.
(>, g
reat
er th
an)
66 Groundwater System and Simulation of Flow for North Penn Area 7 Superfund Site, Montgomery County, Pennsylvania
Groundwater-Flow Paths in 1996
Groundwater pumping rates in the vicinity of North Penn Area 7 in 1996 (a model calibration period) were lower than in 1990 (table 5), and fewer wells were operating. Simulated deterministic groundwater-flow paths (fig. 40) are generally longer in 1996 than in 1990, with nearly all groundwater-flow paths leaving the immediate area of the contaminant sources and discharging to pumped wells southwest and west of North Penn Area 7. Industrial wells at Ford that captured simulated groundwater-flow paths from contaminant sources in the 1990 simulation were no longer pumping in 1996. Simulated deterministic and probabilistic groundwater-flow paths extend from the contaminant source at the Zenith facility to Merck facility wells (including wells MG-1198 and MG-1199) to the southwest and to well MG-140 to the west of North Penn Area 7 (fig. 40). For probabilistic simulations, the frequencies of flow paths extending from all North Penn Area 7 contam-inant-source areas to pass near or arrive at Merck wells are greater than 0.75. The deterministic groundwater-flow paths from the Rogers facility source are similar to those in 1990. The shutdown of the two pumped wells northeast of Rog-ers (MG-66 and MG-71) results in very low frequency of the probabilistic groundwater-flow paths passing through the area east of Rogers (fig. 40).
Production well MG-202 (L-22) does not capture any deterministic groundwater-flow paths from identified con-taminant sources in North Penn Area 7 in the 1996 simulation (fig. 40). The frequency of probabilistic simulations that indi-cate groundwater-flow paths extend from contaminant sources to areas near well MG-202 (L-22) is less than 0.05.
In the simulation of contributing area, modeled source locations do not appear to contribute recharge to well MG-202 (L-22) under conditions in 1996 (fig. 41). The frequency of probabilistic simulations for which recharge from identified contaminant sources in North Penn Area 7 flows to MG-202 (L-22) is less than 0.05. The deterministic contributing area simulated using optimal model parameters for withdrawals from well MG-202 (L-22) is located east of the well; a thin and discontinuous contributing area extends to the north-east. The probabilistic contributing area also extends to the northeast, but the frequencies are low, less than 0.25 at any particular location. As in the 1990 simulation, the probabilistic contributing area to MG-202 has a complex shape caused by nearby pumped wells and surface-water/groundwater inter-action in the headwaters of the Wissahickon Creek. Under simulated steady-state conditions, some water flowing to well MG-202 (L-22) is recharged beyond the contributing areas for nearby wells in the Wissahickon well field [MG-76 (L-17), MG-77 (L-18), MG-73 (L-14), MG-78 (L-19), and MG-75 (L-16)]. The contributing areas for other wells in the well field are surrounded by areas that contribute flow to well MG-202 (L-22).
Groundwater-Flow Paths in 2000
Groundwater pumping rates in the study area were rela-tively low (table 5), and fewer wells were pumping in 2000 (a calibration period) than in the other time periods. Simulated deterministic and probabilistic groundwater-flow paths from contaminant sources in North Penn Area 7 (fig. 42) are similar to, but slightly different than, those in 1996. For 2000, simu-lated groundwater-flow paths from all contaminant sources converge towards nearby pumped wells west and southwest of North Penn Area 7. More of the deterministic groundwater-flow paths from the source at the Zenith facility discharge to the area that contributes to Merck wells (MG-128, MG-1198, and MG-1199) and fewer discharge to the areas contribut-ing to production well MG-140 in the 2000 simulation (fig. 42) than in the 1996 simulation (fig. 40). The frequencies for probabilistic flow paths from all North Penn Area 7 contami-nant sources to pass near or arrive at Merck wells are higher than 0.75.
As in the 1990 and 1996 simulations, production well MG-202 (L-22) does not capture any deterministic groundwa-ter-flow paths from identified contaminant sources in North Penn Area 7 (fig. 42). The frequency of probabilistic simula-tions that indicates groundwater-flow paths extend from North Penn Area 7 contaminant sources to areas near well MG-202 is less than 0.05.
In the simulation of contributing area, modeled con-taminant source locations do not appear likely to contribute recharge to well MG-202 (L-22) under conditions in 2000 (fig. 43). The frequency of probabilistic simulations for which recharge from identified contamination sources in North Penn Area 7 flows to MG-202 (L-22) is less than 0.05. The deter-ministic contributing area for water pumped from MG-202 (L-22) is east of the well; a thin and discontinuous contribut-ing area extends to the northeast. The probabilistic contribut-ing area also extends to the northeast, but the frequencies are low, less than 0.25 at any particular location. As in the 1990 and 1996 simulations, the contributing area to MG-202 (L-22) has a complex shape caused by nearby pumped wells and groundwater/surface-water interaction in the headwaters of the Wissahickon Creek. Under simulated steady-state condi-tions, some water flowing to well MG-202 (L-22) is recharged beyond the contributing areas for nearby wells in the Wis-sahickon well field. [MG-76 (L-17), MG-77 (L-18), MG-73 (l-14), and MG-78 (L-19) were pumping, but MG-75 (L-16) was not pumping in December 2000.] The contributing areas for other wells in the well field are surrounded by areas that contribute flow to well MG-202 (L-22).
Simulation of Regional Groundwater Flow 6775
°17'
75°1
8'75
°19'
75°2
0'
40°1
4'
40°1
3'
40°1
2'
JTrb
, B6
JTRb
, B4
JTrb
lg, L
5
JTrb
lg, L
7
JTrb
, B8
Trl,
L9Tr
lr, B
10
JTrb
, B
Trl,
L
Zeni
thFo
rd2
Ford
1Roge
rs
Tele
flex
Spra
Fin
Leed
sNor
thru
p
Tow
amen
cin
Cree
k
Wissah
ickon
Cre
ek
76
59
77
68
991
202
12412
6
566
12814
0
130
171
204
16715
1
203
1702
1199
1424
1050
1052
1423
1198
1701
1336
125
55
52
223
1841
1028
69
71
66
143
919
Base
from
U.S
. Geo
logi
cal S
urve
yN
atio
nal H
ydro
grap
hy D
atas
et, 1
999
Univ
ersa
l Tra
nsve
rse
Mer
cato
r, zo
ne 1
8N
orth
Am
eric
an D
atum
of 1
927
EXPL
AN
ATIO
N
Cont
amin
ant s
ourc
e
Stre
am >1,0
00
>300
–1,0
00
>100
–300
>30–
100
0–30
Road
Geo
logi
c co
ntac
t
Geo
logi
c fo
rmat
ion
and
laye
r ide
ntifi
er
0.05
–0.2
5
>0.2
5–0.
5
>0.5
–0.7
5
>0.7
5–1.
0
Wel
l, by
pum
ping
rate
in 1
996,
in c
ubic
met
ers
per d
ay
202
Frac
tion
of M
onte
Car
lo s
imul
atio
nsfo
r whi
ch p
athl
ines
from
sou
rces
pass
thro
ugh
mod
el c
ell
U.S
. Geo
logi
cal S
urve
y w
ell
iden
tifie
r (M
G- p
refix
om
itted
)
Path
line
from
sou
rce
(opt
imal
-par
amet
er s
imul
atio
n)
Trlr,
B10
00.
51
KILO
MET
ER
00.
51
MIL
E
Figu
re 4
0.
Sim
ulat
ed g
roun
dwat
er-fl
ow p
aths
ext
endi
ng fr
om c
onta
min
ant s
ourc
e ar
eas
to p
umpe
d w
ells
for p
umpi
ng c
ondi
tions
in 1
996
for N
orth
Pen
n Ar
ea 7
Sup
erfu
nd s
ite, U
pper
Gw
yned
d To
wns
hip
and
vici
nity
, Mon
tgom
ery
Coun
ty, P
enns
ylva
nia.
(>, g
reat
er th
an)
68 Groundwater System and Simulation of Flow for North Penn Area 7 Superfund Site, Montgomery County, Pennsylvania75
°15'
75°1
4'75
°16'
75°1
7'75
°18'
40°1
5'
40°1
4'
40°1
3'
JTrb
, B6
JTRb
, B4
JTrb
lg, L
5
JTrb
lg, L
7JT
rb, B
8
Trl,
L9Tr
lr, B
10
JTrb
, B
Trl,
L
Roge
rs
223
69
68
625
498
875
134
153
620
621
1125
1905
1938
1418
1045
202
78
76
59
7773
75
202
140
171
151
1841
52
Zeni
thFo
rd2
Ford
1
Tele
flex
Spra
Fin
Leed
sNor
thru
p
71
66
223
167
203
1702
55
52
12412
6
128
125
130
1424
1701
67
204
Wissa
hicko
n Cre
ek
Base
from
U.S
. Geo
logi
cal S
urve
yN
atio
nal H
ydro
grap
hy D
atas
et, 1
999
Univ
ersa
l Tra
nsve
rse
Mer
cato
r, zo
ne 1
8N
orth
Am
eric
an D
atum
of 1
927
Mod
el c
ell t
hat r
echa
rges
wel
l 202
(opt
imal
-par
amet
er
sim
ulat
ion)
EXPL
AN
ATIO
N
Cont
amin
ant s
ourc
e
Stre
am >1,0
00
>300
–1,0
00
>100
–300
>30–
100
0–30
Road
Geo
logi
c co
ntac
t
Geo
logi
c fo
rmat
ion
and
laye
r ide
ntifi
er
0.05
–0.2
5
>0.2
5–0.
5
>0.5
–0.7
5
>0.7
5–1.
0
Wel
l, by
pum
ping
rate
in 1
996,
in c
ubic
met
ers
per d
ay
202
Frac
tion
of M
onte
Car
lo s
imul
atio
nsfo
r whi
ch m
odel
cel
l rec
harg
esw
ell 2
02
U.S
. Geo
logi
cal S
urve
y w
ell
iden
tifie
r (M
G- p
refix
om
itted
)
Trlr,
B10
00.
51
KILO
MET
ER
00.
51
MIL
E
Figu
re 4
1.
Sim
ulat
ed a
rea
cont
ribut
ing
rech
arge
to w
ell M
G-20
2 (L
-22)
for p
umpi
ng c
ondi
tions
in 1
996
for N
orth
Pen
n Ar
ea 7
Sup
erfu
nd s
ite, U
pper
Gw
yned
d To
wns
hip
and
vici
nity
, Mon
tgom
ery
Coun
ty, P
enns
ylva
nia.
(>, g
reat
er th
an)
Simulation of Regional Groundwater Flow 6975
°17'
75°1
8'75
°19'
75°2
0'
40°1
4'
40°1
3'
40°1
2'
Tow
amen
cin
Cree
k
Wissah
ickon
Cre
ek
Base
from
U.S
. Geo
logi
cal S
urve
yN
atio
nal H
ydro
grap
hy D
atas
et, 1
999
Univ
ersa
l Tra
nsve
rse
Mer
cato
r, zo
ne 1
8N
orth
Am
eric
an D
atum
of 1
927
Zeni
th Ford
1Roge
rs
Spra
Fin
Leed
sNor
thru
p
76
59
77
69
55
71
66
52
68
566
12814
0
171
204 22
3
16715
1
143
593
1050
1423
1198
1841
Trlr,
B10
JTrb
, B
Trl,
L
Ford
2
Tele
flex
202
12412
6130
203
1702
1028
1052
1336
JTrb
, B6
JTRb
, B4
JTrb
lg, L
5
JTrb
lg, L
7
JTrb
, B8
Trl,
L9
991
125
1199
1424
1701
EXPL
AN
ATIO
N
Cont
amin
ant s
ourc
e
Stre
am >1,0
00
>300
–1,0
00
>100
–300
>30–
100
0–30
Road
Geo
logi
c co
ntac
t
Geo
logi
c fo
rmat
ion
and
laye
r ide
ntifi
er
0.05
–0.2
5
>0.2
5–0.
5
>0.5
–0.7
5
>0.7
5–1.
0
Wel
l, by
pum
ping
rate
in 2
000,
in c
ubic
met
ers
per d
ay
202
Frac
tion
of M
onte
Car
lo s
imul
atio
nsfo
r whi
ch p
athl
ines
from
sou
rces
pass
thro
ugh
mod
el c
ell
U.S
. Geo
logi
cal S
urve
y w
ell
iden
tifie
r (M
G- p
refix
om
itted
)
Path
line
from
sou
rce
(opt
imal
-par
amet
er s
imul
atio
n)
Trlr,
B10
00.
51
KILO
MET
ER
00.
51
MIL
E
Figu
re 4
2.
Sim
ulat
ed g
roun
dwat
er-fl
ow p
aths
ext
endi
ng fr
om c
onta
min
ant s
ourc
e ar
eas
to p
umpe
d w
ells
for p
umpi
ng c
ondi
tions
in 2
000
for N
orth
Pen
n Ar
ea 7
Sup
erfu
nd s
ite, U
pper
Gw
yned
d To
wns
hip
and
vici
nity
, Mon
tgom
ery
Coun
ty, P
enns
ylva
nia.
(>, g
reat
er th
an)
70 Groundwater System and Simulation of Flow for North Penn Area 7 Superfund Site, Montgomery County, Pennsylvania75
°15'
75°1
4'75
°16'
75°1
7'75
°18'
40°1
5'
40°1
4'
40°1
3'
Wissa
hicko
n Cre
ek
78
76
77
73
75
69
55
67
71
66
52
68
625
498
875
134
167
593
153
620
621
1125
1905
1938
1841
1418
1045
JTrb
, B8
Trl,
L9Tr
l, L
Trlr,
B10
Ford
2Fo
rd1
Roge
rs
Tele
flex
Spra
Fin
Leed
sNor
thru
p
59
202
124
566
12814
0
125
130
171
204 22
3
151
203
1702
1424
1423
1701
JTrb
, B6
JTRb
, B4
JTrb
lg, L
5
JTrb
lg, L
7
JTrb
, B
Zeni
th
126
Base
from
U.S
. Geo
logi
cal S
urve
yN
atio
nal H
ydro
grap
hy D
atas
et, 1
999
Univ
ersa
l Tra
nsve
rse
Mer
cato
r, zo
ne 1
8N
orth
Am
eric
an D
atum
of 1
927
Mod
el c
ell t
hat r
echa
rges
wel
l 202
(opt
imal
-par
amet
er
sim
ulat
ion)
EXPL
AN
ATIO
N
Cont
amin
ant s
ourc
e
Stre
am >1,0
00
>300
–1,0
00
>100
–300
>30–
100
0–30
Road
Geo
logi
c co
ntac
t
Geo
logi
c fo
rmat
ion
and
laye
r ide
ntifi
er
0.05
–0.2
5
>0.2
5–0.
5
>0.5
–0.7
5
>0.7
5–1.
0
Wel
l, by
pum
ping
rate
in 2
000,
in c
ubic
met
ers
per d
ay
202
Frac
tion
of M
onte
Car
lo s
imul
atio
nsfo
r whi
ch m
odel
cel
l rec
harg
esw
ell 2
02
U.S
. Geo
logi
cal S
urve
y w
ell
iden
tifie
r (M
G- p
refix
om
itted
)
Trlr,
B10
00.
51
KILO
MET
ER
00.
51
MIL
E
Figu
re 4
3.
Sim
ulat
ed a
rea
cont
ribut
ing
rech
arge
to w
ell M
G-20
2 (L
-22)
for p
umpi
ng c
ondi
tions
in 2
000
for N
orth
Pen
n Ar
ea 7
Sup
erfu
nd s
ite, U
pper
Gw
yned
d To
wns
hip
and
vici
nity
, Mon
tgom
ery
Coun
ty, P
enns
ylva
nia.
(>, g
reat
er th
an)
Simulation of Regional Groundwater Flow 71
Groundwater-Flow Paths in 2005
Pumping rates in the vicinity of North Penn Area 7, and in the model domain as a whole, were somewhat higher in 2005 (a calibration period) than in 2000, although 2005 rates were lower than 1990 and 1996 rates. Simulated deterministic and probabilistic groundwater-flow paths from contaminant sources in North Penn Area 7 discharge to the contributing area of Merck wells (including MG-125, MG-128, MG-991, MG-1198, MG-1199, and MG-1423), except for the source area at the Rogers facility (North Penn Area 6), which dis-charges to the area contributing to pumped production wells MG-59, MG-140, and MG-566 (fig. 44). Simulated determin-istic and probabilistic groundwater-flow paths from Leeds & Northrup and Spra-Fin sources do not flow beneath Wis-sahickon Creek but flow more directly to the southwest and discharge to wells at Merck. The frequencies for probabilistic flow paths from all North Penn Area 7 source areas to pass near or arrive at Merck wells are higher than 0.75.
As in the 1990, 1996, and 2000 simulations, produc-tion well MG-202 (L-22) does not capture any deterministic groundwater-flow paths from identified sources in North Penn Area 7 (fig. 44). The frequency for probabilistic flow paths that extend from contaminant sources to areas near well MG-202 (L-22) is less than 0.05.
In the simulation of contributing area, modeled source locations do not appear likely to contribute recharge to well MG-202 (L-22) under conditions in 2005 (fig. 45), as was the case for 1990, 1996, and 2000 simulations. The frequency of probabilistic simulations for which recharge from identified contaminant sources in North Penn Area 7 flows to MG-202 (L-22) is less than 0.05. The deterministic contributing area simulated using optimal model parameters for withdrawals from MG-202 (L-22) is east of the pumped well; a thin and discontinuous contributing area extends to the northeast. The probabilistic contributing area also extends to the far north-east, but the frequencies are low, less than 0.25 at any par-ticular location. As in the 1990, 1996, and 2000 simulations, the probabilistic contributing area to MG-202 (L-22) has a complex shape caused by nearby pumped wells and surface-water/groundwater interaction in the headwaters of the Wis-sahickon Creek. The probabilistic contributing area is larger than in previous simulations, apparently as a result, in part, of the change in the number (decreased to three in 2005) of large pumped wells that affect the complex flow field. Under simulated steady-state conditions, some water flowing to well MG-202 (L-22) is recharged beyond the contributing areas for nearby pumped wells MG-76 (L-17) and MG-78 (L-19) in the Wissahickon well field. The contributing areas for wells MG-76 (L-17) and MG-78 (L-19) are separated by a thin strip that contributes flow to well MG-202 (L-22).
Groundwater/Surface-Water Interactions
Analysis of computed groundwater discharge to streams shows the complex flow patterns in the headwaters area of
Wissahickon Creek in the vicinity of North Penn Area 7 where groundwater withdrawals are a large part of the water budget (table 8). Streamflow gain, or discharge from the groundwater to surface water, occurs in the model where the aquifer hydraulic head is higher than the specified hydraulic head in the stream (Prudic 1989). In contrast, if the simulated aquifer hydraulic head is lower than the specified hydraulic head in the stream, then streamflow loss, or recharge of the groundwater by surface water, occurs. Under 2005 hydro-logic conditions, the Wissahickon Creek has both gaining and losing reaches in the vicinity of North Penn Area 7 (fig. 46). Away from pumping wells, the streams generally gain water; this also occurs in sections of Wissahickon Creek upstream from pumped wells. Stream loss, in some cases, results in total depletion of the streamflow. Sections of the Wissahickon Creek, near and upstream and downstream from Sumney-town Pike (approximate southern boundary of the North Penn Area 7) are dry in the simulation because of large groundwater withdrawals in this area. These results are consistent with observed streamflow in the study area in previous studies (Senior and Goode, 1999) and are reported in the section “Streamflow Measurements and Groundwater/Surface-Water Relations.” Most of the groundwater removed by pumping is eventually discharged to surface water at wastewater-treatment-plant discharge points on the Wissahickon Creek or other nearby streams. Downstream from these discharge points, measured base flow may be relatively high, whereas the stream may be dry during low-flow conditions upstream from the discharge points.
Simulated Shutdown of Well MG-202
Well MG-202 (L-22) produces water contaminated with VOCs, as documented since the 1980s (Martin, 1981; CH2M Hill, 1992), yet water from the nearby production well MG-76 (L-17) has rarely contained contaminants in detectable con-centrations. Anecdotal accounts indicate that the pumping of well MG-202 (L-22) effectively “protects” well MG-76 (L-17) from drawing in contaminated water. A hypothetical simula-tion was run using the calibrated groundwater-flow model for North Penn Area 7 under 2005 conditions to estimate the contributing area for MG-76 (L-17) with and without MG-202 (L-22) pumping. A transient simulation of recovery following the shutdown of MG-202 (L-22) was conducted using 2005 pumping and recharge rates; results were compared with the recovery measured in December 2004.
Results of the simulated shutdown of MG-202 (L-22) under steady-state 2005 conditions show that the area con-tributing recharge for well MG-76 (L-17) when well MG-202 (L-22) is not pumping shifts downstream (fig. 47), overlap-ping, and similar in shape to, the area contributing recharge for well MG-202 (L-22) when both wells are pumping (fig. 45). This result is consistent with the anecdotal account that the pumping of well MG-202 (L-22) “protects” well MG-76 (L-17) from drawing in contaminated water if the contaminant source is in the overlapping area that contributes recharge
72 Groundwater System and Simulation of Flow for North Penn Area 7 Superfund Site, Montgomery County, Pennsylvania75
°17'
75°1
7'75
°18'
75°1
9'75
°20'
40°1
4'
40°1
3'
40°1
2'
Tow
amen
cin
Cree
k
Wissah
ickon
Cre
ek
Zeni
th
JTrb
, B6JT
Rb, B
4JT
rblg
, L5
JTrb
lg, L
7JT
rb, B
8
Trl,
L9Tr
lr, B
10
JTrb
, B
76
77
73
69
55
71
66
52
68
124
143
593
1052
1336
Ford
2Fo
rd1Ro
gers
Tele
flex
59
202
126
566
128
140
125
130
171
204 22
3
16715
1
203
1702
1424
1423
1198 17
01
1841 Sp
raFi
nLe
edsN
orth
rup
991
1199
Trl,
L
1050
Base
from
U.S
. Geo
logi
cal S
urve
yN
atio
nal H
ydro
grap
hy D
atas
et, 1
999
Univ
ersa
l Tra
nsve
rse
Mer
cato
r, zo
ne 1
8N
orth
Am
eric
an D
atum
of 1
927
EXPL
AN
ATIO
N
Cont
amin
ant s
ourc
e
Stre
am >1,0
00
>300
–1,0
00
>100
–300
>30–
100
0–30
Road
Geo
logi
c co
ntac
t
Geo
logi
c fo
rmat
ion
and
laye
r ide
ntifi
er
0.05
–0.2
5
>0.2
5–0.
5
>0.5
–0.7
5
>0.7
5–1.
0
Wel
l, by
pum
ping
rate
in 2
005,
in c
ubic
met
ers
per d
ay
202
Frac
tion
of M
onte
Car
lo s
imul
atio
nsfo
r whi
ch p
athl
ines
from
sou
rces
pass
thro
ugh
mod
el c
ell
U.S
. Geo
logi
cal S
urve
y w
ell
iden
tifie
r (M
G- p
refix
om
itted
)
Path
line
from
sou
rce
(opt
imal
-par
amet
er s
imul
atio
n)
Trlr,
B10
00.
51
KILO
MET
ER
00.
51
MIL
E
Figu
re 4
4.
Sim
ulat
ed g
roun
dwat
er-fl
ow p
aths
ext
endi
ng fr
om c
onta
min
ant s
ourc
e ar
eas
to p
umpe
d w
ells
for p
umpi
ng c
ondi
tions
in 2
005
for N
orth
Pen
n Ar
ea 7
Sup
erfu
nd s
ite, U
pper
Gw
yned
d To
wns
hip
and
vici
nity
, Mon
tgom
ery
Coun
ty, P
enns
ylva
nia.
(>, g
reat
er th
an)
Simulation of Regional Groundwater Flow 7375
°15'
75°1
4'75
°16'
75°1
7'
40°1
5'
40°1
4'
40°1
3'
Wissahic
kon C
reek
JTrb
, B6
JTRb
, B4
JTrb
lg, L
5
JTrb
lg, L
7 JTrb
, B8
Trl,
L9
JTrb
, B
Trl,
LTr
lr, B
10
Zeni
thFo
rd2
Ford
1
Roge
rs
Tele
flex
Spra
Fin
Leed
sNor
thru
p
78
76
75
55
67
71
66
52
68
202
126
625
130
875
171
204
134 22
3
16715
1
203
153
620
621
1702
1125
1905
1938
1841
1418
1045
77
73
Base
from
U.S
. Geo
logi
cal S
urve
yN
atio
nal H
ydro
grap
hy D
atas
et, 1
999
Univ
ersa
l Tra
nsve
rse
Mer
cato
r, zo
ne 1
8N
orth
Am
eric
an D
atum
of 1
927
Mod
el c
ell t
hat r
echa
rges
wel
l 202
(opt
imal
-par
amet
er
sim
ulat
ion)
EXPL
AN
ATIO
N
Cont
amin
ant s
ourc
e
Stre
am >1,0
00
>300
–1,0
00
>100
–300
>30–
100
0–30
Road
Geo
logi
c co
ntac
t
Geo
logi
c fo
rmat
ion
and
laye
r ide
ntifi
er
0.05
–0.2
5
>0.2
5–0.
5
>0.5
–0.7
5
>0.7
5–1.
0
Wel
l, by
pum
ping
rate
in 2
005,
in c
ubic
met
ers
per d
ay
202
Frac
tion
of M
onte
Car
lo s
imul
atio
nsfo
r whi
ch m
odel
cel
l rec
harg
esw
ell 2
02
U.S
. Geo
logi
cal S
urve
y w
ell
iden
tifie
r (M
G- p
refix
om
itted
)
Trlr,
B10
00.
51
KILO
MET
ER
00.
51
MIL
E
Figu
re 4
5.
Sim
ulat
ed a
rea
cont
ribut
ing
rech
arge
to w
ell M
G-20
2 (L
-22)
for p
umpi
ng c
ondi
tions
in 2
005
for N
orth
Pen
n Ar
ea 7
Sup
erfu
nd s
ite, U
pper
Gw
yned
d To
wns
hip
and
vici
nity
, Mon
tgom
ery
Coun
ty, P
enns
ylva
nia.
(>, g
reat
er th
an)
74 Groundwater System and Simulation of Flow for North Penn Area 7 Superfund Site, Montgomery County, Pennsylvania
75°1
7'75
°16'
75°1
8'75
°19'
40°1
4'
40°1
3'
Zeni
thFo
rd2
Ford
1
Roge
rs
59
566
140
171
204
Sumne
ytown P
ike
Mea
sure
d no
flow
in s
tream
, May
31,
200
5
Mea
sure
d no
flow
in
stre
am, M
ay 3
1, 2
005
Mea
sure
d lo
ss o
f flo
w in
st
ream
, May
31,
200
5
Indu
stria
l dis
char
ge o
f ab
out 4
.7 m
Tele
flex
Spra
Fin
Leed
sNor
thru
p
78
76
202
126
128
125
130 17
0214
24
1423
1198
1841
Wissah
ickon
Creek
Indu
stria
l dis
char
ge
991
124
1199
1052
1701
1336
Sew
age
disc
harg
e
3 /d
(0.0
17 ft
/s)
3
Base
from
U.S
. Geo
logi
cal S
urve
yN
atio
nal H
ydro
grap
hy D
atas
et, 1
999
Univ
ersa
l Tra
nsve
rse
Mer
cato
r, zo
ne 1
8N
orth
Am
eric
an D
atum
of 1
927
EXPL
AN
ATI
ON
Cont
amin
ant s
ourc
e
Stre
ams
>300
to 9
38
>100
to 3
00
>30
to 1
00
13 to
30
Road
s
0 to
3
>3 to
10
>10
to 3
0
>30
to 1
00
>100
to 2
05
Wel
l, by
pum
ping
rate
in 2
005,
in c
ubic
met
ers
per d
ay
78
Stre
am lo
ss, i
n cu
bic
met
ers
per d
ay
U.S
. Geo
logi
cal S
urve
y w
ell
iden
tifie
r (M
G- p
refix
om
itted
)
0 to
3
>3 to
10
>10
to 3
0
>30
to 1
00
>100
to 1
92
Stre
am g
ain,
in c
ubic
m
eter
s pe
r day
00.
51
KILO
MET
ER
00.
51
MIL
E
Figu
re 4
6.
Sim
ulat
ed s
tream
loss
and
stre
am g
ain
for t
he U
pper
Wis
sahi
ckon
Cre
ek a
nd o
ther
stre
ams,
and
pum
ping
rate
s fo
r se
lect
ed w
ells
, in
2005
, for
the
mod
el fo
r Nor
th P
enn
Area
7 S
uper
fund
site
, Upp
er G
wyn
edd
Tow
nshi
p an
d vi
cini
ty, M
ontg
omer
y Co
unty
, Pe
nnsy
lvan
ia.
(>, g
reat
er th
an; f
t3 /s, c
ubic
feet
per
sec
ond;
m3 /d
, cub
ic m
eter
s pe
r day
)
Simulation of Regional Groundwater Flow 7575
°15'
75°1
6'75
°17'
75°1
8'
40°1
5'
40°1
4'
40°1
3'
202
Zeni
thFo
rd2
Ford
1
Roge
rs
Tele
flex
Spra
Fin
Leed
sNor
thru
p
78
76
59
75
69
55
71
66
52
68
991
202
12412
6
566
128140
125
130
498
171
204
16715
1
143
593
203
153
1702
1199
1424
1125
1423
1198
1938
1701
1841
1336
JTrb
, B6
JTRb
, B4
JTrb
lg, L
5 JTrb
lg, L
7
JTrb
, B8
Trl,
L9
JTrb
, B
Trl,
LTr
lr, B
10
77
73
223
1905
67
Wissahic
kon C
reek
Base
from
U.S
. Geo
logi
cal S
urve
yN
atio
nal H
ydro
grap
hy D
atas
et, 1
999
Univ
ersa
l Tra
nsve
rse
Mer
cato
r, zo
ne 1
8N
orth
Am
eric
an D
atum
of 1
927
Mod
el c
ell t
hat r
echa
rges
wel
l 202
(opt
imal
-par
amet
er
sim
ulat
ion)
EXPL
AN
ATIO
N
Cont
amin
ant s
ourc
e
Stre
am >1,0
00
>300
–1,0
00
>100
–300
>30–
100
0–30
Road
Geo
logi
c co
ntac
t
Geo
logi
c fo
rmat
ion
and
laye
r ide
ntifi
er
0.05
–0.2
5
>0.2
5–0.
5
>0.5
–0.7
5
>0.7
5–1.
0
Wel
l, by
pum
ping
rate
in 1
990,
in c
ubic
met
ers
per d
ay
76
Frac
tion
of M
onte
Car
lo s
imul
atio
nsfo
r whi
ch m
odel
cel
l rec
harg
esw
ell 7
6
U.S
. Geo
logi
cal S
urve
y w
ell
iden
tifie
r (M
G- p
refix
om
itted
)
Trlr,
B10
00.
51
KILO
MET
ER
00.
51
MIL
E
Figu
re 4
7.
Sim
ulat
ed a
rea
cont
ribut
ing
rech
arge
to w
ell M
G-76
(L-1
7) fo
r pum
ping
con
ditio
ns in
200
5 fo
r Nor
th P
enn
Area
7 S
uper
fund
site
, Upp
er G
wyn
edd
Tow
nshi
p an
d vi
cini
ty, M
ontg
omer
y Co
unty
, Pen
nsyl
vani
a. (>
, gre
ater
than
)
76 Groundwater System and Simulation of Flow for North Penn Area 7 Superfund Site, Montgomery County, Pennsylvania
captured by the wells. However, this area (figs. 45 and 47) does not include known contaminant sources, indicating the presence of an unknown or unidentified contaminant source.
The shutdown of well MG-202 (L-22) was also simu-lated under transient conditions using 2005 pumping and recharge to allow comparison of the groundwater-model results to measurements made in observation wells during the December 2004 shutdown, described earlier in this report. The initial conditions for this simulation were the steady-state potentiometric heads corresponding to 2005 pumping and recharge rates. For the transient simulation, the specific yield was set equal to 0.2, and specific storage was set equal to 0.00001. These values of aquifer storage parameters were not calibrated, but were selected from the literature to approxi-mately represent local conditions. A specific yield of 0.2 was reported by Johnson (1967) for silt loess. For comparison, in other simulations of groundwater-flow in fractured rock in the Newark Basin in New Jersey, Lewis-Brown and Rice (2002) used a specific yield value of 0.15 for overburden overlying the Lockatong Formation, and Tiedeman and others (2010) used a specific storage value of 0.00001 for weathered and unweathered fractured rock of the Lockatong Formation. The model layers representing mapped geologic units were subdivided into three sub-layers for the transient simulation. The pumped well MG-202 (L-22) intersects layers 8 and 9 but withdraws water primarily from layer 8. The simulated recovery from the shutdown of well MG-202 (L-22) gener-ally is consistent with measurements made during shutdown tests of that well in 2002 and 2004, which are described by Senior and others (2005; 2008) and previously in this report. The recovery in water levels after 1 day (1,440 minutes) in the middle sub-layer of model layer 8 is depicted in figure 48A, which shows that the distribution of changes in water levels is elongated in the strike direction but extends downdip to the northwest. For some wells, such as MG-72 (L-13), the simu-lated recovery is similar in magnitude to the actual measured changes in water levels during shutdown tests in 2002 and 2004 (fig. 15), and overall, the general shape and magnitude of simulated recovery is consistent with measured water-level changes. Little to no recovery in water levels was simulated near Spra-Fin, which is consistent with measured water levels in well MG-175 during the 2002 shutdown test. The recovery in layer 8 is much larger (at least one order of magnitude) than in the overlying layer 7, as indicated by simulated changes in water levels in the middle sub-layer of model layers 7 and 8 after 7 days (figs. 48B and 48C). Thus, the regional-scale groundwater-flow model, in general, is able to simulate aquifer response at the scale of the MG-202 aquifer test, although the model does not include sufficient detail to accurately simulate all measured water-level changes.
Transmissivity values estimated from measured water-level changes in response to shutdown and restart of pump-ing in well MG-202 (L-22) using the Theis (1935) ana-lytical method ranged from about 700 to 2,300 ft2/d (65 to 214 m2/d) in the 2004 test (Senior and others, 2008) and 770 to 1,625 ft2/d (72 to 151 m2/d) in the 2002 test (Senior and
others, 2005). Although the application of the Theis method to the fractured-rock setting does not account for anisotropy or heterogeneity, transmissivity values determined using this analytical approach may be considered rough estimates and are similar in magnitude to the transmissivity of about 904 ft2/d (84 m2/d) in the strike direction [optimum K of 3.72 ft/d (1.135 m/d) multiplied by maximum layer thickness of 243 ft (74 m)] estimated using the computer model for layer 8 (table 7).
Relation Between Water Quality and Groundwater Flow
Soluble chemical constituents may be transported in groundwater and can act as tracers of groundwater-flow paths. Chemical constituents that are introduced at the land sur-face by human activities may enter the groundwater system in recharge through soils and unsaturated aquifer materials. A constituent that is relatively conservative (not degrad-able, readily adsorbed, or precipitated to solid phases), such as the dissolved inorganic anion chloride, usually will trace advective groundwater flow more closely than other con-stituents, such as metals or organic compounds that are more chemically reactive.
Concentrations of constituents in groundwater samples collected by CDM Programs Corporation in fall 2005 are evaluated in relation to results of groundwater-flow simula-tions for the year 2005 to provide a qualitative assessment of model results, acknowledging that a snapshot of groundwater quality may not exactly match steady-state flow paths. Flow paths change over time because of differences in recharge and pumping rates. Constituents, including contaminants, may be transported to one area and then to another area as groundwa-ter-flow directions change. The observed spatial distribution of selected constituents in groundwater in 2005 generally was supportive of, or consistent with, the model results of the 2005 groundwater-flow simulation at North Penn Area 7.
Inferred Flow Paths from Distribution of Measured Contaminants
The most common contaminant in groundwater at North Penn Area 7 is TCE. The spatial distribution of TCE in fall 2005 shows that highest TCE concentrations were in or near groundwater-flow paths simulated under steady-state condi-tions in 2005 (fig. 49A). Notably, TCE was not detected in water samples from most wells that were not in or near flow paths from identified contamination sources; the excep-tion is well MG-202 (L-22) and possibly wells MG-174 and MG-1897 at the former Clearline property. As discussed previ-ously, the simulated contributing area for well MG-202 (L-22) does not include any identified contamination source in North Penn Area 7; therefore, the model results suggest the presence of an unidentified contaminant source of TCE for MG-202 (L-22).
Simulation of Regional Groundwater Flow 77
Base from U.S. Geological SurveyLansdale 1983, 1:24,000Universal Transverse Mercator, zone 18North American Datum of 1927
75°16'30"75°17'75°17'30"
40°14'
40°13'30"
40°13'
Towamencin Creek
B4
L5
B6
L7
B8L9
Wissah
ickon Cree
k
0 1,000 2,000 FEET500
0 300 600 METERS150
Geology from Berg and others (1980) with nomenclaturefrom Lyttle and Epstein (1987) and additional mapping and
lithologic classification from Smoot (unpublished)
(Not measured in 2004but was ~0 in 2002 test)
(1.62)
(2.0)
2101 (RI-9I)
2083 (RI-2I)
2082 (RI-2D)1145 (T-14)
1146 (T-4)
2087 (RI-4D)
2084 (RI-3D)
202
(0.28)
(0.29)
(0.27)
(0.31)
(2.15)
(0.58) (0.03)
(-0.10)
175
2122 (RI-11D)
2123 (RI-11I)2124 (RI-11S)
76
72
(1.31)
(1.48)
(0.63)(Not measured in 2004but was ~0 in 2002 test)
(Not measured in 2004but was ~1.5 in 2002 test)
2094 (RI-6S)
2093 (RI-6D)
1897 (CL-3)
18491848
174 CL-2)
(1.45)
EXPLANATION
Lithology
Red beds predominant
Gray beds predominant
B4, B6, B8
L5, L7, L9
Bed code, this report
Nomenclature
(1.31)
(0.28)1146 (T-4)
2101 (RI-9I)
Contours, in feet, for layer 8 on day 1 of simulated recovery from MG-202 shutdown—
1.0–1.9
7.0–8.06.0–6.95.0–5.94.0–4.9
3.0–3.92.0–2.9
Observation wells in layer 8—Upper number and (string) are well identifiers and (lower number) is measured change in water levels, in feet after 1,000 minutes
Observation wells in layer 7—Upper number and (string) are well identifiers and (lower number) is measured change in water levels, in feet after 1,000 minutes
Model layerL7
A
Figure 48. Measured water-level changes in observation wells at 1,000 minutes after shutdown of well MG-202 (L-22) in 2004 and simulated water-level recovery contours in the respective middle sub-layers of model layers after shutdown of well MG-202 (L-22): A, model layer 8 at at 1 day (1,440 minutes), B, model layer 8 at 7 days, and C, model layer 7 at 7 days, North Penn Area 7, Upper Gwynedd Township and vicinity, Montgomery County, Pennsylvania. [See figure 15 for cross-section showing changes in water levels measured in observation wells in 2004 shutdown test of well MG-202 (L-22).]
78 Groundwater System and Simulation of Flow for North Penn Area 7 Superfund Site, Montgomery County, Pennsylvania
75°16'30"75°17'75°17'30"
40°14'
40°13'30"
40°13'
Towamencin Creek
B4
L5
B6
L7
B8L9
Wissah
ickon Cree
k
0 1,000 2,000 FEET500
0 300 600 METERS150
Geology from Berg and others, (1980) with nomenclaturefrom Lyttle and Epstein (1987) and additional mapping and
lithologic classification from Smoot (unpublished)
Base from U.S. Geological SurveyLansdale 1983, 1:24,000Universal Transverse Mercator, zone 18North American Datum of 1927
(Not measured in 2004but was ~0 in 2002 test)
(1.62)
(2.0)
2101 (RI-9I)
2083 (RI-2I)
2082 (RI-2D)1145 (T-14)
1146 (T-4)
2087 (RI-4D)
2084 (RI-3D)
202
(0.28)
(0.29)
(0.27)
(0.31)
(2.15)
(0.58) (0.03)
(-0.10)
175
2122 (RI-11D)
2123 (RI-11I)2124 (RI-11S)
76
72
(1.31)
(1.48)
(0.63)(Not measured in 2004but was ~0 in 2002 test)
(Not measured in 2004but was ~1.5 in 2002 test)
2094 (RI-6S)
2093 (RI-6D)
1897 (CL-3)
18491848
174 CL-2)
(1.45)
1.0–1.97.0–7.96.0–6.95.0–5.9
4.0–4.93.0–3.92.0–2.9
8.0–8.99.0–10.0
EXPLANATION
Lithology
Red beds predominant
Gray beds predominant
B4, B6, B8
L5, L7, L9
Bed code, this report
Nomenclature
(1.31)
(0.28)1146 (T-4)
2101 (RI-9I)
Contours, in feet, for layer 8 on day 7 of simulated recovery from MG-202 shutdown— Observation wells in layer 8—Upper number
and (string) are well identifiers and (lower number) is measured change in water levels, in feet after 1,000 minutes
Observation wells in layer 7—Upper number and (string) are well identifiers and (lower number) is measured change in water levels, in feet after 1,000 minutes
Model layerL7
B
Figure 48. Measured water-level changes in observation wells at 1,000 minutes after shutdown of well MG-202 (L-22) in 2004 and simulated water-level recovery contours in the respective middle sub-layers of model layers after shutdown of well MG-202 (L-22): A, model layer 8 at at 1 day (1,440 minutes), B, model layer 8 at 7 days, and C, model layer 7 at 7 days, North Penn Area 7, Upper Gwynedd Township and vicinity, Montgomery County, Pennsylvania.—Continued [See figure 15 for cross-section showing changes in water levels measured in observation wells in 2004 shutdown test of well MG-202 (L-22).]
Simulation of Regional Groundwater Flow 79
75°16'30"75°17'75°17'30"
40°14'
40°13'30"
40°13'
Towamencin Creek
B4
L5
B6
L7
B8L9
Wissah
ickon Cree
k
0 1,000 2,000 FEET500
0 300 600 METERS150
Simulated recovery here is artifactof model layer 7, present but very thin in model updip of outcrop under model layers 1 and 2
Base from U.S. Geological SurveyLansdale 1983, 1:24,000Universal Transverse Mercator, zone 18North American Datum of 1927
Geology from Berg and others (1980) with nomenclaturefrom Lyttle and Epstein (1987) and additional mapping and
lithologic classification from Smoot (unpublished)
(Not measured in 2004but was ~0 in 2002 test)
(1.62)
(2.0)
2101 (RI-9I)
2083 (RI-2I)
2082 (RI-2D)1145 (T-14)
1146 (T-4)
2087 (RI-4D)
2084 (RI-3D)
202
(0.28)
(0.29)
(0.27)
(0.31)
(2.15)
(0.58) (0.03)
(-0.10)
175
2122 (RI-11D)
2123 (RI-11I)2124 (RI-11S)
76
72
(1.31)
(1.48)
(0.63)
but was ~0 in 2002 test)
(Not measured in 2004but was ~1.5 in 2002 test)
2094 (RI-6S)
2093 (RI-6D)
1897 (CL-3)
18491848
174 CL-2)
(1.45)
(Not measured in 2004
EXPLANATION
Lithology
Red beds predominant
Gray beds predominant
B4, B6, B8
L5, L7, L9
Bed code, this report
Nomenclature
(1.31)
(0.28)1146 (T-4)
2101 (RI-9I)
Contours, in feet, for layer 7 on day 7 of simulated recovery from MG-202 shutdown—
0.10–0.19
0.70–0.800.60–0.690.50–0.590.40–0.49
0.30–0.390.20–0.29
Observation wells in layer 8—Upper number and (string) are well identifiers and (lower number) is measured change in water levels, in feet after 1,000 minutes
Observation wells in layer 7—Upper number and (string) are well identifiers and (lower number) is measured change in water levels, in feet after 1,000 minutes
Model layerL7
C
Figure 48. Measured water-level changes in observation wells at 1,000 minutes after shutdown of well MG-202 (L-22) in 2004 and simulated water-level recovery contours in the respective middle sub-layers of model layers after shutdown of well MG-202 (L-22): A, model layer 8 at at 1 day (1,440 minutes), B, model layer 8 at 7 days, and C, model layer 7 at 7 days, North Penn Area 7, Upper Gwynedd Township and vicinity, Montgomery County, Pennsylvania.—Continued [See figure 15 for cross-section showing changes in water levels measured in observation wells in 2004 shutdown test of well MG-202 (L-22).]
80 Groundwater System and Simulation of Flow for North Penn Area 7 Superfund Site, Montgomery County, Pennsylvania75
°17'
75°1
8'
40°1
4'
40°1
3'
Wissah
ickon
Cre
ek
Ford
2
Leed
sNor
thru
p
2129
2125
2122
2100
2097
209520
9320
87
2084
2080
2101
2098
2088
2085
2099
2094
2086
76
202
174
1897
1849
1848
1847
1846 18
45
1844
1842
1146
1145
1144
Church Road
Zeni
th
Ford
1
Tele
flex
Spra
Fin
2126
2119
2090 20
81
175
2127
2123
2120
2091
2092
2082
2128
2124
2121
2102
2089
2083
171
1505
114911
48
Sum
neyt
own
Road
Towa
men
cin
Cree
k
Roge
rs
2131
2134
2132
2133
Base
from
U.S
. Geo
logi
cal S
urve
y N
atio
nal H
ydro
grap
hy D
atas
et, 1
999
Univ
ersa
l Tra
nsve
rse
Mer
cato
r, zo
ne 1
8N
orth
Am
eric
an D
atum
of 1
927
EXPL
AN
ATIO
N
Cont
amin
ant s
ourc
e
Stre
am
Road Fo
rd1
Ford
2
Leed
s N
orth
rup
Roge
rs
Spra
Fin
Tele
flex
Zeni
th
Sim
ulat
ed g
roun
dwat
er-f
low
pa
ths
in 2
005
from
con
tam
inan
tso
urce
are
as
A
0.0–
2.0
2.1–
5.0
5.1–
20.0
20.1
–50.
0
50.1
–410
.0
Open
hol
e
Type
of w
ell—
Shal
low
mon
itor w
ell
Inte
rmed
iate
mon
itor w
ell
Deep
mon
itor w
ell
TCE
conc
entr
atio
n,in
mic
rogr
ams
per l
iter—
TCE
conc
entr
atio
n in
200
5fr
om s
cree
ned
wel
ls w
ith
diffe
rent
dep
ths
and
for
open
hol
es a
nd w
ell n
umbe
r (M
G- p
refix
om
itted
)
1848 20
97
2098
2099
00.
5KI
LOM
ETER
00.
5M
ILE
Figu
re 4
9.
Sim
ulat
ed g
roun
dwat
er-fl
ow p
aths
for c
ondi
tions
in A
, 200
5 an
d B,
199
0, a
nd m
easu
red
TCE
conc
entra
tions
in s
ampl
es c
olle
cted
from
ob
serv
atio
n w
ells
in fa
ll 20
05, N
orth
Pen
n Ar
ea 7
Sup
erfu
nd s
ite, U
pper
Gw
yned
d To
wns
hip
and
vici
nity
, Mon
tgom
ery
Coun
ty, P
enns
ylva
nia.
Simulation of Regional Groundwater Flow 8175
°17'
75°1
8'
40°1
4'
40°1
3'
Wissah
ickon
Cre
ek
Ford
2
Leed
sNor
thru
p
2131
2129
2125
2122
2100
2097
2095
2093
2087
2084
2080
2101
2098
2088
2085
2134
2099
2094
2086
76
202
174
1,89
7
1849
1848
1847
1846
1845
1844
1842
1146
1145
1144
Church Road
Zeni
th
Ford
1
Tele
flex
Spra
Fin
2132
2119
2081
175
2133
2123
2120
2082
2124
2121
2102
2089
2083
171
1505
114911
48
Sum
neyt
own
Road
Towa
men
cin
Cree
k
Roge
rs
2090
2091
2092
2126
2127
2128
Base
from
U.S
. Geo
logi
cal S
urve
y N
atio
nal H
ydro
grap
hy D
atas
et, 1
999
Univ
ersa
l Tra
nsve
rse
Mer
cato
r, zo
ne 1
8N
orth
Am
eric
an D
atum
of 1
927
EXPL
AN
ATIO
N
Cont
amin
ant s
ourc
e
Stre
am
Road Fo
rd1
Ford
2
Leed
s N
orth
rup
Roge
rs
Spra
Fin
Tele
flex
Zeni
th
Sim
ulat
ed g
roun
dwat
er-f
low
pa
ths
in 1
990
from
con
tam
inan
tso
urce
are
as
B
0.0–
2.0
2.1–
5.0
5.1–
20.0
20.1
–50.
0
50.1
–410
.0
Open
hol
e
Type
of w
ell—
Shal
low
mon
itor w
ell
Inte
rmed
iate
mon
itor w
ell
Deep
mon
itor w
ell
TCE
conc
entr
atio
n,in
mic
rogr
ams
per l
iter—
TCE
conc
entr
atio
n in
200
5fr
om s
cree
ned
wel
ls w
ith
diffe
rent
dep
ths
and
for
open
hol
es a
nd w
ell n
umbe
r (M
G- p
refix
om
itted
)
1848 20
97
2098
2099
00.
5KI
LOM
ETER
00.
5M
ILE
Figu
re 4
9.
Sim
ulat
ed g
roun
dwat
er-fl
ow p
aths
for c
ondi
tions
in A
, 200
5 an
d B,
199
0, a
nd m
easu
red
TCE
conc
entra
tions
in s
ampl
es c
olle
cted
from
ob
serv
atio
n w
ells
in fa
ll 20
05, N
orth
Pen
n Ar
ea 7
Sup
erfu
nd s
ite, U
pper
Gw
yned
d To
wns
hip
and
vici
nity
, Mon
tgom
ery
Coun
ty, P
enns
ylva
nia.
—Co
ntin
ued
82 Groundwater System and Simulation of Flow for North Penn Area 7 Superfund Site, Montgomery County, Pennsylvania
The effects of differences in aquifer stresses on directions of flow paths are depicted in figure 49B where TCE concen-trations in fall 2005 are shown with flow paths simulated for 1990 steady-state conditions when more wells were pump-ing and pumping rates were higher than in 2005. The TCE concentrations in 2005 samples from well clusters west of Church Road [wells MG-2119 (RI-10D), MG-2120 (RI-10I), MG-2121 (RI-10S) of the RI-10 cluster] and near the southern extent of Dickerson Road [wells MG-2100 (RI-9D), MG-2101 (RI-9I), MG-2102 (RI-9S) of the RI-9 cluster] are not in or near simulated deterministic 1990 flow paths (and not along high-frequency probabilistic flow paths; fig. 38), indicating that flow paths from known sources were different in 1990 than in 2005. The 1990 simulated flow paths are similar to those for 2005 in that the simulated 1990 flow paths from identified contaminant sources do not pass near well MG-202, which nevertheless yields water with TCE at concentrations of con cern, indicating contamination from an unknown or unidenti fied source.
In addition to TCE, other VOCs were detected in samples from wells in North Penn Area 7. The fall 2005 spatial distri-bution of CFC-11 and CFC-113 (fig. 50 A and B), two VOCs present in relatively low to moderate concentrations (up to 230 and 79 µg/L, respectively) in selected groundwater samples, indicate different source areas for these compounds. The distribution of CFC-11 and CFC-113 in groundwater samples generally agrees with the 2005 simulated path lines. CFC-11 primarily was detected in samples from wells west of Church Road (well clusters RI-5, RI-13, and RI-10), two wells in the RI-15 cluster just east of Church Road [MG-2133 (RI-15I), MG-2134 (RI-15S)], and the shallow well [MG-2099 (RI-8S)] of the RI-8 cluster east of Wissahickon Creek (fig. 50A). CFC-113 primarily was detected at concentrations higher than those for CFC-11 in samples from wells east of Church Road on the Teleflex property and the shallow well of the RI-8 cluster [well MG-2099 (RI-8S)] east of Wissahickon Creek and at relatively lower concentrations in samples from wells at the Precision Tube facility (MG-171 and MG-204) and former FERCO facility (RI-15 and RI-3 clusters) along strike from Teleflex (fig. 50B). Samples from wells in the RI-8 and RI-15 well clusters contained detectable concentrations of CFC-11 and CFC-113. Analyses of 2006 well samples indicated that CFC-11 and CFC-113 were present in concentrations similar to, or higher than, those reported for 2005 samples, indicating that the spatial distribution pattern of these compounds was persistent over that time period.
The 2005 observed concentrations and 2005 simulated path lines indicate (1) a source of CFC-11 near the RI-5 cluster west of Church Road, (2) a source of CFC-113 on the Teleflex property east of Church Road, and (3) a source of CFC-11 and CFC-113 near RI-8 cluster on the former Leeds & Northrup property east of Wissahickon Creek. The presence of CFC-113 in samples from wells at the Precision Tube and former FERCO facilities may be a result of previous and current pumping drawing the compound from the Telefex facility, or the CFC-113 could come from independent sources.
CFC-11 and CFC-113 measured in 2005 samples from the shallow and intermediate wells (MG-2099, MG-2098) of the RI-8 cluster near a contaminant source at the Leeds & Northrup facility east of Wissahickon Creek were not detected in 2005 samples collected downgradient, possibly because of limited data. Simulated 2005 groundwater-flow paths from this source do not pass directly through areas where wells were sampled for CFC-11 and CFC-113 analysis, although the flow paths pass near the RI-9 well cluster. Neither CFC-11 nor CFC-113 was detected in 2005 samples from wells in the RI-9 well cluster, but low concentrations (less than 1 µg/L) of both compounds were measured in 2006 samples from the shallow well [MG-2102 (RI-9S)] in the RI-9 cluster.
Inferred Flow Paths from Observed Inorganic Constituent Distribution
As discussed previously, elevated concentrations of chlo-ride coupled with distinct chloride/bromide mass ratios were measured in samples from well clusters RI-5, R-13, and RI-10 west of Church Road (figs. 22, 28, and 29). The distribution of these inorganic chemical characteristics (figs. 22 and 29) is similar to the spatial distribution of CFC-11 (fig. 50A), indicat-ing a similar source location and (or) similar flow paths for the elevated chloride and CFC-11 in that part of North Penn Area 7.
Boron is another inorganic constituent that appears to occur in a distinct spatial distribution. Boron was detected in elevated concentrations above estimated background concen-trations of about 40 µg/L in the 2006 samples from selected wells only. The highest boron concentrations (up to 229 µg/L) were measured in samples from wells in the RI-6 cluster southeast, updip, and across the Wissahickon Creek from production well MG-202 (L-22) (fig. 26). Relatively elevated boron concentrations also were measured in samples from wells generally downgradient and along strike from the RI-6 cluster. The spatial distribution of the elevated boron may be related to natural geologic occurrence (composition of certain beds) and (or) to groundwater flow through the aquifer from a natural or anthropogenic source near the RI-6 cluster. If the elevated boron were from a source, the spatial distribution would be consistent with the general direction of groundwater flow. The RI-6 well cluster is at the edge of the 2005 simulated contributing area for well MG-202, and therefore, pumping at MG-202 may not capture all groundwater originating as recharge in the vicinity of the RI-6 cluster. The boron con-centration of 50 µg/L, slightly higher than estimated natural background, in the 2006 water sample from well MG-202 (L-22) indicates that the source of elevated boron is relatively small or, if geologically controlled, does not extend far along strike to the northeast of the RI-6 cluster. Boron in MG-202 (L-22) well water also could be a mixture of some water with high boron concentrations from near RI-6 and other water with lower boron concentrations. Analysis for boron isotopes in groundwater might be useful in identifying boron sources
Simulation of Regional Groundwater Flow 8375
°17'
75°1
8'
40°1
4'
40°1
3'
Wissah
ickon
Cre
ek
Ford
2
Leed
sNor
thru
p
2129
2125
2122
2100
2097
209520
9320
87
2084
2080
2101
2098
2088
2085
2099
2094
2086
76
202
174
1897
1849
1848
1847
1846 18
45
1844
1842
1146
1145
1144
Church Road
Zeni
th
Ford
1
Tele
flex
Spra
Fin
2119
2081
17521
23
2120
2082
2124
2121
2102
2089
2083
171
1505
114911
48
Sum
neyt
own
Road
Towa
men
cin
Cree
k
Roge
rs
2131
2134
2132
2133
2090
2091
2092
2126
2127
2128
Base
from
U.S
. Geo
logi
cal S
urve
y N
atio
nal H
ydro
grap
hy D
atas
et, 1
999
Univ
ersa
l Tra
nsve
rse
Mer
cato
r, zo
ne 1
8N
orth
Am
eric
an D
atum
of 1
927
EXPL
AN
ATIO
N
Cont
amin
ant s
ourc
e
Stre
am
Road Fo
rd1
Ford
2
Leed
s N
orth
rup
Roge
rs
Spra
Fin
Tele
flex
Zeni
th
Sim
ulat
ed g
roun
dwat
er-f
low
pa
ths
in 2
005
from
con
tam
inan
tso
urce
are
as
A
0.0–
2.0
2.1–
5.0
5.1–
20.0
20.1
–50.
0
50.1
–230
.0
Open
hol
e
Type
of w
ell—
Shal
low
mon
itor w
ell
Inte
rmed
iate
mon
itor w
ell
Deep
mon
itor w
ell
CFC-
11 c
once
ntra
tion,
in m
icro
gram
s pe
r lite
r—
CFC-
11 c
once
ntra
tion
in 2
005
from
scr
eene
d w
ells
with
di
ffere
nt d
epth
s an
d fo
r op
en h
oles
and
wel
l num
ber
(MG
- pre
fix o
mitt
ed)
1848 20
97
2098
2099
00.
5KI
LOM
ETER
00.
5M
ILE
, CFC
-113
in s
ampl
es c
olle
cted
from
, P
enns
ylva
nia.
B, C
FC-1
1 an
d -fl
ow p
aths
for c
ondi
tions
in 2
005
and
mea
sure
d co
ncen
tratio
ns o
f A, M
ontg
omer
y Co
unty
Sim
ulat
ed g
roun
dwat
er
Figu
re 5
0.ob
serv
atio
n w
ells
in fa
ll 20
05, N
orth
Pen
n Ar
ea 7
Sup
erfu
nd s
ite, U
pper
Gw
yned
d To
wns
hip
and
vici
nity
84 Groundwater System and Simulation of Flow for North Penn Area 7 Superfund Site, Montgomery County, Pennsylvania75
°17'
75°1
8'
40°1
4'
40°1
3'
Wissah
ickon
Cre
ek
Ford
2
Leed
sNor
thru
p
2129
2125
2122
2100
2097
2095
2093
2087
2084
2080
2101
2098
2088
2085
2099
2094
2086
76
202
174
1,89
7
1849
1848
1847
1846 18
45
1844
1842
1146
1145
1144
Church Road
Zeni
th
Ford
1
Tele
flex
Spra
Fin
2119
2081
17521
23
2120
2082
2124
2121
2102
2089
2083
171
1505
114911
48
Sum
neyt
own
Road
Towa
men
cin
Cree
k
Roge
rs
2131
2134
2132
2133
2090
2091
2092
2126
2127
2128
Base
from
U.S
. Geo
logi
cal S
urve
y N
atio
nal H
ydro
grap
hy D
atas
et, 1
999
Univ
ersa
l Tra
nsve
rse
Mer
cato
r, zo
ne 1
8N
orth
Am
eric
an D
atum
of 1
927
EXPL
AN
ATIO
N
Cont
amin
ant s
ourc
e
Stre
am
Road Fo
rd1
Ford
2
Leed
s N
orth
rup
Roge
rs
Spra
Fin
Tele
flex
Zeni
th
Sim
ulat
ed g
roun
dwat
er-f
low
pa
ths
in 2
005
from
con
tam
inan
tso
urce
are
as
B
0.0–
2.0
2.1–
5.0
5.1–
20.0
20.1
–50.
0
50.1
–79.
0
Open
hol
e
Type
of w
ell—
Shal
low
mon
itor w
ell
Inte
rmed
iate
mon
itor w
ell
Deep
mon
itor w
ell
CFC-
113
conc
entr
atio
n,in
mic
rogr
ams
per l
iter—
CFC-
113
conc
entr
atio
n in
200
5fr
om s
cree
ned
wel
ls w
ith
diffe
rent
dep
ths
and
for
open
hol
es a
nd w
ell n
umbe
r (M
G- p
refix
om
itted
)
1848 20
97
2098
2099
00.
5KI
LOM
ETER
00.
5M
ILE
, CFC
-113
in s
ampl
es c
olle
cted
from
, P
enns
ylva
nia.
—Co
ntin
ued
B, C
FC-1
1 an
d -fl
ow p
aths
for c
ondi
tions
in 2
005
and
mea
sure
d co
ncen
tratio
ns o
f A, M
ontg
omer
y Co
unty
Sim
ulat
ed g
roun
dwat
er
Figu
re 5
0.ob
serv
atio
n w
ells
in fa
ll 20
05, N
orth
Pen
n Ar
ea 7
Sup
erfu
nd s
ite, U
pper
Gw
yned
d To
wns
hip
and
vici
nity
Summary and Conclusions 85
in the area and their relative contribution to water withdrawn from well MG-202 (L-22) and, thus, could be potentially help-ful in identifying the location of the unknown source of TCE contamination affecting well MG-202 (L-22).
Limitations and Uncertainties in Predictive Simulations
Regional groundwater-flow paths in the study area are approximated by the predictive simulations in this report. Although the calibrated regional model reasonably matches overall regional water-level trends, the measurements are not precisely reproduced by the models, partly as the result of the model structure and availability of data. The actual groundwater-flow paths are likely to be more complex than those shown here because of the highly heterogeneous charac-teristics of the fractured-rock aquifers, and the groundwater-flow paths are likely to change in time because of changing recharge and pumping conditions. Nevertheless, the model and results here can be used to compare the potential effects of alternative groundwater-management methods and to indicate general characteristics of contributing areas for wells in the study area. The uncertainties in the predictive simulations of regional groundwater flow could be reduced by more detailed field studies and longer-term aquifer and tracer tests, which are beyond the scope of this study. Similar additional data also would be needed to simulate groundwater flow at the local scale. The probabilistic groundwater-flow paths indicate that the area that may have contributed recharge to individual pumped wells is larger than that shown for deterministic groundwater-flow paths. Vertical anisotropy of some layers of the model could not be calibrated with the observations avail-able, and these parameters were fixed, rather than calibrated. The effect of uncertainty in the vertical anisotropy was not included in the Monte Carlo simulations.
Summary and Conclusions
Groundwater in an area near Lansdale and Upper Gwyn-edd Township in southeastern Pennsylvania is contaminated with organic solvents, and on the basis of investigations in the 1980s that identified several probable industrial sources, the U.S. Environmental Protection Agency (USEPA) placed the area on the National Priority List in 1989 as the North Penn Area 7 Superfund site. Groundwater in and near North Penn Area 7 has been and currently (2012) is withdrawn for water supply. Contaminant migration is of concern as pumping pat-terns in the area change. In 2000, the U.S. Geological Survey (USGS) and the USEPA began a cooperative study, in which the USGS provided technical assistance for the Remedial Investigation (RI) at the North Penn Area 7 Superfund site. This assistance included describing the groundwater system and simulating groundwater flow on a regional scale.
The study area is underlain by Triassic and Jurassic age sandstones and shales of the Lockatong Formation and Bruns-wick Group in the Mesozoic Newark Basin. Regionally, these rocks strike northeast and dip to the northwest. The sequence of rocks form a fractured-sedimentary-rock aquifer that acts as a set of confined to partially confined layers of differing permeabilities. The aquifer layers are recharged locally by pre-cipitation through thin soils and discharge locally to streams. Depth to the top of competent bedrock typically is less than 20 ft below land surface. The Wissahickon Creek begins less than 1 mile northeast of the study area and flows southwest, parallel to strike, to bisect North Penn Area 7.
Results of field investigations conducted by USGS at North Penn Area 7, including geophysical logging, single-well testing of isolated aquifer intervals (packer testing), and aquifer tests with multiple observation wells, support the conceptual model of a layered aquifer with low hydraulic con-nection across beds and higher hydraulic connection parallel to bedding. Correlation of natural gamma-ray activity in borehole logs for the western part of North Penn Area 7 is possible over distance of hundreds to thousands of feet, indicating lateral continuity of beds that dip about 9 to 10 degrees northwest. Correlation of natural gamma-ray-activity logs appears possi-ble only over smaller distances (less than 1,000 ft) in the east-ern part of the study area and may reflect different depositional environments for sedimentary rocks than in the western part of the study area. Vertical hydraulic gradients vary throughout the area, as indicated by measurements of borehole flow in open wells, by different water levels in vertically nested wells, and by different water levels in zones isolated by packers in open wells. Vertical gradients are predominantly upward east of Wissahickon Creek, except where affected by pumping, and downward west of Wissahickon Creek.
Depths to static water levels in wells at North Penn Area 7 from December 2000 through September 2006 ranged from about 6 to 83 ft below land surface and generally were least in shallow wells near streams and greatest in wells affected by nearby pumping or located on hilltops. Water levels fluctuated seasonally in response to changes in recharge and were lowest during dry periods in 2001 and 2002. Regional groundwater levels mapped by USGS in 2000 and measured in several synoptic rounds from 2000 through 2005 indicate a potentiometric surface similar to topography, except in areas affected by relatively high pumping rates. Periodic base-flow stream measurements at selected sites on Wissa-hickon Creek from December 2000 through September 2005 show that the stream lost water between two sites on a reach in the study area when groundwater levels were low and gained water when groundwater levels were relatively high. The stream frequently was dry (no measureable base flow) at the most downstream site on Wissahickon Creek (at Sumneytown Road) that was measured for the North Penn Area 7 study.
Transmissivity values calculated from pumping rates and drawdown in isolated intervals in 11 existing wells and the 15 deepest new monitor wells drilled for the RI ranged over three orders of magnitude (2.8 to 2,290 square feet per day).
86 Groundwater System and Simulation of Flow for North Penn Area 7 Superfund Site, Montgomery County, Pennsylvania
Transmissivity values showed some relation to depth over the range of depths tested; the full range of transmissivities was measured throughout the 300-ft thickness of the aquifer pen-etrated by the new deep monitor wells. When the transmissivi-ties of tested intervals in the 15 deepest monitor wells, which are of similar depths, were grouped by depth in ranges of 50 ft, the transmissivities of the shallowest zones and deepest zones tested (interval midpoints of 0 to 50 and 251 to 300 ft below land surface, respectively) were statistically significantly dif-ferent (smaller) than transmissivities of intermediate depths, as determined by the non-parametric Kruskall-Wallis test using a p-value of 0.05. Possible explanations for the apparent dif-ferences in transmissivity with depth are that weathering may reduce the permeability of the shallowest intervals and that the frequency of high-permeability zones decreases with depth below 250 ft below land surface.
The structure of dipping beds appears to control hydrau-lic connections in the fractured-rock aquifer, as determined from water-level responses in observation wells to the shutdown and restart of pumping in production well MG-202 (L-22). Water-level changes measured in nearby monitor wells during packer testing of well MG-2131 (RI-15DD) show simi-lar structural/stratigraphic controls on hydraulic connections; water-level changes also show that long open sections of bore-holes can act as short circuits to connect fractures in layers of the aquifer that under natural conditions are separated.
Groundwater samples collected by CDM from existing and new monitor wells during three rounds of sampling during 2001–06 as part of the RI to assess the extent of groundwater contamination at North Penn Area 7 were analyzed for VOCs in all rounds and for selected major ions, metals, inorganic constituents, semi-volatile organic compounds, and (or) pes-ticides in one or more rounds. The main contaminants identi-fied in groundwater from the three rounds of sampling are VOCs; trichloroethylene (TCE) is the VOC most frequently detected and measured at the highest concentration (up to 650 µg/L in monitor well MG-2124 (RI-11S). Other detected VOCs include (but are not limited to) tetrachloroethylene, cis-1,2-DCE, 1,1,1-TCA, 1,1-DCE, vinyl chloride, CFC-11, and CFC-113.
Water samples were analyzed for the additional inorganic constituents, including chloride, bromide, boron, sulfate, and silica, to determine the ions causing the high specific conductance in water from some wells identified through geophysical logging and packer tests and to potentially aid in the understanding of the groundwater-flow system and (or) determine potential contaminant sources and (or) pathways. Chloride concentrations were elevated above the estimated natural background of 10 milligrams per liter (mg/L) in most groundwater samples, generally decreased with depth, and were highly elevated (100 to 350 mg/L) in water samples from wells with high specific conductance in the western part of North Penn Area 7, indicating dissolved salts are the probable cause of the high conductance there. Chloride/bromide mass ratios indicate that sources of chloride in water from wells west of and along Church Road appear to differ from other
locations at North Penn Area 7 and probably include sub-stances other than road salt. Sulfate concentrations in samples ranged from 10 to 68.6 mg/L, were not elevated above background levels estimated from regional studies, showed no strong pattern in relation to depth or spatial distribution, and were not high enough to limit anaerobic degradation of VOCs. Silica concentrations, a possible surrogate for residence time, generally decreased with depth like chloride, indicating pos-sible rapid recharge through preferential pathways to deep groundwater. Silica concentrations also indicate that shallow groundwater may follow different, slower flow paths than deeper groundwater. Boron concentrations in water samples from wells at North Penn Area 7 ranged from less than 20 to 220 micrograms per liter (µg/L) and were highest in the RI-6 well cluster and wells along strike from that cluster. The spatial distribution of the slightly to moderately elevated boron concentrations (greater than 40 µg/L) may be related to a natural occurrence of boron in the geologic formation that follows geologic structure (bedding orientation) or may trace groundwater transport partly controlled by geologic structure from a natural or anthropogenic source (such as waste-disposal facilities).
Groundwater flow in and near North Penn Area 7 under steady-state conditions was simulated by use of a numerical model (MODFLOW-2000). The model, intended to simulate groundwater flow at a regional scale, was oriented parallel to regional strike and consisted of multiple layers. The top two layers represent saprolite and highly weathered rock near the surface. The dipping sedimentary formations that underlie the study area were modeled using dipping model layers for intermediate and deep zones of unweathered, fractured rock. The beds and their geometry were identified on the basis of geologic mapping of the Lockatong Formation and Bruns-wick Group and transitional beds (maps of the beds are not published). The model does not include detailed structure to account for local-scale differences in hydraulic properties, with the result that local-scale groundwater flow may not be well simulated. Additional detailed multi-well aquifer tests would be needed to establish the extent of interconnection between intervals at the local scale to address remediation of contamination at each source area.
The regional groundwater-flow model was calibrated to measured water levels (1996, 2000, and 2005) and base flow estimated from selected streamflow measurements by use of nonlinear-regression parameter-estimation algorithms. Estimated model parameters include hydraulic conductivity (subhorizontal and vertical), anisotropy of hydraulic conduc-tivity, streambed hydraulic conductivity, and recharge during calibration periods. Vertical anisotropy of some layers of the model could not be calibrated with the observations avail-able and, consequently, was fixed for these layers. Estimated hydraulic conductivity ranges from 0.001 to 1.67 meters per day (m/d) (0.0032 to 5.5 ft/d). The calibrated regional model indicates that the aquifer appears to be anisotropic; hydraulic conductivity is greatest parallel to the strike of bedding of the dipping sedimentary formations underlying the area and
References Cited 87
smallest in the cross-bed (dip) direction. The ratio of minimum to maximum subhorizontal hydraulic conductivity ranges from 1/1 to 1/8.5, and the ratio of vertical to (sub)horizontal hydrau-lic conductivity ranges from 1/1 to 1/478. Estimated recharge rates corresponding to calibration periods in 1996, 2000, and 2005 are 148, 109, and 124 millimeters per year (mm/yr) (5.8, 4.3, and 4.9 in/yr), respectively.
The calibrated groundwater-flow model was used to simulate groundwater flow during periods of relatively high withdrawals (pumpage) (1990) and relatively low withdrawals (2000 and 2005). Groundwater-flow paths originating from recharge near known source areas of soil contamination were simulated. Pumped industrial wells captured groundwater from several of these sources. Because pumping at some of these wells ceased or decreased after 1990, groundwater from those sources was no longer captured at those wells. Greater amounts of contaminated groundwater moved away from North Penn Area 7 Superfund site to surrounding areas under pumping conditions in 1996, 2000, and 2005 than in 1990. Changes in the hydraulic properties of the model result in changes in the simulated flow paths of groundwater from con-taminant source areas to pumped wells, and this uncertainty in the groundwater-flow paths was illustrated through Monte Carlo simulations. The effect of uncertainty in the vertical anisotropy was not included in the Monte Carlo simulations because limited available field data precluded calibration of vertical anisotropy in the model. The probabilistic simulations show that the groundwater-flow paths from potential areas of contaminant sources are generally consistent with determin-istic paths but that uncertainty in the aquifer properties leads to uncertainty in the paths, such that contaminated water may have moved through a much larger part of the formations in the study area. The uncertainty in these paths could potentially be reduced by further field studies, such as tracer tests, that characterize flow paths directly.
Simulated contributing areas indicate the general configu-ration of groundwater flow towards production well MG-202 (L-22) in the study area, and as simulated, contributing areas likely do not include any identified contaminant source in North Penn Area 7. Recharge to wells generally comes from infiltration near the well and over an area that extends upgradi-ent from the well. The contributing area is more complex at groundwater divides, can extend in more than one direction, and can capture recharge from thousands of feet away. Con-tributing areas to wells in areas with many wells are particu-larly complex and, in some cases, include areas that contribute flow to streams that subsequently recharge the aquifer through stream loss. In these cases, water-quality constituents in the surface water may be drawn into nearby pumped wells.
The groundwater-flow model was used to determine the contributing area for well MG-76 (L-17) when production well MG-202 was shutdown. Results of the simulated shutdown of well MG-202 (L-22) under steady-state 2005 conditions show that the area contributing recharge to well MG-76 (L-17) when MG-202 (L-22) is not pumping shifts downstream and is simi-lar to the area contributing recharge to MG-202 (L-22) when
both wells are pumped. This result is consistent with the anec-dotal account that pumped well MG-202 (L-22) “protects” well MG-76 (L-17) from drawing in contaminated water if the contaminant source is in the overlapping area that contributes recharge to both wells. Simulation of the MG-202 (L-22) shutdown under transient conditions shows that the regional-scale groundwater-flow model is, in general, able to simulate observed aquifer response at the scale of the MG-202 (L-22) aquifer test, although the model does not include sufficient detail to accurately simulate all measured water-level changes.
Concentrations of constituents in groundwater samples collected by CDM in fall 2005 are compared with groundwa-ter-flow simulations for the year 2005 to provide a qualitative assessment of model results, acknowledging that a snapshot of groundwater quality may not exactly match steady-state flow paths. The observed spatial distribution of selected con-stituents, including TCE, CFC-11, CFC-113 in groundwater in 2005 and the chloride/bromide mass ratios for 2006, generally were supportive of, or consistent with, the model results of the 2005 groundwater-flow simulation at North Penn Area 7.
References Cited
Argus Interware, Inc., 1997, User’s Guide Argus ONE™, Argus Open Numerical Environments—A GIS Model-ing System, Version 4.0: Jericho, N.Y., Argus Holdings, Limited, 506 p.
Barton, G.J., Risser, D.W., Galeone, D.G., and Goode, D.J., 2003, Case study for delineating a contributing area to a well in a fractured siliciclastic-bedrock aquifer near Lansdale, Pennsylvania: U.S. Geological Survey Water-Resources Investigations Report 02–4271, 46 p.
Biesecker, J.E., Lescinsky, J.B., and Wood, C.R., 1968, Water resources of the Schuylkill River Basin: Pennsylvania Department of Environmental Protection Water Resources Bulletin, no. 3, 198 p.
Black & Veatch Waste Science, Inc., 1994, Remedial Inves-tigation Feasibility Study Report North Penn Area 6 Site Source Control Operable Unit, Lansdale, Pennsylvania, Work assignment no. 91-19-3LW9, contract no. 68-W8-0091: Prepared for the U.S. Environmental Protection Agency, December 20, 1994.
88 Groundwater System and Simulation of Flow for North Penn Area 7 Superfund Site, Montgomery County, Pennsylvania
Black & Veatch Waste Science, Inc., 1999, Remedial Inves-tigation Feasibility Study Report North Penn Area 6 Site Groundwater Operable Unit (OU3), Lansdale, Pennsyl-vania.Work assignment no. 004-RICO03W9, contract no. 68-S8-3002. Prepared for the U.S. Environmental Protec-tion Agency, August 1999
Burns, D.A., Plummer, L.N., McDonnell, J.J., Busenberg, Eurybiades, Casile, G.C., Kendall, Carol, Hooper, R.P., Freer, J.E., Peters, N.E., Beven, Keith, and Schlosser, Pete, 2003, The geochemical evolution of riparian ground water in a forested Piedmont catchment: Ground Water, v. 41, no. 7, p. 913–925.
Chapelle, F.H, and Bradley, P.M, 1998, Selecting remedia-tion goals by assessing the natural attenuation capacity of groundwater systems: Bioremediation Journal, v. 2, no. 3–4, p. 227–238.
CDM Federal Programs Corporation, 2003, Revised final remedial investigation report for North Penn Operable Unit 2 Spra-Fin property, North Wales, volume 1: U.S. Environ-mental Protection Agency work assignment no. 015-RICO-03X1 document no. 3232-015-RT-RIRT-01570, June 23, 2003, accessed December 3, 2010, at http://loggerhead.epa.gov/arweb/public/pdf/464104.pdf.
CDM Federal Programs Corporation, 2011, Final remedial investigation report for North Penn Area 7 Superfund Site, Operable Unit 3, Montgomery County, Pennsylvania: U.S. Environmental Protection Agency contract no. EP-S3-07-06, work assignment no. 024-RICO-03X1 document control no. 3330-024-RT-RIRT-01543, April 28, 2011.
CH2M-Hill, Inc., 1992, North Penn Area 7 Phase II RI/FS Work Plan. Work assignment no. 05-3LX1.0, contract no. 68-W8-0090: Prepared for the U.S. Environmental Pro-tection Agency, February 1992.
Conger, R.W., 1999, Evaluation of geophysical logs at North Penn Area 6 Superfund Site, Lansdale, Montgomery County, Pennsylvania: U.S. Geological Survey Open-File Report 99–271A, 149 p.
Converse Consultants East, 1994, Report: Task 2—Investiga-tion of regional and site groundwater quality Ford Electron-ics and Refrigeration Corporation (FERCO)—Church Road facility, Lansdale, Pennsylvania, Project No. 91-37322-07: Parsippany, N.J., Sept. 20, 1994, 2 vols.
Davis, S.N, Whittemore, D.O., Fabryka-Martin, 1998, Uses of chloride/bromide ratios in studies of potable water: Ground Water, v. 36, no. 2, p. 338–350.
Davis, S.N., Fabryka-Martin, J.T., and Wolfsberg, L.E., 2004, Variations of bromide in potable ground water in the United States: Ground Water, v. 42, no. 6, p. 902–909.
Durlin, R.R., and Schaffstall, W.P., 2000, Ground water in the clastic bedrock within the Triassic lowlands section of the Piedmont Physiographic Province, in Water resources data for Pennsylvania, water year 1999, volume 1, Delaware River Basin: U.S. Geological Survey Water-Data Report PA-00-1, p. 1–24, accessed December 3, 2010, at http://pa.water.usgs.gov/infodata/surfacewater/annual_rpt/wy00/pdfs/nawqa-piedmont.pdf.
Edmunds, W.M., 1996, Bromine geochemistry of British groundwaters: Mineralogical Magazine, v. 60, p. 275–284.
ESRI, 2006, ArcGIS 9.2, Using ArcGIS Desktop: Redlands, Calif., ESRI Inc., 452 p.
Geraghty & Miller, Inc., 1993, Evaluation of groundwater pumpage and containment at the Merck & Co., Inc., West Point, Pennsylvania, plant: Reston, Virginia, Dec. 3, 1993.
Golder and Associates, Inc., 2003, RI sampling data review, 1190 Church Road, North Penn Area 7 Superfund site, letter dated October 28, 2003, to U.S. Environmental Protection Agency, accessed December 3, 2010, at http://loggerhead.epa.gov/arweb/public/pdf/2037767.pdf.
Goode, D.J., and Senior, L.A., 1998, Review of aquifer test results for the Lansdale area, Montgomery County, Pennsyl-vania, 1980-95: U.S. Geological Survey Open-File Report 98–294, 70 p.
Goode, D.J., and Senior, L.A., 2000, Simulation of aquifer tests and ground-water flow paths at the local scale in fractured shales and sandstones of the Brunswick Group and Locka-tong Formation, Lansdale, Montgomery County, Pennsylva-nia: U.S. Geological Survey Open-File Report 00–97, 46 p.
Halford, K.J., 1999, Effects of steady-state assumption on hydraulic conductivity and recharge estimates in a surficial aquifer system: Ground Water, v. 37, no. 1, p. 70–79.
Harbaugh, A.W., Banta, E.R., Hill, M.C., and McDonald, M.G., 2000, MODFLOW-2000, The U.S. Geological Survey modular ground-water model—User’s guide to modular-ization concepts and the ground-water flow process: U.S. Geological Survey Open-File Report 00–92, 191 p.
Heimann, A.C., Friis, A.K, and Jakobsen, Rasmus, 2005, Effects of sulfate on anaerobic chloroethene degradation by an enriched culture under transient and steady-state hydro-gen supply: Water Research, v. 39, no. 15, September 2005, p. 3579–3586.
Hill, M.C., Banta, E.R., Harbaugh, A.W., and Anderman, E.R., 2000, MODFLOW-2000, The U.S. Geological Survey modular ground-water model—User’s guide to the observa-tion, sensitivity, and parameter-estimation processes and three post-processing programs: U.S. Geological Survey Open-File Report 00–184, 220 p.
Hill, M.C., and Tiedeman, C.R, 2007, Effective groundwa-ter model calibration: With analysis of data, sensitivities, predictions, and uncertainty: Hoboken, N.J., John Wiley & Sons, 455 p.
Insightful Corporation, 2008, S-Plus 7 for Windows statistical software documentation, accessed June 2, 2008, at http://www.insightful.com/support/doc_splus_win.asp.
Johnson, A.I., 1967, Specific yield—compilation of specific yields for various materials: U.S. Geological Survey Water Supply Paper 1662-D, 74 p.
Kennedy, L.G., Everett, J.W., Ware, K.J., Parsons, Robert, and Green, Valerie, 1998, Iron and sulfur mineral analysis methods for natural attenuation assessments: Bioremedia-tion Journal, v. 2, no. 3, p. 259–276.
Lewis-Brown, J.D., and Rice, D.E., 2002, Simulated ground-water flow, Naval Air Warfare Center, West Trenton, New Jersey: U.S. Geological Survey Water-Resources Investiga-tions Report 02–4019, 44 p.
Lindsey, B.D., 2005, Hydrogeology and simulation of source areas of water to production wells in a colluvium-mantled carbonate-bedrock aquifer near Shippensburg, Cumber-land, and Franklin Counties, Pennsylvania: U.S. Geological Survey Scientific Investigations Report 2005–5195, 49 p.
Longwill, S.M., and Wood, C.R., 1965, Ground-water resources of the Brunswick Formation in Montgomery and Berks Counties, Pennsylvania: Pennsylvania Geological Survey, 4th ser., Water Resource Report W22, 59 p.
Lyttle, P.T., and Epstein, J.B., 1987, Geologic map of the Newark 1° x 2° Quadrangle, New Jersey, Pennsylvania and New York: U.S. Geological Survey Miscellaneous Investi-gations Map I-1715, scale 1:250,000.
Martin, L.M, 1981, Source identification of TCE and other chlorinated organic groundwater pollutants in the upper Wissahickon watershed—phase II: Report prepared for the Wissahickon Valley Watershed Association in cooperation with the North Penn Water Authority, November 1981, 141 p.
Neupauer, R.M., and J.L. Wilson, 2004, Numerical imple-mentation of a backward probabilistic model of ground water contamination: Ground Water, v. 42, no. 2, p. 179–189.
Newport, T.G., 1971, Groundwater resources of Montgomery County, Pennsylvania: Pennsylvania Geological Survey, 4th ser., Water Resource Report W29, 83 p.
Pollock, D.W., 1994, User’s Guide for MODPATH/MOD-PATH-PLOT, Version 3: A particle tracking post-processing package for MODFLOW, the U.S. Geological Survey finite-difference ground-water flow model: U.S. Geological Survey Open-File Report 94–464, 6 chap.
Prudic, D.E., 1989, Documentation of a computer program to simulate stream-aquifer relations using a modular, finite-dif-ference, ground-water flow model: U.S. Geological Survey Open-File Report 88–729, 113 p.
Rima, D.R., 1955, Ground water resources of the Lansdale area, Pennsylvania: Pennsylvania Geological Survey, 4th ser., Prog. Report 146, 24 p.
Risser, D.W., and Bird, P.H., 2003, Aquifer tests and simula-tion of ground-water flow in Triassic sedimentary rocks near Colmar, Bucks and Montgomery Counties, Pennsylvania: U.S. Geological Survey Water-Resources Investigations Report 03–4159, 73 p.
Schlische, R.W., 1992, Structural and stratigraphic devel-opment of the Newark extensional basin, eastern North America—Evidence for growth of the basin and its bound-ing structures: Geological Society of America Bulletin, v. 104, p. 1246–1263.
Senior, L.A., Cinotto, P.J., Conger, R.W., Bird, P.H., and Pracht, K.A., 2005, Interpretation of geophysical logs, aquifer tests, and water levels in wells in and near the North Penn Area 7 Superfund Site, Upper Gwynedd Township, Montgomery County, Pennsylvania, 2000–02: U.S. Geo-logical Survey Scientific Investigations Report 2005–5069, 129 p.
Senior, L.A., Conger, R.W., and Bird, P.H., 2008, Geophysi-cal logs, aquifer tests, and water levels in wells in and near the North Penn Area 7 Superfund Site, Upper Gwynedd Township, Montgomery County, Pennsylvania, 2002–06: U.S. Geological Survey Scientific Investigations Report 2008–5154, 277 p.
Senior, L.A., and Goode, D.J., 1999, Ground-water system, estimation of aquifer hydraulic properties, and effects of pumping on ground-water flow in Triassic sedimentary rocks in and near Lansdale, Pennsylvania: U.S. Geological Survey Water-Resources Investigations Report 99–4228, 112 p.
Senior, L.A., Rowland, C.A., and Prieto, D.A., 1998, Altitude and configuration of the potentiometric surface in Lansdale and vicinity, Montgomery County, Pennsylvania, August 22–23, 1996: U.S. Geological Survey Open-File Report 98–253, 1 plate, scale 1:24,000.
90 Groundwater System and Simulation of Flow for North Penn Area 7 Superfund Site, Montgomery County, Pennsylvania
Senior, L.A., and Ruddy, A.J., 2004, Altitude and configura-tion of the water-level surface in Mesozoic sedimentary rocks at and near the North Penn Area 7 Superfund site, Upper Gwynedd Township, Montgomery County, Pennsyl-vania, December 4–6, 2000: U.S. Geological Survey Open-File Report 2004–1006, 1 pl., scale 1:24,000.
Senior, L.A., Sloto, R.A., and Reif, A.G., 1997, Hydrogeology and water quality of the West Valley Creek Basin, Chester County, Pennsylvania: U.S. Geological Survey Water-Resources Investigations Report 94–4137, 160 p.
Senior, L.A., and Sloto, R.A., 2006, Arsenic, boron, and fluoride concentrations in ground water in and near diabase intrusions, Newark Basin, Southeastern Pennsylvania: U.S. Geological Survey Scientific Investigations Report 2006–5261, 105 p.
Sevon, W.D., comp., 2000, Physiographic provinces of Penn-sylvania: Pennsylvania Geological Survey, 4th ser., map 13, scale 1:2,000,000.
Sloto, R.A., and Schreffler, C.L., 1994, Hydrogeology and ground-water quality of northern Bucks County, Pennsylva-nia: U.S. Geological Survey Water-Resources Investigations Report 94–4109, 85 p.
Starn, J.J., Bagtzoglou, A.C., and Robbins, G.A., 2010, Using atmospheric tracers to reduce uncertainty in groundwater recharge areas: Ground Water, v. 48, no. 6, p. 858–868.
Theis, C.V., 1935, The relation between the lowering of the piezometric surface and the rate and duration of discharge of a well using groundwater storage: Transactions American Geophysical Union, v. 16, p. 519–524.
Tiedeman, C. R., Lacombe, P. J. and Goode, D. J., 2010, Mul-tiple well-shutdown tests and site-scale flow simulation in fractured rocks: Ground Water, v. 48, no. 3, p. 401–415.
Turner, D.P., 2006, Draft soil sampling summary tables, figures and the soil data validation narratives for the North Penn Area 7 Superfund Site, 205 Church Rd property, memorandum dated June 26, 2006, to site file: U.S. Envi-ronmental Protection Agency, accessed December 3, 2010, at http://loggerhead.epa.gov/arweb/public/pdf/2062825.pdf.
U.S. Environmental Protection Agency, 2010, NPL Site Narra-tive for Salford Quarry, accessed October 1, 2010, at: http://www.epa.gov/superfund/sites/npl/nar1490.htm
VanHouten, F.B., 1962, Cyclic sedimentation and the origin of analcime-rich Upper Triassic Lockatong Formation, west-central New Jersey and adjacent Pennsylvania: American Journal of Science, v. 260 no. 8, p. 561–576.
Vengosh, Avner, and Pankratov, Irena, 1998, Chloride/bromide and chloride/fluoride ratios of domestic sewage effluents and associated contaminated ground water: Ground Water, v. 36, no. 5, p. 815–824.
White, K.E., and Sloto, R.A., 1990, Base-flow frequency char-acteristics of selected Pennsylvania streams: U.S. Geologi-cal Survey Water-Resources Investigations Report 90–4169, 67 p.
Wiedemeier, T.H., Swanson, M.A., Moutoux, D.E., Gordon, E.K., Wilson, J.T., Wilson, B.H., Kampbell, D.H., Haas, P.E., Miller, R.N., Hansen, J.E., and Chapelle, F.H., 1998, Technical protocol for evaluating natural attenuation of chlorinated solvents in ground water: U.S. Environmental Protection Agency report EPA/600/R-98/128, accessed February 14, 2012, at http://www.epa.gov/superfund/health/conmedia/gwdocs/protocol.htm.
Winston, R.B., 2000, Graphical user interface for MOD-FLOW, version 4: U.S. Geological Survey Open-File Report 00–315, 27 p.
Table 6. Water levels in wells used for calibration of the groundwater-flow model for North Penn Area 7 Superfund site, Upper Gwynedd Township and vicinity, Montgomery County, Pennsylvania.—Continued
[USGS, U.S. Geological Survey; UTM-18, Universal Transverse Mercator, zone 18; NAD 27, North American Datum of 1927; --. no data; altitude in meters above North American Vertical Datum of 1929; GPS, Global Positioning System]
USGS well
identifier1
Owner’s well
name or number
UTM-18/NAD 27 coordinates
(meters)
Altitude of open interval (meters)
Altitude of measured water levels (meters)
Data source2
Location method
USGS site identifier
Easting NorthingTop of
intervalBottom of interval
1996 calibration
head
2000 calibration
head
2005 calibration
head
62 L-3 476031.6 4454323.5 102.14 -6.07 -- 98.94 -- c Surveyed 40142807516550167 L-8 475198.3 4455205.6 93.39 10.18 95.75 -- -- b Surveyed 40145607517300168 L-9 474698.3 4453930.4 95.59 -41.87 86.22 87.02 87.80 a Surveyed 40141507517510169 L-10 474614.6 4454327.8 88.33 19.75 87.31 -- -- a Surveyed 40142707517540172 L-13 476650.6 4452806.2 94.82 14.97 97.71 94.19 102.78 c Surveyed 40133807516280180 475084.2 4455217.8 57.30 1.83 95.63 -- -- a Surveyed 40145407517340181 LB6 475550.4 4454741.5 94.49 -2.13 92.90 -- -- a Surveyed 40144207517150182 LB5 475426.0 4456017.1 89.12 -19.69 91.14 -- -- a Surveyed 40152307517180190 Ford 2 475894.6 4452773.9 94.34 21.79 -- 94.68 -- c Map 401337075170001
135 Ford 3 475752.0 4452590.1 66.60 -18.14 -- 94.15 -- c Map 401331075170601138 475996.3 4453934.4 108.69 -13.84 102.49 100.19 -- a Surveyed 401415075165601143 L-21 473750.5 4454693.4 80.77 -32.00 88.18 -- -- a Map 401439075183101147 Ford 4 476035.8 4452743.4 92.35 -5.18 -- 95.52 -- c Map 401336075165401152 AO1 476207.0 4455360.7 101.22 46.06 93.38 -- -- a Surveyed 401503075164301154 475829.7 4454932.1 99.21 49.53 93.39 -- -- a Surveyed 401447075170301157 475245.5 4455567.4 82.88 10.33 95.43 -- -- a Surveyed 401507075173001163 474854.8 4455113.3 94.24 11.64 95.79 -- -- b Surveyed 401453075174401164 474925.4 4454959.8 94.52 -19.78 95.10 -- -- a Surveyed 401448075174101174 CL-2 476163.2 4452060.5 95.59 62.07 -- 95.92 -- c Map 401315075164901175 RI-7I3 476252.0 4451808.6 104.32 61.65 -- 98.54 -- c Map 401306075164401498 L-23 474203.9 4455370.7 76.99 -66.26 97.94 -- -- a Surveyed 401501075181201618 476496.1 4455538.2 96.86 6.79 93.14 -- -- a Surveyed 401506075163501621 AO4 476096.5 4456005.3 80.56 -22.16 94.70 -- -- a Surveyed 401521075164901623 L-24 474841.5 4456444.2 70.41 -54.56 93.52 -- -- a Surveyed 401536075174101624 475310.0 4456197.7 69.22 -92.32 91.83 -- -- a Surveyed 401527075172601630 471391.9 4455841.9 82.30 48.77 70.64 -- -- b Map 401516075201101704 L-26 475650.3 4456241.4 71.14 -25.48 91.17 -- -- a Surveyed 401532075170801930 472916.8 4452846.1 66.45 42.06 72.80 -- -- a Map 401339075190601
92 Groundwater System and Simulation of Flow for North Penn Area 7 Superfund Site, Montgomery County, Pennsylvania
Table 6. Water levels in wells used for calibration of the groundwater-flow model for North Penn Area 7 Superfund site, Upper Gwynedd Township and vicinity, Montgomery County, Pennsylvania.—Continued
[USGS, U.S. Geological Survey; UTM-18, Universal Transverse Mercator, zone 18; NAD 27, North American Datum of 1927; --. no data; altitude in meters above North American Vertical Datum of 1929; GPS, Global Positioning System]
94 Groundwater System and Simulation of Flow for North Penn Area 7 Superfund Site, Montgomery County, Pennsylvania
Table 6. Water levels in wells used for calibration of the groundwater-flow model for North Penn Area 7 Superfund site, Upper Gwynedd Township and vicinity, Montgomery County, Pennsylvania.—Continued
[USGS, U.S. Geological Survey; UTM-18, Universal Transverse Mercator, zone 18; NAD 27, North American Datum of 1927; --. no data; altitude in meters above North American Vertical Datum of 1929; GPS, Global Positioning System]
a, 1996 data used in 1999 North Penn Area 6 model (except at wells 498, 618, and 624, which were probably in error) b, 1996 data not used in 1999 North Penn Area 6 model c, 2000 data d, 2000 data for wells first measured for 2000 water-level map e, 2005 data from new monitor wells at North Penn Area 7
3Well MG-175 orginally drilled as production well for Spra-Fin and later converted to screened monittor well RI-7I in 2004.
For additional information:DirectorU.S. Geological Survey215 Limekiln RoadNew Cumberland, PA 17070
http://pa.water.usgs.gov/
Document prepared by the West Trenton Publishing Service Center