34
2016 3 0 2016 0 7

2016
30 201607

`
01 EDITORIAL
02 EQUITY MARKET OVERVIEW
03 DEBT MARKET OVERVIEW
04 MACRO DEVELOPMENTS - GLOBAL
05 MACRO DEVELOPMENTS - INDIA
06 FIXED INCOME
09 EQUITY MARKETS
13 COMMODITIES
15 CURRENCY MARKETS
16 CORE RECOMMENDED FUNDS - EQUITY
19 CORE RECOMMENDED FUNDS - DEBT
25 SATELLITE FUNDS
26 MACRO INDICATORS
28 OTHER OFFERINGS
30 RISKOMETER
31 DISCLAIMER
CONTENTS
NOVEMBER

EDITORIAL
01November 2016 Investime
November has started off with a big bang with plethora of events on both the global and domestic front. The most awaited event of 2016, the US presidential election has come to an end with Mr. Donald Trump being elected as the 45th president of the United States of America, in a most dramatic election seen in the recent past. This kept the global markets swinging either ways due to uncertainty of the outcome till the last minute. With this big event coming to an end, one more event that investors across the world are waiting cautiously is the US Fed rate decision in the month of December. While the whole world was focusing on the outcome of the US presidential elections, back in India, the Government of India has come down heavy on the age old monster- “Black Money”. As a positive surprise, and at a most unexpected time, the Government of India has made Rs.500 and Rs.1000 notes illegal from midnight of November 8, 2016. This coupled with the ongoing process of US presidential election, spooked Indian equity markets, which lost more than 1000 points on Sensex at one point in the day on November 9, 2016 (and later recovered and ended down 338 points). However, both Indian and global markets seem to have digested the surprise election of Trump as US President, and despite the initial volatility and correction, have now recovered a bulk of their losses.
In a step towards making GST a reality, the GST Council in the first week of November has come to a consensus on the rate structure and recommended four tax brackets; but clarity on the item-wise details is yet to emerge.
In the month of October, global equity markets closed positive after registering subdued gains in the earlier month. All the major indices closed flat to positive in the month of October except key US markets. In October, Brazil (+11.2%), Japan (+5.9%) Spain (+4.4%) and China (+3.2%) were the best performers. Nifty closed flat in the month of October with a return of 0.3% MoM on the back of weak global cues. The Q2FY17 earnings season has been in-line so far. On the currency front, Japanese yen depreciated during the month of October but continues to remain the best performing currency among its peers over the past year. INR may face some pressure in November as almost USD 18 billion of FCNR redemptions are due. Liquidity may tighten during the time, and rupee may also witness some volatility (if coupled with global factors) but RBI expressed that it can counter any volatility or liquidity tightness.
On the commodities front, Oil prices have been trading in the range of USD 39 - 52 per barrel over the past 3-4 months now, mainly supported by the expectations of production freeze/ cuts from OPEC and Non-OPEC members. Gold prices continued its downfall due to USD strengthening and expectations of a US Fed rate hike in December .Gold prices were down 2.94% in October and was up 11.79% on a Y-o-Y basis as of October end .
On the fixed income front, G-Sec yields have softened across all maturities in October. The 1Yr and 5Yrs G-sec yields softened by 17bps each while the 3 yrs and 10 yrs yields softened by 15bps and 2bps respectively. The RBI Monetary Policy Committee in its first meeting in early October, has cut the Repo rate by 25bps. We may see another 25bps rate cut by end of this financial year provided CPI inflation remains under control.
While volatility in the global and domestic markets may stay in the short term (majorly due to global factors) investments can be done in a staggered manner presently. Any major fall or correction in the markets could be used as an entry opportunity for the long term.
Bhavesh SanghviExecutive Vice President & Head - Wealth ManagementAditya Birla Money Limited.Guest Editor

Indian equity markets have been a key beneficiary of the pro–emerging market sentiment which contributed to robust FPI inflows in the last few months. Further, benign global crude oil prices and some key policy reforms by the government have kept investor interest buoyant. However, geopolitical tensions coupled with lingering possibility of interest rate hike by the US Fed have limited the upward trajectory.
Though urban discretionary demand continues to show green shoots, rural consumption has stayed weak. We believe the effect of normal monsoons and 7th pay commission hikes are yet to be seen in the rural consumption. Meanwhile, lower capacity utilization, high corporate leverage and sluggish growth in bank credit has restricted the private investment growth. However, there has been a significant drop in the bond yields in the current calendar year and RBI has also obliged the market with rate cuts, though transmission of these rate cuts is yet to happen. We believe post transmission, the tone would be set for softening interest cost, which in turn would be instrumental in paving the way for financial leverage. Subsequently, we could see demand for retail products and hence recovery in the domestic cyclical sectors.
The gap between CPI and WPI has tapered from 9% in September 2015 to just 1.3% in September 2016. A sustainable increase in WPI could support sales growth for corporates. This, coupled with capex from the public sector would be instrumental in kicking off the investment cycle. We believe the economic recovery will be led by a revival in consumption and government spending.
Outcome of US Presidential Elections, US Fed’s stance on interest rates, remaining earnings for 2QFY17 would be the near term drivers for Indian equities. Given the intrinsic nature of reforms in India, we believe that underlying economic prospects may continue to improve, although the pace of recovery could be slower than expected. We believe that upside potential due to the re-rating appears limited as valuations across market-cap segments are now above their long period averages. Nevertheless, investing in companies (which may not be the momentum players) having attractive valuations along with the potential of sustainable earnings growth would be the key for generating alpha over the long term.
Anand Radhakrishnan, CIO, Equities, Franklin Templeton Asset Management (India) Pvt. Ltd.
02
EQUITY OVERVIEW
MARKET
Earnings season so far
The 2QFY17 earnings season has been in sync with market expectations on headline numbers front. However, in terms of certain important parameters such as upgrade/downgrade ratio and earnings breadth, the numbers have been better than market expectations. Early sectoral trends show dismal results being displayed by technology and healthcare sector. While technology sector has borne the brunt of broad macro uncertainty coupled with slowness in spending by the BFSI vertical, aftermath of regulatory inspections continue to weigh on healthcare sector. In terms of volume growth, the trend has been varied with auto sector volumes remaining robust and cement and consumption sectors showing subdued volume growth. Margin expansion has been decent barring technology and healthcare sector. All in all earnings growth is not yet there across the board. We believe that the earnings growth which was expected in FY17 on an all sector basis could take more time and is likely to spill over into the next financial year.
With markets trading at valuations close to the long term average, we could see some near term volatility. Globally, outcome of US Presidential Elections and US Fed’s stance on interest rates are the two most awaited events. On the domestic front, earnings recovery, implementation of the Goods and Services Tax (GST), Reserve Bank of India’s (RBI) take on interest rates and upcoming State elections would be closely tracked by market participants. We believe that they are likely to have short term impact and not de-rail long term growth prospect as the structural drivers of Indian economy continue to remain intact.
The current market valuations are close to the historical long term averages. As midcaps have significantly outperformed their large cap peers in the last 12 months, they continue to trade at a premium compared to large caps. We are vary about pockets of overvaluation. Hence, visibility of earnings growth and strong managements remains our core guiding principle along with valuations.
November 2016 Investime

3.04.05.06.07.08.09.0
10.011.012.0
Dec
12
Mar
13
Jun
13
Sep
13
Dec
13
Mar
14
Jun
14
Sep
14
Dec
14
Mar
15
Jun
15
Sep
15
Dec
15
Mar
16
Jun
16
Sep
16
CPI 10 Year Gsec Yield Core CPI
Source: Kotak Institutional Equities, Bloomberg
Source: Bloomberg, Reserve Bank of India, Kotak Institutional Equity Research, E = Estimate.
Improving Macros 2014-15 2015-16 2016-17EGDP Growth (%) 7.2 7.6 7.6CPI Inflation 6.0 4.9 5.0Fiscal Deficit (% Of GDP) 4.1 3.9 3.5CAD(% of GDP) 1.4 1.1 1.0FDI (% of GDP) 1.5 1.8 2.2Interest Rates (10 Yr Yield %) 7.8 7.5 N.A.
DEBT MARKET OVERVIEW
Over the course of the last few years we (HDFC AMC) have consistently highlighted our view that interest rates in India are headed lower over the medium term. The 10-year benchmark yield is currently trading at 6.82% which is down by nearly 200 bps from its level of 8.80% in December 2013. Despite this large fall in yields, there is further downward bias to bond yields in our opinion. Sharp appreciation in the US dollar and / or faster than expected policy rate hike by the US Fed can be a source of risk to our view.
India, currently is better placed amongst large economies of the world. With expected growth of over 7.5% in the current fiscal, India is one of the fastest growing economy.
Fall in yields is much less than fall in inflation
The decline in 10-year benchmark G-Sec yield from its peak level of 8.80% in December 2013 is significantly less than the fall in CPI as can be seen in chart below. Consequently, the prevailing real yields available on government bonds are still quite high.
Still high differential with US yields
The chart below shows the difference between Indian and US 10 year yields over the past decade. As it can be seen
Anil Bamboli, Senior Fund Manager, HDFC Asset Management Company Limited
03
the differential is at nearly 5% and this provides room for yields in India to head lower even in a rising yield environment in US, in our opinion.
RBI Stance
In its first credit policy review under the newly constituted Monetary Policy Committee (MPC) all six members voted in favour of reducing the repo rate by 25bps.
The MPC noted that inflation outlook has improved due to strong improvement in sowing this year along with supply side measures taken by the government which have led to negative momentum on food inflation. The MPC noted potential of some cost pressures that may emerge from the 7th Pay Commission award on house rent allowances and the increase in minimum wages which need to be monitored. On balance the headline CPI inflation target of 5% by March 17 is achievable with lower upside risks than envisaged at the time of monetary policy statements of June 16 and August 16.
In its post policy conference call, RBI also highlighted that the current 1.50% to 2.00% real neutral rate is a time bearing concept and with decline in global real rates the more appropriate real neutral rate for India is around 1.25%. This is a significant positive announcement and in our view will provide space for further easing of rates going forward.
Conclusion and Outlook
In a global environment wherein sovereign debt is trading at negative yields, and quantitative easing by some central banks (ECB, BoJ) is continuing, the availability of high positive real yields on Indian sovereign bonds makes them attractive to foreign investors. Given the significant improvement in India’s twin deficits (Current account deficit & fiscal deficit) and relatively stable currency outlook, FII debt inflows are likely to be strong going forward.
Additionally, still high real yields, low and stable level of core inflation, continuing weak private investments, and potential of strong capital flows from debt FPIs are all supportive of lower yields going forward. In line with the above, our recommendation to investors would be to remain invested in duration funds.
November 2016 Investime
DISCLAIMER: The views are expressed are as on 31st Oct, 2016 and are based on internal data, publicly available information and other sources believed to be reliable. Any calculations made are approximations, meant as guidelines only, which you must confirm before relying on them. The information contained in this document is for general purposes only. The document is given in summary form and does not purport to be complete. The document does not have regard to specific investment objectives, financial situation and the particular needs of any specific person who may receive this document. The information/ data herein alone are not sufficient and should not be used for the development or implementation of an investment strategy. The statements contained herein are based on our current views and involve known and unknown risks and uncertainties that could cause actual results, performance or events to differ materially from those expressed or implied in such statements. Past performance may or may not be sustained in future. Neither HDFC Asset Management Company Limited and HDFC Mutual Fund (the Fund) nor any person connected with them, accepts any liability arising from the use of this document. HDFC Mutual Fund/AMC is not guaranteeing/offering/ communicating any indicative yields or guaranteed returns on investments made in the scheme(s). The recipient(s) before acting on any information herein should make his/her/their own investigation and seek appropriate professional advice and shall alone be fully responsible / liable for any decision taken on the basis of information contained herein.MUTUAL FUND INVESTMENTS ARE SUBJECT TO MARKET RISKS, READ ALL SCHEME RELATED DOCUMENTS CAREFULLY.
Spread Between India and US 10 Year Yields (%)
2.0
3.0
4.0
5.0
6.0
7.0
Oct
05
Apr 0
6O
ct 0
6Ap
r 07
Oct
07
Apr 0
8O
ct 0
8Ap
r 09
Oct
09
Apr 1
0O
ct 1
0Ap
r 11
Oct
11
Apr 1
2O
ct 1
2Ap
r 13
Oct
13
Apr 1
4O
ct 1
4Ap
r 15
Oct
15
Apr 1
6O
ct 1
6
Source: Bloomberg

MACRO DEVELOPMENTS - GLOBAL
US
Eurozone
Two of the most awaited events globally are to take shape this quarter. While the wait for the US presidential election is over with Mr. Donald Trump being elected as the 45th President of United States of America, US Fed rate hike for 2016 (if any) is expected to be announced by the US Fed in December. The next FOMC meeting is scheduled for 13-14 December 2016. In its recent press release, the US Fed has emphasised that the labour market continues to strengthen and growth of economic activity has picked up from the modest pace seen in the first half of this year. It also stated that inflation has increased somewhat since earlier this year but is still below the Committee’s 2 % longer-run objective.
As per the advance estimate released by BEA (Bureau of Economic Analysis ), US economy expanded in the third quarter registering 2.9% YoY GDP growth compared to 1.4% in the second quarter (best since Q3 of 2014). PCE price index (Personal Consumption Expenditures) , one of the key indicators for monitoring US inflation, rose 0.2% in September on a month on month basis. Core PCE price Index (which excludes food and energy from PCE price index) stands at 1.7% yoy. US inflation target is 2%. Nonfarm payroll employment rose by 161,000 in October while the unemployment rate almost remained unchanged at 4.9%. Total nonfarm payroll employment data for the month of August was revised up from 167,000 to 176,000, and for September it was revised up from 156,000 to 191,000.
The Euro area economy seems to be growing on a moderate pace. Preliminary estimates show that the Euro area GDP rose 0.3 % in the third quarter compared to the previous quarter. Annual HICP inflation for euro area in September came at 0.4% (up from 0.2% in August). HICP (Harmonised Index of Consumer Prices) is an indicator for Consumer price inflation in the euro area. ECB (European Central Bank) aims to maintain annual inflation close to 2% over the medium term. Labour market conditions remain unchanged in the month of September at 10%
04
(August data has been revised downwards to 10% from earlier reported 10.1%). Consumer confidence in the Euro Area showed improvement which increased to -8 in October from -8.20 in September. Euro area manufacturing in October rose at a fastest pace since early 2014.
Purchasing Managers’ Index (PMI) for factories rose to 53.5 from 52.6 in September. Through its QE process, ECB almost bought more than EUR 1 trillion of assets to boost the economy. The current stimulus program is scheduled to be reviewed in December, ( just three months before QE’s current deadline). Meanwhile in UK, a fresh battle emerged in the process of Brexit. UK ‘s top court ruled that UK cannot trigger the process of leaving EU without the signoff from parliament. This news has sparked a jump in pound touching a four week high against US dollar.
China’s economy expanded for the third consecutive quarter registering 6.7% growth in Q3. CPI inflation increased to 1.9% in September up from 1.3% in the previous month. China’s PMI (Purchasing Managers’ Index) in October jumped to 51.2 from 50.4 in September. Exports declined in September registering -10 % on a year on year basis signalling at continued weak global demand.
India’s macroeconomic picture continues to improve aided by good monsoon and growth driven policy decisions by the government. India’s CPI for September came at a 13-month low of 4.3% yoy. Exports for September came in at 4.6 % yoy touching a 22-month high.
Japan’s exports continue its downward trend which declined 6.9% yoy in September, following a 9.6% fall in August. It is a 12th straight month of decline in exports. Japan’s core inflation decreased 0.50% yoy in September. Bank of Japan (BoJ) recently pushed its estimated timing of achieving its inflation target of 2% to FY’18 from FY’17 previously.
Asia
November 2016 Investime

MACRO DEVELOPMENTS - INDIA
INDIAN MACRO-ECONOMY
The economic growth is expected to pick up with normal monsoon aiding agricultural growth & rural demand and 7th pay commission aiding urban consumption. The accommodative stance of monetary policy and comfortable liquidity conditions should support a revival of credit. Accordingly, the growth projection of real gross value added (GVA) by RBI Monetary Policy Committee (MPC) for 2016-17 is retained at 7.6%.
Core sector which has 38% weightage in the IIP rose to 3 month high and came in at 5.01% in September compared to 3.17% in August 2016. The core sector index includes eight sectors namely steel, cement, coal, refinery, natural gas, crude oil, fertilizers and electricity generation. Sustained growth in the core sector may help IIP reverse its negative trend seen in the past two months. The rise in the core sector was mainly due to steel production and refinery output. Steel production continued to rise at a healthy double digit rate (16.35%) while cement production maintained momentum and rose to 5.52%. Refinery products output shot up to 9.28% in September compared to 3.46% in August 2016. Coal, crude oil and natural gas continued to record negative growth and came in at 5.78%, 4.10% and 5.49% respectively. Fertilizer grew by 2.01% in September, after rising 5.74% in the previous month while electricity generation rose by 2.15% after a 0.15% rise in August 2016. Core sector’s cumulative growth during April to September, 2016-17 was 4.57% vs 2.65% during the same period last year.
Nikkei India Manufacturing PMI rose to a 22 month high at 54.4 in October against 52.1 in September. Reading above 50 indicates expansion while reading below 50 points to contraction. The rise was on account of increase in new orders, purchasing activity and output. Manufacturing PMI has been above 50 for straight 10 months in a row. High demand in festival season has helped consumer goods to register strong expansion in output and new orders, outperforming intermediate and investment goods once again. New business orders were mainly from the domestic markets while rate of growth in new business from abroad market eased to a 3 month
05November 2016 Investime
Source: CMIE
Coal (5.78) (9.20) 2.06 4.38%Crude oil (4.10) (3.99) (0.09) 5.22%Natural gas (5.49) (5.78) 0.87 1.71%Refinery products 9.28 3.46 0.47 5.94%Fertilizers 2.01 5.74 18.30 1.25%Steel 16.35 16.95 (0.89) 6.68%Cement 5.52 3.09 (1.61) 2.41%Electricity 2.15 0.15 11.45 10.32%Core Sector 5.01 3.17 3.71 37.90%
Categories Sep-16 Aug-16 Sep-15 Weight
Core Sector Growth Rate (%)
low. However, the spurt in business did not translate in new jobs. Manufacturing employment remained unchanged in October.
Nikkei India Services PMI rose to 54.5 in October against 52 in September due to sharp rise in new orders. The upturn was supported by greater client requests and improved demand conditions but employment levels were unchanged over the month. Overall, the seasonally adjusted Nikkei India Composite PMI Output Index rose to 55.4 from 52.4 in September (sharpest in four years).
According to government data, fiscal deficit for the first half of the financial year stood at Rs. 4.48 lakh crore which is 83.9% of the budgeted estimates (BE) of Rs. 5.34 lakh crore for FY17. This was attributed to rise in capital and revenue expenditure. Total revenue receipts were at Rs. 5.8 lakh crore (40.1% of BE) while total expenditure outgo was at Rs. 10.2 lakh crore (52% of BE). The corresponding period in 2015-16 fiscal deficit was 68.1% of BE for that year. Receipts from disinvestment, tax buoyancy and black money scheme may help the government to meet its fiscal deficit target (3.5% of GDP).
Good rainfall, higher crop under cultivation and supply management measures announced by the government may help ease food inflation further. The RBI seems to be comfortable with CPI at 4% within a band of +/- 2%. Though there are certain upside risks to inflation like the 7th pay commission, minimum wage increase and GST.
Nikkei India Service PMI
Source: CMIE
54.3
51.4
54.353.7
51.050.3
51.9
54.7
52
54.5
Jan-
16
Feb-
16
Mar
-16
Apr-
16
May
-16
Jun-
16
Jul-1
6
Aug-
16
Sep-
16
Oct
-16
Nikkei India Mfg. PMI
Source: CMIE
51.1 51.1
52.4
50.5 50.7
51.7 51.852.6
52.1
54.4
Jan-
16
Feb-
16
Mar
-16
Apr-
16
May
-16
Jun-
16
Jul-1
6
Aug-
16
Sep-
16
Oct
-16
06
FIXED INCOME - GLOBAL
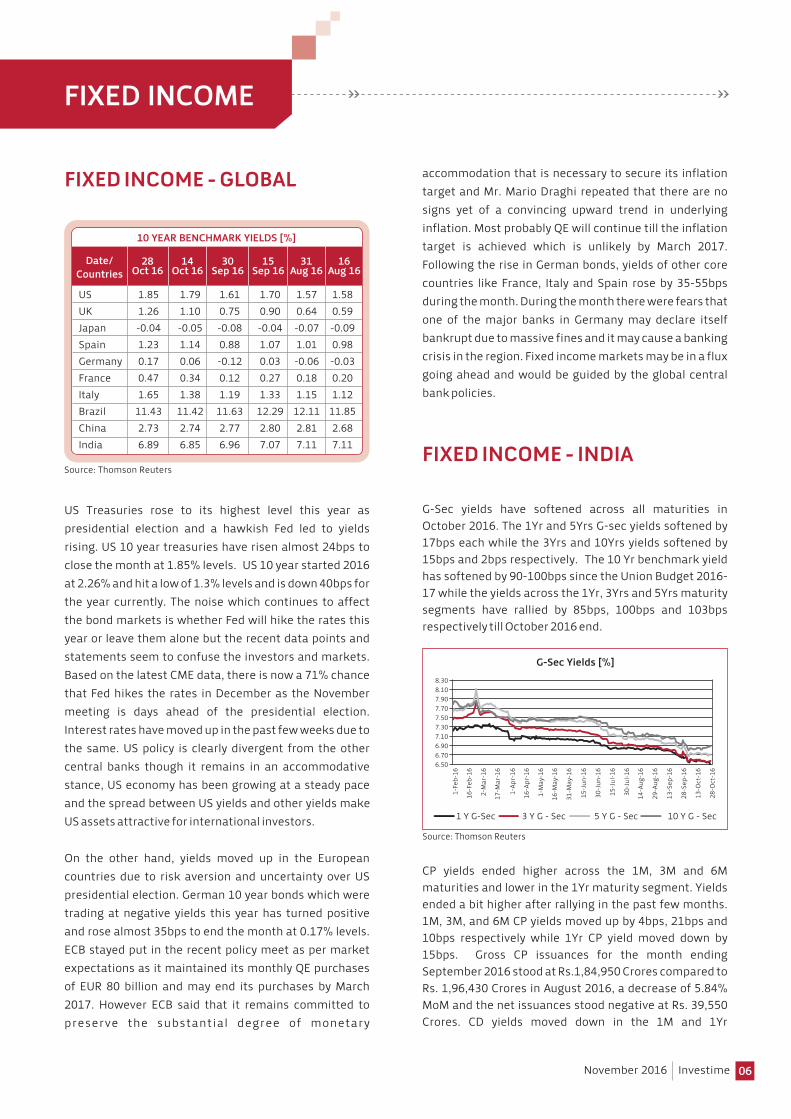
US Treasuries rose to its highest level this year as presidential election and a hawkish Fed led to yields rising. US 10 year treasuries have risen almost 24bps to close the month at 1.85% levels. US 10 year started 2016 at 2.26% and hit a low of 1.3% levels and is down 40bps for the year currently. The noise which continues to affect the bond markets is whether Fed will hike the rates this year or leave them alone but the recent data points and statements seem to confuse the investors and markets. Based on the latest CME data, there is now a 71% chance that Fed hikes the rates in December as the November meeting is days ahead of the presidential election. Interest rates have moved up in the past few weeks due to the same. US policy is clearly divergent from the other central banks though it remains in an accommodative stance, US economy has been growing at a steady pace and the spread between US yields and other yields make US assets attractive for international investors.
On the other hand, yields moved up in the European countries due to risk aversion and uncertainty over US presidential election. German 10 year bonds which were trading at negative yields this year has turned positive and rose almost 35bps to end the month at 0.17% levels. ECB stayed put in the recent policy meet as per market expectations as it maintained its monthly QE purchases of EUR 80 billion and may end its purchases by March 2017. However ECB said that it remains committed to preserve the substantial degree of monetary
FIXED INCOME
10 YEAR BENCHMARK YIELDS [%]
Date/Countries
28Oct 16
US 1.85 1.79 1.61 1.70 1.57 1.58UK 1.26 1.10 0.75 0.90 0.64 0.59Japan -0.04 -0.05 -0.08 -0.04 -0.07 -0.09Spain 1.23 1.14 0.88 1.07 1.01 0.98Germany 0.17 0.06 -0.12 0.03 -0.06 -0.03France 0.47 0.34 0.12 0.27 0.18 0.20Italy 1.65 1.38 1.19 1.33 1.15 1.12Brazil 11.43 11.42 11.63 12.29 12.11 11.85China 2.73 2.74 2.77 2.80 2.81 2.68India 6.89 6.85 6.96 7.07 7.11 7.11
Source: Thomson Reuters
14Oct 16
30 Sep 16
15Sep 16
31Aug 16
16Aug 16
accommodation that is necessary to secure its inflation target and Mr. Mario Draghi repeated that there are no signs yet of a convincing upward trend in underlying inflation. Most probably QE will continue till the inflation target is achieved which is unlikely by March 2017. Following the rise in German bonds, yields of other core countries like France, Italy and Spain rose by 35-55bps during the month. During the month there were fears that one of the major banks in Germany may declare itself bankrupt due to massive fines and it may cause a banking crisis in the region. Fixed income markets may be in a flux going ahead and would be guided by the global central bank policies.
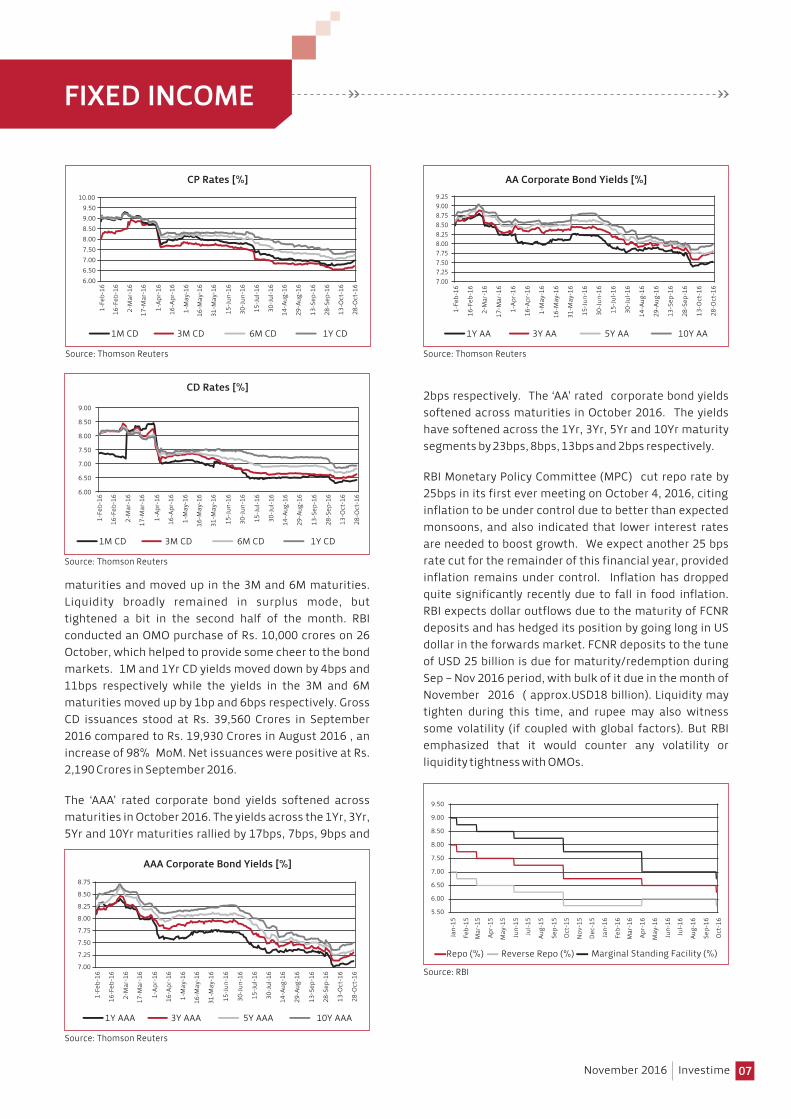
G-Sec yields have softened across all maturities in October 2016. The 1Yr and 5Yrs G-sec yields softened by 17bps each while the 3Yrs and 10Yrs yields softened by 15bps and 2bps respectively. The 10 Yr benchmark yield has softened by 90-100bps since the Union Budget 2016-17 while the yields across the 1Yr, 3Yrs and 5Yrs maturity segments have rallied by 85bps, 100bps and 103bps respectively till October 2016 end.
CP yields ended higher across the 1M, 3M and 6M maturities and lower in the 1Yr maturity segment. Yields ended a bit higher after rallying in the past few months. 1M, 3M, and 6M CP yields moved up by 4bps, 21bps and 10bps respectively while 1Yr CP yield moved down by 15bps. Gross CP issuances for the month ending September 2016 stood at Rs.1,84,950 Crores compared to Rs. 1,96,430 Crores in August 2016, a decrease of 5.84% MoM and the net issuances stood negative at Rs. 39,550 Crores. CD yields moved down in the 1M and 1Yr
FIXED INCOME - INDIA
November 2016 Investime
6.506.706.907.107.307.507.707.908.108.30
1-Fe
b-16
16-F
eb-1
6
2-M
ar-1
6
17-M
ar-1
6
1-Ap
r-16
16-A
pr-1
6
1-M
ay-1
6
16-M
ay-1
6
31-M
ay-1
6
15-J
un-1
6
30-J
un-1
6
15-J
ul-1
6
30-J
ul-1
6
14-A
ug-1
6
29-A
ug-1
6
13-S
ep-1
6
28-S
ep-1
6
13-O
ct-1
6
28-O
ct-1
6
G-Sec Yields [%]
Source: Thomson Reuters
1 Y G-Sec 3 Y G - Sec 5 Y G - Sec 10 Y G - Sec
07
maturities and moved up in the 3M and 6M maturities. Liquidity broadly remained in surplus mode, but tightened a bit in the second half of the month. RBI conducted an OMO purchase of Rs. 10,000 crores on 26 October, which helped to provide some cheer to the bond markets. 1M and 1Yr CD yields moved down by 4bps and 11bps respectively while the yields in the 3M and 6M maturities moved up by 1bp and 6bps respectively. Gross CD issuances stood at Rs. 39,560 Crores in September 2016 compared to Rs. 19,930 Crores in August 2016 , an increase of 98% MoM. Net issuances were positive at Rs. 2,190 Crores in September 2016.
The ‘AAA’ rated corporate bond yields softened across maturities in October 2016. The yields across the 1Yr, 3Yr, 5Yr and 10Yr maturities rallied by 17bps, 7bps, 9bps and
FIXED INCOME
2bps respectively. The ‘AA’ rated corporate bond yields softened across maturities in October 2016. The yields have softened across the 1Yr, 3Yr, 5Yr and 10Yr maturity segments by 23bps, 8bps, 13bps and 2bps respectively. RBI Monetary Policy Committee (MPC) cut repo rate by 25bps in its first ever meeting on October 4, 2016, citing inflation to be under control due to better than expected monsoons, and also indicated that lower interest rates are needed to boost growth. We expect another 25 bps rate cut for the remainder of this financial year, provided inflation remains under control. Inflation has dropped quite significantly recently due to fall in food inflation. RBI expects dollar outflows due to the maturity of FCNR deposits and has hedged its position by going long in US dollar in the forwards market. FCNR deposits to the tune of USD 25 billion is due for maturity/redemption during Sep – Nov 2016 period, with bulk of it due in the month of November 2016 ( approx.USD18 billion). Liquidity may tighten during this time, and rupee may also witness some volatility (if coupled with global factors). But RBI emphasized that it would counter any volatility or liquidity tightness with OMOs.
November 2016 Investime
CD Rates [%]
Source: Thomson Reuters
6.00
6.50
7.00
7.50
8.00
8.50
9.00
1-Fe
b-16
16-F
eb-1
6
2-M
ar-1
6
17-M
ar-1
6
1-Ap
r-16
16-A
pr-1
6
1-M
ay-1
6
16-M
ay-1
6
31-M
ay-1
6
15-J
un-1
6
30-J
un-1
6
15-J
ul-1
6
30-J
ul-1
6
14-A
ug-1
6
29-A
ug-1
6
13-S
ep-1
6
28-S
ep-1
6
13-O
ct-1
6
28-O
ct-1
6
1M CD 3M CD 6M CD 1Y CD
6.006.507.007.508.008.509.009.50
10.00
1-Fe
b-16
16-F
eb-1
6
2-M
ar-1
6
17-M
ar-1
6
1-Ap
r-16
16-A
pr-1
6
1-M
ay-1
6
16-M
ay-1
6
31-M
ay-1
6
15-J
un-1
6
30-J
un-1
6
15-J
ul-1
6
30-J
ul-1
6
14-A
ug-1
6
29-A
ug-1
6
13-S
ep-1
6
28-S
ep-1
6
13-O
ct-1
6
28-O
ct-1
6
CP Rates [%]
Source: Thomson Reuters
1M CD 3M CD 6M CD 1Y CD
AAA Corporate Bond Yields [%]
Source: Thomson Reuters
1Y AAA 3Y AAA 5Y AAA 10Y AAA
7.00
7.25
7.50
7.75
8.00
8.25
8.50
8.75
1-Fe
b-16
16-F
eb-1
6
2-M
ar-1
6
17-M
ar-1
6
1-Ap
r-16
16-A
pr-1
6
1-M
ay-1
6
16-M
ay-1
6
31-M
ay-1
6
15-J
un-1
6
30-J
un-1
6
15-J
ul-1
6
30-J
ul-1
6
14-A
ug-1
6
29-A
ug-1
6
13-S
ep-1
6
28-S
ep-1
6
13-O
ct-1
6
28-O
ct-1
6
AA Corporate Bond Yields [%]
Source: Thomson Reuters
1Y AA 3Y AA 5Y AA 10Y AA
7.007.257.507.758.008.258.508.759.009.25
1-Fe
b-16
16-F
eb-1
6
2-M
ar-1
6
17-M
ar-1
6
1-Ap
r-16
16-A
pr-1
6
1-M
ay-1
6
16-M
ay-1
6
31-M
ay-1
6
15-J
un-1
6
30-J
un-1
6
15-J
ul-1
6
30-J
ul-1
6
14-A
ug-1
6
29-A
ug-1
6
13-S
ep-1
6
28-S
ep-1
6
13-O
ct-1
6
28-O
ct-1
6
Source: RBI
Repo (%) Reverse Repo (%) Marginal Standing Facility (%)
5.50
6.00
6.50
7.00
7.50
8.00
8.50
9.00
9.50
Jan-
15
Feb-
15
Mar
-15
Apr-
15
May
-15
Jun-
15
Jul-1
5
Aug-
15
Sep-
15
Oct
-15
Nov
-15
Dec
-15
Jan-
16
Feb-
16
Mar
-16
Apr-
16
May
-16
Jun-
16
Jul-1
6
Aug-
16
Sep-
16
Oct
-16

08
FIXED INCOME
On the investment front, we expect Short Term funds to do well in the next 1-2 years as RBI is focused to bring liquidity to neutral levels. This will be beneficial for the short-end of the curve (1month -3 years). Short term funds will also benefit from any further rate cuts as the first impact is always seen at the shorter end of the curve. However, short term rates may see some volatility due to the FCNR redemptions in November, but the situation has largely been covered by the RBI. Accrual funds are still offering attractive YTM’s and any improvement in the credit cycle going ahead may lead to capital gains plus attractive carry. Exposure into Accrual funds could be restricted to 20-30% of the overall portfolio as these funds carry credit risk. Currently Accrual funds are expected to benefit from falling short term rates. Any contraction in spreads is also expected to benefit accrual funds.
We had given a strong call to invest in long duration funds at 10 year yield of 7.8-7.85% levels. The old 10 year benchmark is was trading around 6.80-6.90% levels at the end of October, and has come down significantly since the Union Budget 2016-17. The 10-year yield may soften by 20-25 bps further, but the risk-reward scenario for long duration funds is not looking as attractive as before. With long term bond yields coming down by 100-130 bps, the potential for yields to come down by a large margin appears to be limited. Therefore, fresh allocation to long duration funds is not suggested at this juncture (our outlook cut from neutral to underweight). Existing investors in long duration funds may book profits partially, especially if they have completed three years of holding period (for tax efficiency). However, if the RBI cuts rates by more than 25 bps, then we will re-visit our view on long duration funds.
November 2016 Investime
Currently we prefer the shorter end of the curve. Investors can consider Ultra-short, Short Term and Accrual/Credit Opportunities funds depending on their investment horizon and risk profile. Short term rates are expected to continue to benefit from easy liquidity conditions. However, liquidity could tighten intermittently during the FCNR redemptions (esp. in the month of Nov).
09
EQUITY MARKETS
EQUITY - GLOBAL
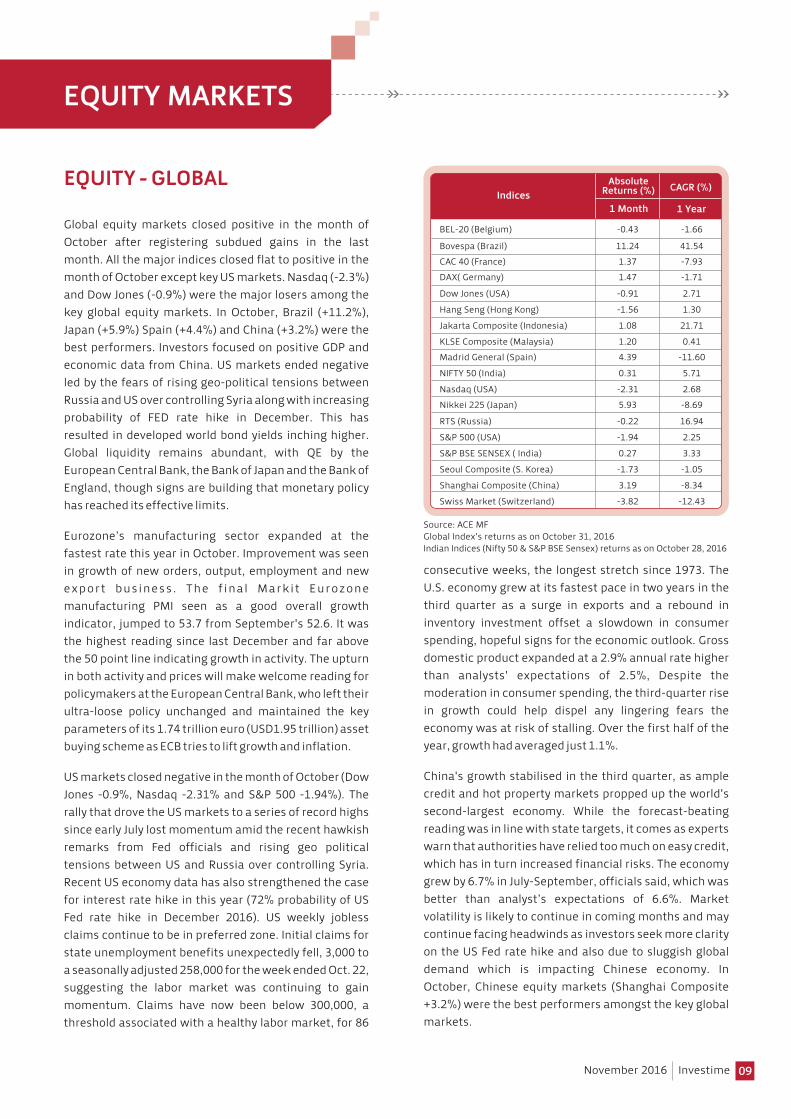
Global equity markets closed positive in the month of October after registering subdued gains in the last month. All the major indices closed flat to positive in the month of October except key US markets. Nasdaq (-2.3%) and Dow Jones (-0.9%) were the major losers among the key global equity markets. In October, Brazil (+11.2%), Japan (+5.9%) Spain (+4.4%) and China (+3.2%) were the best performers. Investors focused on positive GDP and economic data from China. US markets ended negative led by the fears of rising geo-political tensions between Russia and US over controlling Syria along with increasing probability of FED rate hike in December. This has resulted in developed world bond yields inching higher. Global liquidity remains abundant, with QE by the European Central Bank, the Bank of Japan and the Bank of England, though signs are building that monetary policy has reached its effective limits.
Eurozone’s manufacturing sector expanded at the fastest rate this year in October. Improvement was seen in growth of new orders, output, employment and new export business. The f inal Markit Eurozone manufacturing PMI seen as a good overall growth indicator, jumped to 53.7 from September's 52.6. It was the highest reading since last December and far above the 50 point line indicating growth in activity. The upturn in both activity and prices will make welcome reading for policymakers at the European Central Bank, who left their ultra-loose policy unchanged and maintained the key parameters of its 1.74 trillion euro (USD1.95 trillion) asset buying scheme as ECB tries to lift growth and inflation.
US markets closed negative in the month of October (Dow Jones -0.9%, Nasdaq -2.31% and S&P 500 -1.94%). The rally that drove the US markets to a series of record highs since early July lost momentum amid the recent hawkish remarks from Fed officials and rising geo political tensions between US and Russia over controlling Syria. Recent US economy data has also strengthened the case for interest rate hike in this year (72% probability of US Fed rate hike in December 2016). US weekly jobless claims continue to be in preferred zone. Initial claims for state unemployment benefits unexpectedly fell, 3,000 to a seasonally adjusted 258,000 for the week ended Oct. 22, suggesting the labor market was continuing to gain momentum. Claims have now been below 300,000, a threshold associated with a healthy labor market, for 86
BEL-20 (Belgium) -0.43 -1.66
Bovespa (Brazil) 11.24 41.54 CAC 40 (France) 1.37 -7.93DAX( Germany) 1.47 -1.71
Dow Jones (USA) -0.91 2.71
Hang Seng (Hong Kong) -1.56 1.30
Jakarta Composite (Indonesia) 1.08 21.71
KLSE Composite (Malaysia) 1.20 0.41 Madrid General (Spain) 4.39 -11.60
NIFTY 50 (India) 0.31 5.71
Nasdaq (USA) -2.31 2.68
Nikkei 225 (Japan) 5.93 -8.69
RTS (Russia) -0.22 16.94
S&P 500 (USA) -1.94 2.25
S&P BSE SENSEX ( India) 0.27 3.33
Seoul Composite (S. Korea) -1.73 -1.05
Shanghai Composite (China) 3.19 -8.34
Swiss Market (Switzerland) -3.82 -12.43
1 Year
CAGR (%)Absolute Returns (%)
1 MonthIndices
Source: ACE MFGlobal Index's returns as on October 31, 2016Indian Indices (Nifty 50 & S&P BSE Sensex) returns as on October 28, 2016
consecutive weeks, the longest stretch since 1973. The U.S. economy grew at its fastest pace in two years in the third quarter as a surge in exports and a rebound in inventory investment offset a slowdown in consumer spending, hopeful signs for the economic outlook. Gross domestic product expanded at a 2.9% annual rate higher than analysts' expectations of 2.5%, Despite the moderation in consumer spending, the third-quarter rise in growth could help dispel any lingering fears the economy was at risk of stalling. Over the first half of the year, growth had averaged just 1.1%.
China's growth stabilised in the third quarter, as ample credit and hot property markets propped up the world's second-largest economy. While the forecast-beating reading was in line with state targets, it comes as experts warn that authorities have relied too much on easy credit, which has in turn increased financial risks. The economy grew by 6.7% in July-September, officials said, which was better than analyst’s expectations of 6.6%. Market volatility is likely to continue in coming months and may continue facing headwinds as investors seek more clarity on the US Fed rate hike and also due to sluggish global demand which is impacting Chinese economy. In October, Chinese equity markets (Shanghai Composite +3.2%) were the best performers amongst the key global markets.
November 2016 Investime

10
EQUITY - INDIA
During the month of October, Nifty closed flat with a return of 0.3% MoM on the back of weak global cues and geopolitical concerns. Also, passive fund inflows tapered over the month led by FIIs resulting into outflows, the first since Feb 2016. RBI’s Monetary Policy Committee (MPC) unanimously decided to cut repo rate by 25bps in its first policy meeting in line with market expectations. BSE Oil & Gas (+8.1%) and Metals (+5.3%) and were the top performers in October. Technology underperformed for the fifth consecutive month (down 2% MoM), as revenue growth and guidance of IT companies in the seasonally strong Q2FY17 was slower than anticipated, affected by global headwinds.
The Q2FY17 earnings season has been in-line so far. Of the 30 Nifty companies that have declared their results, 12/14 companies have reported earnings ahead of/in-line with our estimates while only 4 missed consensus estimates. Nifty reported PAT for the 30 companies have grown at 7.4% v/s expectation of 3.4%.
EQUITY MARKETS
November 2016 Investime
7.00
9.00
11.00
13.00
15.00
17.00
19.00
21.00
Apr-
06
Oct
-06
Apr-
07
Oct
-07
Apr-
08
Oct
-08
Apr-
09
Oct
-09
Apr-
10
Oct
-10
Apr-
11
Oct
-11
Apr-
12
Oct
-12
Apr-
13
Oct
-13
Apr-
14
Oct
-14
Apr-
15
Oct
-15
Apr-
16
Oct
-16
Average P/E 15x
1 STDEV (-) 13x
Source: Bloomberg
Nifty P/E (x)
1Yr Fwd Blended P/E (x) AVG P/E 1 STDEV (+) 1 STDEV (-)
NIFTY 50 0.31 5.71
S&P BSE 100 0.70 7.58
S&P BSE 200 0.94 9.01
S&P BSE 500 1.31 9.80
S&P BSE AUTO Index -0.28 20.61
S&P BSE BANKEX 1.54 12.99
S&P BSE Capital Goods 2.01 -4.17
S&P BSE Consumer Durables 1.65 8.31
S&P BSE FMCG 0.64 4.93
S&P BSE Health Care 1.19 -9.55
S&P BSE IT -2.29 -12.25
S&P BSE METAL Index 5.35 38.26
S&P BSE Mid-Cap 1.83 21.49
S&P BSE OIL & GAS Index 8.08 34.39
S&P BSE PSU 6.03 14.93
S&P BSE Power Index 0.95 4.07
S&P BSE Realty Index 2.64 11.14
S&P BSE SENSEX 0.27 3.33
S&P BSE Small-Cap 5.27 17.48
S&P BSE TECk Index -2.23 -11.22
1 Year
CAGR (%)Absolute Returns (%)
1 MonthIndices
Source: ACE MFPerformance as on October 28, 2016
Source: Bloomberg
1Yr Fwd Blended P/B (x) AVG P/B 1 STDEV (+) 1 STDEV (-)
Nifty P/B (x)
1.00
1.50
2.00
2.50
3.00
3.50
4.00
4.50
Apr-
06
Oct
-06
Apr-
07
Oct
-07
Apr-
08
Oct
-08
Apr-
09
Oct
-09
Apr-
10
Oct
-10
Apr-
11
Oct
-11
Apr-
12
Oct
-12
Apr-
13
Oct
-13
Apr-
14
Oct
-14
Apr-
15
Oct
-15
Apr-
16
Oct
-16
Average P/B 2.5x
1 STDEV (-) 2.04x
Source: Bloomberg
Sensex P/E (x)
1Yr Fwd Blended P/E (x) AVG P/E 1 STDEV (+) 1 STDEV (-)
6.00
8.00
10.00
12.00
14.00
16.00
18.00
20.00
22.00
24.00
Apr-
06
Oct
-06
Apr-
07
Oct
-07
Apr-
08
Oct
-08
Apr-
09
Oct
-09
Apr-
10
Oct
-10
Apr-
11
Oct
-11
Apr-
12
Oct
-12
Apr-
13
Oct
-13
Apr-
14
Oct
-14
Apr-
15
Oct
-15
Apr-
16
Oct
-16
Average P/E 15x
1 STDEV (-) 13x
Source: Bloomberg
1Yr Fwd Blended P/B (x) AVG P/B 1 STDEV (+) 1 STDEV (-)
Sensex P/B (x)
1.00
1.50
2.00
2.50
3.00
3.50
4.00
4.50
Apr-
06
Oct
-06
Apr-
07
Oct
-07
Apr-
08
Oct
-08
Apr-
09
Oct
-09
Apr-
10
Oct
-10
Apr-
11
Oct
-11
Apr-
12
Oct
-12
Apr-
13
Oct
-13
Apr-
14
Oct
-14
Apr-
15
Oct
-15
Apr-
16
Oct
-16
Average P/B 2.61x
1 STDEV (-) 2.08x

11
EQUITY MARKETS
November 2016 Investime
Capital Goods/Infrastructure
FY16 was one of the tough years for the infrastructure sector. Order books were stagnant and growing marginally (on account of lower pvt capex); Working capital cycle had elongated and with high cost of debt profitability was badly impacted. Governments “Make in India” initiative seems to gather momentum and is likely to be a key growth driver going forward. High Interest cost regime will likely come to an end which will further aid the profitability in the medium to long term. Govt has taken various steps to put the economy back on track which will lead to revival in the capex cycle. Overall FY17 seems to be a promising year with lower commodity prices and lower interest cost to aid profitability.
Power
Overall Power sector had been marred on account of under recoveries which put stress on their financials and balance sheet. However, situation is likely to improve as a) power regulator is likely to pass an order which will be beneficial to the UMPP players b) Fuel costs have fallen dramatically which will aid the company’s profitability. Governments focus on renewable space seems to have got tremendous response with solar being in the forefront. Solar power prices hit a new low in 2016 with a lot of foreign players showing strong interest to invest in the solar space. The sector is likely to benefit from the increased clarity on the regulatory hurdle front and reforms undertaken by the centre. PLF is expected to pick up on back of improved clarity on fuel linkage.
However, excluding Axis Bank, which reported sharp rise in provisions, Nifty earnings are up 11% v/s expectation of 3.6%. Government has been taking various reform measures which shall bring long term capital in India and benefit the economy. Overall, market remains constructive on the market from a medium to long term perspective. The key sectors plays are autos, cement, high quality private banking, NBFCs, select pharma and uniquely positioned MNCs.
Valuations remain close to long term averages on 1year forward basis with Nifty index trading at P/E of 18x on FY17E and at P/E of 16x on FY18E. We re-iterate our investment strategy of being stock specific and focus on high growth, well-managed companies with strong cashflows and credible management teams.
Banking & Financial Services
Banking continues to showcase divergent performance with retail focussed private banks delivering 20-30 per cent PAT growth whereas PSU & corporate banks reeling under NPA pressure. RBI asset quality review has revealed the perturbing reality about the stress in PSU & corporate focussed private bank’s balance sheet. However, it is noteworthy that even post such large additions to stressed assets, some of the managements have been guiding that stress may continue for some more while which makes us cautious as Q3FY17 results are nearby. We continue to recommend ‘Avoid’ on all PSU banks.
Structurally, Private banks shall continue to grab the credit market share. These banks continued to grow their credit, NII and PAT at healthy pace of 20-30 per cent in Q2FY17. Asset quality of these private banks which have retail credit exposure and working capital corporate credit continue to deliver stable asset quality. HDFC Bank, Indusind Bank, Kotak Mahindra and Yes bank have reported strong results with stable asset quality. Any correction in good quality private banks shall be used as an opportunity to accumulate these stocks. Among NBFCs, we prefer Mortgage finance and Consumer finance companies considering their steady growth and stable asset quality.
1.00
1.50
2.00
2.50
3.00
3.50
4.00
4.50
5.00
Apr-
06
Oct
-06
Apr-
07
Oct
-07
Apr-
08
Oct
-08
Apr-
09
Oct
-09
Apr-
10
Oct
-10
Apr-
11
Oct
-11
Apr-
12
Oct
-12
Apr-
13
Oct
-13
Apr-
14
Oct
-14
Apr-
15
Oct
-15
Apr-
16
Oct
-16
Average P/B 2.42x
1 STDEV (-) 1.87x
Source: Bloomberg
1Yr Fwd Blended P/B (x) AVG P/B 1 STDEV (+) 1 STDEV (-)
MSCI Finance P/B (x)

EQUITY MARKETS
12November 2016 Investime
Information Technology
IT industry is changing drastically more towards discretionary spending backed by disruptive technology and digital innovation. Leadership in the industry will change towards a company having higher revenue from discretionary related services. Q2FY17 performance for most companies was below estimates, marked by lower growth and bleak outlook. Investment in the sector should be stock specific. INR USD movement will help the companies to report better operating margins in a period when topline growth is challenged by cross currency volatility and global slowdown. MSCI IT index is trading at a discount to its 10-year average P/E.
Pharmaceuticals
We continue to remain neutral on the pharma sector, though we continue to prefer players present in niche and specialized product portfolio with focus on regulated markets.
Source: Bloomberg
1Yr Fwd Blended P/B (x) AVG P/B 1 STDEV (+) 1 STDEV (-)
MSCI PHARMA P/E (x)
8.00
13.00
18.00
23.00
28.00
33.00
Apr-
06
Oct
-06
Apr-
07
Oct
-07
Apr-
08
Oct
-08
Apr-
09
Oct
-09
Apr-
10
Oct
-10
Apr-
11
Oct
-11
Apr-
12
Oct
-12
Apr-
13
Oct
-13
Apr-
14
Oct
-14
Apr-
15
Oct
-15
Apr-
16
Oct
-16
Average P/E 21x
1 STDEV (-) 18x
Source: Bloomberg
1Yr Fwd Blended P/B (x) AVG P/B 1 STDEV (+) 1 STDEV (-)
MSCI IT P/E (x)
7.00
12.00
17.00
22.00
27.00
32.00
Apr-
06
Oct
-06
Apr-
07
Oct
-07
Apr-
08
Oct
-08
Apr-
09
Oct
-09
Apr-
10
Oct
-10
Apr-
11
Oct
-11
Apr-
12
Oct
-12
Apr-
13
Oct
-13
Apr-
14
Oct
-14
Apr-
15
Oct
-15
Apr-
16
Oct
-16
Average P/E 17x
1 STDEV (-) 14x
Consumer Sector
With the implementation of the 7th Pay Commission, pay hike for (central and state) government employees, combined with a good monsoon, consumption will get a boost. The 23.5% increase in public sector salaries proposed by the 7th Pay Commission is worth 0.7% of GDP. Higher public sector wages will most likely contribute to strong consumption growth. We remain positive on domestic consumption sectors like Automobiles, Consumer Durables, FMCG and Consumer Discretionary.
13
COMMODITIES
Oil Market update
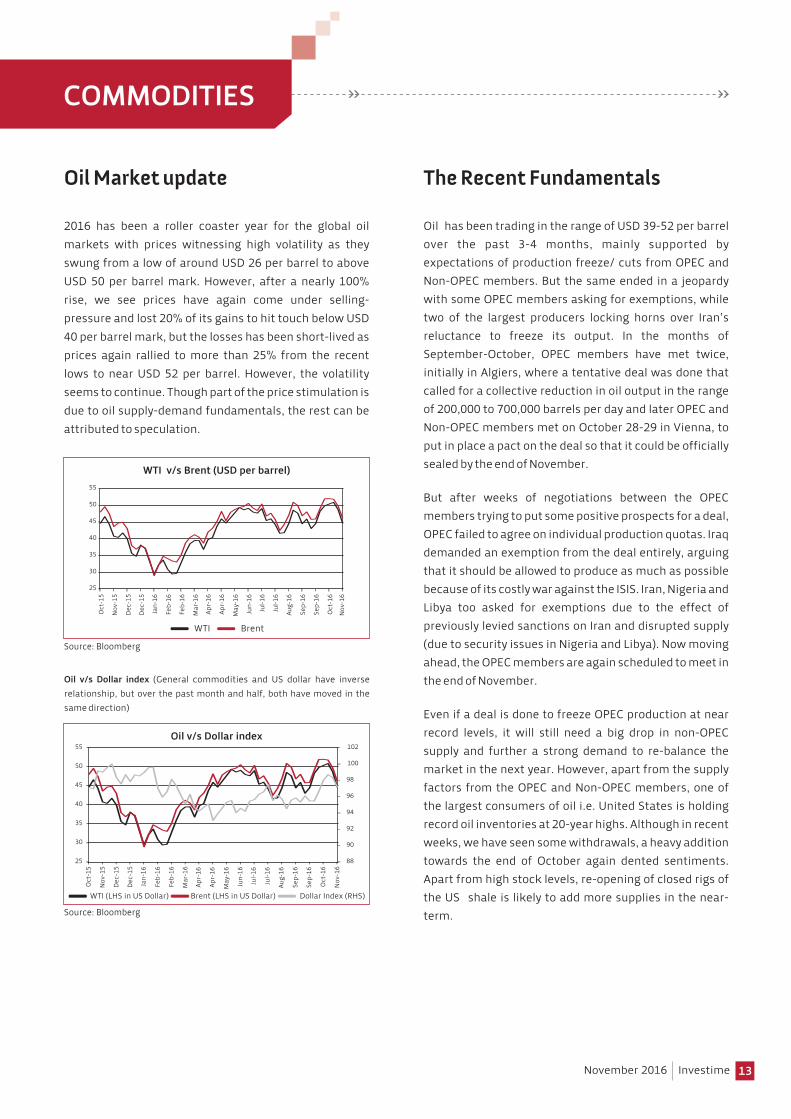
2016 has been a roller coaster year for the global oil markets with prices witnessing high volatility as they swung from a low of around USD 26 per barrel to above USD 50 per barrel mark. However, after a nearly 100% rise, we see prices have again come under selling-pressure and lost 20% of its gains to hit touch below USD 40 per barrel mark, but the losses has been short-lived as prices again rallied to more than 25% from the recent lows to near USD 52 per barrel. However, the volatility seems to continue. Though part of the price stimulation is due to oil supply-demand fundamentals, the rest can be attributed to speculation.
The Recent Fundamentals
Oil has been trading in the range of USD 39-52 per barrel over the past 3-4 months, mainly supported by expectations of production freeze/ cuts from OPEC and Non-OPEC members. But the same ended in a jeopardy with some OPEC members asking for exemptions, while two of the largest producers locking horns over Iran’s reluctance to freeze its output. In the months of September-October, OPEC members have met twice, initially in Algiers, where a tentative deal was done that called for a collective reduction in oil output in the range of 200,000 to 700,000 barrels per day and later OPEC and Non-OPEC members met on October 28-29 in Vienna, to put in place a pact on the deal so that it could be officially sealed by the end of November.
But after weeks of negotiations between the OPEC members trying to put some positive prospects for a deal, OPEC failed to agree on individual production quotas. Iraq demanded an exemption from the deal entirely, arguing that it should be allowed to produce as much as possible because of its costly war against the ISIS. Iran, Nigeria and Libya too asked for exemptions due to the effect of previously levied sanctions on Iran and disrupted supply (due to security issues in Nigeria and Libya). Now moving ahead, the OPEC members are again scheduled to meet in the end of November.
Even if a deal is done to freeze OPEC production at near record levels, it will still need a big drop in non-OPEC supply and further a strong demand to re-balance the market in the next year. However, apart from the supply factors from the OPEC and Non-OPEC members, one of the largest consumers of oil i.e. United States is holding record oil inventories at 20-year highs. Although in recent weeks, we have seen some withdrawals, a heavy addition towards the end of October again dented sentiments. Apart from high stock levels, re-opening of closed rigs of the US shale is likely to add more supplies in the near-term.
November 2016 Investime
Oil v/s Dollar index (General commodities and US dollar have inverse relationship, but over the past month and half, both have moved in the same direction)
Source: Bloomberg
WTI Brent
WTI v/s Brent (USD per barrel)
25
30
35
40
45
50
55
Oct
-15
Nov
-15
Dec
-15
Dec
-15
Jan-
16
Feb-
16
Feb-
16
Mar
-16
Apr-
16
Apr-
16
May
-16
Jun-
16
Jul-1
6
Jul-1
6
Aug-
16
Sep-
16
Sep-
16
Oct
-16
Nov
-16
Source: Bloomberg
WTI (LHS in US Dollar) Brent (LHS in US Dollar) Dollar Index (RHS)
88
90
92
94
96
98
100
102
25
30
35
40
45
50
55
Oct
-15
Nov
-15
Dec
-15
Dec
-15
Jan-
16
Feb-
16
Feb-
16
Mar
-16
Apr-
16
Apr-
16
May
-16
Jun-
16
Jul-1
6
Jul-1
6
Aug-
16
Sep-
16
Sep-
16
Oct
-16
Nov
-16
Oil v/s Dollar index

Current demand trend/
consumption
As per a recent report from the International Energy Agency, Global oil demand is expected to increase by 1.2 million barrels per day in the current year, with a similar expansion expected in 2017. But the growth rate continues to slow down, dropping from a 5-year high of 2.5 million barrels per day in third quarter of 2015 to a 4-year low of 0.8 million barrels per day in the third quarter of 2016, due to vanishing OECD growth and a marked deceleration in China. China's oil demand growth has almost vanished in the third quarter of 2016 compared to a year ago, pulled down by a substantial slowdown in industrial oil usage. Although the slowdown looks temporary, strong gains that were seen as recently in mid-2015 are unlikely to be repeated any time soon.
Oil demand from India has been robust; shipped-in a record 4.47 million barrels per day in September, about 4.4% more than the previous month. Apart from India and China, oil imports by United States has been rising with recent reports showing inflow of around 9 million barrels per day, up from an average 7.7 million barrels per day, an increase of 7% from a year earlier, as per EIA data. A surprise uptick in Russian demand gathered pace in August . Russian demand crossed 4 million barrels per day for the first time ever, rising by just over 4% y-o-y in August.
COMMODITIES
14November 2016 Investime
2500026000270002800029000300003100032000330003400035000
Apr-
10Ju
l-10
Oct
-10
Jan-
11Ap
r-11
Jul-1
1O
ct-1
1Ja
n-12
Apr-
12Ju
l-12
Oct
-12
Jan-
13Ap
r-13
Jul-1
3O
ct-1
3Ja
n-14
Apr-
14Ju
l-14
Oct
-14
Jan-
15Ap
r-15
Jul-1
5O
ct-1
5Ja
n-16
Apr-
16Ju
l-16
Oct
-16
Source: Bloomberg
OPEC Output (million barrels)
Source: Bloomberg
US Crude Oil Production (million barrels)
0
2000
4000
6000
8000
10000
12000
Jun-
13
Aug-
13
Oct
-13
Dec
-13
Feb-
14
Apr-
14
Jun-
14
Aug-
14
Oct
-14
Dec
-14
Feb-
15
Apr-
15
Jun-
15
Aug-
15
Oct
-15
Dec
-15
Feb-
16
Apr-
16
Jun-
16
Aug-
16
Oct
-16
Outlook
Overall fundamentally, oil may take a supply shock from some of the major oil producers or a might see a renewed pickup in demand from major oil consuming countries like the US, China and India, to re-balance the market and give oil bulls a renewed hope. Else rising oil output is likely to keep prices depressed under USD 50 per barrel.

15
USD has strengthened after being range bound for a while and is now close to the 100 level which has been a key resistance. DXY has crossed 100 levels twice since 2015 but gave up all its gains to trade lower. It will need a major catalyst to push past 100 levels and it is unlikely to be seen soon. On one hand, US Fed hike looms in December, while the presidential election may lead to some volatility in USD going ahead. On the economic front, data continues to remain positive and GDP growth for 2016 is expected to be around 2% but inflation still remains below the 2% target.. As per the CFTC data as of 25th October, funds continue to remain buyers of USD for the fifth consecutive week and the net long positions stands at USD 23.1 billion, the highest since Jan’16. The long positions correlate with the DXY index and some volatility maybe seen ahead of the November 8th presidential vote.
. ECB kept the policy rate on hold and even the monthly QE purchases at EUR 80 billion till March’17. Economic growth continues to remain weak and the impact of Brexit looms over the EUR. Policy divergence between Europe and US should see EUR weakening further towards 1.05-1.07 levels. Political risks continue to remain in the region as Italy holds a referendum on 4th December on constitutional reforms and if it fails then PM may have to resign. Fissures remain in the region as elections are due in Netherlands, France and Germany next year and deep integration remains vulnerable. As per CFTC data, EUR saw the largest selling against USD for the second consecutive week as short EUR positions increased to USD 20.6 billion, the highest since April 2015.
JPY depreciated 2.7% during the month to close at 104.69 levels, the highest in past 5 months. JPY weakness is a boon for the economy as it makes its exports competitive and Bank of Japan is content with a weak currency. Bank of Japan in the recent policy meet kept the rates on hold and tweaked its policy a bit.. As per CFTC data, despite the weakening of JPY, funds increased their long positions. In the near term, it may depend on the market flows and global events.
INR continues to remain range bound as it depreciated 0.23% for the month. Rupee didn’t move much despite FIIs selling in both equity and debt segment during the month to the tune of USD 1.8 billion. FIIs turned sellers in equity market for the first time since Feb’16 while debt market saw outflows due to rising US yields. Rupee is expected to see some volatility in November as most of the FCNR redemptions are due in November though the central bank has promised to supply liquidity when required.
CURRENCY MARKETS
November 2016 Investime
USD/
USD/
/USD
USD/
USD/
INR 67.52 67.02 66.96 66.61 66.79
EUR/USD 1.11 1.12 1.12 1.12 1.10
JPY 103.25 102.05 103.42 101.33 104.69
GBP 1.33 1.32 1.31 1.30 1.22
CHF 0.98 0.97 0.98 0.97 0.99
AUD 0.75 0.76 0.75 0.77 104.69
Currencies
Source: Thomson Reuters
30 Jun 16 29 Jul 16 31 Aug 16 30 Sep 16
USD/INR
Source: Thomson Reuters
EUR/USD
Source: Thomson Reuters
Source: Thomson Reuters
USD/YEN
GBP/USD
Source: Thomson Reuters
28 Oct 16
60.0061.0062.0063.0064.0065.0066.0067.0068.0069.0070.00
Oct
-14
Nov
-14
Dec
-14
Jan-
15Fe
b-15
Mar
-15
Apr-
15M
ay-1
5Ju
n-15
Jul-1
5Au
g-15
Sep-
15O
ct-1
5N
ov-1
5D
ec-1
5Ja
n-16
Feb-
16M
ar-1
6Ap
r-16
May
-16
Jun-
16Ju
l-16
Aug-
16Se
p-16
Oct
-16
Nov
-16
1.00
1.10
1.20
1.30
1.40
1.50
1.60
Oct
-14
Nov
-14
Dec
-14
Jan-
15Fe
b-15
Mar
-15
Apr-
15M
ay-1
5Ju
n-15
Jul-1
5Au
g-15
Sep-
15O
ct-1
5N
ov-1
5D
ec-1
5Ja
n-16
Feb-
16M
ar-1
6Ap
r-16
May
-16
Jun-
16Ju
l-16
Aug-
16Se
p-16
Oct
-16
Nov
-16
1.20
1.30
1.40
1.50
1.60
1.70
1.80
Oct
-14
Nov
-14
Dec
-14
Jan-
15Fe
b-15
Mar
-15
Apr-
15M
ay-1
5Ju
n-15
Jul-1
5Au
g-15
Sep-
15O
ct-1
5N
ov-1
5D
ec-1
5Ja
n-16
Feb-
16M
ar-1
6Ap
r-16
May
-16
Jun-
16Ju
l-16
Aug-
16Se
p-16
Oct
-16
Nov
-16
95.00
100.00
105.00
110.00115.00
120.00
125.00
130.00
Oct
-14
Nov
-14
Dec
-14
Jan-
15Fe
b-15
Mar
-15
Apr-
15M
ay-1
5Ju
n-15
Jul-1
5Au
g-15
Sep-
15O
ct-1
5N
ov-1
5D
ec-1
5Ja
n-16
Feb-
16M
ar-1
6Ap
r-16
May
-16
Jun-
16Ju
l-16
Aug-
16Se
p-16
Oct
-16
Nov
-16

16
Fund Manager
Particulars Birla SL Frontline Equity Fund(G)
LARGE CAP FUNDS
Franklin India Bluechip Fund(G)
ICICI Pru Focused BlueChip Eq Fund(G)
Category Average
BenchmarkScheme Names
NIFTY 50
AUM (Rs. Crs.) Sep-2016 13,901 7,705 11,683Absolute Returns (%)1 Month -0.33 -0.54 -0.52 -0.38 -1.233 Months 2.54 0.17 1.57 2.15 -0.336 Months 15.47 10.24 13.90 13.64 10.08CAGR (%)1 Year 13.03 8.85 11.32 9.40 5.702 Years 11.55 9.55 8.47 8.44 3.733 Years 21.08 18.07 18.40 17.83 12.285 Years 17.01 12.97 14.77 13.22 10.00Inception Date 30-Aug-02 1-Dec-93 23-May-08RatiosSD Annualised (%) 14.91 13.72 14.43Treynor 1.35 1.18 1.15
Mahesh Patil Anand Radhakrishnan & Roshi Jain
Manish Gunwani & Shalya Shah
Exit Load 1% on or before 1Y, Nil after 1Y
1% on or before 1Y 1% on or before 1Y, Nil after 1Y
Source: ACEMF
Performance as on October 28, 2016Benchmark: Category benchmark indices considered for respective categories
*Risk-free rate assumed to be 6.70%**Standard Deviation and Treynor Ratio are calculated on absolute basis using 3 year historical data of monthly returns
Please refer to RISKOMETER on page no 30 for all Risk related information about the above mentioned schemes.
Fund Manager
Particulars Franklin India High Growth Cos Fund(G)
MULTI CAP FUNDS
ICICI Pru Value Discovery Fund(G)
Kotak Select Focus Fund(G)
Category Average
BenchmarkScheme Names
NIFTY 500
AUM (Rs. Crs.) Sep-2016 5,043 14,461 6,365 8,846Absolute Returns (%)1 Month 1.17 -0.37 0.38 -0.30 0.29 -0.283 Months 3.78 1.04 4.31 2.12 3.95 2.126 Months 14.23 12.40 19.02 13.58 15.89 13.84CAGR (%)1 Year 10.57 9.95 15.25 13.98 11.93 9.732 Years 13.74 11.98 15.27 14.29 11.58 7.653 Years 29.96 31.36 25.88 23.97 23.20 17.175 Years 22.48 22.83 19.36 19.12 16.13 12.11Inception Date 26-Jul-07 16-Aug-04 11-Sep-09 20-Jan-06RatiosSD Annualised (%) 17.34 17.34 15.86 13.42Treynor 1.85 1.97 1.65 1.78
Anand Radhakrishnan & Roshi Jain
Mrinal Singh & Shalya Shah
Harsha Upadhyaya
Exit Load 1% on or before 2Y 1% on or before 12M,Nil after 12M
1% on or before 1Y, Nil after 1Y
Sohini Andani
SBI BlueChip Fund-Reg(G)
1% on or before 1Y, Nil after 1Y
CORE RECOMMENDED FUNDS - EQUITY
November 2016 Investime

17
*Risk-free rate assumed to be 6.70%**Standard Deviation and Treynor Ratio are calculated on absolute basis using 3 year historical data of monthly returns
Please refer to RISKOMETER on page no 30 for all Risk related information about the above mentioned schemes.
Source: ACEMF
Lock-in of 3 years (for ELSS)Performance as on October 28, 2016Benchmark: Category benchmark indices considered for respective categories
Fund Manager
Particulars Birla SL Tax Relief '96(G)
EQUITY LINKED SAVINGS SCHEMES (ELSS)
Category Average
BenchmarkScheme Names
NIFTY 500
AUM (Rs. Crs.) Sep-2016 2,459 1,436 2,391 3,596 5,792Absolute Returns (%)1 Month 0.53 0.45 0.02 0.98 1.21 0.40 -0.283 Months 4.30 5.63 2.69 5.09 5.87 4.24 2.126 Months 14.49 21.02 11.17 17.21 16.43 16.25 13.84CAGR (%)1 Year 13.75 20.57 9.78 13.38 13.72 12.75 9.732 Years 17.06 16.16 12.64 10.66 8.39 11.91 7.653 Years 27.55 27.05 24.95 25.14 32.60 23.29 17.175 Years 19.30 20.11 17.44 17.96 20.82 16.28 12.11Inception Date 10-Mar-08 18-Jan-07 10-Apr-99 19-Aug-99 21-Sep-05RatiosSD Annualised (%) 14.97 16.14 13.80 15.56 21.12Treynor 1.83 1.69 1.81 1.63 1.69
Ajay Garg Rohit Singhania Lakshmikanth Reddy &
R. Janakiraman
George Heber Joseph &
Shalya Shah
Ashwani Kumar
Fund Manager
Particulars Canara Rob Emerg Eq Fund-Reg(G)
MID / SMALL CAP FUNDS
Franklin India Prima Fund(G)
HDFC Mid-Cap Opportunities
Fund(G)
Category Average
BenchmarkScheme Names
Nifty Free Float Midcap 100
AUM (Rs. Crs.) Sep-2016 1,298 4,566 13,022 2,728.59Absolute Returns (%)1 Month 1.53 2.15 0.71 2.07 1.90 0.943 Months 8.60 5.97 8.57 6.61 7.52 7.806 Months 22.88 19.38 24.12 18.07 21.13 20.34CAGR (%)1 Year 17.25 20.18 22.12 21.75 18.06 18.902 Years 21.10 20.04 19.81 22.29 18.81 17.153 Years 43.52 36.20 37.48 40.01 36.63 29.415 Years 27.42 25.64 24.82 27.49 23.54 16.93Inception Date 11-Mar-05 1-Dec-93 25-Jun-07 29-Mar-05RatiosSD Annualised (%) 21.34 15.94 16.45 15.23Treynor 2.59 2.80 2.87 NA
Ravi Gopalakrishnan & Kartik Mehta
R. Janakiraman & Hari Shyamsunder
Chirag Setalvad & Rakesh Vyas
Exit Load 1% on or before 1Y, Nil after 1Y
1% on or before 1Y 1% on or before 1Y, NiL after 1Y
Sohini Andani
SBI Magnum MidCap Fund-Reg(G)
1% on or before 1Y, Nil after 1Y
DSPBR Tax Saver
Fund-Reg(G)
Franklin India Taxshield(G)
ICICI Pru LT Equity Fund
(Tax Saving)(G)
Reliance Tax Saver
(ELSS) Fund(G)
CORE RECOMMENDED FUNDS - EQUITY
November 2016 Investime

18
Fund Manager
Particulars Edelweiss Arbitrage
Fund-Reg(G)
ARBITRAGE FUNDS
Category Average
BenchmarkScheme Names
Crisil Liquid Fund Index
Bhavesh Jain & Kartik Soral
Kayzad Eghlim & Manish Banthia
Yogik Pitti & Meenakshi Dawar
Deepak Gupta Neeraj Kumar
ICICI Pru Equity-Arbitrage Fund(G)
IDFC Arbitrage
Fund-Reg(G)
Kotak Equity Arbitrage
Scheme(G)
SBI Arbitrage Opportunities Fund-Reg(G)
AUM (Rs. Crs.) Sep-2016 1,517 5,419 2,474 4,604 862Simple Annualised Returns (%)3 Months 7.00 6.89 6.62 7.10 6.80 7.04 6.726 Months 6.88 6.93 6.63 6.84 6.65 6.90 7.28CAGR (%)1 Year 6.73 6.72 6.34 6.63 6.26 6.56 7.612 Year 7.52 7.21 6.98 7.22 6.99 7.15 8.013 Years 7.77 7.62 7.91 7.58 7.56 8.455 Years 8.62 8.26 8.43 8.21 8.18 8.55Inception Date 27-Jun-14 30-Dec-06 21-Dec-06 29-Sep-05 03-Nov-06Exit Load 0.25% on or
before 30D, Nil after 30D
0.25% on or before 1M, Nil after 1M
0.25% on or before 30D, Nil after 30D
0.50% on or before 1M, Nil after 1M
Fund Manager
Particulars Birla SL Balanced '95
Fund(G)
BALANCED FUNDS
Category Average
BenchmarkScheme Names
CRISIL Balanced Fund - Aggressive
Index
Mahesh Patil & Pranay Sinha
Atul Bhole & Vikram Chopra
Chirag Setalvad & Rakesh Vyas
Sankaran Naren & Atul Patel
Sanjay Parekh & Amit Tripathi
DSPBR Balanced
Fund-Reg(G)
HDFC Balanced Fund(G)
ICICI Pru Balanced Fund(G)
Reliance Reg Savings Fund-
Balanced Plan(G)
AUM (Rs. Crs.) Sep-2016 4,237 1,953 7,391 3,719 3,476Absolute Returns (%)1 Month 0.27 0.79 0.77 0.14 0.33 0.41 -0.583 Months 3.33 6.88 4.61 5.43 2.90 3.63 1.016 Months 14.92 18.05 14.52 16.29 12.36 13.36 9.18CAGR (%)1 Year 14.80 15.98 13.27 15.12 10.92 11.30 7.952 Years 13.63 15.19 12.86 12.20 10.74 10.63 6.653 Years 22.77 23.43 24.89 22.65 22.73 19.87 12.275 Years 16.37 14.90 17.19 18.08 16.42 14.79 10.20Inception Date 10-Feb-95 27-May-99 11-Sep-00 3-Nov-99 10-Jun-05Exit Load 1% on or
before 365D, Nil after 365D
Nil upto 10% of investment within 12M,
1% exceding 10% of investment within 12M,
Nil after 12M
Nil upto 15% of investment and 1% in excess of
15% of investment on or
before 1Y, Nil after 1Y
Nil upto 20% of units and for
remaining - 1% on or before 1Y,
Nil after 1Y
Nil for 10% of investments and 1% for remaining on or before 12M,
Nil after 12M
Exposure (%)Debt 24.95 23.66 27.65 21.25 32.51Equity 69.04 72.34 67.74 72.15 64.12Cash & Equivalent 0.64 0.92 3.17 0.75 3.27
Please refer to RISKOMETER on page no 30 for all Risk related information about the above mentioned schemes.
Source: ACEMFPerformance as on October 28, 2016Benchmark: Category benchmark indices considered for respective categories
CORE RECOMMENDED FUNDS - EQUITY
November 2016 Investime

19
CORE RECOMMENDED FUNDS - DEBT
Fund Manager
Particulars Axis LiquidFund(G)
LIQUID FUNDS
Birla SL FRF-Short Term Plan(G)
ICICI Pru Money Market Fund(G)
Category Average
BenchmarkScheme Names
Crisil Liquid Fund Index
Month End AUM (Rs. Crs.) Sep-2016 9,105 3,177 9,234 7,322Month End Average Maturity (Days) Sep-2016 66 62 64 60Simple Annualised Returns (%)1 Month 6.74 6.93 6.78 6.73 6.58 6.183 Months 6.89 6.96 6.93 6.91 6.71 6.716 Months 7.31 7.40 7.35 7.35 7.08 7.27CAGR (%)1 Year 7.77 7.88 7.82 7.80 7.52 7.62Inception Date 9-Oct-09 13-Oct-05 8-Mar-06 17-Nov-06Credit Quality (%) Sep-2016AA/Equiv 2.80AA+ 4.60AAA & Equiv 90.94 66.02 101.03 82.77Cash & Equivalent -22.71 -12.68 -22.30 -5.17SOV 18.60 21.94 21.27 10.85
Devang Shah & Aditya Pagaria
Kaustubh Gupta & Sunaina da Cunha
Rahul Goswami & Nikhil Kabra
Krishna Venkat Cheemalapati &
Nitish Sikand
Invesco IndiaLiquid Fund(G)
Fund Manager
Particulars Kotak Floater-ST(G)
LIQUID FUNDS
Reliance Liquid-Treasury Plan(G)
Sundaram Money Fund-Reg(G)
Category Average
BenchmarkScheme Names
Crisil Liquid Fund Index
Month End AUM (Rs. Crs.) Sep-2016 9,426 20,722 5,416 7,135Month End Average Maturity (Days) Sep-2016 58 75 58 55Simple Annualised Returns (%)1 Month 6.77 6.81 6.70 6.76 6.58 6.183 Months 6.95 6.93 6.88 6.92 6.71 6.716 Months 7.37 7.35 7.29 7.34 7.08 7.27CAGR (%)1 Year 7.85 7.81 7.74 7.79 7.52 7.62Inception Date 14-Jul-03 9-Dec-03 8-Dec-05 1-Sep-04Credit Quality (%) Sep-2016AA/EquivAA+ 2.81 3.77AAA & Equiv 95.03 85.89 75.63 87.35Cash & Equivalent -19.48 -25.40 -11.08 -5.98SOV 24.45 22.59 19.13 13.30
Deepak Agrawal Anju Chhajer Dwijendra Srivastava &
Siddharth Chaudhary
Amit Somani
Tata Money Market Fund- A(G)
Please refer to RISKOMETER on page no 30 for all Risk related information about the above mentioned schemes.
Source: ACEMFNo Exit LoadPerformance as on October 28, 2016Benchmark: Category benchmark indices considered for respective categories
November 2016 Investime
20
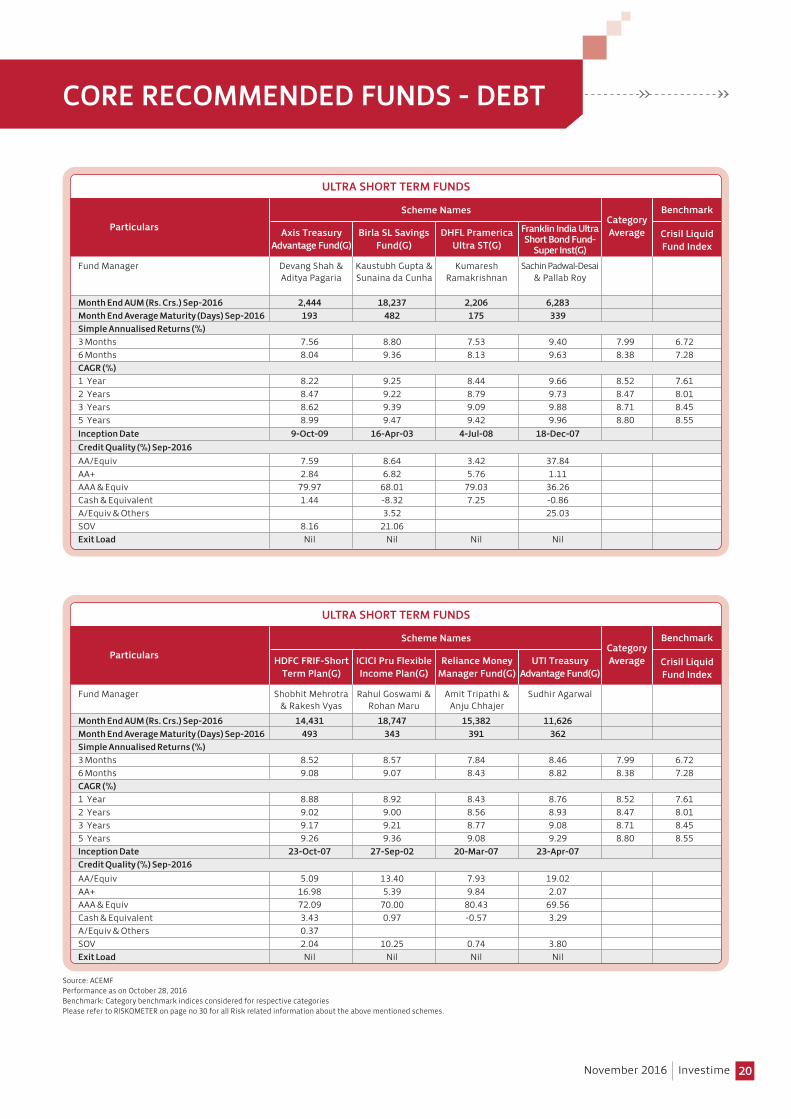
Fund Manager
Particulars Axis Treasury Advantage Fund(G)
ULTRA SHORT TERM FUNDS
Birla SL Savings Fund(G)
DHFL Pramerica Ultra ST(G)
Category Average
BenchmarkScheme Names
Crisil Liquid Fund Index
Month End AUM (Rs. Crs.) Sep-2016 2,444 18,237 2,206 6,283Month End Average Maturity (Days) Sep-2016 193 482 175 339Simple Annualised Returns (%)3 Months 7.56 8.80 7.53 9.40 7.99 6.726 Months 8.04 9.36 8.13 9.63 8.38 7.28CAGR (%)1 Year 8.22 9.25 8.44 9.66 8.52 7.612 Years 8.47 9.22 8.79 9.73 8.47 8.013 Years 8.62 9.39 9.09 9.88 8.71 8.455 Years 8.99 9.47 9.42 9.96 8.80 8.55Inception Date 9-Oct-09 16-Apr-03 4-Jul-08 18-Dec-07Credit Quality (%) Sep-2016AA/Equiv 7.59 8.64 3.42 37.84AA+ 2.84 6.82 5.76 1.11AAA & Equiv 79.97 68.01 79.03 36.26Cash & Equivalent 1.44 -8.32 7.25 -0.86A/Equiv & Others 3.52 25.03SOV 8.16 21.06Exit Load Nil Nil Nil Nil
Devang Shah & Aditya Pagaria
Kaustubh Gupta & Sunaina da Cunha
Kumaresh Ramakrishnan
Sachin Padwal-Desai & Pallab Roy
Franklin India Ultra Short Bond Fund-
Super Inst(G)
Please refer to RISKOMETER on page no 30 for all Risk related information about the above mentioned schemes.
Source: ACEMFPerformance as on October 28, 2016Benchmark: Category benchmark indices considered for respective categories
Fund Manager
Particulars HDFC FRIF-Short Term Plan(G)
ULTRA SHORT TERM FUNDS
ICICI Pru Flexible Income Plan(G)
Reliance Money Manager Fund(G)
Category Average
BenchmarkScheme Names
Crisil Liquid Fund Index
Month End AUM (Rs. Crs.) Sep-2016 14,431 18,747 15,382 11,626Month End Average Maturity (Days) Sep-2016 493 343 391 362Simple Annualised Returns (%)3 Months 8.52 8.57 7.84 8.46 7.99 6.726 Months 9.08 9.07 8.43 8.82 8.38 7.28CAGR (%)1 Year 8.88 8.92 8.43 8.76 8.52 7.612 Years 9.02 9.00 8.56 8.93 8.47 8.013 Years 9.17 9.21 8.77 9.08 8.71 8.455 Years 9.26 9.36 9.08 9.29 8.80 8.55Inception Date 23-Oct-07 27-Sep-02 20-Mar-07 23-Apr-07Credit Quality (%) Sep-2016AA/Equiv 5.09 13.40 7.93 19.02AA+ 16.98 5.39 9.84 2.07AAA & Equiv 72.09 70.00 80.43 69.56Cash & Equivalent 3.43 0.97 -0.57 3.29A/Equiv & Others 0.37SOV 2.04 10.25 0.74 3.80Exit Load Nil Nil Nil Nil
Shobhit Mehrotra & Rakesh Vyas
Rahul Goswami & Rohan Maru
Amit Tripathi & Anju Chhajer
Sudhir Agarwal
UTI Treasury Advantage Fund(G)
CORE RECOMMENDED FUNDS - DEBT
November 2016 Investime

Fund Manager
Particulars Axis Short Term Fund(G)
SHORT TERM FUNDS (CONSERVATIVE)
Birla SL Short Term Fund(G)
HDFC Short Term Opportunities Fund(G)
Category Average
BenchmarkScheme Names
Crisil Short Term Bond Index
Month End AUM (Rs. Crs.) Sep-2016 4,984 12,914 7,719Month End Average Maturity (Years) Sep-2016 3.00 2.69 1.67Simple Annualised Returns (%)3 Months 9.19 10.44 8.77 9.34 9.476 Months 9.62 10.82 9.47 9.88 10.23CAGR (%)1 Year 8.81 9.87 8.83 9.05 9.352 Years 9.05 9.83 9.13 8.92 9.423 Years 9.20 10.01 9.54 9.13 9.625 Years 9.02 9.84 9.39 9.12 9.26Inception Date 22-Jan-10 03-Mar-97 25-Jun-10Credit Quality (%) Sep-2016AA/Equiv - 1.37 4.66AA+ 5.93 9.47 5.06AAA & Equiv 72.98 51.84 72.40Cash & Equivalent 0.97 3.02 3.28A/Equiv & OthersSOV 20.13 34.30 14.61
Devang Shah Prasad Dhonde Anil Bamboli & Rakesh Vyas
Exit Load Nil Nil Nil
Fund Manager
Particulars Birla SL ST Opportunities
Fund(G)
Birla SL Treasury Optimizer
Plan(G)
DHFL Pramerica Short Maturity
Fund(G)
ICICI Pru Short Term
Plan(G)
Reliance STF(G)
SHORT TERM FUNDS (MODERATE / AGGRESSIVE)
Category Average
BenchmarkScheme Names
Crisil Short Term Bond
Index
AUM (Rs. Crs.) Sep-2016 4,876 6,893 1,711 7,360 13,573Month End Average Maturity (Years) Sep-2016 4.18 5.27 2.22 3.44 3.27Simple Annualised Returns (%)3 Months 11.37 12.35 10.38 10.55 9.94 9.34 9.476 Months 12.15 13.59 10.55 11.56 10.53 9.88 10.23CAGR (%)1 Year 10.69 11.45 9.52 9.90 9.27 9.05 9.352 Years 10.19 10.92 9.39 9.80 9.40 8.92 9.423 Years 10.42 11.13 9.66 9.96 9.67 9.13 9.625 Years 10.47 10.56 9.38 9.47 9.42 9.12 9.26Inception Date 9-May-03 05-May-08 27-Jan-03 25-Oct-01 18-Dec-02Credit Quality (%) Sep-2016AA/Equiv 28.35 3.80 24.10 6.93AA+ 10.69 6.59 12.51 3.05 9.25AAA & Equiv 20.97 38.79 59.46 52.89 65.21Cash & Equivalent 5.08 3.65 2.36 3.74 1.37SOV 34.91 47.17 1.58 33.39 24.17
Kaustubh Gupta & Sunaina da Cunha
Prasad Dhonde & Kaustubh Gupta
Nitish Gupta Manish Banthia Prashant Pimple
Exit Load 0.50% on or before 180D, Nil
after 180D
Nil Nil for 10% of investment and
0.75% for remaining
Investment on or before 6M, Nil
after 6M
0.25% on or before 7D, Nil after 7D
Nil
21Please refer to RISKOMETER on page no 30 for all Risk related information about the above mentioned schemes.
Source: ACEMFPerformance as on October 28, 2016Benchmark: Category benchmark indices considered for respective categories
CORE RECOMMENDED FUNDS - DEBT
November 2016 Investime

Fund Manager
Particulars Birla SL Dynamic Bond
Fund-Ret(G)
HDFC High Interest Fund-
Dynamic Plan(G)
ICICI Pru Dynamic Bond
Fund(G)
Reliance Dynamic Bond(G)
Tata Dynamic Bond Fund-
Plan A(G)
DYNAMIC BOND FUNDS
Category Average
BenchmarkScheme Names
Crisil Composite Bond
Fund Index
Month End AUM (Rs. Crs.) Sep-2016 13,419 1,908 1,257 4,712 1,162Average Maturity (Years) Sep-2016 16.39 13.12 7.11 13.71 6.99Month End YTM (%) Sep-2016 7.74 7.50 7.60 7.25 6.93Simple Annualised Returns (%)3 Months 12.86 14.61 13.00 13.96 11.86 12.33 13.646 Months 16.92 17.29 14.72 16.01 13.56 14.19 14.54CAGR (%)1 Year 12.32 12.34 11.66 11.39 9.72 10.23 11.522 Years 12.61 11.86 11.50 11.35 10.67 10.60 11.493 Years 12.18 11.71 11.23 11.01 10.56 10.20 11.535 Years 10.89 10.67 9.91 10.64 9.99 9.82 9.75Inception Date 27-Sep-04 28-Apr-97 12-Jun-09 15-Nov-04 03-Sep-03
Maneesh Dangi Anil Bamboli & Rakesh Vyas
Rahul Goswami Prashant Pimple Akhil Mittal
Exit Load 0.50% on or before 90D, Nil after 90D
0.50% on or before 6M, Nil after 6M
1% on or before 3M, Nil after 3M
1% on or Before 12M, Nil After
12M
0.50% on or before 180D, Nil
after 180D
22
Fund Manager
Particulars Birla SL Medium Term Fund(G)
DSPBR Income Opportunities Fund-Reg(G)
HDFC Corporate Debt Opportunities
Fund-(G)
HDFC STP(G)
Reliance Reg Savings Fund-Debt Plan(G)
ACCRUAL / CREDIT OPPORTUNITIES FUNDS
Category Average
BenchmarkScheme Names
Crisil Short Term Bond
Index
Month End AUM (Rs. Crs.) Sep-2016 8,086 4,942 8,811 3,584 7,661Average Maturity (Years) Sep-2016 2.69 3.08 3.79 2.02 2.25Month End YTM (%) Sep-2016 9.27 9.05 9.02 8.87 9.43Simple Annualised Returns (%)3 Months 11.26 10.91 12.20 10.44 11.35 11.03 9.476 Months 11.27 11.14 11.97 10.35 11.01 11.19 10.23CAGR (%)1 Year 10.16 10.41 10.76 9.87 9.88 9.62 9.352 Years 10.64 10.38 10.58 10.05 9.71 9.93 9.423 Years 10.84 10.44 10.26 9.91 9.98 9.625 Years 10.78 9.59 9.55 9.56 9.54 9.26Inception Date 25-Mar-09 13-May-03 25-Mar-14 28-Feb-02 10-Jun-05Credit Quality (%) Sep-2016AA/Equiv 52.19 25.89 35.53 30.57 42.68AA+ 8.56 4.10 9.14 9.12 20.21AAA & Equiv 18.01 44.38 20.64 23.18 4.39Cash & Equivalent 3.31 0.06 3.34 0.95 2.96A/Equiv & Others 10.06 25.05 29.78 31.41 23.60SOV 3.77 2.20Unrated 0.37 1.58 2.57 4.84
Maneesh Dangi Laukik Bagwe & Pankaj Sharma
Shobhit Mehrotra & Rakesh Vyas
Anil Bamboli & Rakesh Vyas
Prashant Pimple
Exit Load 1% on or before 365D, Nil after 365D
Nil for 10% of investment and
1% for remaining Investment on or before 12M, Nil
after 12M
Nil for 15% of Units and for
remaining investment 2% on or before 12M, 1% after 12M but on or before 24M,
0.50% after 24M but on or before
36M, Nil after 36M
Nil for 15% of Units and 0.75%
for remaining investment on or before 12M, Nil
after 12M
Nil for 10% of units and 1% for remaining units
on or before 12M, Nil after
12M
Please refer to RISKOMETER on page no 30 for all Risk related information about the above mentioned schemes.
Source: ACEMFPerformance as on October 28, 2016Benchmark: Category benchmark indices considered for respective categories
CORE RECOMMENDED FUNDS - DEBT
November 2016 Investime
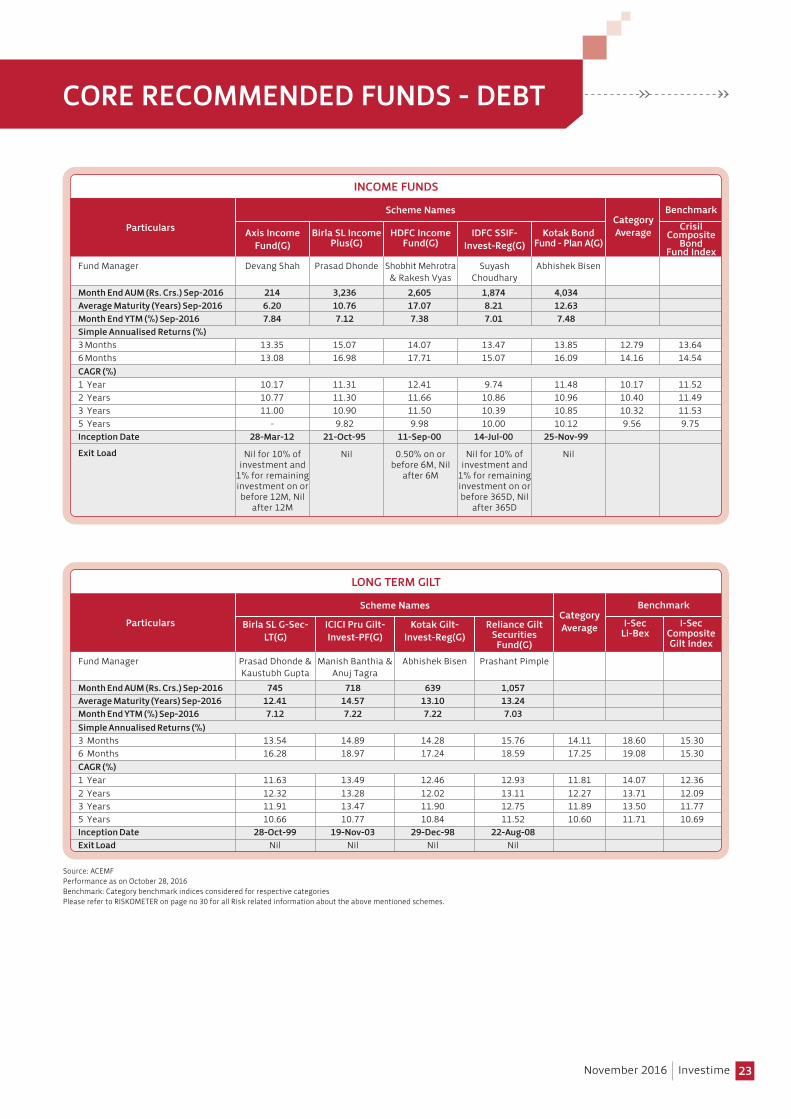
23
Fund Manager
Particulars Axis Income Fund(G)
Birla SL Income Plus(G)
HDFC Income Fund(G)
IDFC SSIF-Invest-Reg(G)
Kotak Bond Fund - Plan A(G)
INCOME FUNDS
Category Average
BenchmarkScheme NamesCrisil
Composite Bond
Fund Index
Month End AUM (Rs. Crs.) Sep-2016 214 3,236 2,605 1,874 4,034Average Maturity (Years) Sep-2016 6.20 10.76 17.07 8.21 12.63Month End YTM (%) Sep-2016 7.84 7.12 7.38 7.01 7.48Simple Annualised Returns (%)3 Months 13.35 15.07 14.07 13.47 13.85 12.79 13.646 Months 13.08 16.98 17.71 15.07 16.09 14.16 14.54CAGR (%)1 Year 10.17 11.31 12.41 9.74 11.48 10.17 11.522 Years 10.77 11.30 11.66 10.86 10.96 10.40 11.493 Years 11.00 10.90 11.50 10.39 10.85 10.32 11.535 Years - 9.82 9.98 10.00 10.12 9.56 9.75Inception Date 28-Mar-12 21-Oct-95 11-Sep-00 14-Jul-00 25-Nov-99
Devang Shah Prasad Dhonde Shobhit Mehrotra & Rakesh Vyas
Suyash Choudhary
Abhishek Bisen
Exit Load Nil for 10% of investment and
1% for remaining investment on or before 12M, Nil
after 12M
Nil 0.50% on or before 6M, Nil
after 6M
Nil for 10% of investment and
1% for remaining investment on or before 365D, Nil
after 365D
Nil
Fund Manager
Particulars Birla SL G-Sec-LT(G)
ICICI Pru Gilt-Invest-PF(G)
Kotak Gilt-Invest-Reg(G)
Reliance Gilt Securities Fund(G)
LONG TERM GILT
Category Average
BenchmarkScheme Names
I-Sec CompositeGilt Index
Month End AUM (Rs. Crs.) Sep-2016 745 718 639 1,057Average Maturity (Years) Sep-2016 12.41 14.57 13.10 13.24Month End YTM (%) Sep-2016 7.12 7.22 7.22 7.03Simple Annualised Returns (%)3 Months 13.54 14.89 14.28 15.76 14.11 18.60 15.306 Months 16.28 18.97 17.24 18.59 17.25 19.08 15.30CAGR (%)1 Year 11.63 13.49 12.46 12.93 11.81 14.07 12.362 Years 12.32 13.28 12.02 13.11 12.27 13.71 12.093 Years 11.91 13.47 11.90 12.75 11.89 13.50 11.775 Years 10.66 10.77 10.84 11.52 10.60 11.71 10.69Inception Date 28-Oct-99 19-Nov-03 29-Dec-98 22-Aug-08Exit Load Nil Nil Nil Nil
Prasad Dhonde & Kaustubh Gupta
Manish Banthia & Anuj Tagra
Abhishek Bisen Prashant Pimple
I-Sec Li-Bex
Please refer to RISKOMETER on page no 30 for all Risk related information about the above mentioned schemes.
Source: ACEMFPerformance as on October 28, 2016Benchmark: Category benchmark indices considered for respective categories
CORE RECOMMENDED FUNDS - DEBT
November 2016 Investime

24
Fund Manager
Particulars Birla SL MIP II-Savings 5(G)
Birla SL MIP II-Wealth 25(G)
HDFC MIP-LTP(G)
Reliance MIP(G)
MONTHLY INCOME PLANS (MIP)
Category Average
BenchmarkScheme Names
Crisil MIP Blended
Index
Month End AUM (Rs. Crs.) Sep-2016 272 1,299 3,698 2,527Average Maturity (Years) Sep-2016 12.19 11.70 12.05 8.56Absolute Returns (%)3 Months 3.40 4.26 4.09 3.12 3.09 2.896 Months 8.73 13.94 11.47 8.04 8.14 7.75CAGR (%)1 Year 12.50 16.40 12.55 9.28 10.52 10.772 Years 11.62 14.33 10.81 10.21 9.97 10.453 Years 12.86 17.36 15.14 13.61 12.15 11.785 Years 11.04 13.67 11.50 11.35 10.21 9.95Inception Date 22-May-04 22-May-04 26-Dec-03 12-Jan-04Credit Quality (%) Sep-2016AA/Equiv 1.26 13.57 5.13AA+ 1.20 0.64 2.23 14.60AAA & Equiv 13.24 0.40 6.52 12.04Cash & Equivalent 7.48 6.40 1.92 2.13A/Equiv & Others 7.69 2.53 4.92 9.93SOV 61.12 58.13 44.78 29.23
Satyabrata Mohanty & Pranay Sinha
Satyabrata Mohanty & Pranay Sinha
Prashant Jain &Shobhit Mehrotra
Sanjay Parekh & Amit Tripathi
Exit Load 1% on or before 540D, Nil after 540D
1% on or before 365D, Nil after 365D
Nil for 15% of investment and 1%
for remaining Investment on or
before 1Y, Nil after 1Y
NIL for 10% of investment, 1% if exceeding 10% of invesment on or
before 12M, Nil after 12M
Exposure (%)Debt 83.23 63.73 72.76 78.26Equity 9.29 29.56 23.78 19.25Cash & Equivalent & Others 7.48 6.72 3.46 2.50
Please refer to RISKOMETER on page no 30 for all Risk related information about the above mentioned schemes.
Source: ACEMFPerformance as on October 28, 2016Benchmark: Category benchmark indices considered for respective categories
CORE RECOMMENDED FUNDS - DEBT
November 2016 Investime

25
SATELLITE FUNDS
EQUITY FUNDS
Please refer to RISKOMETER on page no 30 for all Risk related information about the above mentioned schemes.
Birla S L Advantage Fund (G)Canara Robeco Infrastructure Fund-Reg(G)
Franklin India Smaller Cos Fund(G)Franklin Build India Fund(G)
ICICI Pru Balanced Advantage Fund(G)Kotak 50(G)
Mirae Asset Emerging BlueChip-Reg(G)MOSt Focused Multicap 35 Fund-Reg(G)
Reliance Banking Fund(G)Reliance Small Cap Fund(G)
DEBT FUNDSICICI Pru Income Opportunities Fund(G)
HDFC Banking and PSU Debt Fund-Reg(G)Kotak Medium Term Fund(G)
November 2016 Investime
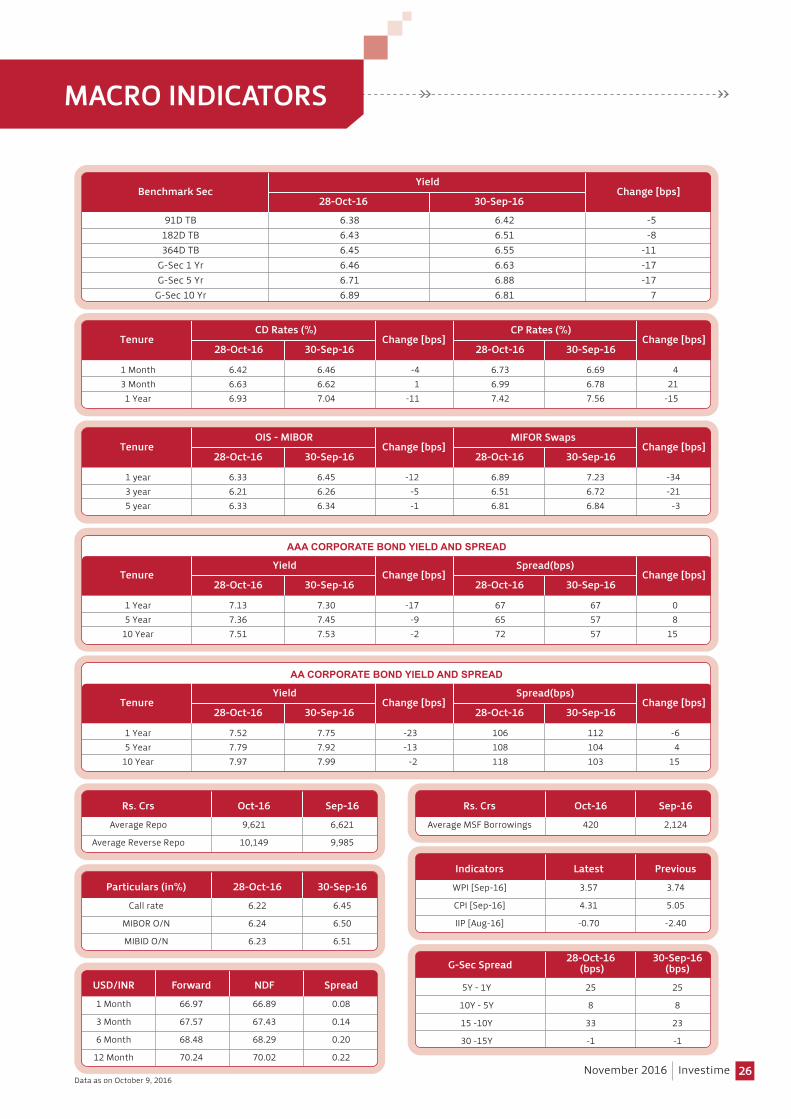
26
MACRO INDICATORS
Benchmark SecYield
91D TB 6.38 6.42 -5182D TB 6.43 6.51 -8364D TB 6.45 6.55 -11
G-Sec 1 Yr 6.46 6.63 -17G-Sec 5 Yr 6.71 6.88 -17
G-Sec 10 Yr 6.89 6.81 7
28-Oct-16 30-Sep-16Change [bps]
1 Month 6.42 6.46 -4 6.73 6.69 43 Month 6.63 6.62 1 6.99 6.78 211 Year 6.93 7.04 -11 7.42 7.56 -15
CD Rates (%)Change [bps]
CP Rates (%)Change [bps]
28-Oct-16 30-Sep-16 28-Oct-16 30-Sep-16Tenure
1 year 6.33 6.45 -12 6.89 7.23 -343 year 6.21 6.26 -5 6.51 6.72 -215 year 6.33 6.34 -1 6.81 6.84 -3
OIS - MIBORChange [bps]
MIFOR SwapsChange [bps]
28-Oct-16 30-Sep-16 28-Oct-16 30-Sep-16Tenure
1 Year 7.13 7.30 -17 67 67 05 Year 7.36 7.45 -9 65 57 8
10 Year 7.51 7.53 -2 72 57 15
YieldChange [bps]
Spread(bps)Change [bps]
28-Oct-16 30-Sep-16 28-Oct-16 30-Sep-16Tenure
AAA CORPORATE BOND YIELD AND SPREAD
1 Year 7.52 7.75 -23 106 112 -65 Year 7.79 7.92 -13 108 104 4
10 Year 7.97 7.99 -2 118 103 15
YieldChange [bps]
Spread(bps)Change [bps]
28-Oct-16 30-Sep-16 28-Oct-16 30-Sep-16Tenure
AA CORPORATE BOND YIELD AND SPREAD
Average Repo 9,621 6,621
Average Reverse Repo 10,149 9,985
Rs. Crs Oct-16 Sep-16
Average MSF Borrowings 420 2,124
Rs. Crs Oct-16 Sep-16
Call rate 6.22 6.45
MIBOR O/N 6.24 6.50
MIBID O/N 6.23 6.51
Particulars (in%) 28-Oct-16 30-Sep-16 WPI [Sep-16] 3.57 3.74
CPI [Sep-16] 4.31 5.05
IIP [Aug-16] -0.70 -2.40
Indicators Latest Previous
5Y - 1Y 25 25
10Y - 5Y 8 8
15 -10Y 33 23
30 -15Y -1 -1
28-Oct-16 30-Sep-16 (bps) (bps)
1 Month 66.97 66.89 0.08
3 Month 67.57 67.43 0.14
6 Month 68.48 68.29 0.20
12 Month 70.24 70.02 0.22
USD/INR Forward NDF Spread
Data as on October 9, 2016
G-Sec Spread
November 2016 Investime

27
Data as on October 5, 2016
MACRO INDICATORS
USD/INR 66.79 66.62
EUR/USD 1.09 1.12
USD/JPY 105.30 101.45
GBP/USD 1.21 1.27
USD/SEK 6.78 6.67
CurrencyFOREX
28-Oct-16 30-Sep-16
Currency 1 Year 5 Year 10 year
USD 0.96 1.30 1.64
EUR -0.31 0.02 0.50
GBP 0.41 0.81 1.14
JPY -0.02 -0.05 0.06
Swap Rate
Nymex Crude ($/bbl) 46.86 48.24 39.51
Brent Crude ($/bbl) 48.30 49.24 41.80
Gold ($/Oz) 1271.50 1321.70 1351.40
Silver ($/Oz) 17.76 19.12 20.47
Aluminium ($/ton) 1734.00 1671.00 1642.00
Copper ($/ton) 4853.00 4841.00 4875.00
Commodity 28-Oct-16 1 M Ago 3 M Ago
Tax Free BondsYield
28-Oct-16 30-Sep-16
8.20 % NHAI 2022 6.27% 6.27%
8.00% IRFC 2022 6.36% 6.36%
8.20% PFC 2022 6.30% 6.30%
8.10% HUDCO 2022 6.34% 6.34%
7.93% REC 2022 6.32% 6.32%
Equity 9,118 3,841 28,199
Debt 24,637 53,312 285,651
MF Inflows (Rs. Crs.) Oct-16 Sep-16 YTD
** MF Flows are updated as on October 8, 2016
Equity -4306 10,443 46487
Debt -6000 9,789 -3204
FII Inflows (Rs. Crs.) Oct-16 Sep-16 YTD
** FII Flows are updated as on October 8, 2016
T-Bills DatePrice Yield
Latest Cut off
Amount (Rs. Crores)
91 days 02-Nov-16 98.43 6.40 8000182 Days 02-Nov-16 96.88 6.46 6000364 Days 26-Oct-16 93.95 6.46 6000
T-Bills DatePrice Yield
Previous Cut off
Amount (Rs. Crores)
91 days 26-Oct-16 98.44 6.36 8000182 Days 19-Oct-16 96.88 6.46 6000364 Days 10-Oct-16 93.95 6.46 6000
Indicator Latest Previous Indicator Latest Previous
Repo 6.25 6.50 CRR 4.00 4.00Rev Repo 5.75 6.00 SLR 20.75 21.00Bank Rate 6.75 7.00 MSF 6.75 7.00
Date/Countries 30-Sep-16 31-Aug-16 29-Jul-16 30-Jun-1610 Year Benchmark Yields [%]
US 1.61 1.61 1.57 1.46 1.49UK 0.75 0.75 0.64 0.69 0.87Japan -0.08 -0.08 -0.07 -0.17 -0.23Spain 0.88 0.88 1.01 1.02 1.13Germany -0.12 -0.12 -0.06 -0.12 -0.13France 0.12 0.12 0.18 0.10 0.21Italy 1.19 1.19 1.15 1.17 1.35Brazil 11.63 11.63 12.11 11.83 12.19China 2.77 2.77 2.81 2.81 2.88India 6.96 6.96 7.11 7.16 7.45
November 2016 Investime
28-Oct-16

28
EQUITY PMS
Name PortfolioManager
AUM(Rs.in
Crs)
Absolute (%)
1 M 3 M 6 M 1 Yr 2 Yr 3 Yr 5 Yr
CAGR (%)
SinceInception
InceptionDate
OTHER OFFERINGS
November 2016 Investime
Aditya Birla Money Core & Satellite Vivek Mahajan 49.50 4.04 9.94 27.78 26.60 NA NA NA 25.62 Apr/15Benchmark Index : NIFTY 100 -0.87 0.51 11.94 7.62 5.68 14.24 11.27 ASK Growth Gaurav Misra 1,188.73 0.24 2.11 19.72 20.82 19.40 28.80 21.51 21.81 Jan/01Benchmark Index : NIFTY 50 -1.23 -0.33 10.08 5.70 3.73 12.28 10.00 ASK Indian Entrepreneur Portfolio (IEP) Sumit Jain 5,232.57 1.53 3.12 18.97 21.97 19.47 31.25 25.77 22.25 Jan/10Benchmark Index: S&P BSE 500 -0.28 2.20 13.93 9.78 7.52 16.83 11.80 ASK India Select Sudhir Kedia 1,794.66 0.73 2.63 17.82 17.95 22.92 33.46 25.82 20.58 Jan/10Benchmark Index : S&P BSE 100 -0.89 0.57 11.96 7.56 5.03 13.64 10.74 Ask Life Gaurav Misra 342.40 -0.18 1.66 14.56 9.84 10.44 21.47 18.72 19.56 Sep/08Benchmark Index : S&P BSE 200 -0.61 1.55 13.07 8.98 7.00 15.83 11.64 Ask Strategic Sudhir Kedia 226.17 1.77 2.28 18.86 17.12 21.14 34.04 24.90 17.84 Dec/09Benchmark Index : S&P BSE 200 -0.61 1.55 13.07 8.98 7.00 15.83 11.64 Birla SL PMS Core Equity Portfolio (CEP) Vishal Gajwani 2,190.00 1.90 5.60 18.50 22.10 26.30 53.70 34.00 22.30 Apr/08
& Natasha LullaBenchmark Index: NIFTY 500 -0.28 2.12 13.84 9.73 7.65 17.17 12.11 Hexagon Sahil Shah 39.87 7.30 9.60 20.60 26.00 NA NA NA 25.80 Sep/15Benchmark Index : S&P BSE 200 -0.61 1.55 13.07 8.98 7.00 15.83 11.64 Motilal Oswal NTDOP Manish Sonthalia 4,600.00 3.08 5.76 31.77 30.93 32.62 44.16 34.00 19.41 Dec/07Benchmark Index : 0.94 7.80 20.34 18.90 17.15 29.41 16.93 Nifty Free Float Midcap 100Motilal Oswal Value Strategy Manish Sonthalia 2,600.00 -0.59 -0.31 12.00 10.77 10.47 23.49 15.38 25.52 Mar/03Benchmark Index : NIFTY 50 -1.23 -0.33 10.08 5.70 3.73 12.28 10.00 Religare All Star Portfolio T. S. Anantkrishnan NA 2.71 4.81 25.78 21.55 20.71 33.35 NA NA Aug/14Benchmark Index : S&P BSE 200 -0.61 1.55 13.07 8.98 7.00 15.83 11.64 Religare Multicap Portfolio T. S. Anantkrishnan NA 4.39 7.89 26.80 14.82 14.02 29.59 NA NA Sep/11Benchmark Index : S&P BSE 200 -0.61 1.55 13.07 8.98 7.00 15.83 11.64 Sundaram India Secular Opportunities S. Bharath 231.00 1.90 2.00 15.30 12.10 18.00 30.30 23.40 28.60 Feb/10Portfolio (SISOP)Benchmark Index : NIFTY 500 -0.28 2.12 13.84 9.73 7.65 17.17 12.11 Sundaram Mid Cap Strategy S. Bharath 144.00 3.20 6.30 19.00 17.90 20.20 35.20 25.10 20.50 Jun/10Benchmark Index : 0.94 7.80 20.34 18.90 17.15 29.41 16.93 Nifty Free Float Midcap 100Sundaram PACE S. Bharath 104.00 1.50 1.10 13.10 8.00 15.20 29.60 NA 29.00 Sep/13Benchmark Index : NIFTY 500 -0.28 2.12 13.84 9.73 7.65 17.17 12.11 Sundaram Small Cap S. Bharath 52.00 5.40 6.30 16.50 21.30 17.10 36.80 29.00 19.60 Nov/09Benchmark Index : S&P BSE 500 -0.28 2.20 13.93 9.78 7.52 16.83 11.80
Performance as on October 28, 2016The performance details mentioned above are as shared by the respective portfolio managers.
SECONDARY BOND MARKET OFFERINGS
Available Bonds Tenure Credit Rating Indicative Yield (%)*
Adani Port and SEZ 2026 AA+ 8.80Rajasthan Rajya Vidyut Utpadan Nigam Ltd 2026 A+ (SO) 8.90Himachal Pradesh State Electricity Board Ltd (Call Option- Mar 2023) Perpetual A (SO) 10.00Bank of India (Call Option- June 2021) A+ 9.50IDBI Bank (Call Option- Oct 2024) Perpetual A 10.10Andhra Bank (Call Option- Dec 2019) AA- 9.50
*Indicative Yield as on November 10, 2016Contact us for more offerings

PMS
Type of Portfolio
Benchmark
Minimum Investment Amount
Lock-in or Redemption Terms
Fee Structure (excluding Service Tax)
Fund Manager
Recommended Investment Horizon
Taxation
Custodian
ABM Multi-Manager PMS has two portfoliosa. Wealth Builder (Moderate)b. Wealth Multiplier (Aggressive)
Open-ended Discretionary Portfolio(constructed with multiple mutual fund schemes)
Wealth Builder - Crisil MIP Blended IndexWealth Multiplier – Crisil Balanced Fund Index
Rs. 25 Lacs OR such other amount as decided by the Portfolio Manager at its sole discretion.
Exit Load of 1% for redemption before 1 year from the date of investment on the investment amount
1) Upfront Fee 1.00% of committed amount (one time)
2) Management Fee Management Fee @1.00% p.a. (charged monthly on daily average assets)
3) Other Charges For details of other expenses like Fund Accounting, Custody etc., please refer to the Portfolio Management Services agreement
Mr. Dhruva Raj Chatterji
3 Years and above
Investors are advised to seek consultation from their Tax Advisor before making any investment decision.
Orbis Financial Corporation Ltd
Mutual Fund PMS / ABM Multi Manager PMS
Synthetic Benchmark Index*= Nifty (30%)+ Nifty MidCap 100 (10%)+ Gold (0%)+ Crisil Liquid Fund Index (10%)+ Crisil Short Term Bond Fund Index (35%)+ Crisil Composite Bond Fund Index (10%)+ I-Sec Li-BEX (5%)
Synthetic Benchmark Index# = Nifty (50%)+ Nifty Midcap 100 (20%)+ Gold (0%)+ Crisil Liquid Fund Index (0%)+ Crisil Short Term Bond Fund Index (20%)+ Crisil Composite Bond Fund Index (10%)
I Sec Li-Bex returns are updated with one day lagData as on October 28, 2016The performance details mentioned above are as shared by the portfolio manager
Note: The compounded annualised Model returns are shown after exclusion of upfront set up fee of 1% and annual management fee of 1% p.a charged monthly on daily average assets. The portfolios are rebalanced at the beginning of every calendar year. The portfolio is run with a passive asset allocation strategy with changes only made during the critical events backed with our research
advice. For instance, year 2013, saw high exchange rate fluctuations and emergency moves by the central bank. We had moved out of high duration funds during these times and re-entered at later part of the year. All the recommendations are well documented for reference check.
OTHER OFFERINGS
29November 2016 Investime
Particluars1 Month 3 Month 6 Month 1 Year 2 Year 3 Years 5 Years Since Inception (CAGR)
CAGR (%)
Wealth Builder 0.44 3.76 9.97 12.03 12.39 17.40 14.60 14.73
Crisil MIP Blended Index -0.67 2.16 7.35 10.91 9.46 11.55 9.89 8.48
Synthetic Benchmark Index* 0.07 2.74 8.37 9.78 9.06 12.60 10.97 12.29
Absolute (%)
Particluars1 Month 3 Month 6 Month 1 Year 2 Year 3 Years 5 Years Since Inception (CAGR)
CAGR (%)
Wealth Multiplier 0.40 4.34 13.17 13.46 14.01 24.56 19.04 19.10
Crisil Balanced Fund Index -2.14 -0.80 8.41 8.21 4.34 11.26 10.06 11.21
Synthetic Benchmark Index# -0.23 2.92 10.83 10.12 9.09 15.81 12.33 14.48
Absolute (%)
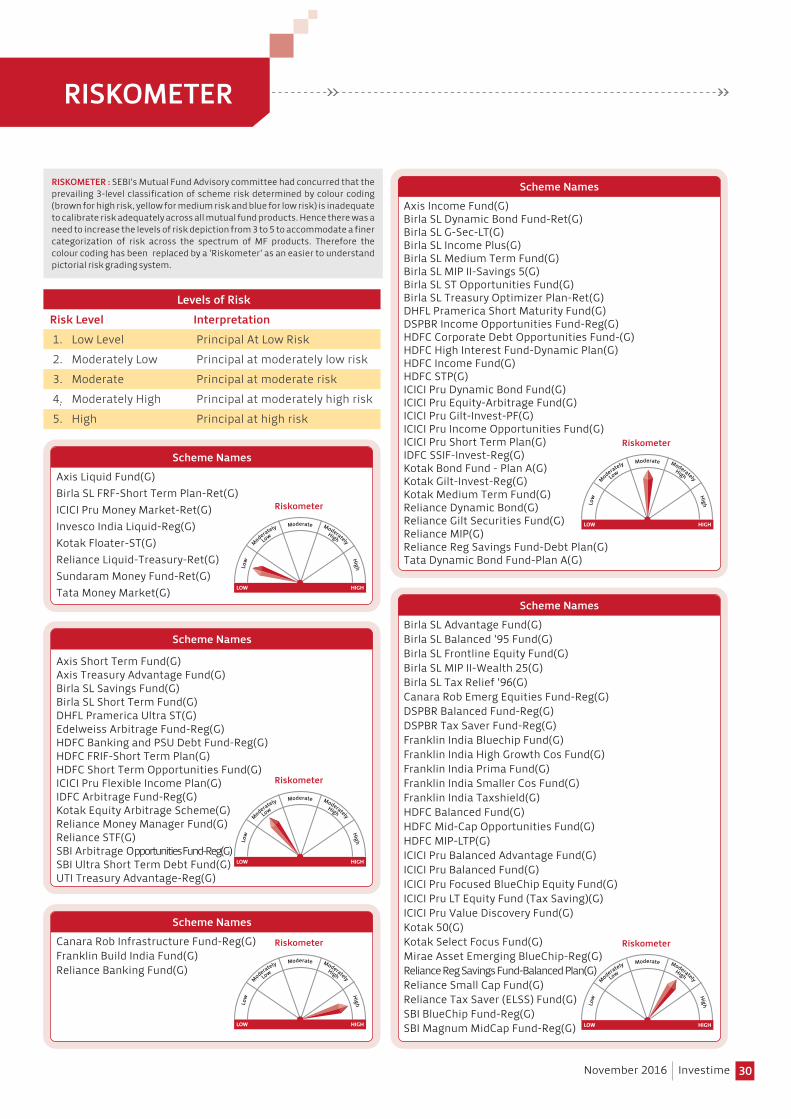
RISKOMETER
30
RISKOMETER : SEBI's Mutual Fund Advisory committee had concurred that the prevailing 3-level classification of scheme risk determined by colour coding (brown for high risk, yellow for medium risk and blue for low risk) is inadequate to calibrate risk adequately across all mutual fund products. Hence there was a need to increase the levels of risk depiction from 3 to 5 to accommodate a finer categorization of risk across the spectrum of MF products. Therefore the colour coding has been replaced by a 'Riskometer' as an easier to understand pictorial risk grading system.
Levels of RiskRisk Level Interpretation 1. Low Level Principal At Low Risk 2. Moderately Low Principal at moderately low risk 3. Moderate Principal at moderate risk 4. Moderately High Principal at moderately high risk 5. High Principal at high risk
Riskometer
Scheme Names
Axis Liquid Fund(G)Birla SL FRF-Short Term Plan-Ret(G)ICICI Pru Money Market-Ret(G)Invesco India Liquid-Reg(G)Kotak Floater-ST(G)Reliance Liquid-Treasury-Ret(G)Sundaram Money Fund-Ret(G)Tata Money Market(G)
Riskometer
Scheme Names
Axis Short Term Fund(G)Axis Treasury Advantage Fund(G)Birla SL Savings Fund(G)Birla SL Short Term Fund(G)DHFL Pramerica Ultra ST(G)Edelweiss Arbitrage Fund-Reg(G)HDFC Banking and PSU Debt Fund-Reg(G)HDFC FRIF-Short Term Plan(G)HDFC Short Term Opportunities Fund(G)ICICI Pru Flexible Income Plan(G)IDFC Arbitrage Fund-Reg(G)Kotak Equity Arbitrage Scheme(G)Reliance Money Manager Fund(G)Reliance STF(G)SBI Arbitrage Opportunities Fund-Reg(G)SBI Ultra Short Term Debt Fund(G)UTI Treasury Advantage-Reg(G)
Riskometer
Scheme Names
Axis Income Fund(G)Birla SL Dynamic Bond Fund-Ret(G)Birla SL G-Sec-LT(G)Birla SL Income Plus(G)Birla SL Medium Term Fund(G)Birla SL MIP II-Savings 5(G)Birla SL ST Opportunities Fund(G)Birla SL Treasury Optimizer Plan-Ret(G)DHFL Pramerica Short Maturity Fund(G)DSPBR Income Opportunities Fund-Reg(G)HDFC Corporate Debt Opportunities Fund-(G)HDFC High Interest Fund-Dynamic Plan(G)HDFC Income Fund(G)HDFC STP(G)ICICI Pru Dynamic Bond Fund(G)ICICI Pru Equity-Arbitrage Fund(G)ICICI Pru Gilt-Invest-PF(G)ICICI Pru Income Opportunities Fund(G)ICICI Pru Short Term Plan(G)IDFC SSIF-Invest-Reg(G)Kotak Bond Fund - Plan A(G)Kotak Gilt-Invest-Reg(G)Kotak Medium Term Fund(G)Reliance Dynamic Bond(G)Reliance Gilt Securities Fund(G)Reliance MIP(G)Reliance Reg Savings Fund-Debt Plan(G)Tata Dynamic Bond Fund-Plan A(G)
Riskometer
Scheme Names
Birla SL Advantage Fund(G)Birla SL Balanced '95 Fund(G)Birla SL Frontline Equity Fund(G)Birla SL MIP II-Wealth 25(G)Birla SL Tax Relief '96(G)Canara Rob Emerg Equities Fund-Reg(G)DSPBR Balanced Fund-Reg(G)DSPBR Tax Saver Fund-Reg(G)Franklin India Bluechip Fund(G)Franklin India High Growth Cos Fund(G)Franklin India Prima Fund(G)Franklin India Smaller Cos Fund(G)Franklin India Taxshield(G)HDFC Balanced Fund(G)HDFC Mid-Cap Opportunities Fund(G)HDFC MIP-LTP(G)ICICI Pru Balanced Advantage Fund(G)ICICI Pru Balanced Fund(G)ICICI Pru Focused BlueChip Equity Fund(G)ICICI Pru LT Equity Fund (Tax Saving)(G)ICICI Pru Value Discovery Fund(G)Kotak 50(G)Kotak Select Focus Fund(G)Mirae Asset Emerging BlueChip-Reg(G)Reliance Reg Savings Fund-Balanced Plan(G)Reliance Small Cap Fund(G)Reliance Tax Saver (ELSS) Fund(G)SBI BlueChip Fund-Reg(G)SBI Magnum MidCap Fund-Reg(G)
Riskometer
Scheme Names
Canara Rob Infrastructure Fund-Reg(G)Franklin Build India Fund(G)Reliance Banking Fund(G)
November 2016 Investime
DISCLAIMER
31November 2016 Investime
Printed, published by Aditya Birla Money Mart Limited, One India Bulls Centre, Tower 1, 18th Floor, Jupiter Mill Compound, 841, Senapati Bapat Marg, Elphinstone Road, Mumbai 400 013. Tel. No: 91-22-4356 7000 Fax no: 91-22-4356 7266, Corporate Identity Number (CIN): U61190GJ1997PLC062406. Editor: Mr. Ananth Sandeep Sundur. Designed and Printed at Micro Graphics, Graphic Designers and Commercial Printers, 137, Pragati Industrial Estate, N. M. Joshi Marg, Lower Parel, Mumbai - 400011, Tel.: 66634670/71. For advertisement contact: Michelle Banerjee, Email:[email protected]. Aditya Birla Money Mart Limited (ABMML), through its brand Aditya Birla Wealth Management, offers a range of solutions for wealth management and distribution. It also offers third party products like company deposits, mutual funds, structured products, alternate investments and property services. ABMML has a premier wealth management service arm to cater to HNI customers. The information published is as per the data provided by various Mutual Funds. “Though sufficient care has been taken, to provide the correct rates, however ABMML does not guarantee the accuracy of the data provided herein. As a potential investor, you are advised to check the updated rates and other Terms & Conditions on the manufacturer's website before making any investments". The views/opinions expressed in the various articles are that of the author and the company may not subscribe to the same either in part of in full. Any person investing on the basis of the data published in Investime will be doing so at their own risk and are advised to consult your certified financial planner before taking any investment decision. Mutual Fund investments are subject to market risks, read all scheme related documents carefully. Mr. Ananth Sandeep SundurEditor

Contact InformationAditya Birla Money Mart LimitedCorporate Office: One India Bulls Centre, Tower 1, 18th Floor, Jupiter Mill Compound, 841, Senapati Bapat Marg, Elphinstone Road, Mumbai 400 013.Registered Office: Indian Rayon Compound Veraval Gujarat 362266, E-mail:[email protected]: U61190GJ1997PLC062406 ,Tel No: 91-22-4356 7000 Fax no: 91-22-4356 7266
![TERENO General Overview – Status, Network Activities ... · 1 Dec 1 Mar 1 Jun 1 Sep 1 Dec 1 Mar 1 Jun 1 Sep 1 Dec 1 Mar 1 Jun 1 Sep 1 Dec-100-50 0 4000 8000 Temeprature [° C ]](https://static.documents.pub/doc/80x56/60450a075ad6f94bfb4e229e/tereno-general-overview-a-status-network-activities-1-dec-1-mar-1-jun-1-sep.jpg)


