Slide 1 Public Access to Priority Investment Approach (PIA) Data 2018 Hi everyone, Today I will be telling you about a new way to access the Priority Investment Approach research dataset. In the first session I will provide a short background on the data that is available and briefly introduce one way of accessing the data using TableBuilder. In the second session I will show you a few ways you can use TableBuilder by working through some examples. The second session is for those of you who are interested in a deeper understanding of how to use the dataset. You are welcome to leave after the first session if that doesn’t interest you. The notes from these presentations will be available afterwards on the community grants hub website for your reference, so please don't feel that you need to remember everything! We think the Tablebuilder tool will be very useful to a wide number of researchers as well as those applying for TTL Fund grants. I hope that this presentation will enable you to make use of this data yourself.
Transcript
Slide 1
Public Access to Priority Investment Approach (PIA) Data2018
Hi everyone, Today I will be telling you about a new way to access the Priority Investment Approach research dataset. In the first session I will provide a short background on the data that is available and briefly introduce one way of accessing the data using TableBuilder. In the second session I will show you a few ways you can use TableBuilder by working through some examples. The second session is for those of you who are interested in a deeper understanding of how to use the dataset. You are welcome to leave after the first session if that doesn’t interest you. The notes from these presentations will be available afterwards on the community grants hub website for your reference, so please don't feel that you need to remember everything! We think the Tablebuilder tool will be very useful to a wide number of researchers as well as those applying for TTL Fund grants. I hope that this presentation will enable you to make use of this data yourself.
Slide 2
How might this be relevant?
Access to Priority Investment Approach (PIA) Data 2
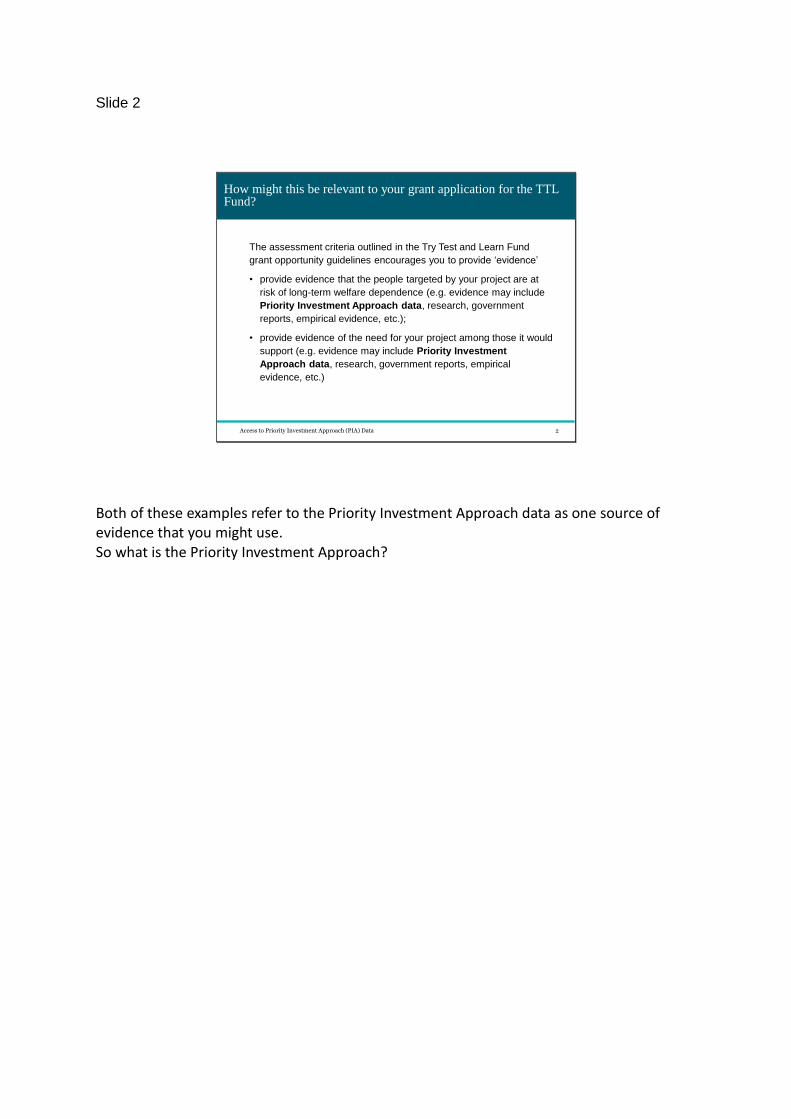
How might this be relevant to your grant application for the TTL Fund?
The assessment criteria outlined in the Try Test and Learn Fund
grant opportunity guidelines encourages you to provide ‘evidence’
• provide evidence that the people targeted by your project are at
risk of long-term welfare dependence (e.g. evidence may include
Priority Investment Approach data, research, government
reports, empirical evidence, etc.);
• provide evidence of the need for your project among those it would
support (e.g. evidence may include Priority Investment
Approach data, research, government reports, empirical
evidence, etc.)
Both of these examples refer to the Priority Investment Approach data as one source of evidence that you might use. So what is the Priority Investment Approach?
Slide 3
The Australian Priority Investment Approach to Welfare (PIA) policy initiative
Access to Priority Investment Approach (PIA) Data 3
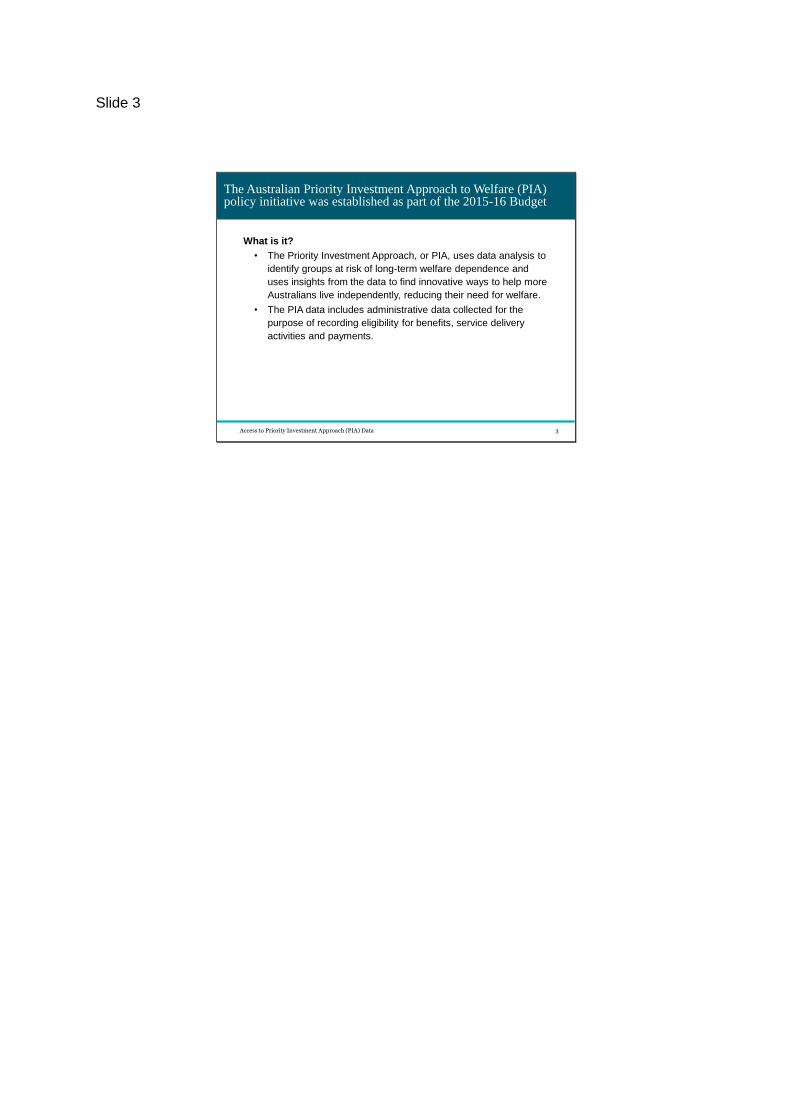
The Australian Priority Investment Approach to Welfare (PIA) policy initiative was established as part of the 2015-16 Budget
What is it?
• The Priority Investment Approach, or PIA, uses data analysis to
identify groups at risk of long-term welfare dependence and
uses insights from the data to find innovative ways to help more
Australians live independently, reducing their need for welfare.
• The PIA data includes administrative data collected for the
purpose of recording eligibility for benefits, service delivery
activities and payments.
Slide 4
The PIA data includes 14 years of information about payment recipients over 56 quarterly snapshots
Access to Priority Investment Approach (PIA) Data 4
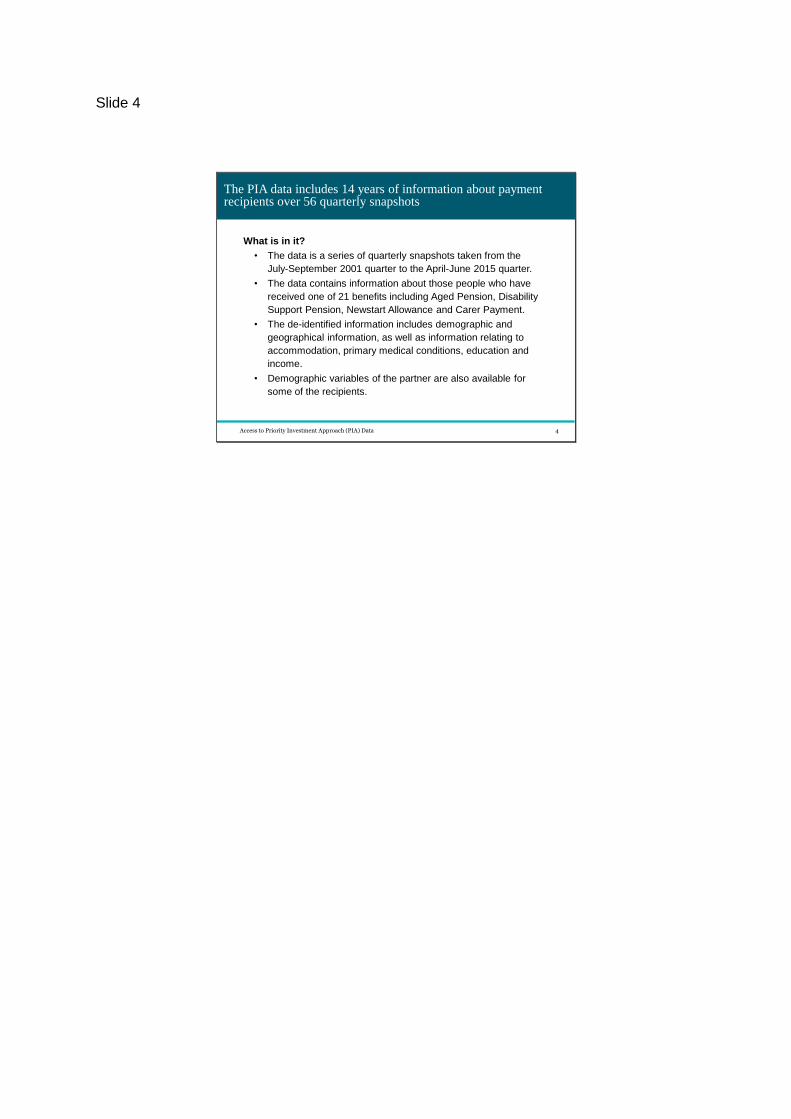
The PIA data includes 14 years of information about payment recipients over 56 quarterly snapshots
What is in it?
• The data is a series of quarterly snapshots taken from the
July-September 2001 quarter to the April-June 2015 quarter.
• The data contains information about those people who have
received one of 21 benefits including Aged Pension, Disability
Support Pension, Newstart Allowance and Carer Payment.
• The de-identified information includes demographic and
geographical information, as well as information relating to
accommodation, primary medical conditions, education and
income.
• Demographic variables of the partner are also available for
some of the recipients.
Slide 5
Part of the PIA policy is to provide access to the data
Access to Priority Investment Approach (PIA) Data 5
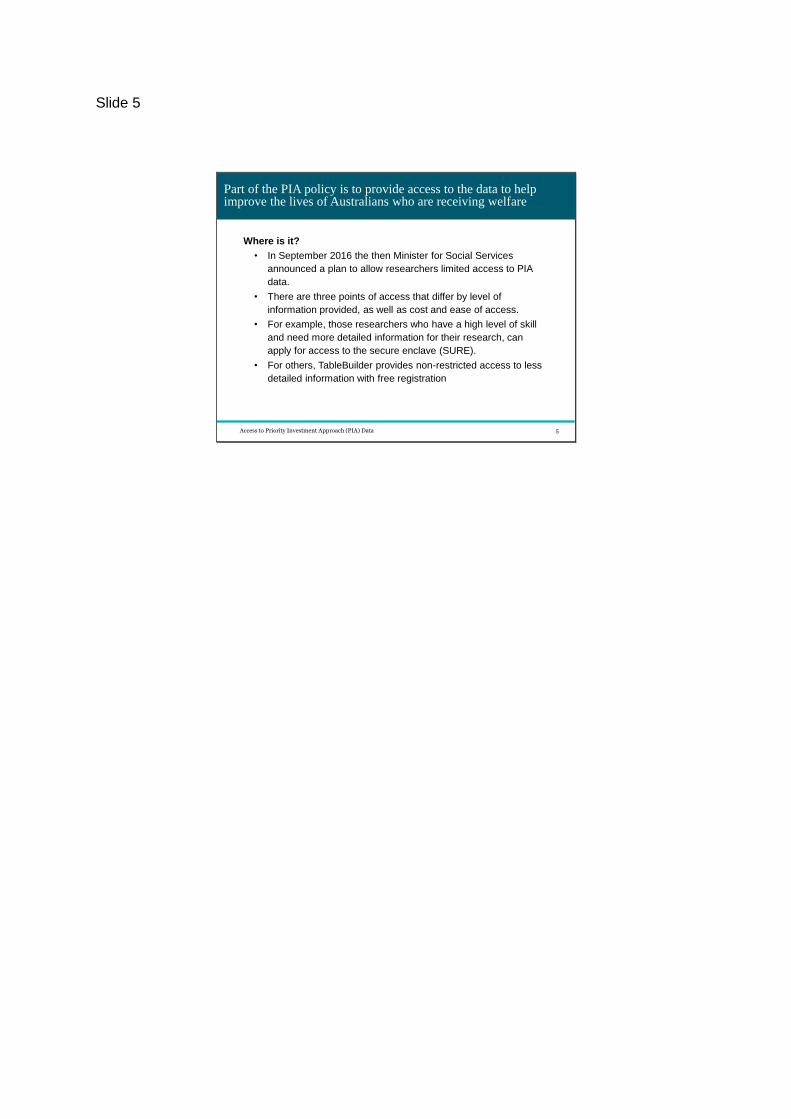
Part of the PIA policy is to provide access to the data to help improve the lives of Australians who are receiving welfare
Where is it?
• In September 2016 the then Minister for Social Services
announced a plan to allow researchers limited access to PIA
data.
• There are three points of access that differ by level of
information provided, as well as cost and ease of access.
• For example, those researchers who have a high level of skill
and need more detailed information for their research, can
apply for access to the secure enclave (SURE).
• For others, TableBuilder provides non-restricted access to less
detailed information with free registration
Slide 6
The three access points to PIA data
Access to Priority Investment Approach (PIA) Data 6
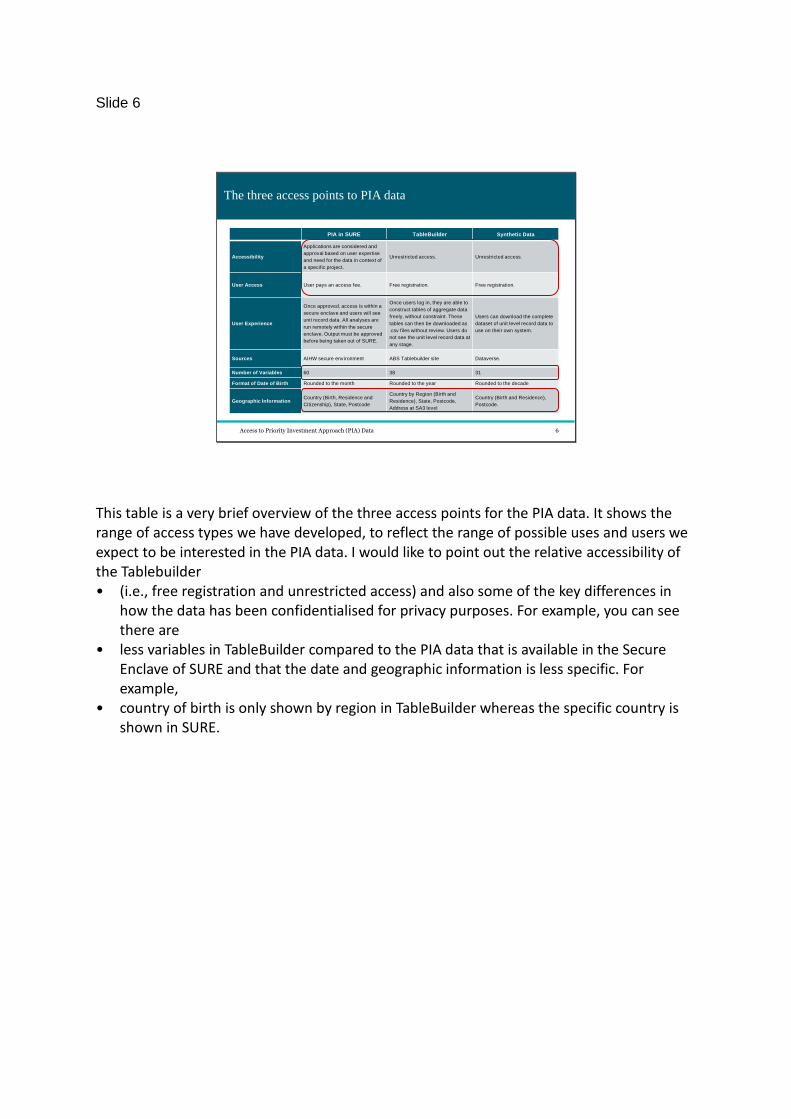
The three access points to PIA data
PIA in SURE TableBuilder Synthetic Data
Accessibility
Applications are considered and
approval based on user expertise
and need for the data in context of
a specific project.
Unrestricted access. Unrestricted access.
User Access User pays an access fee. Free registration. Free registration.
User Experience
Once approved, access is within a
secure enclave and users will see
unit record data. All analyses are
run remotely within the secure
enclave. Output must be approved
before being taken out of SURE.
Once users log in, they are able to
construct tables of aggregate data
freely, without constraint. These
tables can then be downloaded as
.csv files without review. Users do
not see the unit level record data at
any stage.
Users can download the complete
dataset of unit level record data to
use on their own system.
Sources AIHW secure environment ABS Tablebuilder site Dataverse.
Number of Variables 60 38 31
Format of Date of Birth Rounded to the month Rounded to the year Rounded to the decade
Geographic InformationCountry (Birth, Residence and
Citizenship), State, Postcode
Country by Region (Birth and
Residence), State, Postcode,
Address at SA3 level
Country (Birth and Residence),
Postcode.
This table is a very brief overview of the three access points for the PIA data. It shows the range of access types we have developed, to reflect the range of possible uses and users we expect to be interested in the PIA data. I would like to point out the relative accessibility of the Tablebuilder • (i.e., free registration and unrestricted access) and also some of the key differences in
how the data has been confidentialised for privacy purposes. For example, you can see there are
• less variables in TableBuilder compared to the PIA data that is available in the Secure Enclave of SURE and that the date and geographic information is less specific. For example,
• country of birth is only shown by region in TableBuilder whereas the specific country is shown in SURE.
Slide 7
PIA in TableBuilder
Who it is meant for?
• Everybody
– Teachers and students
– Journalists
– Academics
– Non Government Organisations
How it can be used?
• Create and download both tables and graphs
Access to Priority Investment Approach (PIA) Data 7
Users are expected to include teachers and students in an educational context, journalists preparing data for reports, as well as academics and NGO’s looking for data to use in their grant applications. • I will provide some examples of both tables and graphs at the end of this session and we
will work through how to create and download both tables and graphs in the next session.
Slide 8
PIA in TableBuilder
As this data is publicly accessible, a number of steps have been taken
to ensure privacy is maintained.
What is not in it?
Fewer Variables
– 38 variables (not 60)
Less Detail
– Some variables have been modified (e.g., month and Year to
Year only)
Fewer people
– A 5% sample of the population
Access to Priority Investment Approach (PIA) Data 8
• There are Fewer Variables. There are 38 variables in TableBuilder as opposed to the 60 that are available in the secure environment of SURE.
• There is Less Detail. Some variables have been modified, for example a date might be available as year only in TableBuilder where it is available as month and year in the secure enclave.
• There are Fewer People. TableBuilder uses a 5% sample of the original PIA dataset. This is large enough to provide a representative subsample of the whole population while maintaining individual privacy. One implication of this is that if you are reporting population estimates in your grant application, you will need to multiply the figures in the table by 20.
Slide 9
Why you might be interested in using TableBuilder to access the PIA data
• TableBuilder is good for a wide range of data analysis expertise;
from beginner to advanced
• TableBuilder allows for population estimates
Access to Priority Investment Approach (PIA) Data 9
• Some people here are likely to be analysts or researchers and have experience in working with population data, perhaps even have experience with TableBuilder using other datasets
• Some people here are likely to have no research experience and not be familiar with working with population data at all, and perhaps have some level of aversion to data.
• Due to it’s user interface, TableBuilder suits both of these populations. • While the 5% serves to protect individual privacy, it does allow for reportable estimates
that can be used in reports and grant applications.
Slide 10
What can you do with TableBuilder?
• Get population estimates (numbers)
• Create graphs to display your comparisons
• Save and/or download tables and graphs for later use
Access to Priority Investment Approach (PIA) Data 10
• You can get population estimates based on a range of criteria that you can choose and manipulate
• Creating graphs and saving and downloading tables and graphs is what we will work through in the following session.
Slide 11
Some examples using TableBuilder
Access to Priority Investment Approach (PIA) Data 11
For now, I will show you just a few examples of how you might use TableBuilder.
Slide 12
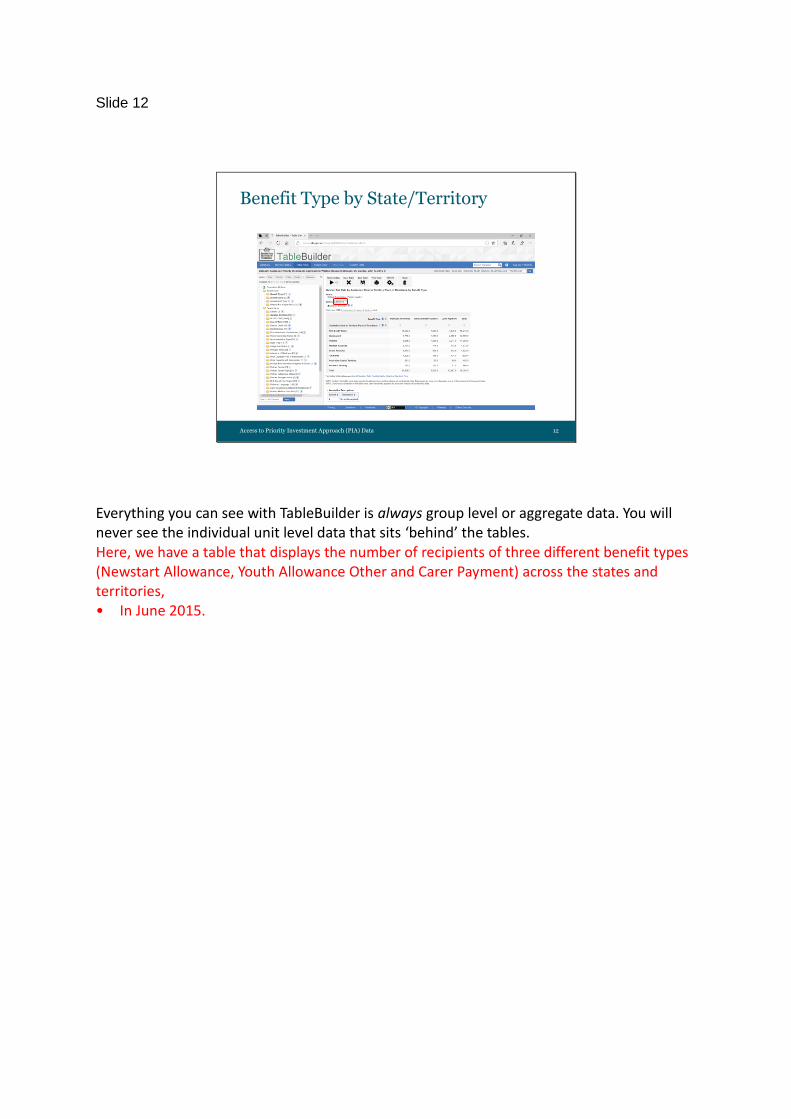
Benefit Type by State/Territory
Access to Priority Investment Approach (PIA) Data 12
Everything you can see with TableBuilder is always group level or aggregate data. You will never see the individual unit level data that sits ‘behind’ the tables. Here, we have a table that displays the number of recipients of three different benefit types (Newstart Allowance, Youth Allowance Other and Carer Payment) across the states and territories, • In June 2015.
Slide 13
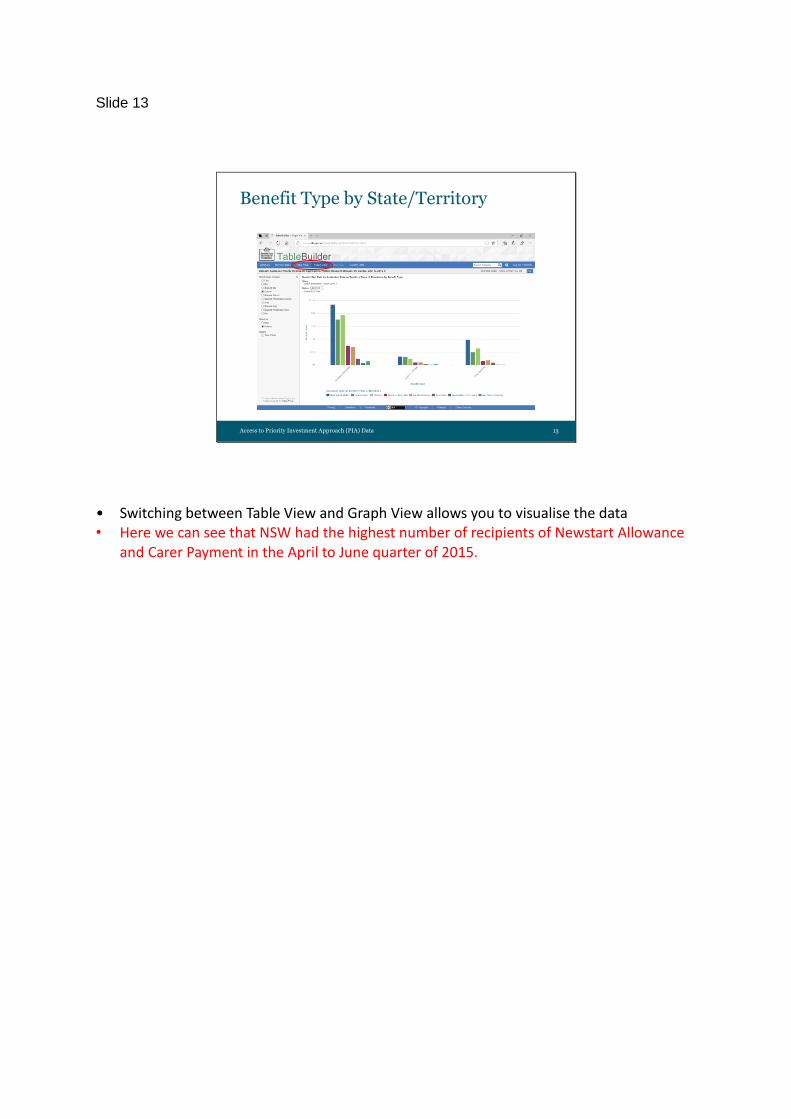
Benefit Type by State/Territory
Access to Priority Investment Approach (PIA) Data 13
• Switching between Table View and Graph View allows you to visualise the data • Here we can see that NSW had the highest number of recipients of Newstart Allowance
and Carer Payment in the April to June quarter of 2015.
Slide 14
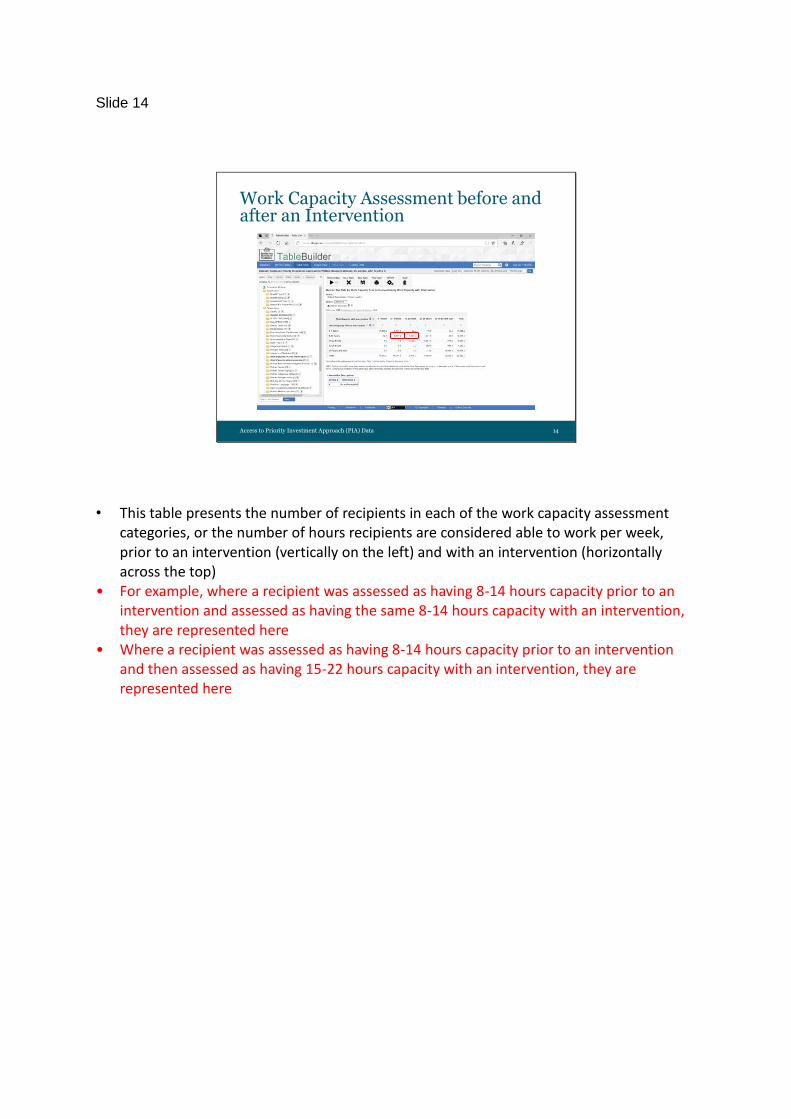
Work Capacity Assessment before and after an Intervention
Access to Priority Investment Approach (PIA) Data 14
• This table presents the number of recipients in each of the work capacity assessment categories, or the number of hours recipients are considered able to work per week, prior to an intervention (vertically on the left) and with an intervention (horizontally across the top)
• For example, where a recipient was assessed as having 8-14 hours capacity prior to an intervention and assessed as having the same 8-14 hours capacity with an intervention, they are represented here
• Where a recipient was assessed as having 8-14 hours capacity prior to an intervention and then assessed as having 15-22 hours capacity with an intervention, they are represented here
Slide 15
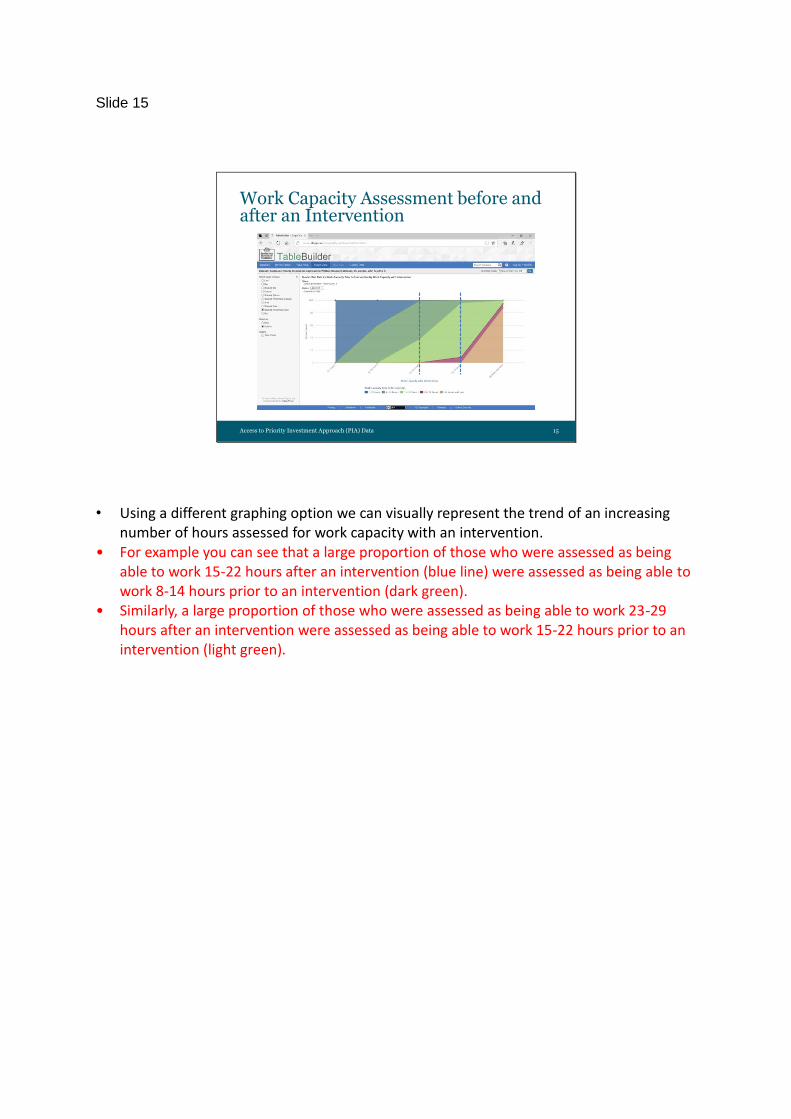
Work Capacity Assessment before and after an Intervention
Access to Priority Investment Approach (PIA) Data 15
• Using a different graphing option we can visually represent the trend of an increasing number of hours assessed for work capacity with an intervention.
• For example you can see that a large proportion of those who were assessed as being able to work 15-22 hours after an intervention (blue line) were assessed as being able to work 8-14 hours prior to an intervention (dark green).
• Similarly, a large proportion of those who were assessed as being able to work 23-29 hours after an intervention were assessed as being able to work 15-22 hours prior to an intervention (light green).
Slide 16
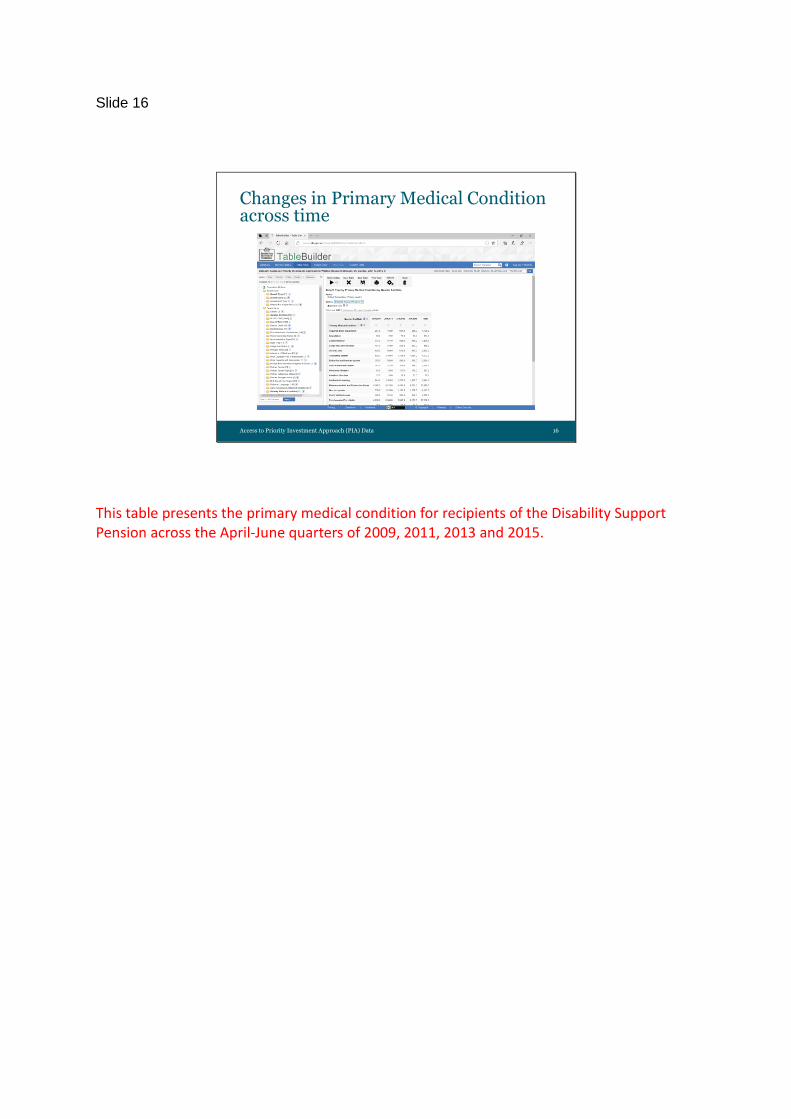
Changes in Primary Medical Condition across time
Access to Priority Investment Approach (PIA) Data 16
This table presents the primary medical condition for recipients of the Disability Support Pension across the April-June quarters of 2009, 2011, 2013 and 2015.
Slide 17
Changes in Primary Medical Condition across time
Access to Priority Investment Approach (PIA) Data 17
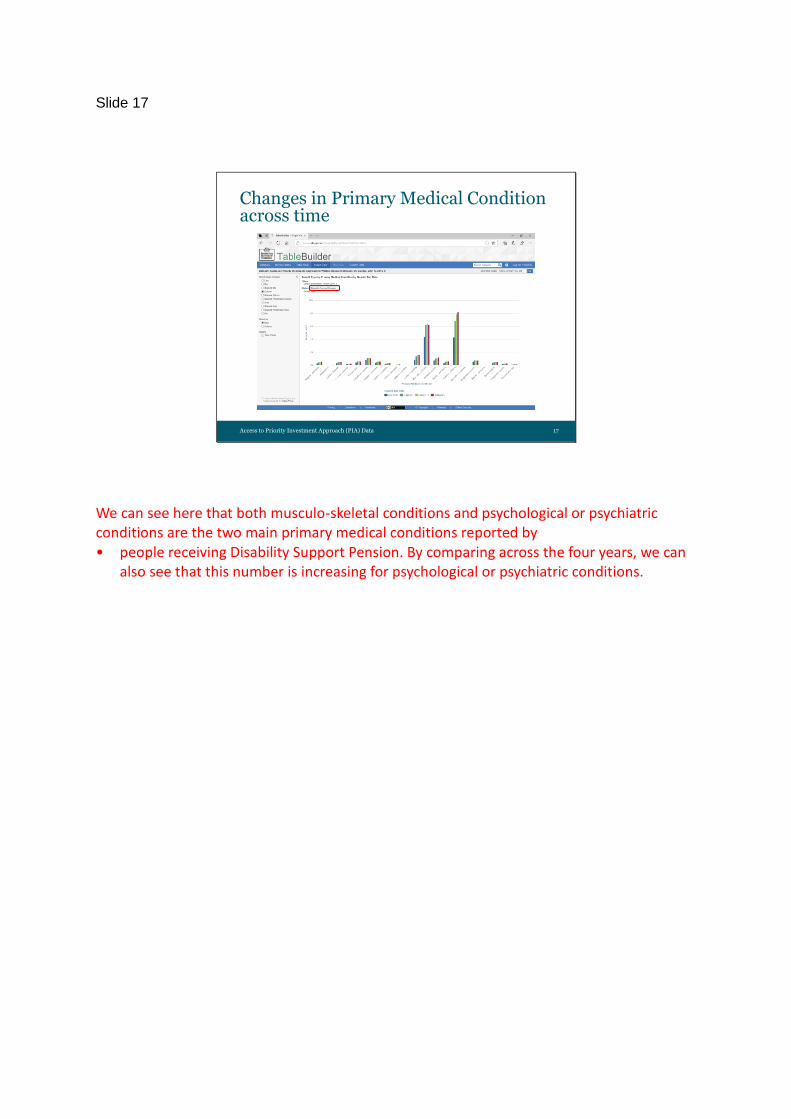
We can see here that both musculo-skeletal conditions and psychological or psychiatric conditions are the two main primary medical conditions reported by • people receiving Disability Support Pension. By comparing across the four years, we can
also see that this number is increasing for psychological or psychiatric conditions.
Slide 18
Changes in Primary Medical Condition across time
Access to Priority Investment Approach (PIA) Data 18
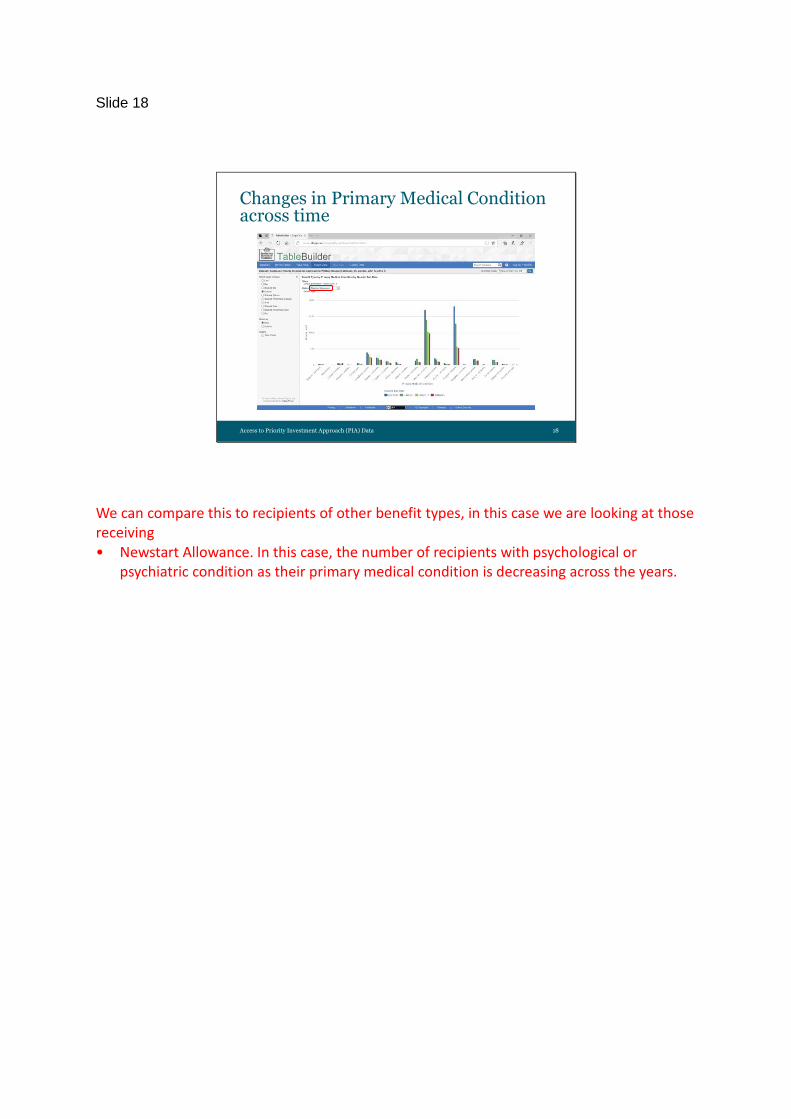
We can compare this to recipients of other benefit types, in this case we are looking at those receiving • Newstart Allowance. In this case, the number of recipients with psychological or
psychiatric condition as their primary medical condition is decreasing across the years.
Slide 19
Changes in Primary Medical Condition across time
Access to Priority Investment Approach (PIA) Data 19
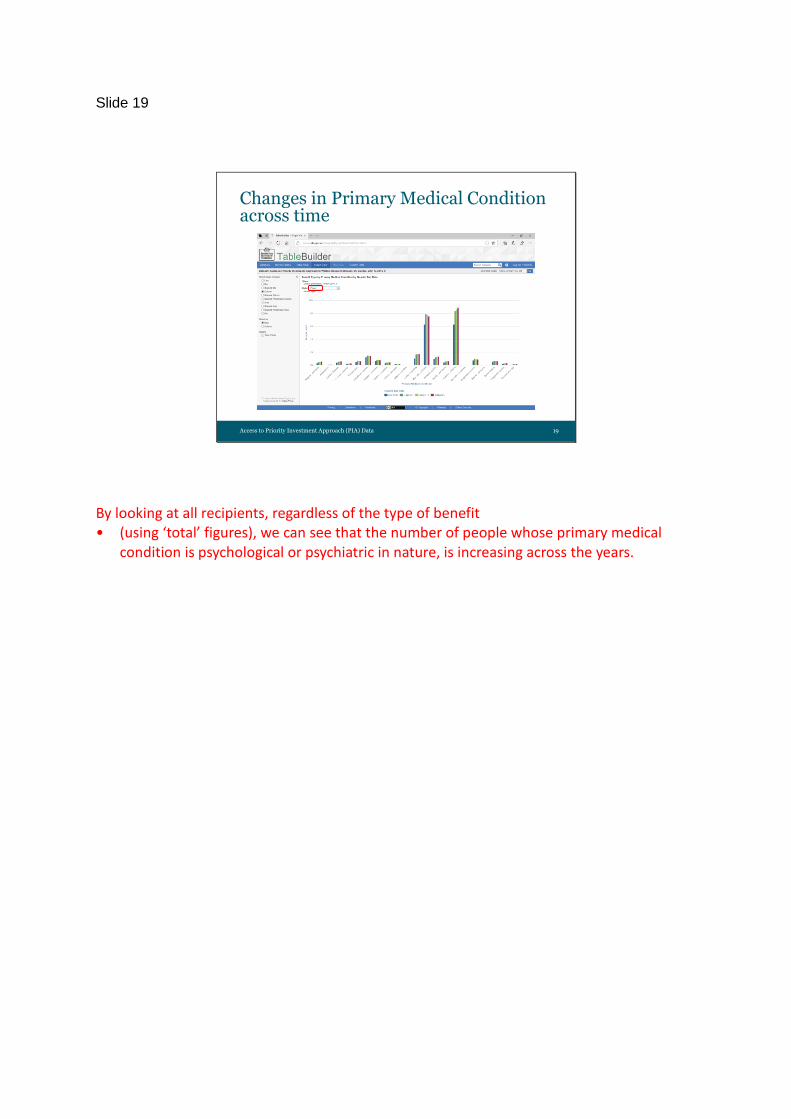
By looking at all recipients, regardless of the type of benefit • (using ‘total’ figures), we can see that the number of people whose primary medical
condition is psychological or psychiatric in nature, is increasing across the years.
Access to Priority Investment Approach (PIA) Data 20
The following session will work through how to use TableBuilder, including some of the features and formatting options, using a number of research questions as examples. Are there any questions from this session?