27
Investment Basics and SIP Investment Funds Summer 2012 SRNS Presented by Benefits and Payroll Accounting
| Date post: | 23-Dec-2015 |
| Category: |
Documents |
| Upload: | jean-tyler |
| View: | 218 times |
| Download: | 0 times |

Investment Basics and SIP Investment Funds
Summer 2012SRNS
Presented by Benefits and Payroll Accounting

Build A Sound Financial Plan
A Sample Financial Plan(For Illustration Purposes Only)
Estate PlanAdvance Health Directive (or Living Will), Will, Trust, Beneficiary Designation, and Other Strategies to Avoid Probate), etc.
Risk Management (Insurance)
Plan Life, Disability, Home, Auto, Umbrella, and
Other
Phase 1:
Cash Management
PlanBalance your budget,
Save, Build and Emergency Fund
Phase 2 & 3:
Investment Plan
Determine Goals and Objectives, Define Risk
Tolerance, Develop Appropriate Asset
Allocation, Diversify, and Rebalance
Retirement Plan
Determine Retirement Age, Lifestyle, and
Develop a Plan to Live Off Your Money
2

Financial Planning: Lifetime Phases
Your SIP is the Most Important Investment Vehicle to Achieve Your Investment, Retirement, and Financial Planning Goals.
3
Phase One: Cash Management
SAVE, Balance Budget, Manage Debt, and Build a Cash reserve (3 to 6
months)
Phase Three: Deccumulation
Live Off Your Assets During Retirement
Phase Two: Accumulation
Maximize Contributions to Your SIP in a Customized Investment Strategy,
and Develop Long Term Financial Goals

Phase One:Cash Management &
Budgeting Basics
4

Phase 1 - Cash Management & Budgeting Basics
Step 1 - Develop a Long Term Plan • Set goals and create a written plan
Step 2 - Learn to Save! Spend Less Than You Earn • Learn to be content and develop self control spending habits. • People can always see what you spend, but not what you Save
Step 3 - Build and Maintain Emergency Savings • An emergency fund will help you survive the difficult times
Step 4 - Minimize the Use of Debt • Utilize a debt repayment schedule• Debt will increase risk and potential financial problems, as well as, potential stress
5

Step 1 – Develop A Long Term Plan
1. Summarize Present Financial Situation: • Calculate your cash flow margin by adding income less expenses. • Then, add the cash flow margin to your appreciation of assets to determine your
growth in net worth.
2. Develop Financial Goals:• Financial Independence• Pay Off Debts• Lifestyle Desires (home, vacation, car)• Giving to Charities
3. Find Ways To Increase Your Cash Flow Margin
4. Control Your Cash Flow
6

Step 2 - Learn to Save! Spend Less Than You Earn
1. Use Ebates or other discount/ rebate sites for shopping online2. Compare rates for utilities & other services3. Get rid of your landline4. Save money with the library5. Buy used items will always save money6. Simplify your wardrobe7. Make money with your clutter8. Maintain items9. Save energy = save money10. Save money on exercise11. Regularly shop insurance rates12. Use cash back debit cards13. Live in a smaller home14. Buy a used car15. Shop after the season16. Shop when no else wants to17. Save money on your home entertainment18. Buy jewelry from a discounter19. Save money at hospital20. Go out to dinner half price
7
You Can See What People Spend But Not What They Save!
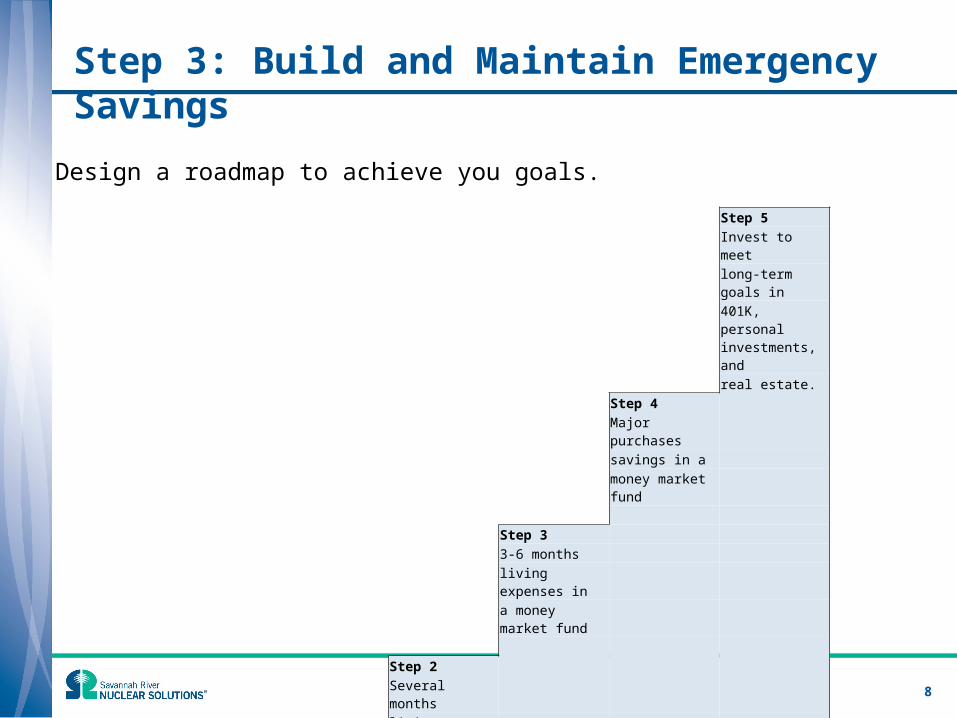
Step 3: Build and Maintain Emergency Savings
Step 5Invest to meet long-term goals in401K, personal investments, and real estate.
Step 4 Major purchases savings in a money market fund
Step 3 3-6 months living expenses in a money market fund
Step 2 Several months living expenses in checking account
Step 1 Eliminate all high interest debt
8
Design a roadmap to achieve you goals.

Step 4 - Minimize and Pay Off Debt
1 - Use a Debt Repayment Schedule to List All Your Debts:
2 – Select An Appropriate Debt Repayment Approach:a. Debt Snowball Approach – ranks and pays off the smallest debts first. As each debt balance is paid off, the
same amount is applied to the next balance. Dave Ramsey and other personal finance experts recommend this approach because it is easy and provides motivation as number the of debts are paid off quicker.
b. Debt Avalanche Method – ranks and pays off the highest interest rates first. As each debt balance is paid off, the same amount is applied to the next balance. This approach is mathematically superior because you will pay less interest over time.
Additional Support Strategies:• Debt Snowflake Method – is in addition to the other strategies. You find ways to save and then, apply the
savings to debt repayment.• Debt Calving Method – is applying additional money received to your debts.
9
Creditor Principal Balance ($) Interest Rate (%) Payment Amount Interest Cost # of Payment Left
1 Credit Card - A $ 900.00 10.00% ***Calculated** ***Calculated** ***Calculated**
2 Credit Card - B $ 1,200.00 15.00% **Calculated** **Calculated** **Calculated**
3 Credit Card - C $ 1,500.00 15.00% ***Calculated** ***Calculated** ***Calculated**
4 Car Loan $ 17,000.00 2.50% **Calculated** **Calculated** **Calculated**

Phase Two & Three: Investment Basics
10

Investing Basics: Timeless Common Sense Wisdom
1. Compound Interest – Albert Einstein stated Compound Interest was the greatest discovery in the 20th century. Compound Interest is when interest is added to the principal from that moment into the future. Basically, the interest will be added to itself and earn interest. This addition of interest to the principal is called compounding.
2. Dollar Cost Averaging - Invest equal monetary amounts on a regular and periodic basis over specific time periods (such as $1,000 monthly) in a particular investment or portfolio. As a result, more shares are purchased when prices are low and fewer shares are purchased when prices are high. The point of this is to lower the total average cost per share of the investment, giving the investor a lower overall cost for the shares purchased over time. (Wikipedia)
3. Diversification – Invest across a variety of asset classes to reducing risks. Diversification is recognized as one of the most important investment techniques to reduce investment risk in a portfolio.
4. Asset Allocation – Asset allocation applies diversification. Asset allocation is the process to choose among asset classes to determine the appropriate mix of asset classes to best meet the needs and objectives of the investor. A large part of the investment side of financial planning focuses on asset allocation.
5. Rebalance - A disciplined rebalance of your asset allocation on a periodic basis to your established percentages in order to stay the course with your goals will avoid misallocations over time.
11

1 - Compound Interest: Example
Question: If you were to invest $1,000 over a four year period, which market return scenario would return the highest amount?
12
Scenario Year 1 Year 2 Year 3 Year 4A 20% 20% 0% 0%B 0% 0% 20% 20%C 20% 0% 20% 0%D 10% 10% 10% 10%

1. Compound Interest – Example
Answer: Scenario D provides the greatest return by investing in a less volatile scenario.
13
Scenario Year 1 Year 2 Year 3 Year 4 TotalA 20% 20% 0% 0% 1,440$ B 0% 0% 20% 20% 1,440$ C 20% 0% 20% 0% 1,440$ D 10% 10% 10% 10% 1,464$

1. Compound Interest – Old Plan SIP Participant Example
14
A SIP Participant under the Old Plan, can earn close to $500,000 over a 15 year period by maximizing your 401K contribution limit of $17,000
Footnote: The illustration hypothetically assumes the market returns is 8% annually; and $17,000 is the 401K maximum limit. Also, the employee earns $95,000 annually; and makes a $14,150 annual contribution to their 401K.
TotalAge 50 to 65 Annually at Age 65SRNS 3% Match ($0.50 per $1.00) $2,850 $84,982Employee Contributes 6% (to receive SRNS Match) $5,700 $169,965Employee Excess Contribution To SIP Limit $8,450 $251,965Total $17,000 $506,912

1. Compound Interest – New Plan SIP Participant Example
15
A SIP Participant under the New Plan, can build a significant amount of retirement assets over a 35 year period by maximizing your 401K contribution limit of $17,000
Footnote: The illustration hypothetically assumes the market returns is 8% annually; and $17,000 is the 401K maximum limit. Also, the employee earns $75,000 annually; and makes a $10,250 annual contribution to their 401K.
TotalAge 30 to 65 Annually at Age 65SRNS 5% Contribution $3,750 $670,068SRNS 4% Match ($0.50 per $1.00) $3,000 $536,054Employee Contributes 8% (to receive SRNS Match) $6,000 $1,072,109Employee Excess Contribution To SIP Limit $4,250 $759,410Total $17,000 $3,037,641
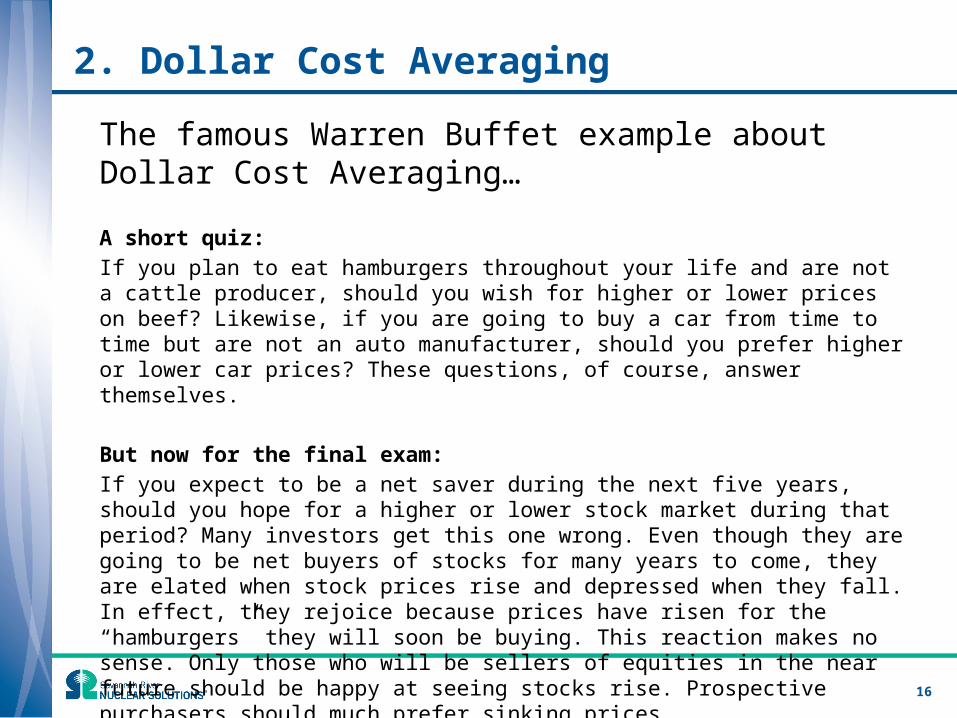
2. Dollar Cost Averaging
The famous Warren Buffet example about Dollar Cost Averaging…
A short quiz: If you plan to eat hamburgers throughout your life and are not a cattle producer, should you wish for higher or lower prices on beef? Likewise, if you are going to buy a car from time to time but are not an auto manufacturer, should you prefer higher or lower car prices? These questions, of course, answer themselves.
But now for the final exam: If you expect to be a net saver during the next five years, should you hope for a higher or lower stock market during that period? Many investors get this one wrong. Even though they are going to be net buyers of stocks for many years to come, they are elated when stock prices rise and depressed when they fall. In effect, they rejoice because prices have risen for the “hamburgers” they will soon be buying. This reaction makes no sense. Only those who will be sellers of equities in the near future should be happy at seeing stocks rise. Prospective purchasers should much prefer sinking prices.
16

2. Dollar Cost Averaging
Dollar Cost Averaging protects you from making the mistake of “timing the market” and thus providing you the opportunity to make more money over longer period of time.
17
Number Number Amount Price of of Shares Amount Price of of Shares
Period Invested Index Fund Purchased Invested Index Fund Purchased1 $1,000 $100 10.00 $1,000 $100 10.002 1,000 80 12.50 1,000 110 9.093 1,000 60 16.67 1,000 120 8.334 1,000 100 10.00 1,000 130 7.695 1,000 110 9.09 1,000 140 7.14
Total $5,000 58.26 $5,000 42.26
Average Cost of Shares Purchased
$85.83$5,000 ÷
58.26$118.32
$5,000 ÷ 42.26
Value at Period 5 $6,408 58.26 x $110 $5,916 42.26 x $140
Volatile Flat Market Rising Market
Illustration is from Vanguard Investments material

3. Diversification - Steps to Diversify
1. Identify your investment goals• (ideal asset amount to retire, estimated annual retire income)
2. Determine your investor profile • ( investment experience, risk tolerance, time horizon)
3. Choose your asset allocation
4. Select your investments within your asset allocation mix
5. Review you plan on an annual basis
18
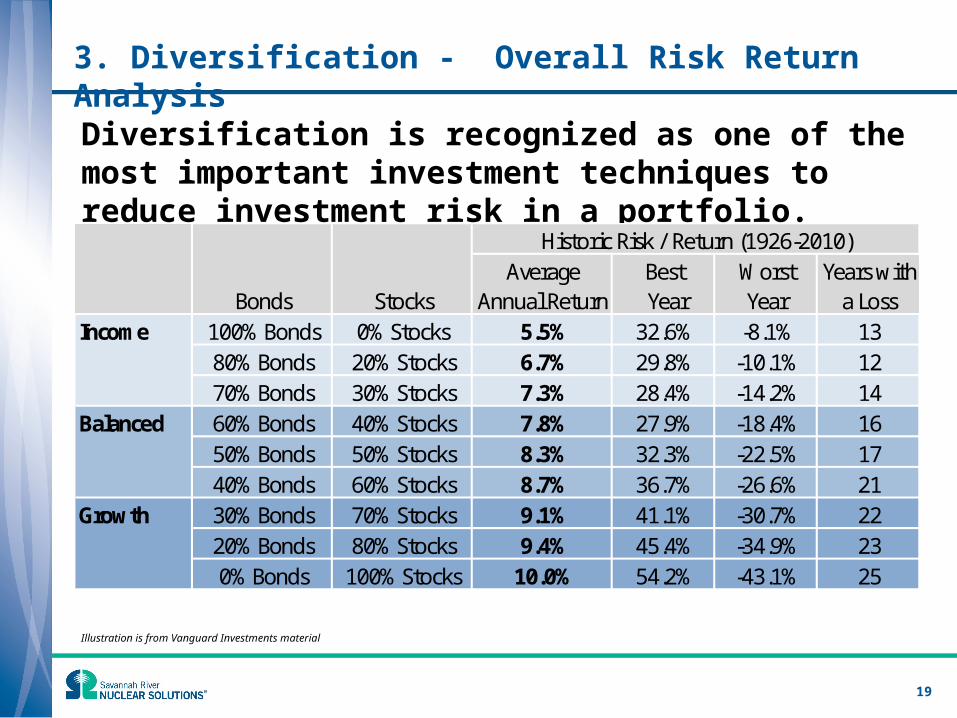
3. Diversification - Overall Risk Return Analysis
Diversification is recognized as one of the most important investment techniques to reduce investment risk in a portfolio.
19
Average Best Worst Years withBonds Stocks Annual Return Year Year a Loss
Income 100% Bonds 0% Stocks 5.5% 32.6% -8.1% 1380% Bonds 20% Stocks 6.7% 29.8% -10.1% 1270% Bonds 30% Stocks 7.3% 28.4% -14.2% 14
Balanced 60% Bonds 40% Stocks 7.8% 27.9% -18.4% 1650% Bonds 50% Stocks 8.3% 32.3% -22.5% 1740% Bonds 60% Stocks 8.7% 36.7% -26.6% 21
Growth 30% Bonds 70% Stocks 9.1% 41.1% -30.7% 2220% Bonds 80% Stocks 9.4% 45.4% -34.9% 230% Bonds 100% Stocks 10.0% 54.2% -43.1% 25
Historic Risk / Return (1926-2010)
Illustration is from Vanguard Investments material

4. Asset Allocation – Overview of Main Asset Classes
1. Cash: • Advantage is liquidity • Disadvantage is the loss in future purchase power due to inflation
2. Fixed Income or Bonds: • Definition is a debt security, in which the authorized issuer owes the holders a debt and,
depending on the terms of the bond, is obliged to pay interest (the coupon) to use and/or to repay the principal at a later date, termed maturity
• Advantages is the steady stream of income and stability in value • Disadvantage is the exposure to interest rates risks and credit risks
• Equities or Stocks: • Definition is direct ownership of a business entity represents the original capital paid into or
invested in the business by its founders• Advantage and disadvantage to owning a stock is the potential volatility in market value
20

4. Asset Allocation – Risk Return Profile
21
Return %
Risk (Standard Deviation)
Cash
Bonds
Large Cap Equity
Mid/Small Cap Equity
International Equity

5. Disciplined Rebalancing – Generates Balanced Returns
22
Greater returns are generated using diversification and rebalancing!

The SIP Investment Fund Line Up
Vanguard Target Retirement Income Vanguard Target Retirement 2010 Vanguard Target Retirement 2015 Vanguard Target Retirement 2020Vanguard Target Retirement 2025 Vanguard Target Retirement 2030 Vanguard Target Retirement 2035 Vanguard Target Retirement 2040Vanguard Target Retirement 2045 Vanguard Target Retirement 2050 Vanguard Target Retirement 2055 Vanguard Target Retirement 2060
Equity or Stock Fund Fixed Income or Bond Fund Real Estate Fund
Vanguard Total Stock Market Index SSgA Passive Bond Market Index Vanguard REIT IndexMSCI U.S. Broad Market Index Barclays Aggregate Bond Index MSCI REIT Index
SSgA S&P 500 FlagshipS&P 500 Index
SSgA Russell 1000 ValueRussell 1000 Value Index
Vanguard Small Cap Value IndexPerformance Benchmark
Blackrock All Country World Ex-U.S. IndexMSCI All Country World ex-U.S. Index
Equity or Stock Fund Fixed Income or Bond Fund Blend or Asset Allocation Fund Stable Value FundsT. Rowe Price Inst. Large Cap Growth PIMCO Total Return Fund Fidelity Puritan Vanguard REIT IndexMSCI U.S. Broad Market Index Barclays Aggregate Bond Index 60% = S&P 500 Index $ 40% Aggregate Bond Index Citigroup 90-Day T-Bill Index & Hueler Stable Value Index
Vanguard Selected Value FundRussell MidCap Value Index
Rainier Small/Mid Equity Inst. FundRussell 1000 Value Index
Jennison Small Cap Equity FundRussell 2500 Index
Dodge and Cox Global Stock FundMSCI All Country World ex-U.S. Index
23
Tier 1 – Target Date Funds
Tier 2 – Index Funds (Passive Management)
Tier 3 – Active Funds (Active Management)

Risk Profile: Tier 1 – All Target Date Funds
24
Source Hewitt EnnisKnupp

Risk Profile: Tier 2 – Index Funds (Passive Management)
25
Source Hewitt EnnisKnupp

Risk Profile: Tier 3 – Actively Managed Funds
26
Source Hewitt EnnisKnupp

Questions
• Discuss the different options for life insurance (term, universal, whole, etc.).• What are some of the best ways to save for a son/daughter's college fund? What do you
think of the Gerber College Fund?• How much accessible cash should I have in Savings? 1 month, 2 month, 3 month? What
are your personal experiences with needing to pull from savings?• What are the pros and cons in rental homes as investment properties? • Most interested in home buying information.• What are some ways to save when you have children?• Where do I find the best deal on a refinancing?
27


