Page 1
Investment Office ANRS
PROJECT PROFILE ON THE ESTABLISHMENT PROJECT PROFILE ON THE ESTABLISHMENT PROJECT PROFILE ON THE ESTABLISHMENT PROJECT PROFILE ON THE ESTABLISHMENT
OF GRINDING STONESOF GRINDING STONESOF GRINDING STONESOF GRINDING STONES PRODUCTIONPRODUCTIONPRODUCTIONPRODUCTION
DDDDevelopment Studies Associates (DSA)evelopment Studies Associates (DSA)evelopment Studies Associates (DSA)evelopment Studies Associates (DSA)
October 2008
Addis Ababa
Page 2
Table of Contents
1. Executive Summary ................................................................. 1
2. Product Description and Application..................................... 1
3. Market Study, Plant Capacity and Production Program.... 2
3.1 Market Study....................................................................................................... 2
3.1.1 Present Demand and Supply ....................................................................... 2
3.1.2 Projected Demand....................................................................................... 3
3.1.3 Pricing and Distribution.............................................................................. 4
3.2 Plant Capacity ..................................................................................................... 4
3.3 Production Program ............................................................................................ 5
4. Raw Materials and Utilities..................................................... 5
4.1 Availability and Source of Raw Materials.......................................................... 5
4.2 Annual Requirement and Cost of Raw Materials and Utilities........................... 5
5. Location and Site ...................................................................... 6
6. Technology and Engineering................................................... 6
6.1 Production Process.............................................................................................. 6
6.2 Machinery and Equipment.................................................................................. 7
6.3 Civil Engineering Cost........................................................................................ 8
7. Human Resource and Training Requirement....................... 8
7.1 Human Resource................................................................................................. 8
7.2 Training Requirement ......................................................................................... 8
8. Financial Analysis .................................................................... 9
8.1 Underlying Assumption ...................................................................................... 9
8.2 Investment......................................................................................................... 10
8.3 Production Costs ............................................................................................... 10
8.4 Financial Evaluation ......................................................................................... 11
9. Economic and Social Benefits and Justification ................. 12
ANNEXES .................................................................................... 14
Page 3
1
1. Executive Summary
This profile envisages the establishment of a plant in Amhara Region for the production
of 1500 pairs of girding stones per year.
The present demand for grinding stone is estimated at 3000 pairs of grinding stones per
annum. The demanded is expected to grow to 3300 and 7781 pairs of grindings stones by
2001 and 2010 years, respectively.
The total investment requirement is estimated at 2,762,107 out of which 1,5s00,000 or
54.3% is for machinery and equipment.
The plant will create employment opportunity for 24 persons.
The project is financially viable with an internal rate of return (IRR) 29.5% and a net
present value (NPV) of Birr 2.1 million discounted at 18%.
2. Product Description and Application
Grinding stone is an implement for small-scale grain milling industries. It is made of
abrasive material which in general including a wide range of materials extensively used
in almost every branch of industry for cutting, polishing, grinding, etc of various
materials. The abrasive materials employed are required to be hard, tough and sharp.
Depending upon its application and purpose, the grinding stone can be made of fire clay,
magnetite, silicate of soda and bonding material mixed with resin. The ratio of abrasive to
bonding material determines the hardness and density of the grinding stone. Grinding
stones are made in different sizes, shape and specifications.
Grinding stones are mainly used for grinding of cereals into starch and flour. They are
also required for grinding vitreous bricks, glass, granite, lather, porcelain and slate etc.
Page 4
2
Roasted and hulled barley grain for making local “besso”, coarsely crushed up and
cleaned peas and beans for preparing “sbiro”, dried and spiced peppers for preparation of
“mitmitta”, etc are all ground flour in the village mills using grinding stones.
3. Market Study, Plant Capacity and Production Program
3.1 Market Study
3.1.1 Present Demand and Supply
One of the varieties of work in which grinding stones perform (tool and cutter
sharpening, cylindrical grinding, roll grinding, general and surface grinding) is the
grinding of cereals into starch and flour. Grinding stone is mainly consumed by grain
mills, the largest small scale industry in the country.
Since very recently the country has been importing required grinding stones from abroad.
But today the production of same is started in the country by a plant called “BEZA
INDUSTRY” established in Addis Ababa. Grinding stones produced by BEZA are well
accepted in the Addis Ababa market.
According to data obtained from the external trade statistics of the Customs Authority
(1990-200001), the country has been importing about 3,249,447 kg ( about 3,249 tons)
mills and grinding stones for milling, grinding or pulling purposes for the last ten years
with CIF value of Birr 17,878,035. This indicates that the annual average import of such
items at national level is about 325 tons with equivalent CIF value of Birr 1,787,804.
Since the import of mills and grinding stone vary from year to year the current national
effective demand (2000) is estimated on the basis of the last ten years’ average supply of
the product (325 tons). From the total import of grinding stones a certain percentage is
used by Amhara Region’s grain mill owners as spare part for their grain mills.
1 Years in this document are in Ethiopian Calendar.
Page 5
3
Information obtained from opportunity studies of “Grain Mill”, made by DSA consultant
in 2000, there are abut 3000 grain mills serving about 19 million population of Amhara
Region This indicates that currently one mill is serving more than 6,333 people.
However, there is no plant that produces either the grinding stone as spare part or the
grain mills in the region. Since almost all people living in the urban centers and most
people of the rural areas of the region use grain mills to grind their cereals and spices, the
production of grinding stones and constructing small-scale grinding mills is very
important to the wellbeing of women in particular and to the development of the region in
general.
A knowledgeable person in grain mill business indicated that a grain mill requires about a
pair of grinding stones every year on the average. Therefore the existing 3000 grain mills
need 3000 pairs of stones. This indicates the current effective demand of grinding stones
of the region.
3.1.2 Projected Demand
Traditionally rural village women use ordinary stone to grind their grain. This method is
a hard way for flour making and is tedious and hazardous to the health of the women.
Currently in the rural villages, the people use small-scale grinding mills to process their
grain. A small-scale grinding mill serves a large number of households. Demand for
grinding stones, in this case, is a derived demand from the need for grinding (flour) mills.
To indicate the demand for grinding stones of Amhara Region the following assumptions
are developed:-
a) Demand for grinding mills and thus stones are related with the agriculture
outputs, particularly cereals production and consumption as well as the growth in
manufacturing sector.
b) The demand for grinding mills and thus stones will increase on the basis of the
current average growth rates of agriculture (9.4%) and Industry (11%) sectors that
is about 10%.
c) Demand projection is based on the current (2000) effective demand for grinding
mills (3000) and thus 6000 pieces of stones.
Page 6
4
As indicated in table 1 bellow, demand for grinding stones in Amhara region will
increase from 6600 units (3300 pairs) in 2001 to 15562 units (7781 pairs) of stones in
2010.
Table 1
Demand Projections for Grinding Stones
3.1.3 Pricing and Distribution
The current selling price of BEZA's product ranges from Birr 2200 to Birr 3000 for a pair
of stones. (A pair of stones with 60 diameters weighs about 150 kg). To attract the
market, the proposed plant is assumed to sell its product at Birr 2000 for a pair of stones.
Grinding stones will be distributed though specialized distribution agents of hard wares
having the relevant experience.
3.2 Plant Capacity
The production capacity of the plant is 225 tons (which is equivalent to about 1500 pairs)
of grinding stone per annum, working a single shift (8 hours) a day for a total of 275
days. Production can be increased by working in two or three shifts at later stages if the
product is warranted by the market.
Year Grinding Mills Grinding Stones
2001 3300 6600
2002 3630 7260
2003 3993 7986
2004 4392 8784
2005 4832 9664
2006 5315 10630
2007 5846 11692
2008 6430 12860
2009 7074 14148
2010 7781 15562
Page 7
5
3.3 Production Program
Considering the time required for skill development in operation and market penetration,
the plant will operate at 75% and 85% of the installed capacity during the first and the
second year respectively. Full capacity operation could be attained from third year
onwards .
4. Raw Materials and Utilities
4.1 Availability and Source of Raw Materials
The main raw materials for grinding stone manufacturing are imported items obtained
preferably from India or China. The main items are:
- Silicon carbide
- Graphite
- Ferro Silicon
- Other materials like binders.
4.2 Annual Requirement and Cost of Raw Materials and Utilities
The annual cost of raw materials and utilities for the production of 1500 pairs of grinding
are given in table 2.
Page 8
6
Table 2
Materials Requirement
5. Location and Site
The location of grinding stones producing plant is better placed in towns situated
around the center of the region to easily reach its customers. In this regard the
proposed plant should be located in either Bahir Dar or Debre Tabour towns.
6. Technology and Engineering
6.1 Production Process
The production process of grinding stone comprises the following stages:
• Required ingredients, as per the desired application and purpose of the
grinding stone are mixed with resin to prepare coated abrasive,
• Coated abrasives are mixed with resin and moulds are prepared and put under
a hydraulic ram to exert pressure,
Cost in Birr Material Qty F.C L.C Total
1. Silicon Carbide 48 ton 530,608 176,870 707,478
2. Graphite 36 ton 338,936 112,979 451,915
3. Ferro-Silicon 12 ton 132,652 44,217 176,869
Other misc. materials like binder etc - 100,000 100,000
Sub Total 1,002,196 434,066 1,436,262
Utilities
Power 25kw 33,000
Water 1000m3 2,650
Sub total 35,650 35,650
Total 1,002,196 469,716 1,471,912
Page 9
7
• Molded millstones are baked in oven at a required temperature and allowed to
cool after baking,
• Millstone wheels are trued for outside diameter and finish,
• Wheels are finally tested for Speed.
The technical data and information are compiled from a document provided by the
National Research Development Corporation of India.
6.2 Machinery and Equipment
The list of machinery and equipment required for manufacturing of grinding stones are
given in Table 3. The total cost of machinery and equipment is Birr 1,500,000 out of
which about 85% (Birr 1,275,000 is required in foreign currency.
Table 3
Machinery and Equipment
Description Qty (pcs)
1. Crusher with fittings 1
2. Weighing scale 1
3. Ball mills with 7.5 HP motor 1
4. V-draught kneading mixer 1
5. Vibrating screen with dust accumulator 1
6. Hydraulic press 1
7. Misc. tools like heating kettle, mixing shovel sets 1
8. Testing equipment 1
9. Down draught kilns 1
10. Furnace/oven 1
Page 10
8
6.3 Civil Engineering Cost
The total land required for the grinding stones manufacturing plant is 500m2. The total
built-up area is 300m2. The estimated total cost of building at the rate of Birr 1,500m
2
amounts to Birr 450,000.
7. Human Resource and Training Requirement
7.1 Human Resource
The total human resource requirement for the plant is 24 persons. The estimated labor
cost amounts to Birr 364,320. Table 4 depicts full details of the human resource
requirement of the plant.
Table 4
Human Resource Requirement
7.2 Training Requirement
Ten skilled production personnel need a five day on-the-job training on how to operate
the machines. Estimated cost of training amounts to Birr 5,000.
Description Qty. Monthly Salary
(Birr)
Annual Salary
(Birr)
1. Manger/engineer 1 3,000 36,000
2. Accountant/clerk 1 1,500 18,000
3. Supervisor 1 2,000 24,000
4. Skilled workers(Operators & technicians) 10 15,000 180,000
5. Unskilled workers(Labourers) 10 3,500 42,000
6. Office boy 1 300 3,600
Total 24 25,300 303,600
Worker’s benefit(20% ) 60,720
Grand total 364,320
Page 11
9
8. Financial Analysis
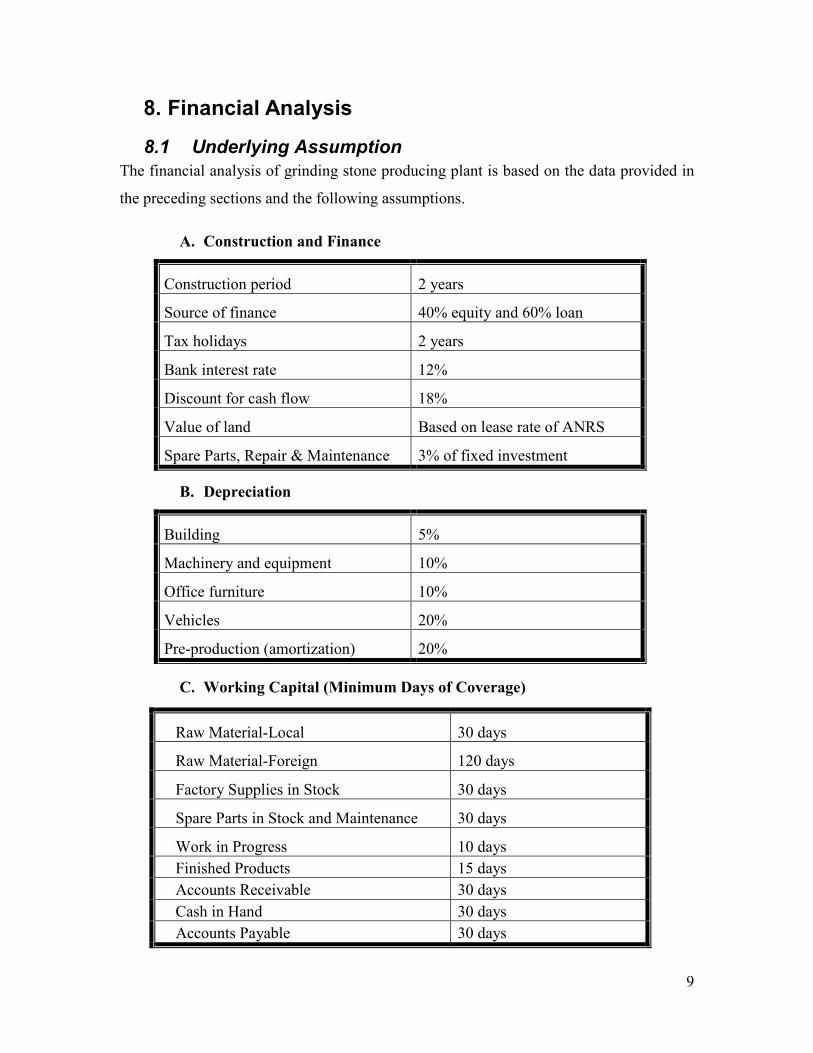
8.1 Underlying Assumption
The financial analysis of grinding stone producing plant is based on the data provided in
the preceding sections and the following assumptions.
A. Construction and Finance
Construction period 2 years
Source of finance 40% equity and 60% loan
Tax holidays 2 years
Bank interest rate 12%
Discount for cash flow 18%
Value of land Based on lease rate of ANRS
Spare Parts, Repair & Maintenance 3% of fixed investment
B. Depreciation
Building 5%
Machinery and equipment 10%
Office furniture 10%
Vehicles 20%
Pre-production (amortization) 20%
C. Working Capital (Minimum Days of Coverage)
Raw Material-Local 30 days
Raw Material-Foreign 120 days
Factory Supplies in Stock 30 days
Spare Parts in Stock and Maintenance 30 days
Work in Progress 10 days
Finished Products 15 days
Accounts Receivable 30 days
Cash in Hand 30 days
Accounts Payable 30 days
Page 12
10
8.2 Investment
The total investment cost of the project including working capital is estimated at Birr 2.8
million as shown in table 5 below. The Owner shall contribute 40% of the finance in the
form of equity while the remaining 60% is to be financed by bank loan.
The foreign component of the project accounts to Birr 1.3 million or 49.2% of the total
investment cost.
Table 5: Total initial investment
Items L.C F.C Total
Land 1,500
- 1,500
Building and civil works 450,000
- 450,000
Office equipment 5,000
- 5,000
Vehicles -
- -
Plant machinery & equipment 225,000 1,275,000 1,500,000
Total fixed investment cost 681,500 1,275,000 1,956,500
Pre production capital
expenditure* 97,825
-
97,825
Total initial investment 779,325 1,275,000 2,054,325
Working capital at full capacity 707,782 707.782
Total 1,487,107 1,275,000 2,762,107
*Pre-production capital expenditure includes - all expenses for pre-investment studies,
consultancy fee during construction and expenses for company‘s establishment, project
administration expenses, commission expenses, preproduction marketing and interest
expenses during construction.
8.3 Production Costs
The total production cost at full capacity operation is estimated at Birr 2.5 million (See
Table 6). Raw materials and utilities account for 86.5%.
Page 13
11
Table 6
Total Production Cost at full Capacity
Items Cost
1. Raw materials 1,436,262.00
2. Utilities 35,650.00
3. Wages and Salaries 364,320.00
4. Spares and Maintenance 58,695.00
Factory costs 1,894,927.00
5. Depreciation 192,565.00
6. Financial costs 431,150.20
Total Production Cost 2,518,642.20
8.4 Financial Evaluation
I. Profitability
According to the projected income statement, the project will generate profit beginning
from first year of operation. Important ratios such as net profit to equity (Return on
equity) and net profit and interest on total investment (return on total investment) are
19.29% and 24.92% in the first year and are gradually rising. The income statement and
other profitability indicators show that the project is viable.
II. Breakeven Analysis
The breakeven point of the project is estimated by using income statement projection.
Accordingly the project will breakeven at 27.8% of capacity utilization.
Page 14
12
III. Payback Period
Investment cost and income statement projection are used in estimating the project
payback period. The project will payback fully the initial investment less working capital
in three years time.
IV. Simple Rate of Return
It is a ratio of net profit and interest to the total capital invested for a single year at full
capacity operation. Thus the SRR of the project is calculated to be 24.7%.
V. Internal Rate of Return and Net Present Value
Based on the projected cash flow statement, the calculated IRR of the project is 29.5%
and the net present value (NPV) is Birr 2.1 million.
VI. Sensitivity Analysis
The financial viability of the grinding stone processing plant will not be affected if prices
of raw materials are increased by 10%.
9. Economic and Social Benefits and Justification
Based on the foregoing presentation and analysis, we can see that the proposed project
possesses wide range of benefits that complement the financial feasibility obtained
earlier. In general the envisaged project promotes the socio-economic goals and
objectives stated in the strategic plan of the Amhara National Regional State. These
benefits are listed as follows.
A. Profit Generation
The project is found to be financially viable and will earns on average a profit of Birr 0.6
million per year and Birr 5.9 million within the project life. Such result induces the
project promoters to reinvest the profit which, therefore, increases the investment
magnitude in the region.
Page 15
13
B. Tax Revenue
In the project life under consideration, the region will collect about Birr 1.9 million from
corporate tax payment alone (i.e. excluding income tax, sales tax and VAT). Such result
creates additional fund for the regional government that will be used in expanding social
and other basic services in the region.
C. Import Substitution and Foreign Exchange Saving
As there is only one local grinding stone production plant in the country, the
commencement of this project relieves a portion of the import burden. That is, based on
the projected figure we learn that in the project life an estimated amount of US Dollar 3.2
million will be saved as a result of the proposed project. This will create room for the
saved hard currency to be allocated to other vital and strategic sectors
D. Employment and Income Generation
The proposed project is expected to create employment opportunity for 24 citizens of the
region. Consequently the project creates income of Birr 364 thousand per year. This
would be one of the commendable accomplishments of the project.
E. Pro Environment Project
The proposed production process is environment friendly.
F. Diversification and InterSectoral linkage.
The proposed project helps to diversify ANRS’ and Ethiopian economy. It contributes to
industrialization of the region as well as the county’s economy.
Page 17
1
Annex 1: Total Net Working Capital Requirements (in Birr)
CONSTRUCTION PRODUCTION
Year 1 Year 2 1 2 3 4
Capacity Utilization (%) 0 0 75% 85% 100% 100%
1. Total Inventory 0 0 861618.2 976500.6 1148824 1148824
Raw Materials in Stock- Total 0 0 363505.9 411973.4 484674.5 484674.5
Raw Material-Local 0 0 35514.49 40249.76 47352.65 47352.65
Raw Material-Foreign 0 0 327991.4 371723.6 437321.9 437321.9
Factory Supplies in Stock 0 0 1707.948 1935.674 2277.264 2277.264
Spare Parts in Stock and Maintenance 0 0 4802.318 5442.627 6403.091 6403.091
Work in Progress 0 0 42698.7 48391.86 56931.6 56931.6
Finished Products 0 0 85397.4 96783.72 113863.2 113863.2
2. Accounts Receivable 0 0 245454.5 278181.8 327272.7 327272.7
3. Cash in Hand 0 0 32724.82 37088.13 43633.09 43633.09
CURRENT ASSETS 0 0 776291.6 879797.2 1035056 1035056
4. Current Liabilities 0 0 245454.5 278181.8 327272.7 327272.7
Accounts Payable 0 0 245454.5 278181.8 327272.7 327272.7
TOTAL NET WORKING CAPITAL REQUIRMENTS 0 0 530837.1 601615.4 707782.8 707782.8
INCREASE IN NET WORKING CAPITAL 0 0 530837.1 70778.28 106167.4 0
Page 18
2
Annex1: Total Net Working Capital Requirements (in Birr)
PRODUCTION
5 6 7 8 9 10
Capacity Utilization (%) 100% 100% 100% 100% 100% 100%
1. Total Inventory 1148824 1148824 1148824 1148824 1148824 1148824
Raw Materials in Stock-Total 484674.5 484674.5 484674.5 484674.5 484674.5 484674.5
Raw Material-Local 47352.65 47352.65 47352.65 47352.65 47352.65 47352.65
Raw Material-Foreign 437321.9 437321.9 437321.9 437321.9 437321.9 437321.9
Factory Supplies in Stock 2277.264 2277.264 2277.264 2277.264 2277.264 2277.264
Spare Parts in Stock and Maintenance 6403.091 6403.091 6403.091 6403.091 6403.091 6403.091
Work in Progress 56931.6 56931.6 56931.6 56931.6 56931.6 56931.6
Finished Products 113863.2 113863.2 113863.2 113863.2 113863.2 113863.2
2. Accounts Receivable 327272.7 327272.7 327272.7 327272.7 327272.7 327272.7
3. Cash in Hand 43633.09 43633.09 43633.09 43633.09 43633.09 43633.09
CURRENT ASSETS 1035056 1035056 1035056 1035056 1035056 1035056
4. Current Liabilities 327272.7 327272.7 327272.7 327272.7 327272.7 327272.7
Accounts Payable 327272.7 327272.7 327272.7 327272.7 327272.7 327272.7
TOTAL NET WORKING CAPITAL REQUIRMENTS 707782.8 707782.8 707782.8 707782.8 707782.8 707782.8
INCREASE IN NET WORKING CAPITAL 0 0 0 0 0 0
Page 19
3
Annex 2: Cash Flow Statement (in Birr)
CONSTRUCTION PRODUCTION
Year 1 Year 2 1 2 3 4
TOTAL CASH INFLOW 1027162.5 1734945.29 2495454.55 2582727.27 3049090.91 3000000
1. Inflow Funds 1027162.5 1734945.29 245454.545 32727.2727 49090.9091 0
Total Equity 410865 693978.117 0 0 0 0
Total Long Term Loan 616297.5 1040967.17 0 0 0 0
Total Short Term Finances 0 0 245454.545 32727.2727 49090.9091 0
2. Inflow Operation 0 0 2250000 2550000 3000000 3000000
Sales Revenue 0 0 2250000 2550000 3000000 3000000
Interest on Securities 0 0 0 0 0 0
3. Other Income 0 0 0 0 0 0
TOTAL CASH OUTFLOW 1027162.5 1027162.5 2620549.53 2177406.47 2474579.99 2525417.19
4. Increase In Fixed Assets 1027162.5 1027162.5 0 0 0 0
Fixed Investments 978250 978250 0 0 0 0
Pre-production Expenditures 48912.5 48912.5 0 0 0 0
5. Increase in Current Assets 0 0 776291.639 103505.552 155258.328 0
6. Operating Costs 0 0 1413107.69 1598818.38 1877384.42 1877384.42
7. Corporate Tax Paid 0 0 0 0 0 239240.822
8. Interest Paid 0 0 431150.205 198871.761 165726.467 132581.174
9.Loan Repayments 0 0 0 276210.779 276210.779 276210.779
10.Dividends Paid 0 0 0 0 0 0
Surplus(Deficit) 0 707782.791 -125094.99 405320.799 574510.915 474582.805
Cumulative Cash Balance 0 707782.791 582687.803 988008.602 1562519.52 2037102.32
Page 20
4
Annex 2: Cash Flow Statement (in Birr): Continued PRODUCTION
5 6 7 8 9 10
TOTAL CASH INFLOW 3000000 3000000 3000000 3000000 3000000 3000000
1. Inflow Funds 0 0 0 0 0 0
Total Equity 0 0 0 0 0 0
Total Long Term Loan 0 0 0 0 0 0
Total Short Term Finances 0 0 0 0 0 0
2. Inflow Operation 3000000 3000000 3000000 3000000 3000000 3000000
Sales Revenue 3000000 3000000 3000000 3000000 3000000 3000000
Interest on Securities 0 0 0 0 0 0
3. Other Income 0 0 0 0 0 0
TOTAL CASH OUTFLOW 2502215.49 2484883.28 2461681.58 2162269.09 2162269.09 2162269.09
4. Increase In Fixed Assets 0 0 0 0 0 0
Fixed Investments 0 0 0 0 0 0
Pre-production Expenditures 0 0 0 0 0 0
5. Increase in Current Assets 0 0 0 0 0 0
6. Operating Costs 1877384.42 1877384.42 1877384.42 1877384.42 1877384.42 1877384.42
7. Corporate Tax Paid 249184.41 264997.498 274941.086 284884.674 284884.674 284884.674
8. Interest Paid 99435.8805 66290.587 33145.2935 0 0 0
9. Loan Repayments 276210.779 276210.779 276210.779 0 0 0
10.Dividends Paid 0 0 0 0 0 0
Surplus(Deficit) 497784.511 515116.716 538318.421 837730.906 837730.906 837730.906
Cumulative Cash Balance 2534886.83 3050003.55 3588321.97 4426052.88 5263783.78 6101514.69
Page 21
5
Annex 3: DISCOUNTED CASH FLOW-TOTAL CAPITAL INVESTED
CONSTRUCTION PRODUCTION
Year 1 Year 2 1 2 3 4
TOTAL CASH INFLOW 0 0 2250000 2550000 3000000 3000000
1. Inflow Operation 0 0 2250000 2550000 3000000 3000000
Sales Revenue 0 0 2250000 2550000 3000000 3000000
Interest on Securities 0 0 0 0 0 0
2. Other Income 0 0 0 0 0 0
TOTAL CASH OUTFLOW 1027162.5 1027162.5 1943944.783 1669596.661 1983551.839 2116625.242
3. Increase in Fixed Assets 1027162.5 1027162.5 0 0 0 0
Fixed Investments 978250 978250 0 0 0 0
Pre-production Expenditures 48912.5 48912.5 0 0 0 0
4. Increase in Net Working Capital 0 0 530837.0935 70778.27913 106167.4187 0
5. Operating Costs 0 0 1413107.69 1598818.382 1877384.42 1877384.42
6. Corporate Tax Paid 0 0 0 0 0 239240.8218
NET CASH FLOW -1027162.5 -1027162.5 306055.2165 880403.3389 1016448.161 883374.7582
CUMMULATIVE NET CASH FLOW -1027162.5 -2054325 -1748269.78 -867866.445 148581.7167 1031956.475
Net Present Value (at 18%) -1027162.5 -870476.695 219804.0912 535840.6524 524272.6538 386131.2482
Cumulative Net present Value -1027162.5 -1897639.19 -1677835.1 -1141994.45 -617721.798 -231590.549
Page 22
6
Annex 3: DISCOUNTED CASH FLOW-TOTAL CAPITAL INVESTED (Continued) PRODUCTION
5 6 7 8 9 10
TOTAL CASH INFLOW 3000000 3000000 3000000 3000000 3000000 3000000
1. Inflow Operation 3000000 3000000 3000000 3000000 3000000 3000000
Sales Revenue 3000000 3000000 3000000 3000000 3000000 3000000
Interest on Securities 0 0 0 0 0 0
2. Other Income 0 0 0 0 0 0
TOTAL CASH OUTFLOW 2126568.83 2142381.918 2152325.506 2162269.094 2162269.094 2162269.094
3. Increase in Fixed Assets 0 0 0 0 0 0
Fixed Investments 0 0 0 0 0 0
Pre-production Expenditures 0 0 0 0 0 0
4. Increase in Net Working Capital 0 0 0 0 0 0
5. Operating Costs 1877384.42 1877384.42 1877384.42 1877384.42 1877384.42 1877384.42
6. Corporate Tax Paid 249184.4099 264997.4979 274941.086 284884.674 284884.674 284884.674
NET CASH FLOW 873431.1701 857618.0821 847674.494 837730.906 837730.906 837730.906
CUMMULATIVE NET CASH FLOW 1905387.645 2763005.727 3610680.221 4448411.127 5286142.033 6123872.939
Net Present Value (at 18%) 323546.4527 269227.7849 225513.7658 188871.5186 160060.609 135644.5839
Cumulative Net present Value 91955.90339 361183.6883 586697.4541 775568.9727 935629.5817 1071274.166
Net Present Value (at 18%) 2098436.666
Internal Rate of Return 29%
Page 23
7
Annex 4: NET INCOME STATEMENT (in Birr) PRODUCTION
1 2 3 4 5
Capacity Utilization (%) 75% 85% 100% 100% 100%
1. Total Income 2250000 2550000 3000000 3000000 3000000
Sales Revenue 2250000 2550000 3000000 3000000 3000000
Other Income 0 0 0 0 0
2. Less Variable Cost 1283534.19 1454672.082 1711378.92 1711378.92 1711378.92
VARIABLE MARGINE 966465.81 1095327.918 1288621.08 1288621.08 1288621.08
(In % of Total Income) 42.954036 42.954036 42.954036 42.954036 42.954036
3. Less Fixed Costs 322138.5 336711.3 358570.5 358570.5 358570.5
OPERATIONAL MARGINE 644327.31 758616.618 930050.58 930050.58 930050.58
(In % of Total Income) 28.63676933 29.74967129 31.001686 31.001686 31.001686
4. Less Cost of Finance 431150.2047 198871.761 165726.4675 132581.174 99435.88049
5. GROSS PROFIT 213177.1053 559744.857 764324.1125 797469.406 830614.6995
6. Income (Corporate) Tax 0 0 0 239240.8218 249184.4099
7. NET PROFIT 213177.1053 559744.857 764324.1125 558228.5842 581430.2897
RATIOS (%)
Gross Profit/Sales 9.47% 21.95% 25.48% 26.58% 27.69%
Net Profit After Tax/Sales 9.47% 21.95% 25.48% 18.61% 19.38%
Return on Investment 24.92% 28.56% 33.67% 25.01% 24.65%
Return on Equity 19.29% 50.66% 69.18% 50.53% 52.63%
Page 24
8
Annex 4: NET INCOME STATEMENT (in Birr):Continued
PRODUCTION
6 7 8 9 10
Capacity Utilization (%) 100% 100% 100% 100% 100%
1. Total Income 3000000 3000000 3000000 3000000 3000000
Sales Revenue 3000000 3000000 3000000 3000000 3000000
Other Income 0 0 0 0 0
2. Less Variable Cost 1711378.92 1711378.92 1711378.92 1711378.92 1711378.92
VARIABLE MARGINE 1288621.08 1288621.08 1288621.08 1288621.08 1288621.08
(In % of Total Income) 42.954036 42.954036 42.954036 42.954036 42.954036
3. Less Fixed Costs 339005.5 339005.5 339005.5 339005.5 339005.5
OPERATIONAL MARGINE 949615.58 949615.58 949615.58 949615.58 949615.58
(In % of Total Income) 31.65385267 31.65385267 31.65385267 31.65385267 31.65385267
4. Less Cost of Finance 66290.58699 33145.2935 0 0 0
5. GROSS PROFIT 883324.993 916470.2865 949615.58 949615.58 949615.58
6. Income (Corporate) Tax 264997.4979 274941.086 284884.674 284884.674 284884.674
7. NET PROFIT 618327.4951 641529.2006 664730.906 664730.906 664730.906
RATIOS (%)
Gross Profit/Sales 29.44% 30.55% 31.65% 31.65% 31.65%
Net Profit After Tax/Sales 20.61% 21.38% 22.16% 22.16% 22.16%
Return on Investment 24.79% 24.43% 24.07% 24.07% 24.07%
Return on Equity 55.97% 58.07% 60.17% 60.17% 60.17%
Page 25
9
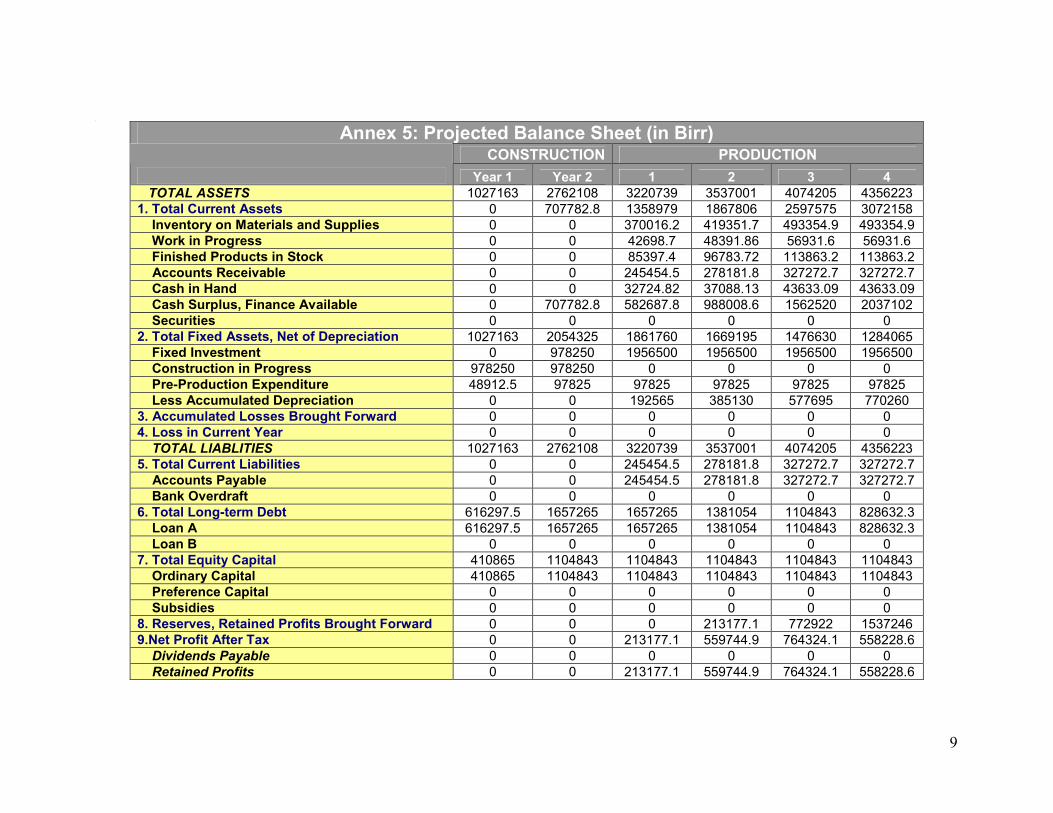
[
Annex 5: Projected Balance Sheet (in Birr) CONSTRUCTION PRODUCTION
Year 1 Year 2 1 2 3 4
TOTAL ASSETS 1027163 2762108 3220739 3537001 4074205 4356223
1. Total Current Assets 0 707782.8 1358979 1867806 2597575 3072158
Inventory on Materials and Supplies 0 0 370016.2 419351.7 493354.9 493354.9
Work in Progress 0 0 42698.7 48391.86 56931.6 56931.6
Finished Products in Stock 0 0 85397.4 96783.72 113863.2 113863.2
Accounts Receivable 0 0 245454.5 278181.8 327272.7 327272.7
Cash in Hand 0 0 32724.82 37088.13 43633.09 43633.09
Cash Surplus, Finance Available 0 707782.8 582687.8 988008.6 1562520 2037102
Securities 0 0 0 0 0 0
2. Total Fixed Assets, Net of Depreciation 1027163 2054325 1861760 1669195 1476630 1284065
Fixed Investment 0 978250 1956500 1956500 1956500 1956500
Construction in Progress 978250 978250 0 0 0 0
Pre-Production Expenditure 48912.5 97825 97825 97825 97825 97825
Less Accumulated Depreciation 0 0 192565 385130 577695 770260
3. Accumulated Losses Brought Forward 0 0 0 0 0 0
4. Loss in Current Year 0 0 0 0 0 0
TOTAL LIABLITIES 1027163 2762108 3220739 3537001 4074205 4356223
5. Total Current Liabilities 0 0 245454.5 278181.8 327272.7 327272.7
Accounts Payable 0 0 245454.5 278181.8 327272.7 327272.7
Bank Overdraft 0 0 0 0 0 0
6. Total Long-term Debt 616297.5 1657265 1657265 1381054 1104843 828632.3
Loan A 616297.5 1657265 1657265 1381054 1104843 828632.3
Loan B 0 0 0 0 0 0
7. Total Equity Capital 410865 1104843 1104843 1104843 1104843 1104843
Ordinary Capital 410865 1104843 1104843 1104843 1104843 1104843
Preference Capital 0 0 0 0 0 0
Subsidies 0 0 0 0 0 0
8. Reserves, Retained Profits Brought Forward 0 0 0 213177.1 772922 1537246
9.Net Profit After Tax 0 0 213177.1 559744.9 764324.1 558228.6
Dividends Payable 0 0 0 0 0 0
Retained Profits 0 0 213177.1 559744.9 764324.1 558228.6
Page 26
10
Annex 5: Projected Balance Sheet (in Birr): Continued PRODUCTION
5 6 7 8 9 10
TOTAL ASSETS 4661442 5003559 5368877 6033608 6698339 7363070
1. Total Current Assets 3569942 4085059 4623377 5461108 6298839 7136570
Inventory on Materials and Supplies 493354.9 493354.9 493354.9 493354.9 493354.9 493354.9
Work in Progress 56931.6 56931.6 56931.6 56931.6 56931.6 56931.6
Finished Products in Stock 113863.2 113863.2 113863.2 113863.2 113863.2 113863.2
Accounts Receivable 327272.7 327272.7 327272.7 327272.7 327272.7 327272.7
Cash in Hand 43633.09 43633.09 43633.09 43633.09 43633.09 43633.09
Cash Surplus, Finance Available 2534887 3050004 3588322 4426053 5263784 6101515
Securities 0 0 0 0 0 0
2. Total Fixed Assets, Net of Depreciation 1091500 918500 745500 572500 399500 226500
Fixed Investment 1956500 1956500 1956500 1956500 1956500 1956500
Construction in Progress 0 0 0 0 0 0
Pre-Production Expenditure 97825 97825 97825 97825 97825 97825
Less Accumulated Depreciation 962825 1135825 1308825 1481825 1654825 1827825
3. Accumulated Losses Brought Forward 0 0 0 0 0 0
4. Loss in Current Year 0 0 0 0 0 0
TOTAL LIABLITIES 4661442 5003559 5368877 6033608 6698339 7363070
5. Total Current Liabilities 327272.7 327272.7 327272.7 327272.7 327272.7 327272.7
Accounts Payable 327272.7 327272.7 327272.7 327272.7 327272.7 327272.7
Bank Overdraft 0 0 0 0 0 0
6. Total Long-term Debt 552421.6 276210.8 0 0 0 0
Loan A 552421.6 276210.8 0 0 0 0
Loan B 0 0 0 0 0 0
7. Total Equity Capital 1104843 1104843 1104843 1104843 1104843 1104843
Ordinary Capital 1104843 1104843 1104843 1104843 1104843 1104843
Preference Capital 0 0 0 0 0 0
Subsidies 0 0 0 0 0 0
8. Reserves, Retained Profits Brought Forward 2095475 2676905 3295232 3936762 4601493 5266223
9. Net Profit After Tax 581430.3 618327.5 641529.2 664730.9 664730.9 664730.9
Dividends Payable 0 0 0 0 0 0
Retained Profits 581430.3 618327.5 641529.2 664730.9 664730.9 664730.9