74
Investment Performance Analysis For the period ending March 31, 2014 May 22, 2014 Allan Martin, Partner Dan LeBeau, Consultant Mike Malchenko, Senior Analyst

Investment Performance AnalysisFor the period ending March 31, 2014
May 22, 2014
Allan Martin, PartnerDan LeBeau, ConsultantMike Malchenko, Senior Analyst

Page
Market Environment Update and Outlook 2
Total Fund Performance 20
Total Fund Performance: Net of Fees 54
Appendix: Market Environment 58
Contents
March 31, 2014
New Mexico Educational Retirement Board
1

Market Environment Update and Outlook
2

• First quarter GDP growth was slower at 0.1% principally due to severe winter weather.Potential for second quarter rebound in growth?– Retail sales (ended March) rose to 2.2% on a year-over-year growth rate basis.– The inventory-to-sales ratio has remained mostly flat since early 2010 and closed at 1.31% in February.– Corporate profits as a percent of GDP remained near secular highs at 12.7% at the end of Q4 2013.– The trade deficit increased in February.
• The unemployment rate stayed flat at 6.7% in March; U-6, a broader measure ofunemployment, rose to 12.7% during the first quarter.– JP Morgan has stated that sustained GDP growth of 1.5% is needed for positive job creation, and closer to 3% growth is
needed to decrease the unemployment rate.
• Consumer confidence fell to 82.3 in March; the Case-Schiller Home Price Index (as of 12/31)dipped slightly to 150.39 from its highest level (150.92) since the financial crisis.
• Rolling 12-month CPI increased to 1.5% at the end of March; Capacity Utilization rose slightlyto 79.2% in the month.
• Fed Funds rate remains at 0.25%, while the 10-year Treasury Yield finished March at 2.72%.
• Fed balance sheets increased in early 2014, while European Central Bank balance sheetsdecreased.– Large economies continue easing (Japan to the extreme), while the ECB tightens.
• S&P valuations rose in March and remained above the 10-year and long-term averages, whichare nearly equal at 16.4x, using current price/earnings ratios.– Cyclically adjusted Shiller PE ratios, however, are well above the long-term average of 17.6x and above the 10-year
average of 23.0x.
Economic EnvironmentNew Mexico Educational Retirement Board
March 31, 2014
3
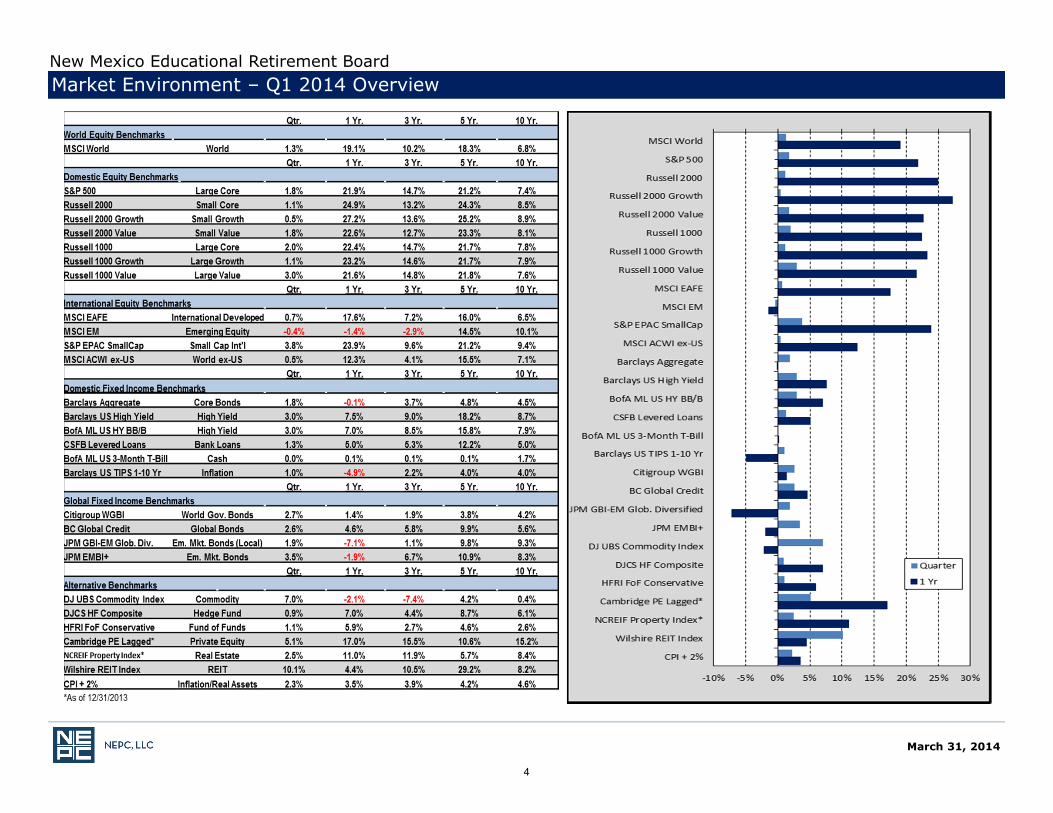
Market Environment – Q1 2014 OverviewNew Mexico Educational Retirement Board
March 31, 2014
4

• Continued slow and steady economic growth– A bit slower in the first quarter due to
weather (maybe offset in Q2?)– Deleveraging continuing
• Early stages of Taper generally accepted by marketplace– Though priced in, “normalization” of
rates appears optimistic
• Developed world inflation is low – Allows Fed continued flexibility to
work through Taper
• Emerging markets made some progress on adjustments– Finally experiencing positive flows and
early signs of positive performance
• Volatility remains subdued and markets relatively stable
• Potential geopolitical instability– Russian invasion of Crimea has minimal
economic impact– But tensions between Russia and West
could have spillover effects
• Benign market environment in Europe obscures challenging underlying economic conditions
• Inflation is low… maybe too low– Global monetary stimulation has offset
deflationary pressures
• Continued slowing growth in China has global implications– Could bring Chinese credit issues to
forefront
• Valuations beginning to stretch above long-term averages– Developed Equity P/Es above median– Credit spreads approaching 2006-07
levels
First Quarter 2014 Market Review
Positives Negatives
New Mexico Educational Retirement Board
March 31, 2014
5

Global Equity• U.S. stocks oscillated back and forth in the first quarter amid further guidance from the Federal Reserve.
• The S&P 500 Index rose 1.8%, while the Russell 2000 gained a modest 1.1%.
• International equities lagged U.S. markets, returning 0.7%, as measured by the MSCI ACWI ex-U.S. Index.• Developed markets returned 0.7% as measured by the MSCI EAFE Index• Emerging markets returned -0.4% as measured by the MSCI Emerging Markets Index
• Europe led non-U.S. equities as France and peripheral countries recorded robust gains. Italy and Ireland were twoof the best markets for the quarter, with stocks returning roughly 14% so far this year.
• Despite rallying in March, emerging markets ended the quarter down 0.4% following Russia’s takeover of Crimeaand the continuing economic slowdown in China. Russia was the worst performing market with a -14.4% return,while Indonesia gained a hefty 21.3%.
Private Equity• Private equity fund raising got off to a strong start in the first quarter with new commitments—at around $75.6
billion—keeping pace with commitments made in 2013.
• Asian fundraising totaled $10.8 billion in the first quarter, getting a shot in the arm as three firms raised over $1.0billion each; Europe saw $12.0 billion of new commitments, of which 60% is to be invested in buyout and growthequity funds.
• Globally, buyout and growth equity commitments totaled $33.3 billion during the quarter, representing 44% of allfunds raised so far this year, while energy, natural resources and infrastructure accounted for 19%.
• Venture capital fundraising hit $13.2 billion powered by five firms raising over $5 billion.
• Mezzanine funds, at $3.2 billion, accounted for only 4% of all new capital raised.
• Secondary funds raised only $3.1 billion in the first quarter, but we expect this number to increase to more than$20 billion as the year progresses with several large funds coming to market.
Market EnvironmentNew Mexico Educational Retirement Board
March 31, 2014
6

Fixed Income• Bond markets rallied in the first quarter as investors snapped up safer, higher quality assets amid concerns around
the crisis in Ukraine, an economic slowdown in China, and the unseasonably harsh winter in the U.S.
• The 10-year U.S. Treasury yield decreased 31 basis points to end the first quarter at 2.72%.
• The U.S. Credit Index gained 2.9% and the Long Duration Credit Index returned 6.3% in the first quarter. Highyield bonds returned 3.0%.
• Investment grade credit spreads narrowed to 103 basis points, the lowest they have been since before thefinancial crisis. The yield spread on high yield bonds over Treasuries fell to a near record low of 3.58%.
• Intermediate-term Treasury Inflation-Protected Securities, or TIPS, gained 1.0% during the quarter.
• The Credit Suisse Leveraged Loan Index gained 1.3% during the first quarter.
• Local currency debt, as measured by the JP Morgan GBI-EM Index, gained 1.9%. Hard currency debt, boosted bydeclining Treasury yields, outperformed local currency debt during the quarter, posting returns of 3.5%.
Market EnvironmentNew Mexico Educational Retirement Board
March 31, 2014
7

Commodities• Commodities started the year with a bang, with the DJ-UBS Index returning 7.2% in the first quarter.
• Fears of a grain shortage following Russia’s invasion of Ukraine powered returns of 8.4% in the grain sector.
• Heating oil rallied early in the quarter on the heels of unseasonably cold weather but subsequently retreated inMarch as temperatures returned to more normal levels, resulting in losses of 1.8% for energy.
• Precious metals declined 4% as copper prices fell amid the slowdown in China.
Real Estate• NEPC continues to be neutral on core real estate in the U.S. and remains positive on non-core real estate, that is,
value-add and opportunistic strategies, particularly in Europe.
• Within U.S. core real estate, fundamentals continue to improve with decreasing vacancy rates, increasing rents,limited new construction (outside of the apartment sector), and still attractive if narrowing income spreadsrelative to interest rates.
• In Europe, undervalued non-core properties and capital structure distress remain, creating more appealingprospects than in the U.S.
• Real estate debt strategies are appealing, particularly in Europe’s distressed lending environment, althoughcurrency risk is a potential consideration.
Real Assets/Inflation-Linked Assets• NEPC believes that energy, specifically in North America, represents an attractive opportunity in the up-stream
and mid-stream parts of the energy value chain.
• Agriculture and metals/mining opportunities seem appealing based on long-term demographic trends despite aless certain short-term outlook.
• Timber is an area of portfolios where we would recommend underweight positions as total return targets are lowwith a relatively small market opportunity and managers seeking deals outside the U.S.
Market EnvironmentNew Mexico Educational Retirement Board
March 31, 2014
8

The “Weather Effect” – Likely a Short-Term Blip
Source: Bloomberg as of 3/31
Source: Capital Economics, Bloomberg as of 3/31
March 31, 2014
New Mexico Educational Retirement Board
9
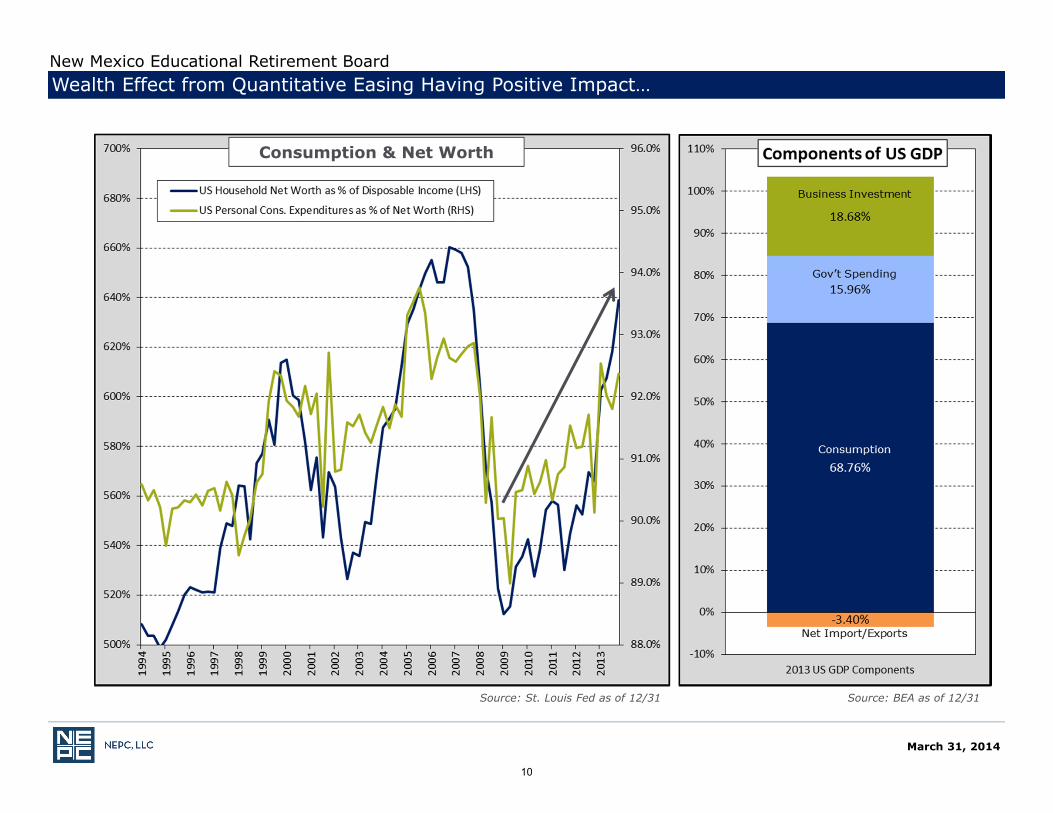
Wealth Effect from Quantitative Easing Having Positive Impact…
Source: St. Louis Fed as of 12/31 Source: BEA as of 12/31
Consumption & Net Worth
New Mexico Educational Retirement Board
March 31, 2014
10

Treasury Yields Decreased Across the Curve
Source: Bloomberg as of 3/31
New Mexico Educational Retirement Board
March 31, 2014
11

Volatility Remains Subdued
Source: Bloomberg as of 3/31Source: Bloomberg as of 3/31
Source: Bloomberg as of 3/31Source: Bloomberg as of 3/31
New Mexico Educational Retirement Board
March 31, 2014
12

Emerging Market Returns Have Been Lackluster But Have Seen Some Recent Reversals
Source: Bloomberg as of 3/31
New Mexico Educational Retirement Board
March 31, 2014
13

Inflation and Near Term Inflation Expectations Remain Low
Source: Bloomberg as of 3/31
Source: Bloomberg as of 3/31
New Mexico Educational Retirement Board
March 31, 2014
14

U.S. Equity Markets: Poised to Continue or Overly Optimistic
3/31/201415.97
Source: Bloomberg as of 3/31Source: Bloomberg as of 3/31
Source: Bloomberg as of 3/31, Long-term averages since 1954 Source: Bloomberg as of 3/31
March 31, 2014
New Mexico Educational Retirement Board
15

Global Equity Markets: EM Still Lagging, But Weathering Macro Concerns
Source: Bloomberg as of 3/31 Source: Bloomberg as of 3/31
Source: Bloomberg as of 3/31
March 31, 2014
New Mexico Educational Retirement Board
16

Spreads Have Tightened as Retail Investors Flocked to Yield
Source: Bloomberg as of 12/31
Source: Bloomberg as of 3/31
March 31, 2014
New Mexico Educational Retirement Board
17

• Markets have generally shown resiliency so far in 2014– Withstood adjustments in balance of payment challenged EM countries– Limited market reaction to Russia/Ukraine issues
• U.S. taper has generally been accepted by markets – Already reduced from $85 billion to $55 billion in monthly purchases– Rates remain low and accommodating
• Slow and steady economic growth continues– Inflation remains subdued
• Continued low volatility may obscure underlying economic challenges– European peripheral countries continue to face high unemployment– Many EM countries face further balance of payment adjustments– China faces slowing growth and potential credit issues
• Valuations beginning to move beyond fair value– While not stretched, equity P-E ratios are now above long-term averages– Credit spreads continue to move tighter
• Ex: European peripheral debt
• NEPC themes remain consistent– Rebalance – remain diversified and balanced– Look for opportunities to be dynamic – particularly in credit– Allocate to emerging markets and private markets for higher returns in low return world
Outlook
March 31, 2014
New Mexico Educational Retirement Board
18

Highlights of First Quarter Happenings at NEPC
NEPC ResearchRecent White Papers Posted 4Q Market Thoughts — “1997, 2007,
or Something Else Altogether?”(January 2014)
Moving in Different Directions:NEPC’s 2014 Asset Allocation Letter(January 2014), NEPC’s AssetAllocation Committee
Annual Chairman’s Letter (March2014), Richard M. Charlton,Chairman
Overlay Strategies: Increasing Portfolio DiversificationThrough Derivatives (March 2014), Brian Roberts, CAIA,Senior Consultant
The Alternative Route: A Smoother Ride for DefinedContribution Plans (April 2014), Rob J. Fishman, CFA,Partner; Aaron S. Keel, CFA, Senior Analyst; Deirdre L.Pomerleau, Analyst
NEPC’s 19th Annual Client Conference May 13 and May 14, 2014
Boston Convention Center
Headline Speakers:
David M. Rubenstein,Co-Founder and Co-CEO, The Carlyle Group
Perry M. Traquina, CFA, Chairman and CEO, Managing Partner, Wellington Management Company
Register at www.nepc.com
Professional Staff Updates Tim McCusker, CFA, CAIA, FSA named
Chief Investment Officer
March 31, 2014
NEPC UpdateNew Mexico Educational Retirement Board
19

Total Fund Performance
20

The New Mexico Educational Retirement Board Policy Regarding Placement Agent Disclosures requires that quarterly performance reports to the Board include information regarding any third-party marketers that were used by recipients of investments including any fee, commission or retainer paid by the hired fund to the third-party marketer for services rendered. These fees are not paid by NMERB but are paid by the hired funds for marketing services to the third-party.
The following investments were approved by the NMERB Investment Committee during the quarter, with disclosures made under the policy:
Pine Brook Capital Partners II (‘Pine Brook’) was selected for investment on January 23, 2014 as part of the Fund’s allocation to Private Equity. The commitment was approved for $50 million.
Pine Brook has provided documentation stating that the firm has engaged Credit Suisse Securities (USA) LLC (‘Credit Suisse’) to act as a Placement Agent in connection with investments with respect to the fund, and Credit Suisse has been involved with respect to the NMERB’s investment in the fund. Credit Suisse is not a corporate affiliate.
Pine Brook disclosed that Credit Suisse’s compensation is as follows: (i) Credit Suisse will be compensated with an Advisory Fee for services rendered of $600,000 payable upon the execution of the Agreement between the two parties; and (ii) a Placement Fee in the amount of $625,000-$812,500 (1.25% -1.625% of commitment amount) in connection with the NMERB’s investment in the fund.
Additionally, Pine Brook has completed the ERB Campaign Disclosure and reports no applicable campaign contributions.
Bain Capital Fund IX (‘Bain’) was selected for investment on February 13, 2014, as part of the Fund’s allocation to Private Equity. The commitment was approved for $50 million.
Bain has provided documentation confirming no placement agents will be compensated for NMERB’s investment in the fund.
Additionally, Bain has completed the ERB Campaign Disclosure and reports no applicable campaign contributions.
BlackRock Tactical Opportunities Fund (‘BlackRock’) was selected for investment on February 13, 2014, as part of the Fund’s allocation to Private Equity. The commitment was approved for an amount not to exceed $100 million.
BlackRock has provided documentation confirming no placement agents will be compensated for NMERB’s investment in the fund.
Additionally, BlackRock has completed the ERB Campaign Disclosure and reports no applicable campaign contributions.
Marathon European Credit Opportunities II (‘Marathon’) was selected for investment on February 13, 2014, as part of the Fund’s allocation to Opportunistic Credit. The commitment was approved for $150 million.
Marathon has provided documentation confirming no placement agents will be compensated for NMERB’s investment in the fund.
Additionally, Marathon has completed the ERB Campaign Disclosure and reports no applicable campaign contributions.
Third Party Placement Agent DisclosureNew Mexico Educational Retirement Board
March 31, 2014
21
The New Mexico Educational Retirement Board Policy Regarding Placement Agent Disclosures requires that quarterly performance reports to the Board include information regarding any third-party marketers that were used by recipients of investments including any fee, commission or retainer paid by the hired fund to the third-party marketer for services rendered. These fees are not paid by NMERB but are paid by the hired funds for marketing services to the third-party.
The following investments were approved by the NMERB Investment Committee during the quarter, with disclosures made under the policy:
Black Forest Structured Lending Fund (‘Black Forest’) was selected for investment on March 13, 2014, as part of the Fund’s allocation to Opportunistic Credit. The commitment was approved for $150 million.
Black Forest has provided documentation confirming no placement agents will be compensated for NMERB’s investment in the fund.
Additionally, Black Forest has completed the ERB Campaign Disclosure and reports no applicable campaign contributions.
Lone Star Fund IX (‘Lone Star’) was selected for investment on March 13, 2014, as part of the Fund’s allocation to Opportunistic Credit. The commitment was approved for $100 million.
Lone Star has provided documentation confirming no placement agents will be compensated for NMERB’s investment in the fund.
Additionally, Lone Star has completed the ERB Campaign Disclosure and reports no applicable campaign contributions.
Third Party Placement Agent DisclosureNew Mexico Educational Retirement Board
March 31, 2014
22

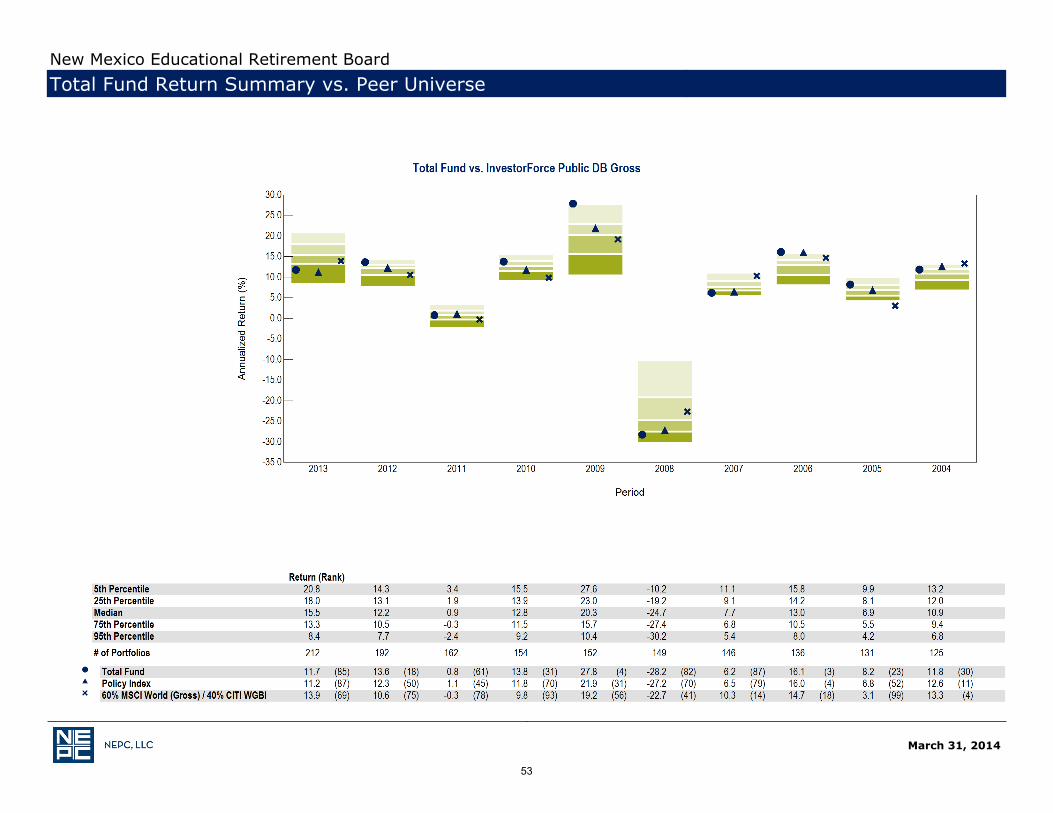
For the one-year period ending March 31, 2014, the Fund experienced a net investment gain of $1.03 billion, which includes a net investment gain of $246.2 million during the first quarter. Assets increased from $10.2 billion twelve months ago to $10.9 billion on March 31, 2014, with $315.5 million in net distributions during the year.
Over the past five years, the Fund returned 15% per annum, outperforming the policy index by 1.9% and ranking in the 30th
percentile of the InvestorForce Public Funds > $1 Billion universe. The Fund’s volatility was 8.2%, which ranks in the 38th percentile of its peers over this period. The Fund’s risk-adjusted performance, as measured by the Sharpe Ratio, ranks in the 13th percentile of its peers. Therefore, the Fund has produced more return per unit of risk taken over this period than 87% of its peers.
Over the past three years, the Fund returned 8.1% per annum, outperforming the policy index by 0.3% and ranking in the 76th
percentile of its peer group. Over the past three years, the Fund has reduced its volatility on both an absolute and relative basis, resulting in a three-year Sharpe Ratio of 1.2, which ranks in the 29th
percentile.
Over the past year, the Fund returned 10.0%, outperforming the policy index by 0.2% and ranking in the 73rd percentile of its peers. The Fund’s volatility over the last year was 5.3%, ranking in the 12th
percentile of its peer group, resulting in a Sharpe Ratio of 1.9, which ranks in the 50th percentile.
All asset classes were within policy range as of March 31, 2014.
Total Fund Performance Summary
update
March 31, 2014
New Mexico Educational Retirement Board
23

Total Fund Asset Allocation vs. Policy Targets
1Long-Term Policy Target approved by the Board in September 2012.
Note: Allocations shown here include cash held in separately managed portfolios.
Totals may not add to 100% due to rounding.
Current Allocation
Policy Target
New Mexico Educational Retirement Board
March 31, 2014
Current Mkt ValueCurrent
Allocation Policy Target1 Difference Policy Range Within Range
Equity $4,109,717,494 37.7% 37.0% 0.7% 20% - 55% YesU.S. Equity $2,471,019,462 22.7% 22.0% 0.7% 15% - 30% Yes
U.S. Large Cap Equity $2,199,953,472 20.2% 20.0% 0.2% 15% - 25% YesU.S. Small/Mid Cap Equity $271,065,990 2.5% 2.0% 0.5% 0% - 5% Yes
Non-U.S. Equity $1,638,698,032 15.0% 15.0% 0.0% 5% - 25% YesNon-U.S. Developed Mkts $587,918,664 5.4% 5.0% 0.4% 0% - 10% YesNon-U.S. Emerging Mkts $1,050,779,368 9.6% 10.0% -0.4% 5% - 15% Yes
Fixed Income $3,675,340,397 33.7% 29.0% 4.7% 10% - 40% YesCore Fixed Income $1,126,437,843 10.3% 7.0% 3.3% 0% - 15% Yes
Opportunistic Credit $2,348,141,160 21.5% 20.0% 1.5% 0% - 30% YesEmerging Mkts Debt $200,761,394 1.8% 2.0% -0.2% 0% - 8% Yes
Alternatives $3,002,798,436 27.5% 33.0% -5.5% 10% - 40% YesAbsolute Return $363,579,806 3.3% 3.0% 0.3% 0% - 10% Yes
Global Asset Allocation/Risk Parity $1,073,766,406 9.9% 10.0% -0.1%Global Asset Allocation $528,322,764 4.8% 5.0% -0.2% 0% - 10% Yes
Risk Parity $545,443,642 5.0% 5.0% 0.0% 0% - 10% Yes
Real Estate $567,836,345 5.2% 5.0% 0.2% 0% - 10% YesREITs $314,995,693 2.9% 3.0% -0.1%
Private Real Estate $252,840,652 2.3% 2.0% 0.3%
Private Equity $782,452,903 7.2% 8.0% -0.8% 0% - 15% Yes
Inflation-Linked Assets $215,162,976 2.0% 7.0% -5.0% 0% - 12% Yes
Cash $112,595,206 1.0% 1.0% 0.0% 0% - 10% Yes
Total $10,900,451,533 100.0% 100.0% 0.0%
24

March 31, 2014
New Mexico Educational Retirement BoardTotal Fund Asset Growth Summary
Sources of Portfolio Growth Last ThreeMonths Fiscal Year-To-Date One Year Three Years Five Years Inputted Date
10/1/05_
Beginning Market Value $10,733,226,200 $10,126,933,745 $10,212,011,352 $9,466,216,562 $6,207,375,079 $7,694,652,364Net Additions/Withdrawals -$78,964,506 -$247,617,710 -$315,451,356 -$901,058,009 -$1,366,051,029 -$2,059,743,898Investment Earnings $246,189,840 $1,021,135,498 $1,003,891,538 $2,335,292,980 $6,059,127,483 $5,265,543,068Ending Market Value $10,900,451,533 $10,900,451,533 $10,900,451,533 $10,900,451,533 $10,900,451,533 $10,900,451,533
_
25

March 31, 2014
New Mexico Educational Retirement BoardTotal Fund Asset Allocation History
26

March 31, 2014
New Mexico Educational Retirement BoardTotal Fund Risk/Return
27

New Mexico Educational Retirement BoardTotal Fund Risk/Return
March 31, 2014
28

3 Year Risk/Return ProfileNew Mexico Educational Retirement Board
Gre
ater
Ret
urn
Greater Risk
March 31, 2014
2929

5 Year Risk/Return ProfileNew Mexico Educational Retirement Board
Gre
ater
Ret
urn
Greater Risk
March 31, 2014
3030

March 31, 2014
Total Fund vs. IFx Public DB > $1B Gross (USD) (peer)1 Year
New Mexico Educational Retirement BoardTotal Fund Risk Statistics vs. Peer Universe
31

March 31, 2014
Total Fund vs. IFx Public DB > $1B Gross (USD) (peer)3 Years
New Mexico Educational Retirement BoardTotal Fund Risk Statistics vs. Peer Universe
32

March 31, 2014
Total Fund vs. IFx Public DB > $1B Gross (USD) (peer)5 Years
New Mexico Educational Retirement BoardTotal Fund Risk Statistics vs. Peer Universe
33

March 31, 2014
New Mexico Educational Retirement BoardTotal Fund Risk Statistics vs. Peer Universe
Total Fund vs. IFx Public DB > $1B Gross (USD) (peer)10 Years
34

Note: Returns are gross of fees.
New Mexico Educational Retirement BoardTotal Fund Rolling 5-Year Excess Returns
March 31, 2014
35

Total Fund Performance AttributionNew Mexico Educational Retirement Board
March 31, 2014
Policy Impact: The policy index is calculated by multiplying the target asset class weights times the return of the respective passive benchmark (re-balanced monthly). The policy impact, which is the difference between the policy index and the median fund’s performance, measures the effectiveness of Plan Structure.
Allocation Impact: The allocation index is calculated by multiplying the actual asset class weights times the return of the respective passive benchmark. When the policy index is subtracted from the allocation index, the result measures the impact of deviating from the target weights.
Manager Impact: The Composite is calculated by multiplying the actual asset class weights times the actual manager return. The allocation index is then subtracted from the Composite. The result, manager impact, measures the contribution of active management.
Note: Returns are gross of fees.
0.4%
-2.1%-2.3%
-1.0%
-1.3%
0.1%0.0%
-0.1%
0.1% 0.0%
0.6%0.8%
0.1%0.3%
0.5%0.3%
1.3%
-0.1%
0.0%0.2%
0.3%0.1%
1.0%
-0.3%
-3.0%
-2.0%
-1.0%
0.0%
1.0%
2.0%
3.0%
Qtr FYTD 1 Year 3 Years 5 Years 10 Years
Policy Impact Allocation Impact Manager Impact (Gross) Manager Impact (Net)
36

3 Years Ending December 31, 2013
% of TotalMV
AnlzdReturn Rank
AnlzdStandardDeviation
Rank TrackingError Rank Information
Ratio Rank Beta Rank AnlzdAlpha J Rank Sharpe
Ratio_
U.S. Large Cap Equity Composite 21.38% 16.16% 49 12.07% 30 0.11% 1 -0.14 56 1.00 35 0.03% 42 1.33
S&P 500 -- 16.18% 48 12.11% 31 -- -- -- -- -- -- 0.00% 42 1.33
U.S. Small/Mid Cap EquityComposite 2.44% 14.74% 77 16.93% 77 2.81% 9 -0.25 80 1.02 74 -1.06% 84 0.87
NMERB Small/Mid Cap EquityBlended Index -- 15.44% 68 16.31% 65 -- -- -- -- -- -- 0.00% 79 0.94
Non-U.S. Developed Mkts EquityComposite 5.46% 7.52% 83 16.71% 68 2.06% 8 -0.31 89 1.01 76 -0.69% 84 0.45
MSCI EAFE -- 8.17% 76 16.48% 60 -- -- -- -- -- -- 0.00% 76 0.49
Non-U.S. Emerging Mkts EquityComposite 9.79% -5.19% 95 20.37% 88 2.19% 4 -1.43 99 1.05 86 -3.02% 96 -0.26
MSCI Emerging Markets -- -2.06% 76 19.31% 61 -- -- -- -- -- -- 0.00% 76 -0.11
Core Fixed Income Composite 10.73% 4.38% 30 2.74% 45 0.77% 49 1.46 21 0.96 40 1.25% 31 1.58
Barclays Aggregate -- 3.26% 87 2.75% 48 -- -- -- -- -- -- 0.00% 90 1.17
Non-U.S. Emerging Market DebtComposite 1.85% -- -- -- -- -- -- -- -- -- -- -- -- --
JP Morgan GBI - EM Diversified -- 1.45% 87 12.79% 82 -- -- -- -- -- -- 0.00% 87 0.11
Opportunistic Credit Composite 20.39% 10.30% -- 4.82% -- 3.85% -- 0.80 -- 0.71 -- 5.14% -- 2.12
50% Credit Suisse LeveragedLoan Index / 50% BofA ML US HYBB-B Rated Constrained Index
-- 7.23% -- 4.46% -- -- -- -- -- -- -- 0.00% -- 1.61
XXXXX
3 Years Ending March 31, 2014
% of Tot Anlzd Ret Rank Anlzd StdDev Rank Tracking
Error Rank Info Ratio Rank Beta Rank Anlzd AJ Rank SharpeRatio
_
Global Asset Allocation/Risk ParityComposite 9.85% 8.74% 13 6.58% 35 7.88% 99 0.10 13 0.35 1 5.92% 1 1.32
60% MSCI World HH/40% CITIWGBI HH -- 7.99% 16 7.90% 50 -- -- -- -- -- -- 0.00% 31 1.00
March 31, 2014
New Mexico Educational Retirement BoardTotal Fund Risk Statistics
37

5 Years Ending March 31, 2014
% of TotalMV
AnlzdReturn Rank
AnlzdStandardDeviation
Rank TrackingError Rank Information
Ratio Rank Beta Rank AnlzdAlpha J Rank Sharpe
Ratio_
U.S. Large Cap Equity Composite 20.18% 21.18% 46 13.98% 33 0.50% 1 0.04 43 1.00 40 0.06% 45 1.51
S&P 500 -- 21.16% 47 13.99% 33 -- -- -- -- -- -- 0.00% 46 1.51
U.S. Small/Mid Cap EquityComposite 2.49% 22.59% 85 18.37% 65 3.09% 5 -0.60 97 0.96 68 -0.98% 93 1.23
NMERB Small/Mid Cap EquityBlended Index -- 24.45% 64 18.80% 74 -- -- -- -- -- -- 0.00% 92 1.30
Non-U.S. Developed Mkts EquityComposite 5.39% 15.36% 86 18.49% 60 2.22% 6 -0.30 93 0.99 64 -0.56% 90 0.83
MSCI EAFE -- 16.02% 80 18.48% 60 -- -- -- -- -- -- 0.00% 88 0.86
Non-U.S. Emerging Mkts EquityComposite 9.64% 12.58% 94 22.49% 72 2.38% 5 -0.80 99 1.03 75 -2.40% 96 0.56
MSCI Emerging Markets -- 14.48% 79 21.62% 47 -- -- -- -- -- -- 0.00% 77 0.67
Core Fixed Income Composite 10.33% 7.88% 12 3.18% 73 1.43% 74 2.15 5 1.01 53 3.04% 12 2.45
Barclays Aggregate -- 4.80% 85 2.82% 25 -- -- -- -- -- -- 0.00% 88 1.67
Non-U.S. Emerging Market DebtComposite 1.84% -- -- -- -- -- -- -- -- -- -- -- -- --
JP Morgan GBI - EM Diversified -- 9.78% 91 12.43% 79 -- -- -- -- -- -- 0.00% 88 0.78
Opportunistic Credit Composite 21.54% 18.25% -- 7.17% -- 4.56% -- 0.93 -- 0.89 -- 5.73% -- 2.53
50% Credit Suisse LeveragedLoan Index / 50% BofA ML US HYBB-B Rated Constrained Index
-- 13.99% -- 6.24% -- -- -- -- -- -- -- 0.00% -- 2.23
XXXXX
5 Years Ending March 31, 2014
% of Tot Anlzd Ret Rank Anlzd StdDev Rank Tracking
Error Rank Info Ratio Rank Beta Rank Anlzd AJ Rank SharpeRatio
_
Global Asset Allocation/Risk ParityComposite 9.85% -- -- -- -- -- -- -- -- -- -- -- -- --
60% MSCI World HH/40% CITIWGBI HH -- 12.24% 35 8.92% 60 -- -- -- -- -- -- 0.00% 63 1.36
XXXXX
New Mexico Educational Retirement BoardTotal Fund Risk Statistics
March 31, 201438

Market Value($)
% ofPortfolio
3 Mo(%) Rank
FiscalYTD(%)
Rank 1 Yr(%) Rank 3 Yrs
(%) Rank 5 Yrs(%) Rank 10 Yrs
(%) Rank Return(%) Since
_
U.S. Equity Composite 2,471,019,462 22.7 2.0 50 18.9 70 22.4 68 14.5 49 21.4 69 7.5 88 11.4 Jan-85Russell 3000 2.0 50 19.4 65 22.6 65 14.6 48 21.9 62 7.9 83 11.2 Jan-85
Over/Under 0.0 -0.5 -0.2 -0.1 -0.5 -0.4 0.2eA All US Equity Gross Median 1.9 20.7 24.3 14.5 23.0 9.3 12.5 Jan-85
U.S. Large Cap Equity Composite 2,199,953,472 20.2 1.8 56 18.4 67 21.9 66 14.6 49 21.2 46 7.3 86 3.8 Aug-99S&P 500 1.8 56 18.4 66 21.9 66 14.7 48 21.2 47 7.4 84 4.3 Aug-99
Over/Under 0.0 0.0 0.0 -0.1 0.0 -0.1 -0.5eA US Large Cap Equity Gross Median 2.0 19.8 23.3 14.5 21.0 8.5 6.4 Aug-99
S&P 500 Index Fund 2,199,953,472 20.2 1.8 63 18.4 66 21.9 64 14.6 55 21.1 39 7.1 92 3.6 Jan-00S&P 500 1.8 62 18.4 66 21.9 64 14.7 55 21.2 38 7.4 88 3.7 Jan-00
Over/Under 0.0 0.0 0.0 -0.1 -0.1 -0.3 -0.1eA US Large Cap Core Equity Gross Median 2.1 19.4 22.9 15.0 20.8 8.6 5.7 Jan-00
U.S. Small/Mid Cap Equity Composite 271,065,990 2.5 3.6 15 24.4 24 27.4 29 13.9 61 22.6 85 8.9 97 8.0 Aug-99NMERB Small/Mid Cap Equity Blended Index 2.3 43 21.3 69 24.0 69 13.4 67 24.5 64 8.6 99 8.3 Aug-99
Over/Under 1.3 3.1 3.4 0.5 -1.9 0.3 -0.3eA US Small-Mid Cap Core Equity Gross Median 1.7 22.8 26.0 14.3 25.7 10.5 11.1 Aug-99
Lord Abbett 134,641,895 1.2 4.6 12 22.9 29 25.0 34 12.6 73 -- -- -- -- 18.1 Aug-10Russell 2500 Value 3.5 30 19.9 64 21.8 72 13.9 49 24.8 54 9.0 83 18.8 Aug-10
Over/Under 1.1 3.0 3.2 -1.3 -0.7eA US Small-Mid Cap Value Equity Gross Median 2.8 21.1 23.5 13.9 25.6 10.8 19.1 Aug-10
Pinnacle 136,424,095 1.3 2.7 18 25.9 23 30.1 27 -- -- -- -- -- -- 27.7 Dec-11Russell 2500 Growth 1.0 45 22.7 45 26.7 53 13.9 44 25.8 44 9.6 73 23.3 Dec-11
Over/Under 1.7 3.2 3.4 4.4eA US Small-Mid Cap Growth Equity GrossMedian 1.0 22.2 26.9 13.2 25.4 10.9 22.4 Dec-11
March 31, 2014
1 - U.S. Small/Mid Cap Equity Composite includes the performance history of the U.S. Small Cap Equity Composite through November 2011.2 - NMERB Small/Mid Cap Equity Blended Benchmark is the Russell 2000 Index through November 2011 and the Russell 2500 Index from December 2011 - forward.*Performance shown is gross of fees.*Fiscal year ends June 30.
New Mexico Educational Retirement BoardPerformance Detail - U.S. Equity
39

1 - Non-US Equity Composite includes includes $340,887 in liquidating portfolios and $432,321 in residual assets that were used to fund the BlackRock MSCI EAFE Index Fund, Neuberger BermanEmerging Markets portfolio, and Mondrian Emerging Markets Small Cap portfolio in early July.2 - Non-US Developed Markets Equity Composite includes $252,424 in a liquidating portfolio that was used to fund the BlackRock MSCI EAFE Index Fund in early July.3 - Non-US Emerging Markets Equity Composite includes $88,463 in a liquidating portfolio that was used to fund Neuberger Berman Emerging Markets portfolio and Mondrian Emerging Markets Small Capportfolio in early July.*Performance shown is gross of fees.*Fiscal year ends June 30.
March 31, 2014
New Mexico Educational Retirement BoardPerformance Detail - Non-U.S. Equity
Market Value($)
% ofPortfolio
3 Mo(%) Rank
FiscalYTD(%)
Rank 1 Yr(%) Rank 3 Yrs
(%) Rank 5 Yrs(%) Rank 10 Yrs
(%) Rank Return(%) Since
_
Non-U.S. Equity Composite 1,638,698,032 15.0 0.1 63 10.4 98 3.1 99 -1.8 99 13.4 98 6.0 97 7.6 Jul-95MSCI ACWI ex USA 0.5 56 15.9 69 12.3 84 4.1 88 15.5 82 7.1 82 -- Jul-95
Over/Under -0.4 -5.5 -9.2 -5.9 -2.1 -1.1eA All ACWI ex-US Equity Gross Median 0.8 17.4 15.4 7.3 17.7 8.9 9.4 Jul-95
Non-U.S. Developed Mkts Equity Composite 587,918,664 5.4 0.3 67 18.2 66 18.2 61 6.5 81 15.4 86 6.0 98 7.1 Sep-95MSCI EAFE 0.7 59 18.7 61 17.6 66 7.2 74 16.0 80 6.5 92 5.5 Sep-95
Over/Under -0.4 -0.5 0.6 -0.7 -0.6 -0.5 1.6eA All EAFE Equity Gross Median 1.1 19.9 19.9 9.0 18.1 8.2 8.0 Sep-95
Pyramis 289,174,135 2.7 -0.2 76 18.1 67 17.9 63 8.3 61 16.4 75 7.4 78 9.8 Jun-03MSCI EAFE 0.7 59 18.7 61 17.6 66 7.2 74 16.0 80 6.5 92 9.0 Jun-03
Over/Under -0.9 -0.6 0.3 1.1 0.4 0.9 0.8eA All EAFE Equity Gross Median 1.1 19.9 19.9 9.0 18.1 8.2 10.6 Jun-03
BlackRock MSCI EAFE 298,059,784 2.7 0.7 57 19.6 53 -- -- -- -- -- -- -- -- 12.9 Aug-13MSCI EAFE 0.7 59 18.7 61 17.6 66 7.2 74 16.0 80 6.5 92 12.8 Aug-13
Over/Under 0.0 0.9 0.1eA All EAFE Equity Gross Median 1.1 19.9 19.9 9.0 18.1 8.2 13.8 Aug-13
40
March 31, 2014
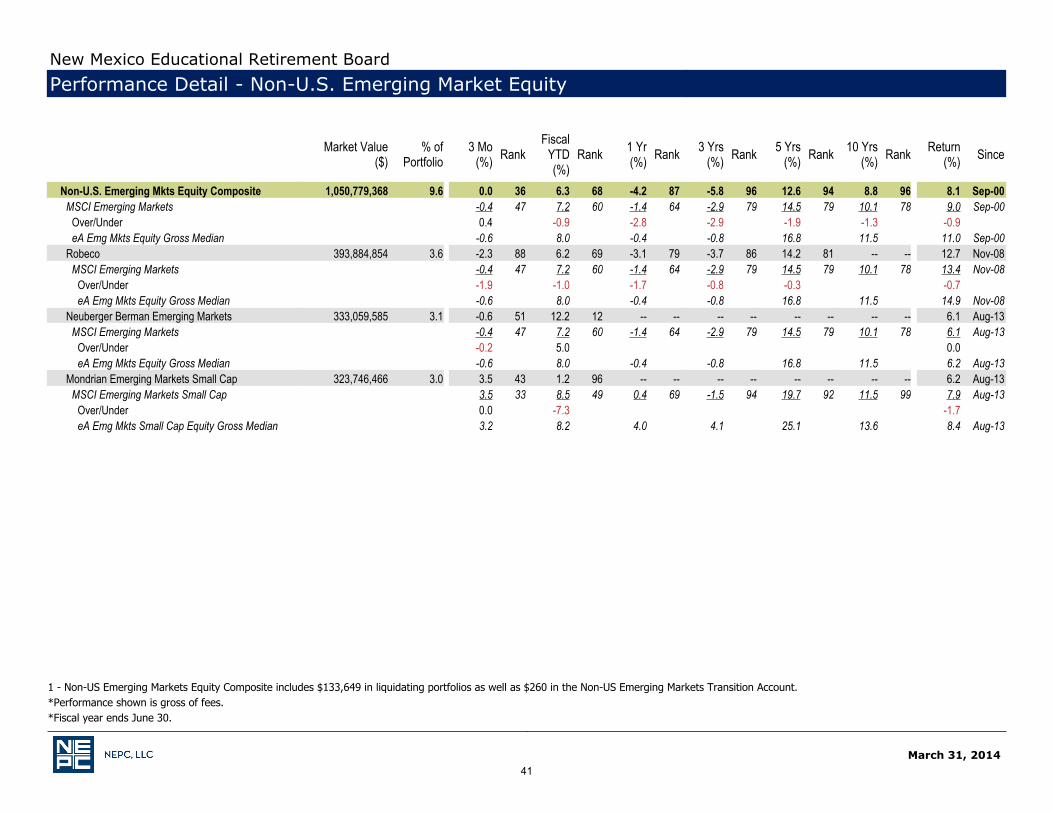
New Mexico Educational Retirement BoardPerformance Detail - Non-U.S. Emerging Market Equity
1 - Non-US Emerging Markets Equity Composite includes $133,649 in liquidating portfolios as well as $260 in the Non-US Emerging Markets Transition Account.*Performance shown is gross of fees.*Fiscal year ends June 30.
Market Value($)
% ofPortfolio
3 Mo(%) Rank
FiscalYTD(%)
Rank 1 Yr(%) Rank 3 Yrs
(%) Rank 5 Yrs(%) Rank 10 Yrs
(%) Rank Return(%) Since
_
Non-U.S. Emerging Mkts Equity Composite 1,050,779,368 9.6 0.0 36 6.3 68 -4.2 87 -5.8 96 12.6 94 8.8 96 8.1 Sep-00MSCI Emerging Markets -0.4 47 7.2 60 -1.4 64 -2.9 79 14.5 79 10.1 78 9.0 Sep-00
Over/Under 0.4 -0.9 -2.8 -2.9 -1.9 -1.3 -0.9eA Emg Mkts Equity Gross Median -0.6 8.0 -0.4 -0.8 16.8 11.5 11.0 Sep-00
Robeco 393,884,854 3.6 -2.3 88 6.2 69 -3.1 79 -3.7 86 14.2 81 -- -- 12.7 Nov-08MSCI Emerging Markets -0.4 47 7.2 60 -1.4 64 -2.9 79 14.5 79 10.1 78 13.4 Nov-08
Over/Under -1.9 -1.0 -1.7 -0.8 -0.3 -0.7eA Emg Mkts Equity Gross Median -0.6 8.0 -0.4 -0.8 16.8 11.5 14.9 Nov-08
Neuberger Berman Emerging Markets 333,059,585 3.1 -0.6 51 12.2 12 -- -- -- -- -- -- -- -- 6.1 Aug-13MSCI Emerging Markets -0.4 47 7.2 60 -1.4 64 -2.9 79 14.5 79 10.1 78 6.1 Aug-13
Over/Under -0.2 5.0 0.0eA Emg Mkts Equity Gross Median -0.6 8.0 -0.4 -0.8 16.8 11.5 6.2 Aug-13
Mondrian Emerging Markets Small Cap 323,746,466 3.0 3.5 43 1.2 96 -- -- -- -- -- -- -- -- 6.2 Aug-13MSCI Emerging Markets Small Cap 3.5 33 8.5 49 0.4 69 -1.5 94 19.7 92 11.5 99 7.9 Aug-13
Over/Under 0.0 -7.3 -1.7eA Emg Mkts Small Cap Equity Gross Median 3.2 8.2 4.0 4.1 25.1 13.6 8.4 Aug-13
41

March 31, 2014
New Mexico Educational Retirement BoardPerformance Detail - Total Fixed Income and Core Fixed Income
*Performance shown is gross of fees.*Fiscal year ends June 30.
Market Value($)
% ofPortfolio
3 Mo(%) Rank
FiscalYTD(%)
Rank 1 Yr(%) Rank 3 Yrs
(%) Rank 5 Yrs(%) Rank 10 Yrs
(%) Rank Return(%) Since
_
Fixed Income Composite 3,675,340,397 33.7 2.4 31 6.6 17 6.6 11 7.9 19 12.0 17 6.7 17 8.9 Jan-85Barclays Aggregate 1.8 51 2.3 62 -0.1 83 3.7 63 4.8 66 4.5 62 7.5 Jan-85
Over/Under 0.6 4.3 6.7 4.2 7.2 2.2 1.4eA All US Fixed Inc Gross Median 1.8 2.8 0.7 4.4 5.9 4.8 8.1 Jan-85
Core Fixed Income Composite 1,126,437,843 10.3 2.5 9 3.2 27 0.7 30 4.9 26 7.9 12 4.9 58 6.0 Dec-99Barclays Aggregate 1.8 67 2.3 75 -0.1 75 3.7 85 4.8 85 4.5 86 5.6 Dec-99
Over/Under 0.7 0.9 0.8 1.2 3.1 0.4 0.4eA US Core Fixed Inc Gross Median 2.0 2.8 0.4 4.4 6.0 4.9 6.1 Dec-99
Neuberger Berman 394,108,602 3.6 1.9 58 2.7 56 0.2 61 4.2 63 6.9 27 -- -- 5.6 Apr-06Barclays Aggregate 1.8 67 2.3 75 -0.1 75 3.7 85 4.8 85 4.5 86 5.2 Apr-06
Over/Under 0.1 0.4 0.3 0.5 2.1 0.4eA US Core Fixed Inc Gross Median 2.0 2.8 0.4 4.4 6.0 4.9 5.7 Apr-06
Pyramis 402,063,902 3.7 2.0 43 2.9 43 0.4 48 4.6 41 6.8 29 -- -- 5.8 Apr-06Barclays Aggregate 1.8 67 2.3 75 -0.1 75 3.7 85 4.8 85 4.5 86 5.2 Apr-06
Over/Under 0.2 0.6 0.5 0.9 2.0 0.6eA US Core Fixed Inc Gross Median 2.0 2.8 0.4 4.4 6.0 4.9 5.7 Apr-06
WAMCO 330,265,338 3.0 3.7 3 4.2 6 1.8 5 6.2 4 10.7 1 -- -- 6.4 Apr-06Barclays Aggregate 1.8 67 2.3 75 -0.1 75 3.7 85 4.8 85 4.5 86 5.2 Apr-06
Over/Under 1.9 1.9 1.9 2.5 5.9 1.2eA US Core Fixed Inc Gross Median 2.0 2.8 0.4 4.4 6.0 4.9 5.7 Apr-06
42

Market Value($)
% ofPortfolio
3 Mo(%) Rank
FiscalYTD(%)
Rank 1 Yr(%) Rank 3 Yrs
(%) Rank 5 Yrs(%) Rank 10 Yrs
(%) Rank Return(%) Since
_
Non-U.S. Emerging Market Debt Composite 200,761,394 1.8 1.0 93 -0.1 88 -4.4 70 -- -- -- -- -- -- 1.1 Sep-11JP Morgan GBI - EM Diversified 1.9 74 -0.1 88 -7.1 82 1.1 89 9.8 91 9.3 55 -0.7 Sep-11
Over/Under -0.9 0.0 2.7 1.8eA All Emg Mkts Fixed Inc Gross Median 2.7 4.7 -2.0 6.0 12.8 9.4 5.5 Sep-11
Pictet 116,510,366 1.1 1.4 83 -1.7 99 -8.7 94 -- -- -- -- -- -- -1.2 Sep-11JP Morgan GBI - EM Diversified 1.9 74 -0.1 88 -7.1 82 1.1 89 9.8 91 9.3 55 -0.7 Sep-11
Over/Under -0.5 -1.6 -1.6 -0.5eA All Emg Mkts Fixed Inc Gross Median 2.7 4.7 -2.0 6.0 12.8 9.4 5.5 Sep-11
Citi EMSO 84,251,028 0.8 0.4 96 2.1 68 2.1 7 -- -- -- -- -- -- 4.6 Sep-11JP Morgan GBI - EM Diversified 1.9 74 -0.1 88 -7.1 82 1.1 89 9.8 91 9.3 55 -0.7 Sep-11
Over/Under -1.5 2.2 9.2 5.3eA All Emg Mkts Fixed Inc Gross Median 2.7 4.7 -2.0 6.0 12.8 9.4 5.5 Sep-11
March 31, 2014
*Performance shown is gross of fees except for Citi EMSO.*Fiscal year ends June 30.
New Mexico Educational Retirement BoardPerformance Detail - Emerging Market Debt
43

March 31, 2014
New Mexico Educational Retirement BoardPerformance Detail - Opportunistic Fixed Income
*Performance shown is net of fees.*Fiscal year ends June 30.
Market Value($)
% ofPortfolio
3 Mo(%) Rank
FiscalYTD(%)
Rank 1 Yr(%) Rank 3 Yrs
(%) Rank 5 Yrs(%) Rank 10 Yrs
(%) Rank Return(%) Since
_
Opportunistic Credit Composite 2,348,141,160 21.5 2.3 -- 9.0 -- 11.4 -- 9.2 -- 17.1 -- -- -- 10.3 May-0850% Credit Suisse Leveraged Loan Index / 50% BofAML US HY BB-B Rated Constrained Index 2.1 -- 6.6 -- 6.0 -- 6.9 -- 14.0 -- 6.4 -- 7.5 May-08
Over/Under 0.2 2.4 5.4 2.3 3.1 2.8 BofA Merrill Lynch US High Yield BB-B RatedConstrained Index 3.0 -- 8.6 -- 6.9 -- 8.4 -- 15.7 -- 7.8 -- 9.0 May-08
Beachpoint Combined 718,538,015 6.6 2.4 -- 9.4 -- 11.6 -- 9.8 -- 16.7 -- 7.8 -- 7.7 Mar-0450% Credit Suisse Leveraged Loan Index / 50%BofA ML US HY BB-B Rated Constrained Index 2.1 -- 6.6 -- 6.0 -- 6.9 -- 14.0 -- 6.4 -- 6.4 Mar-04
Over/Under 0.3 2.8 5.6 2.9 2.7 1.4 1.3 Beachpoint Total Return 718,538,015 6.6 2.4 -- 9.4 -- 11.6 -- 9.8 -- 16.7 -- -- -- 8.9 Jun-08
50% Credit Suisse Leveraged Loan Index / 50%BofA ML US HY BB-B Rated Constrained Index 2.1 -- 6.6 -- 6.0 -- 6.9 -- 14.0 -- 6.4 -- 7.5 Jun-08
Over/Under 0.3 2.8 5.6 2.9 2.7 1.4 Pimco Disco Combined 399,121,554 3.7 3.3 -- 9.7 -- 10.6 -- 12.5 -- 19.6 -- -- -- 14.7 Jul-08
50% Credit Suisse Leveraged Loan Index / 50%BofA ML US HY BB-B Rated Constrained Index 2.1 -- 6.6 -- 6.0 -- 6.9 -- 14.0 -- 6.4 -- 7.8 Jul-08
Over/Under 1.2 3.1 4.6 5.6 5.6 6.9 Pimco Disco II 399,121,554 3.7 3.3 -- 9.7 -- 10.6 -- -- -- -- -- -- -- 23.3 Oct-11
50% Credit Suisse Leveraged Loan Index / 50%BofA ML US HY BB-B Rated Constrained Index 2.1 -- 6.6 -- 6.0 -- 6.9 -- 14.0 -- 6.4 -- 9.9 Oct-11
Over/Under 1.2 3.1 4.6 13.4 GoldenTree Combined 129,688,113 1.2 0.9 -- 9.5 -- 13.8 -- 8.7 -- -- -- -- -- 12.5 Oct-09
50% Credit Suisse Leveraged Loan Index / 50%BofA ML US HY BB-B Rated Constrained Index 2.1 -- 6.6 -- 6.0 -- 6.9 -- 14.0 -- 6.4 -- 8.9 Oct-09
Over/Under -1.2 2.9 7.8 1.8 3.6 Goldentree II 129,688,113 1.2 0.9 -- 9.5 -- 13.8 -- -- -- -- -- -- -- 13.9 Sep-11
50% Credit Suisse Leveraged Loan Index / 50%BofA ML US HY BB-B Rated Constrained Index 2.1 -- 6.6 -- 6.0 -- 6.9 -- 14.0 -- 6.4 -- 9.0 Sep-11
Over/Under -1.2 2.9 7.8 4.9
44

Market Value($)
% ofPortfolio
3 Mo(%) Rank
FiscalYTD(%)
Rank 1 Yr(%) Rank 3 Yrs
(%) Rank 5 Yrs(%) Rank 10 Yrs
(%) Rank Return(%) Since
_
Medley Capital 136,438,851 1.3 1.9 -- 8.4 -- 12.9 -- -- -- -- -- -- -- 8.5 Aug-1150% Credit Suisse Leveraged Loan Index / 50%BofA ML US HY BB-B Rated Constrained Index 2.1 -- 6.6 -- 6.0 -- 6.9 -- 14.0 -- 6.4 -- 7.2 Aug-11
Over/Under -0.2 1.8 6.9 1.3GSO Capital 55,702,906 0.5 1.7 -- 6.8 -- 7.7 -- -- -- -- -- -- -- 5.7 Sep-11
50% Credit Suisse Leveraged Loan Index / 50%BofA ML US HY BB-B Rated Constrained Index 2.1 -- 6.6 -- 6.0 -- 6.9 -- 14.0 -- 6.4 -- 9.0 Sep-11
Over/Under -0.4 0.2 1.7 -3.3Waterfall - Eden 215,674,307 2.0 3.9 -- 8.5 -- 12.5 -- -- -- -- -- -- -- 14.5 Aug-11
50% Credit Suisse Leveraged Loan Index / 50%BofA ML US HY BB-B Rated Constrained Index 2.1 -- 6.6 -- 6.0 -- 6.9 -- 14.0 -- 6.4 -- 7.2 Aug-11
Over/Under 1.8 1.9 6.5 7.3Waterfall - Victoria 128,248,644 1.2 1.5 -- 6.7 -- 10.4 -- -- -- -- -- -- -- 10.1 Aug-11
50% Credit Suisse Leveraged Loan Index / 50%BofA ML US HY BB-B Rated Constrained Index 2.1 -- 6.6 -- 6.0 -- 6.9 -- 14.0 -- 6.4 -- 7.2 Aug-11
Over/Under -0.6 0.1 4.4 2.9Marathon European Credit Opportunity I 211,396,662 1.9 0.9 -- 6.9 -- 8.5 -- -- -- -- -- -- -- 10.0 Oct-11
50% Credit Suisse Leveraged Loan Index / 50%BofA ML US HY BB-B Rated Constrained Index 2.1 -- 6.6 -- 6.0 -- 6.9 -- 14.0 -- 6.4 -- 9.9 Oct-11
Over/Under -1.2 0.3 2.5 0.1Marathon European Credit Opportunity II 22,500,000 0.2 -- -- -- -- -- -- -- -- -- -- -- -- 0.0 Mar-14
50% Credit Suisse Leveraged Loan Index / 50%BofA ML US HY BB-B Rated Constrained Index 2.1 -- 6.6 -- 6.0 -- 6.9 -- 14.0 -- 6.4 -- 0.3 Mar-14
Over/Under -0.3Elegantree Fund 135,970,619 1.2 2.4 -- 8.9 -- 12.5 -- -- -- -- -- -- -- 13.5 Mar-12
50% Credit Suisse Leveraged Loan Index / 50%BofA ML US HY BB-B Rated Constrained Index 2.1 -- 6.6 -- 6.0 -- 6.9 -- 14.0 -- 6.4 -- 7.9 Mar-12
Over/Under 0.3 2.3 6.5 5.6
1 - Marathon European Credit Opportunity II was funded in March 2014.*Performance shown is net of fees.*Fiscal year ends June 30.
March 31, 2014
New Mexico Educational Retirement BoardPerformance Detail - Opportunistic Fixed Income
45

Market Value($)
% ofPortfolio
3 Mo(%) Rank
FiscalYTD(%)
Rank 1 Yr(%) Rank 3 Yrs
(%) Rank 5 Yrs(%) Rank 10 Yrs
(%) Rank Return(%) Since
_
Gramercy Distressed Opp II 104,562,446 1.0 -0.4 -- 27.2 -- 25.7 -- -- -- -- -- -- -- -2.1 Jun-1250% Credit Suisse Leveraged Loan Index / 50%BofA ML US HY BB-B Rated Constrained Index 2.1 -- 6.6 -- 6.0 -- 6.9 -- 14.0 -- 6.4 -- 8.8 Jun-12
Over/Under -2.5 20.6 19.7 -10.9 ICE Canyon 64,874,710 0.6 0.3 -- 1.0 -- 1.8 -- -- -- -- -- -- -- 5.6 Jun-12
50% Credit Suisse Leveraged Loan Index / 50%BofA ML US HY BB-B Rated Constrained Index 2.1 -- 6.6 -- 6.0 -- 6.9 -- 14.0 -- 6.4 -- 8.8 Jun-12
Over/Under -1.8 -5.6 -4.2 -3.2 Lone Star VIII 25,424,334 0.2 18.0 -- -- -- -- -- -- -- -- -- -- -- -- Jun-13
50% Credit Suisse Leveraged Loan Index / 50%BofA ML US HY BB-B Rated Constrained Index 2.1 -- 6.6 -- 6.0 -- 6.9 -- 14.0 -- 6.4 -- 4.9 Jun-13
Over/Under 15.9
*Performance shown is net of fees.*Fiscal year ends June 30.
March 31, 2014
New Mexico Educational Retirement BoardPerformance Detail - Opportunistic Fixed Income
46

Market Value($)
% ofPortfolio
3 Mo(%) Rank
FiscalYTD(%)
Rank 1 Yr(%) Rank 3 Yrs
(%) Rank 5 Yrs(%) Rank 10 Yrs
(%) Rank Return(%) Since
_
Absolute Return Composite 363,579,806 3.3 1.0 -- 1.9 -- 3.5 -- 1.3 -- 5.5 -- -- -- 1.2 Jan-07HFRI FOF Conservative (1 Mo Lag) 2.4 -- 4.9 -- 7.2 -- 2.7 -- 4.6 -- 2.7 -- 1.4 Jan-07
Over/Under -1.4 -3.0 -3.7 -1.4 0.9 -0.2 91 Day T-Bill + 2% (1 Mo Lag) 0.5 -- 1.5 -- 2.0 -- 2.1 -- 2.1 -- 3.6 -- 2.9 Jan-07Austin Capital (in liquidation) 4,706,048 0.0 -3.8 -- -22.5 -- -21.9 -- -12.9 -- -7.6 -- -- -- -6.4 Jan-07DB Advisors (in liquidation) 2,547,760 0.0 3.2 -- 5.5 -- 6.0 -- 0.7 -- 3.5 -- -- -- 0.9 Jan-07Absolute Return Composite (ex Austin & DB) 356,325,999 3.3 1.1 -- 2.2 -- 3.8 -- 1.5 -- 6.1 -- -- -- 1.2 Jan-07
HFRI FOF Conservative (1 Mo Lag) 2.4 -- 4.9 -- 7.2 -- 2.7 -- 4.6 -- 2.7 -- 1.4 Jan-07Over/Under -1.3 -2.7 -3.4 -1.2 1.5 -0.2
91 Day T-Bill + 2% (1 Mo Lag) 0.5 -- 1.5 -- 2.0 -- 2.1 -- 2.1 -- 3.6 -- 2.9 Jan-07Benchmark Plus 191,760,520 1.8 1.9 -- 6.5 -- 8.5 -- 2.6 -- 7.0 -- -- -- 3.8 Feb-07
HFRI FOF Conservative (1 Mo Lag) 2.4 -- 4.9 -- 7.2 -- 2.7 -- 4.6 -- 2.7 -- 1.2 Feb-07Over/Under -0.5 1.6 1.3 -0.1 2.4 2.6
91 Day T-Bill + 2% (1 Mo Lag) 0.5 -- 1.5 -- 2.0 -- 2.1 -- 2.1 -- 3.6 -- 2.9 Feb-07GAM 159,549,435 1.5 0.3 -- -3.7 -- -2.7 -- 0.2 -- -- -- -- -- 1.7 Aug-10
HFRI FOF Conservative (1 Mo Lag) 2.4 -- 4.9 -- 7.2 -- 2.7 -- 4.6 -- 2.7 -- 4.0 Aug-10Over/Under -2.1 -8.6 -9.9 -2.5 -2.3
91 Day T-Bill + 2% (1 Mo Lag) 0.5 -- 1.5 -- 2.0 -- 2.1 -- 2.1 -- 3.6 -- 2.1 Aug-10Gottex Market Neutral 2,343,098 0.0 -2.3 -- 3.1 -- 2.6 -- 0.8 -- 5.1 -- -- -- -3.1 Jan-07TAG 2,672,946 0.0 0.0 -- -0.5 -- 1.9 -- 1.4 -- 4.2 -- -- -- 1.3 Feb-07
HFRI FOF Conservative (1 Mo Lag) 2.4 -- 4.9 -- 7.2 -- 2.7 -- 4.6 -- 2.7 -- 1.2 Feb-07Over/Under -2.4 -5.4 -5.3 -1.3 -0.4 0.1
91 Day T-Bill + 2% (1 Mo Lag) 0.5 -- 1.5 -- 2.0 -- 2.1 -- 2.1 -- 3.6 -- 2.9 Feb-07
March 31, 2014
New Mexico Educational Retirement BoardPerformance Detail - Absolute Return
1 - Absolute Return Composites, underlying managers and benchmark performance are lagged one month.*Performance shown is net of fees.*Fiscal year ends June 30.
47

March 31, 2014
*Performance shown is net of fees.*Fiscal year ends June 30.
New Mexico Educational Retirement BoardPerformance Detail - Global Asset Allocation and Risk Parity
Market Value($)
% ofPortfolio
3 Mo(%) Rank
FiscalYTD(%)
Rank 1 Yr(%) Rank 3 Yrs
(%) Rank 5 Yrs(%) Rank 10 Yrs
(%) Rank Return(%) Since
_
Global Asset Allocation/Risk Parity Composite 1,073,766,406 9.9 3.1 7 6.6 62 1.0 81 8.5 14 -- -- -- -- 10.9 Oct-0960% MSCI World HH/40% CITI WGBI HH 1.6 35 11.7 23 11.5 17 8.0 16 12.2 35 6.1 68 8.3 Oct-09
Over/Under 1.5 -5.1 -10.5 0.5 2.6 eA Global TAA Net Median 1.2 8.1 5.4 4.9 10.3 7.5 6.3 Oct-09
Global Asset Allocation Composite 528,322,764 4.8 1.9 17 4.5 80 4.2 61 -- -- -- -- -- -- 3.0 Nov-12Credit Suisse Hedge Global Macro -0.6 96 2.3 97 1.5 80 4.7 57 7.3 83 7.8 45 4.0 Nov-12
Over/Under 2.5 2.2 2.7 -1.0 eA Global TAA Net Median 1.2 8.1 5.4 4.9 10.3 7.5 6.6 Nov-12
Bridgewater Pure Alpha 248,537,145 2.3 1.6 35 6.0 70 5.8 49 6.2 32 -- -- -- -- 10.2 Oct-09Credit Suisse Hedge Global Macro -0.6 96 2.3 97 1.5 80 4.7 57 7.3 83 7.8 45 6.7 Oct-09
Over/Under 2.2 3.7 4.3 1.5 3.5 eA Global TAA Net Median 1.2 8.1 5.4 4.9 10.3 7.5 6.3 Oct-09
Bridgewater Pure Alpha Major Markets 12,191,854 0.1 2.8 8 8.0 52 7.0 40 6.7 28 -- -- -- -- 7.7 Dec-10Credit Suisse Hedge Global Macro -0.6 96 2.3 97 1.5 80 4.7 57 7.3 83 7.8 45 5.2 Dec-10
Over/Under 3.4 5.7 5.5 2.0 2.5 eA Global TAA Net Median 1.2 8.1 5.4 4.9 10.3 7.5 5.9 Dec-10
PIMCO All Asset All Authority 267,593,765 2.5 2.2 14 2.9 96 -- -- -- -- -- -- -- -- 2.9 Jul-13Credit Suisse Hedge Global Macro -0.6 96 2.3 97 1.5 80 4.7 57 7.3 83 7.8 45 2.3 Jul-13
Over/Under 2.8 0.6 0.6 eA Global TAA Net Median 1.2 8.1 5.4 4.9 10.3 7.5 8.1 Jul-13
48

March 31, 2014
*PanAgora was funded in December 2013.*Performance shown is net of fees.*Fiscal year ends June 30.
New Mexico Educational Retirement BoardPerformance Detail - Real Estate
Market Value($)
% ofPortfolio
3 Mo(%) Rank
FiscalYTD(%)
Rank 1 Yr(%) Rank 3 Yrs
(%) Rank 5 Yrs(%) Rank 10 Yrs
(%) Rank Return(%) Since
_
Risk Parity 545,443,642 5.0 4.3 3 9.2 38 -0.1 85 -- -- -- -- -- -- 1.8 Nov-1260% MSCI World HH/40% CITI WGBI HH 1.6 35 11.7 23 11.5 17 8.0 16 12.2 35 6.1 68 13.4 Nov-12
Over/Under 2.7 -2.5 -11.6 -11.6 eA Global TAA Net Median 1.2 8.1 5.4 4.9 10.3 7.5 6.6 Nov-12
Bridgewater All Weather 381,186,286 3.5 3.7 5 8.4 41 -0.8 86 10.4 3 -- -- -- -- 11.6 Oct-0960% MSCI World (Gross) / 40% CITI WGBI 1.9 17 12.9 16 12.2 15 7.4 24 13.0 32 6.5 65 8.3 Oct-09
Over/Under 1.8 -4.5 -13.0 3.0 3.3 eA Global TAA Net Median 1.2 8.1 5.4 4.9 10.3 7.5 6.3 Oct-09
PanAgora 164,257,356 1.5 5.7 -- -- -- -- -- -- -- -- -- -- -- 6.4 Dec-1360% MSCI World HH/40% CITI WGBI HH 1.6 -- 11.7 -- 11.5 -- 8.0 -- 12.2 -- 6.1 -- 2.6 Dec-13
Over/Under 4.1 3.8 Real Estate Composite 567,836,345 5.2 6.6 -- 9.7 -- 10.0 -- 12.4 -- 25.3 -- 8.5 -- 9.7 Dec-03
NCREIF Property Index 2.7 -- 8.1 -- 11.2 -- 11.7 -- 7.9 -- 8.7 -- 8.9 Dec-03Over/Under 3.9 1.6 -1.2 0.7 17.4 -0.2 0.8
Wilshire REIT 10.1 -- 5.9 -- 4.4 -- 10.5 -- 29.2 -- 8.2 -- 9.4 Dec-03Public Real Estate Composite 314,995,693 2.9 9.2 72 6.5 65 5.1 75 11.3 43 29.8 38 8.5 90 9.7 Dec-03
Wilshire REIT 10.1 35 5.9 84 4.4 82 10.5 74 29.2 52 8.2 97 9.4 Dec-03Over/Under -0.9 0.6 0.7 0.8 0.6 0.3 0.3 eA US REIT Gross Median 9.7 6.9 5.8 11.1 29.3 9.9 11.2 Dec-03
REIT Index Fund 175,036,852 1.6 10.0 37 5.8 85 4.0 84 10.2 83 29.0 56 8.1 97 9.4 Dec-03Wilshire REIT 10.1 35 5.9 84 4.4 82 10.5 74 29.2 52 8.2 97 9.4 Dec-03
Over/Under -0.1 -0.1 -0.4 -0.3 -0.2 -0.1 0.0 eA US REIT Gross Median 9.7 6.9 5.8 11.1 29.3 9.9 11.2 Dec-03
Brookfield 139,958,841 1.3 8.2 84 7.4 39 6.8 23 -- -- -- -- -- -- 13.2 Jul-11MSCI US REIT 9.7 55 5.0 98 3.0 92 9.4 97 27.2 96 -- -- 9.0 Jul-11
Over/Under -1.5 2.4 3.8 4.2 eA US REIT Gross Median 9.7 6.9 5.8 11.1 29.3 9.9 10.5 Jul-11
49

Market Value($)
% ofPortfolio
3 Mo(%) Rank
FiscalYTD(%)
Rank 1 Yr(%) Rank 3 Yrs
(%) Rank 5 Yrs(%) Rank 10 Yrs
(%) Rank Return(%) Since
_
Private Real Estate Composite 252,840,652 2.3 3.3 -- 14.9 -- 18.5 -- 15.0 -- 11.7 -- -- -- 4.9 Jan-08NCREIF Property Index 2.7 -- 8.1 -- 11.2 -- 11.7 -- 7.9 -- 8.7 -- 3.9 Jan-08
Over/Under 0.6 6.8 7.3 3.3 3.8 1.0 U.S. Private Real Estate 246,299,307 2.3 3.3 -- 15.0 -- 18.7 -- 15.5 -- 12.5 -- -- -- 5.9 Jan-08
NCREIF Property Index 2.7 -- 8.1 -- 11.2 -- 11.7 -- 7.9 -- 8.7 -- 3.9 Jan-08Over/Under 0.6 6.9 7.5 3.8 4.6 2.0
Non-U.S. Private Real Estate 6,541,345 0.1 2.3 -- 11.1 -- 13.4 -- 3.4 -- -1.4 -- -- -- -7.7 Aug-08NCREIF Property Index 2.7 -- 8.1 -- 11.2 -- 11.7 -- 7.9 -- 8.7 -- 3.9 Aug-08
Over/Under -0.4 3.0 2.2 -8.3 -9.3 -11.6 Private Equity Composite 782,452,903 7.2 5.3 -- 12.1 -- 16.7 -- 14.0 -- 14.6 -- -- -- 3.3 Jun-06
Cambridge PE 1 Qtr Lag 7.3 -- 16.1 -- 21.3 -- 15.1 -- 15.9 -- 15.0 -- 12.4 Jun-06Over/Under -2.0 -4.0 -4.6 -1.1 -1.3 -9.1
Real Assets Composite 215,162,976 2.0 1.5 -- 4.1 -- 4.0 -- 1.1 -- 3.4 -- -- -- -1.3 Jul-08CPI + 5% (Seasonally Adjusted) 1.7 -- 5.0 -- 6.6 -- 6.9 -- 7.2 -- 7.4 -- 6.5 Jul-08
Over/Under -0.2 -0.9 -2.6 -5.8 -3.8 -7.8 Infrastructure Composite 128,657,321 1.2 -0.9 -- 1.3 -- 1.4 -- -0.5 -- 2.9 -- -- -- -1.1 Jul-08
Infrastructure 118,390,611 1.1 -0.8 -- 1.5 -- 1.6 -- -0.3 -- 3.0 -- -- -- -1.0 Jul-08CPI + 6% (Seasonally Adjusted) 1.9 -- 5.7 -- 7.6 -- 8.0 -- 8.2 -- 8.5 -- 7.5 Jul-08
Over/Under -2.7 -4.2 -6.0 -8.3 -5.2 -8.5 International Infrastructure 10,266,710 0.1 -1.9 -- -0.1 -- -1.0 -- -- -- -- -- -- -- -57.7 Jan-13
CPI + 6% (Seasonally Adjusted) 1.9 -- 5.7 -- 7.6 -- 8.0 -- 8.2 -- 8.5 -- 7.7 Jan-13Over/Under -3.8 -5.8 -8.6 -65.4
Energy 8,211,909 0.1 -2.7 -- -- -- -- -- -- -- -- -- -- -- -2.7 Jan-14Agriculture Composite 28,208,789 0.3 0.5 -- 7.3 -- 7.3 -- -- -- -- -- -- -- 4.4 Aug-12
NCREIF Farmland 2.4 -- 15.2 -- 17.5 -- 18.2 -- 14.1 -- 17.6 -- 21.5 Aug-12Over/Under -1.9 -7.9 -10.2 -17.1
Timber Composite 36,412,681 0.3 8.8 -- 9.3 -- 8.8 -- 5.8 -- 2.7 -- -- -- 2.7 Mar-09NCREIF Timberland 1.6 -- 8.8 -- 9.8 -- 6.6 -- 2.9 -- 8.3 -- 3.0 Mar-09
Over/Under 7.2 0.5 -1.0 -0.8 -0.2 -0.3
New Mexico Educational Retirement BoardPerformance Detail - Private Equity, Real Assets and Cash
March 31, 2014
1 - Energy funded in January 2014.2 - Agriculture Composite contains Halderman Farm Mgmt Services and Hancock Agriculture. Timber Composite Contains Timber and BrookField Brazil Timber, which was funded in December 2013.*Performance shown is net of fees.
50

March 31, 2014
*Performance shown is net of fees.*Fiscal year ends June 30.
New Mexico Educational Retirement BoardPerformance Detail - Private Equity, Real Assets and Cash
Market Value($)
% ofPortfolio
3 Mo(%) Rank
FiscalYTD(%)
Rank 1 Yr(%) Rank 3 Yrs
(%) Rank 5 Yrs(%) Rank 10 Yrs
(%) Rank Return(%) Since
_
Mitigation Banking 13,672,277 0.1 10.6 -- 16.3 -- 13.9 -- -10.3 -- -- -- -- -- -10.0 Mar-1191 Day T-Bills 0.0 -- 0.0 -- 0.0 -- 0.1 -- 0.1 -- 1.5 -- 0.1 Mar-11
Over/Under 10.6 16.3 13.9 -10.4 -10.1 Cash
Cash 109,505,109 1.0 0.1 -- 0.3 -- 0.3 -- 0.4 -- 0.7 -- 1.6 -- 1.1 Dec-9991 Day T-Bills 0.0 -- 0.0 -- 0.0 -- 0.1 -- 0.1 -- 1.5 -- 2.0 Dec-99
Over/Under 0.1 0.3 0.3 0.3 0.6 0.1 -0.9 NM ERB Cash 3,090,097 0.0 0.0 -- 3.7 -- 3.7 -- 1.3 -- 0.9 -- 1.7 -- 1.2 Jun-00
91 Day T-Bills 0.0 -- 0.0 -- 0.0 -- 0.1 -- 0.1 -- 1.5 -- 1.8 Jun-00Over/Under 0.0 3.7 3.7 1.2 0.8 0.2 -0.6
XXXXX
51

March 31, 2014
New Mexico Educational Retirement BoardTotal Fund Return Summary vs. Peer Universe
52
March 31, 2014
New Mexico Educational Retirement BoardTotal Fund Return Summary vs. Peer Universe
53

Appendix: Net of Fees Performance
54

Market Value($)
% ofPortfolio
3 Mo(%)
FiscalYTD(%)
1 Yr(%)
3 Yrs(%)
5 Yrs(%)
10 Yrs(%)
Return(%) Since
_
Total Fund 10,900,451,533 100.0 2.2 10.1 9.8 7.9 14.7 6.8 9.4 Jul-83Policy Index 2.2 10.0 9.4 7.8 13.1 6.3 -- Jul-83
Over/Under 0.0 0.1 0.4 0.1 1.6 0.5Allocation Index 2.2 9.9 9.5 7.8 13.7 7.1 -- Jul-8360% MSCI World (Gross) / 40% CITI WGBI 1.9 12.9 12.2 7.4 13.0 6.5 -- Jul-83U.S. Equity Composite 2,471,019,462 22.7 2.0 18.9 22.3 14.5 21.3 7.4 11.4 Jan-85
Russell 3000 2.0 19.4 22.6 14.6 21.9 7.9 11.2 Jan-85Over/Under 0.0 -0.5 -0.3 -0.1 -0.6 -0.5 0.2
U.S. Large Cap Equity Composite 2,199,953,472 20.2 1.8 18.4 21.9 14.6 21.1 7.2 5.1 Aug-99S&P 500 1.8 18.4 21.9 14.7 21.2 7.4 4.3 Aug-99
Over/Under 0.0 0.0 0.0 -0.1 -0.1 -0.2 0.8S&P 500 Index Fund 2,199,953,472 20.2 1.8 18.4 21.9 14.6 21.1 7.1 3.6 Jan-00
S&P 500 1.8 18.4 21.9 14.7 21.2 7.4 3.7 Jan-00Over/Under 0.0 0.0 0.0 -0.1 -0.1 -0.3 -0.1
U.S. Small/Mid Cap Equity Composite 271,065,990 2.5 3.6 24.0 26.8 13.2 21.9 8.2 7.3 Aug-99NMERB Small/Mid Cap Equity Blended Index 2.3 21.3 24.0 13.4 24.5 8.6 8.3 Aug-99
Over/Under 1.3 2.7 2.8 -0.2 -2.6 -0.4 -1.0Lord Abbett 134,641,895 1.2 4.4 22.3 24.2 11.9 -- -- 17.4 Aug-10
Russell 2500 Value 3.5 19.9 21.8 13.9 24.8 9.0 18.8 Aug-10Over/Under 0.9 2.4 2.4 -2.0 -1.4
Pinnacle 136,424,095 1.3 2.7 25.6 29.5 -- -- -- 27.2 Dec-11Russell 2500 Growth 1.0 22.7 26.7 13.9 25.8 9.6 23.3 Dec-11
Over/Under 1.7 2.9 2.8 3.9
March 31, 2014
New Mexico Educational Retirement BoardTotal Fund Performance Detail (Net of Fee)
1 - U.S. Small/Mid Cap Equity Composite includes the performance history of the U.S. Small Cap Equity Composite through November 2011.2 - NMERB Small/Mid Cap Equity Blended Benchmark is the Russell 2000 Index through November 2011 and the Russell 2500 Index from December 2011 - forward.Note: Performance shown is net of fees.
55

1 - Non-US Equity Composite includes includes $340,887 in liquidating portfolios and $432,321 in residual assets that were used to fund the BlackRock MSCI EAFE Index Fund, Neuberger BermanEmerging Markets portfolio, and Mondrian Emerging Markets Small Cap portfolio in early July.2 - Non-US Developed Markets Equity Composite includes $252,424 in a liquidating portfolio that was used to fund the BlackRock MSCI EAFE Index Fund in early July.3 - Non-US Emerging Markets Equity Composite includes $88,463 in a liquidating portfolio that was used to fund Neuberger Berman Emerging Markets portfolio and Mondrian Emerging Markets Small Capportfolio in early July.*Performance shown is net of fees.
Market Value($)
% ofPortfolio
3 Mo(%)
FiscalYTD(%)
1 Yr(%)
3 Yrs(%)
5 Yrs(%)
10 Yrs(%)
Return(%) Since
_
Non-U.S. Equity Composite 1,638,698,032 15.0 -0.2 10.0 2.7 -2.1 13.0 5.6 7.1 Jul-95MSCI ACWI ex USA 0.5 15.9 12.3 4.1 15.5 7.1 -- Jul-95
Over/Under -0.7 -5.9 -9.6 -6.2 -2.5 -1.5Non-U.S. Developed Mkts Equity Composite 587,918,664 5.4 0.2 18.0 17.9 6.2 15.0 5.6 6.9 Sep-95
MSCI EAFE 0.7 18.7 17.6 7.2 16.0 6.5 5.5 Sep-95Over/Under -0.5 -0.7 0.3 -1.0 -1.0 -0.9 1.4
Pyramis 289,174,135 2.7 -0.3 17.9 17.6 8.0 16.1 7.1 9.5 Jun-03MSCI EAFE 0.7 18.7 17.6 7.2 16.0 6.5 9.0 Jun-03
Over/Under -1.0 -0.8 0.0 0.8 0.1 0.6 0.5BlackRock MSCI EAFE 298,059,784 2.7 0.7 19.6 -- -- -- -- 12.8 Aug-13
MSCI EAFE 0.7 18.7 17.6 7.2 16.0 6.5 12.8 Aug-13Over/Under 0.0 0.9 0.0
Non-U.S. Emerging Mkts Equity Composite 1,050,779,368 9.6 -0.4 5.8 -4.7 -6.1 12.2 8.3 7.7 Sep-00MSCI Emerging Markets -0.4 7.2 -1.4 -2.9 14.5 10.1 9.0 Sep-00
Over/Under 0.0 -1.4 -3.3 -3.2 -2.3 -1.8 -1.3Robeco 393,884,854 3.6 -2.4 5.8 -3.5 -4.1 13.7 -- 12.2 Nov-08
MSCI Emerging Markets -0.4 7.2 -1.4 -2.9 14.5 10.1 13.4 Nov-08Over/Under -2.0 -1.4 -2.1 -1.2 -0.8 -1.2
Neuberger Berman Emerging Markets 333,059,585 3.1 -1.0 11.7 -- -- -- -- 5.6 Aug-13MSCI Emerging Markets -0.4 7.2 -1.4 -2.9 14.5 10.1 6.1 Aug-13
Over/Under -0.6 4.5 -0.5Mondrian Emerging Markets Small Cap 323,746,466 3.0 2.9 0.6 -- -- -- -- 5.5 Aug-13
MSCI Emerging Markets Small Cap 3.5 8.5 0.4 -1.5 19.7 11.5 7.9 Aug-13Over/Under -0.6 -7.9 -2.4
March 31, 2014
New Mexico Educational Retirement BoardTotal Fund Performance Detail (Net of Fee)
56

*Performance shown is net of fees.
Market Value($)
% ofPortfolio
3 Mo(%)
FiscalYTD(%)
1 Yr(%)
3 Yrs(%)
5 Yrs(%)
10 Yrs(%)
Return(%) Since
_
Fixed Income Composite 3,675,340,397 33.7 2.3 6.4 6.4 7.7 11.5 6.4 2.8 Jan-85Barclays Aggregate 1.8 2.3 -0.1 3.7 4.8 4.5 7.5 Jan-85
Over/Under 0.5 4.1 6.5 4.0 6.7 1.9 -4.7Core Fixed Income Composite 1,126,437,843 10.3 2.5 3.1 0.6 4.7 7.7 4.8 5.9 Dec-99
Barclays Aggregate 1.8 2.3 -0.1 3.7 4.8 4.5 5.6 Dec-99Over/Under 0.7 0.8 0.7 1.0 2.9 0.3 0.3
Neuberger Berman 394,108,602 3.6 1.9 2.6 0.2 4.1 6.8 -- 5.6 Apr-06Barclays Aggregate 1.8 2.3 -0.1 3.7 4.8 4.5 5.2 Apr-06
Over/Under 0.1 0.3 0.3 0.4 2.0 0.4Pyramis 402,063,902 3.7 2.0 2.8 0.3 4.4 6.7 -- 5.7 Apr-06
Barclays Aggregate 1.8 2.3 -0.1 3.7 4.8 4.5 5.2 Apr-06Over/Under 0.2 0.5 0.4 0.7 1.9 0.5
WAMCO 330,265,338 3.0 3.7 4.0 1.5 5.9 10.4 -- 6.2 Apr-06Barclays Aggregate 1.8 2.3 -0.1 3.7 4.8 4.5 5.2 Apr-06
Over/Under 1.9 1.7 1.6 2.2 5.6 1.0Non-U.S. Emerging Market Debt Composite 200,761,394 1.8 1.0 -0.3 -4.6 -- -- -- 0.9 Sep-11
JP Morgan GBI - EM Diversified 1.9 -0.1 -7.1 1.1 9.8 9.3 -0.7 Sep-11Over/Under -0.9 -0.2 2.5 1.6
Pictet 116,510,366 1.1 1.4 -1.9 -8.9 -- -- -- -1.5 Sep-11JP Morgan GBI - EM Diversified 1.9 -0.1 -7.1 1.1 9.8 9.3 -0.7 Sep-11
Over/Under -0.5 -1.8 -1.8 -0.8Citi EMSO 84,251,028 0.8 0.4 2.1 2.1 -- -- -- 4.6 Sep-11
JP Morgan GBI - EM Diversified 1.9 -0.1 -7.1 1.1 9.8 9.3 -0.7 Sep-11Over/Under -1.5 2.2 9.2 5.3
March 31, 2014
New Mexico Educational Retirement BoardTotal Fund Performance Detail (Net of Fee)
57
Appendix: Market Environment
58

U.S. Economic Environment
Source: Bloomberg as of 3/31 Source: Bloomberg as of 3/31
Source: Bloomberg as of 4/30 Source: Bloomberg as of 3/31
Consumer confidence fell to 82.3 in March; the Case-Shillerhome price index (as of 12/31) dipped slightly to 150.39 from its highest level (150.92) since the financial crisis
Rolling 12 month CPI rose to 1.5% at the end of March; capacity utilization rose slightly to 79.2% in the month
GDP growth was revised downward in the first quarter, to 0.1%
Unemployment stayed flat at 6.7% in March; U-6 rose to 12.7%
4.1%4.1%4.1%4.1%4.1%
3.2%2.4%2.4%2.4%
‐8%
‐6%
‐4%
‐2%
0%
2%
4%
6%
8%
10% Real Gross Domestic Product Growth
0
30
60
90
120
150
180
210
1990
1991
1992
1993
1994
1995
1996
1997
1998
1999
2000
2001
2002
2003
2004
2005
2006
2007
2008
2009
2010
2011
2012
2013
Home Price Index and Consumer Confidence
S&P Case‐Shiller Home Price IndexConsumer Confidence
2.4%
0%
2%
4%
6%
8%
10%
12%
14%
16%
18%
20% Unemployment Rate vs. U‐6
Unemployment RateU‐6
60%
65%
70%
75%
80%
85%
90%
95%
100%
‐6%
‐3%
0%
3%
6%
9%
12%
15%
18%
1973
1975
1977
1979
1981
1983
1985
1987
1989
1991
1993
1995
1997
1999
2001
2003
2005
2007
2009
2011
2013
% of T
otal Cap
acity
Rolling
12 Mon
th CPI
Capacity Utilization vs. Rolling 12 Month CPI
12‐Mo CPICapacity Utilization
‐8%
‐6%
‐4%
‐2%
0%
2%
4%
6%
8%
10% Real Gross Domestic Product Growth0.1%
March 31, 2014
New Mexico Educational Retirement Board
59

Components of GDP
Source: Bloomberg as of 12/31 Source: Bloomberg as of 2/28
Source: Bloomberg as of 3/31 Source: Bloomberg as of 2/28
Corporate Profits as a percent of GDP remained near secular highs at 12.7% at the end of the fourth quarter
The trade deficit increased in February
Retail sales rose to a 2.2% year-over-year growth rate in March
The inventory-to-sales ratio has remained mostly flat since early 2010 and closed at 1.31 in February
‐10%
‐5%
0%
5%
10%
15%19
96
1997
1998
1999
2000
2001
2002
2003
2004
2005
2006
2007
2008
2009
2010
2011
2012
2013
2014
Annu
al % Cha
nge
Retail Sales
1.2
1.3
1.4
1.5
1.6
1993
1994
1995
1996
1997
1998
1999
2000
2001
2002
2003
2004
2005
2006
2007
2008
2009
2010
2011
2012
2013
2014
Inventory to Sales Ratio
‐$80
‐$70
‐$60
‐$50
‐$40
‐$30
‐$20
‐$10
$0
1995
1996
1997
1998
1999
2000
2001
2002
2003
2004
2005
2006
2007
2008
2009
2010
2011
2012
2013
Billion
s
U.S. Trade Surplus (Deficit)
6%
7%
8%
9%
10%
11%
12%
13%
1973
1975
1977
1979
1981
1983
1985
1987
1989
1991
1993
1995
1997
1999
2001
2003
2005
2007
2009
2011
2013
Corporate Profits as % of GDP
Profits/GDPAverage
New Mexico Educational Retirement Board
March 31, 2014
60
Key Economic Indicators
Source: Bureau of Economic Analysis, Congressional Budget Office as of 12/31 Source: Bloomberg as of 3/31
Source: Bloomberg as of 3/31 Source: Bloomberg as of 3/31
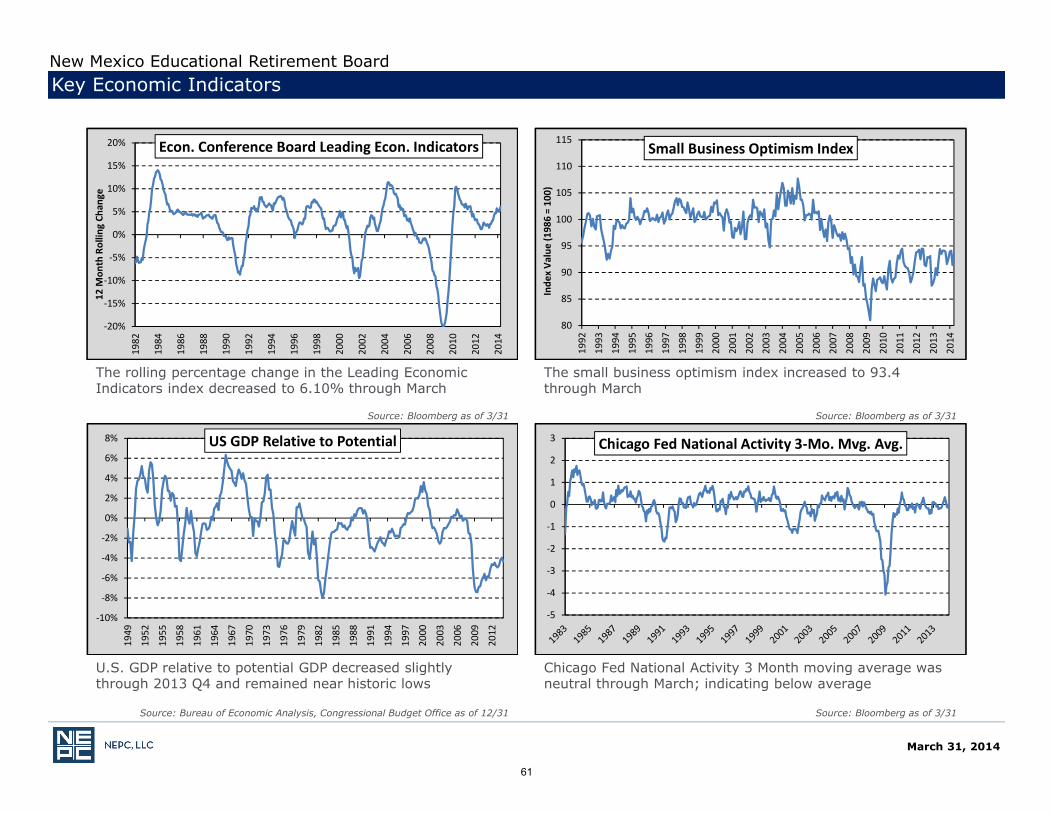
U.S. GDP relative to potential GDP decreased slightly through 2013 Q4 and remained near historic lows
Chicago Fed National Activity 3 Month moving average was neutral through March; indicating below average
The rolling percentage change in the Leading Economic Indicators index decreased to 6.10% through March
The small business optimism index increased to 93.4 through March
‐20%
‐15%
‐10%
‐5%
0%
5%
10%
15%
20%1982
1984
1986
1988
1990
1992
1994
1996
1998
2000
2002
2004
2006
2008
2010
2012
2014
12 M
onth Rollin
g Ch
ange
Econ. Conference Board Leading Econ. Indicators
80
85
90
95
100
105
110
115
1992
1993
1994
1995
1996
1997
1998
1999
2000
2001
2002
2003
2004
2005
2006
2007
2008
2009
2010
2011
2012
2013
2014
Inde
x Va
lue (198
6 = 10
0)
Small Business Optimism Index
‐5
‐4
‐3
‐2
‐1
0
1
2
3 Chicago Fed National Activity 3‐Mo. Mvg. Avg.
‐10%
‐8%
‐6%
‐4%
‐2%
0%
2%
4%
6%
8%
1949
1952
1955
1958
1961
1964
1967
1970
1973
1976
1979
1982
1985
1988
1991
1994
1997
2000
2003
2006
2009
2012
US GDP Relative to Potential
New Mexico Educational Retirement Board
March 31, 2014
61

Economic Environment – Monetary Policy and Banks
Source: Bloomberg as of 3/31Source: Bloomberg as of 9/30; All calculations converted to USD *GDP figure reflects
World Bank Euro Area GDP
Source: Bloomberg as of 3/31 Source: Bloomberg as of 3/31
Large economies continue easing, Japan to the extreme, while the ECB tightens
The Japanese Yen has strengthened 1.9% relative to the U.S. dollar in 2014; while the MSCI Japan TR Net Local Index returned (8.0)%
The Federal Reserve Bank balance sheet increased in early 2014 while the European Central Bank balance sheet decreased
Central bank assets worldwide have risen significantly since 2008
€0
€200
€400
€600
€800
€1,000
€1,200
€1,400
$0
$200
$400
$600
$800
$1,000
$1,200
$1,400
$1,600
$1,800
$2,000
Jan‐08
Apr‐08
Jul‐0
8Oct‐08
Jan‐09
Apr‐09
Jul‐0
9Oct‐09
Jan‐10
Apr‐10
Jul‐1
0Oct‐10
Jan‐11
Apr‐11
Jul‐1
1Oct‐11
Jan‐12
Apr‐12
Jul‐1
2Oct‐12
Jan‐13
Apr‐13
Jul‐1
3
Billion
s
Billion
s
US vs. Eurozone Excess Reserves
USEurozone
€400
€800
€1,200
€1,600
€2,000
€2,400
€2,800
€3,200
$500
$1,000
$1,500
$2,000
$2,500
$3,000
$3,500
$4,000
$4,500Jan‐08
Apr‐08
Jul‐0
8Oct‐08
Jan‐09
Apr‐09
Jul‐0
9Oct‐09
Jan‐10
Apr‐10
Jul‐1
0Oct‐10
Jan‐11
Apr‐11
Jul‐1
1Oct‐11
Jan‐12
Apr‐12
Jul‐1
2Oct‐12
Jan‐13
Apr‐13
Jul‐1
3Oct‐13
Jan‐14
Billion
s
Billion
s
Fed vs. ECB Balance Sheets
Fed
ECB
400
450
500
550
600
650
700
750
800
75
80
85
90
95
100
105
110
Apr‐12
May‐12
Jun‐12
Jul‐1
2Au
g‐12
Sep‐12
Oct‐12
Nov‐12
Dec‐12
Jan‐13
Feb‐13
Mar‐13
Apr‐13
May‐13
Jun‐13
Jul‐1
3Au
g‐13
Sep‐13
Oct‐13
Nov‐13
Dec‐13
Jan‐14
Feb‐14
Mar‐14
Japanese Yen Spot vs. MSCI Japan Local
Japanese Yen Spot USD (LHS)
MSCI Japan Local Index (RHS)
$0
$2,000,000
$4,000,000
$6,000,000
$8,000,000
$10,000,000
$12,000,000
$14,000,000
$16,000,000
$18,000,000
USD
(000
,000s)
Central Bank AssetsPBoC
SNB
BoJ
BoE
ECB
FED
New Mexico Educational Retirement Board
March 31, 2014
62

Looming Macro Uncertainties
Source: Morningstar as of 3/31 Source: Bloomberg as of 3/31
Source: Bloomberg as of 12/31 Source: Bloomberg as of 3/31
0%
5%
10%
15%
20%
25%
30%
S&P 500 MSCI EAFE MSCI EM BC US Agg Treasury BC US Corp HY
Market Volatility
1 Yr Return Std Dev
10 Yr Return Std Dev
0
5
10
15
20
25
30
Brazil Turkey Egypt China Russia
Misery Indices (Inflation + Unemployent)
12/31/201012/31/20123/31/2014
New Mexico Educational Retirement Board
March 31, 2014
63

S&P valuations rose in March and remained above the 10-year and long-term averages, which are nearly equal at 16.35x…
Market Environment – U.S. Equity
Source: Bloomberg as of 3/31
Source: Shiller Data as of 3/31; Long term average dates to 1/1/1926Source: Bloomberg as of 3/31; Long term average dates to 1/29/1954
Source: Bloomberg as of 3/31
…The cyclically adjusted Shiller PE Ratio, however, is above the long-term average of 17.57 and slightly above the 10-year average of 22.99
The VIX remained near historically low levels in March; the S&P 500 rose 0.8% on the month
QE1 QE2 Op. Twist
Op. Twist Ext. / QE3
0
5
10
15
20
25
30
35 Equity Valuations: S&P 500 P/E Ratio
P/E Ratio
10 Yr Avg
Long Term Avg
0
200
400
600
800
1000
1200
1400
1600
1800
2000
0
10
20
30
40
50
60
70
80
90
2003 2004 2005 2006 2007 2008 2009 2010 2011 2012 2013
S&P 50
0
VIX
VIX vs S&P 500VIX
S&P 500
0
5
10
15
20
25
30
35
40
45
50
2000 2001 2002 2003 2004 2005 2006 2007 2008 2009 2010 2011 2012 2013 2014
Cyclically Adjusted Shiller PE Ratios
PE Ratio
Long Term Avg
10 Yr Avg
New Mexico Educational Retirement Board
QE1 QE2 Op. Twist
Op. Twist Ext. / QE3
March 31, 2014
64

U.S. Stock Market Performance
Source: Bloomberg as of 3/31 Source: Bloomberg as of 3/31
Source: Bloomberg as of 3/31 Source: Bloomberg as of 3/31
Large value stocks have marginally outperformed large growth in 2014
Domestic equity has marginally outperformed international equity in 2014
All sectors are positive to start 2014 except for Consumer Discretionary
Large cap has marginally outperformed small cap in 2014
‐25%
‐15%
‐5%
5%
15%
25%
35%
1979
1980
1981
1982
1983
1984
1985
1986
1987
1988
1989
1990
1991
1992
1993
1994
1995
1996
1997
1998
1999
2000
2001
2002
2003
2004
2005
2006
2007
2008
2009
2010
2011
2012
2013
2014
Large Cap vs. Small Cap Equity Returns
Large Cap Outperforms
Small Cap Outperforms
‐55%
‐45%
‐35%
‐25%
‐15%
‐5%
5%
15%
25%
35%
1979
1980
1981
1982
1983
1984
1985
1986
1987
1988
1989
1990
1991
1992
1993
1994
1995
1996
1997
1998
1999
2000
2001
2002
2003
2004
2005
2006
2007
2008
2009
2010
2011
2012
2013
2014
Domestic vs. International Equity ReturnsDomestic Outperforms
Int'l Outperforms
‐35%
‐25%
‐15%
‐5%
5%
15%
25%
35%
1979
1980
1981
1982
1983
1984
1985
1986
1987
1988
1989
1990
1991
1992
1993
1994
1995
1996
1997
1998
1999
2000
2001
2002
2003
2004
2005
2006
2007
2008
2009
2010
2011
2012
2013
2014
Large Value vs. Large Growth Equity Returns
Value Outperforms
Growth Outperforms
New Mexico Educational Retirement Board
March 31, 2014
65

Non-U.S. Stock Performance
Source: Bloomberg as of 3/31 Source: Bloomberg as of 3/31
Source: Bloomberg as of 3/31 Source: Bloomberg as of 3/31
‐4% ‐2% 0% 2% 4% 6% 8%
Con.Discretionary (11.75%)
Con.Staples (11%)
Energy (6.91%)
Financials (25.58%)
Health Care (10.44%)
Industrials (12.92%)
Info Tech. (4.53%)
Materials (8.15%)
Telecom (4.96%)
Utilities (3.76%)
MSCI EAFE Sector Returns (Wgts.)
YTD
3 Month
4
6
8
10
12
14
16
18
20
Jan‐05
May‐05
Sep‐05
Jan‐06
May‐06
Sep‐06
Jan‐07
May‐07
Sep‐07
Jan‐08
May‐08
Sep‐08
Jan‐09
May‐09
Sep‐09
Jan‐10
May‐10
Sep‐10
Jan‐11
May‐11
Sep‐11
Jan‐12
May‐12
Sep‐12
Jan‐13
May‐13
Sep‐13
Jan‐14
EAFE and EM Equity P/E Ratio
MSCI EAFE
MSCI EM*Ex‐Negative Earners
‐60%
‐40%
‐20%
0%
20%
40%
60%
1992
1993
1994
1995
1996
1997
1998
1999
2000
2001
2002
2003
2004
2005
2006
2007
2008
2009
2010
2011
2012
2013
2014
Developed vs. Emerging Markets Equity Returns
Emerging Outperforms
Developed Outperforms
Developed Market Equity Returns (U.S. Dollars)YTD 3-Mo 1 Yr. 3 Yr. Ann.
Europe ex UK 3.1% 3.1% 25.4% 5.0%United Kingdom -1.8% -1.8% 12.5% 4.9%Japan -6.3% -6.3% 5.7% 3.3%Pacific Ex Japan 2.0% 2.0% -2.4% 0.5%Canada 1.0% 1.0% 4.0% -3.9%USA 1.3% 1.3% 19.5% 12.3%
US Dollar Return vs. Major Foreign Currencies(Negative = Dollar Depreciates, Positive = Dollar Appreciates)
YTD 3-Mo 1 Yr. 3 Yr. Ann.Euro -0.2% -0.2% -7.4% 0.9%Japanese Yen -2.0% -2.0% 8.7% 7.0%British Pound -0.6% -0.6% -9.6% -1.3%Canada 3.9% 3.9% 7.9% 4.2%Australia -3.9% -3.9% 11.1% 3.6%
Currency Impact on Developed Mkt. Returns(Negative = Currency Hurt, Positive = Currency Helped)
YTD 3-Mo 1 Yr. 3 Yr. Ann.MSCI EAFE (Local) -0.3% -0.3% 15.4% 8.9%MSCI EAFE (USD) 0.7% 0.7% 17.6% 7.2%Currency Impact 0.9% 0.9% 2.2% -1.7%
New Mexico Educational Retirement Board
March 31, 2014
66

Emerging Markets
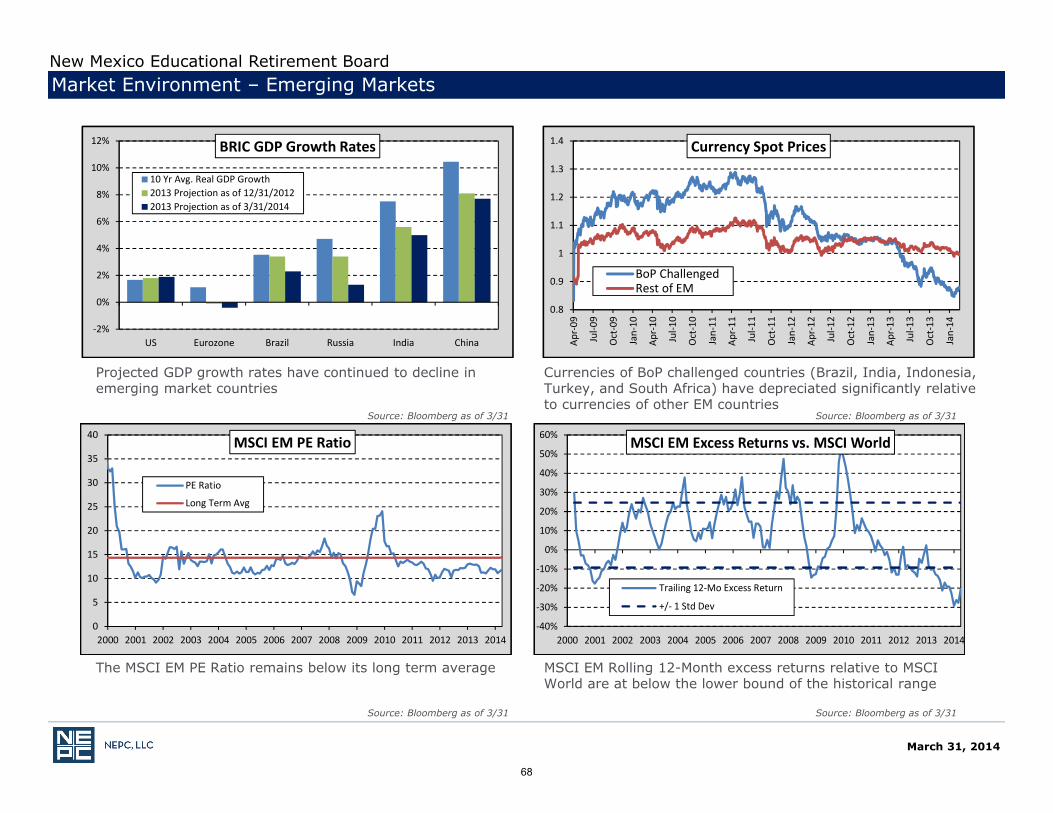
- MSCI EM PE, PB, and PS Ratios are below historical averages- MSCI EM Small Cap PE, PB, and PS are all above historical averages
Source: Bloomberg as of 3/31 Source: Bloomberg as of 3/31
Source: Bloomberg as of 3/31 Source: Bloomberg as of 3/31
Emerging Markets ValuationMSCI EM MSCI EM Small Cap
PE Ratio 11.87 21.10
PE Historical Avg 14.43 18.22
PB Ratio 1.49 1.32
Historical Avg 1.53 1.27
PS Ratio 1.02 0.77
Historical Avg 1.12 0.71
US Dollar Return vs. Major EM Currencies
(Negative = Dollar Depreciates, Positive = Dollar Appreciates)
YTD 3-Mo 1 Yr. 3 Yr. Ann.
Brazilian Real -4.1% -4.1% 11.0% 10.4%
Russian Ruble 6.2% 6.2% 11.4% 6.8%
Indian Rupee -3.3% -3.3% 9.0% 9.4%
Chinese Renminbi 2.6% 2.6% 0.1% -1.7%
Singapore Dollar -0.2% -0.2% -0.9% -0.9%
Hungarian Forint 3.0% 3.0% -6.4% 5.6%Turkish Lira -0.3% -0.3% 15.5% 10.3%
Mexican Peso 0.2% 0.2% 5.7% 3.0%
So. African Rand 0.3% 0.3% 12.3% 13.7%
So. Korean Won 1.1% 1.1% -4.5% -1.1%
0%
2%
4%
6%
8%
10%
12%
Brazil Russia India China
BRIC GDP Growth Rates
10 Yr Avg. Real GDP Growth
Projected 2014 Real GDP Growth
0
1
2
3
4
5
6
7
8
2003 2004 2005 2006 2007 2008 2009 2010 2011 2012 2013
EM Sovereign Bond Spread
EM (Local) ‐ US Bond Spread
Average
New Mexico Educational Retirement Board
March 31, 2014
67
Market Environment – Emerging Markets
Source: Bloomberg as of 3/31 Source: Bloomberg as of 3/31
Source: Bloomberg as of 3/31 Source: Bloomberg as of 3/31
The MSCI EM PE Ratio remains below its long term average MSCI EM Rolling 12-Month excess returns relative to MSCI World are at below the lower bound of the historical range
Projected GDP growth rates have continued to decline in emerging market countries
Currencies of BoP challenged countries (Brazil, India, Indonesia, Turkey, and South Africa) have depreciated significantly relative to currencies of other EM countries
‐40%
‐30%
‐20%
‐10%
0%
10%
20%
30%
40%
50%
60%
2000 2001 2002 2003 2004 2005 2006 2007 2008 2009 2010 2011 2012 2013 2014
MSCI EM Excess Returns vs. MSCI World
Trailing 12‐Mo Excess Return
+/‐ 1 Std Dev
0
5
10
15
20
25
30
35
40
2000 2001 2002 2003 2004 2005 2006 2007 2008 2009 2010 2011 2012 2013 2014
MSCI EM PE Ratio
PE Ratio
Long Term Avg
‐2%
0%
2%
4%
6%
8%
10%
12%
US Eurozone Brazil Russia India China
BRIC GDP Growth Rates
10 Yr Avg. Real GDP Growth2013 Projection as of 12/31/20122013 Projection as of 3/31/2014
0.8
0.9
1
1.1
1.2
1.3
1.4
Apr‐09
Jul‐0
9
Oct‐09
Jan‐10
Apr‐10
Jul‐1
0
Oct‐10
Jan‐11
Apr‐11
Jul‐1
1
Oct‐11
Jan‐12
Apr‐12
Jul‐1
2
Oct‐12
Jan‐13
Apr‐13
Jul‐1
3
Oct‐13
Jan‐14
Currency Spot Prices
BoP ChallengedRest of EM
New Mexico Educational Retirement Board
March 31, 2014
68

Market Environment – Interest Rates
Source: Bloomberg as of 3/31 Source: Citigroup as of 3/31
Source: US Treasury as of 3/31 Source: Bloomberg as of 3/31
Fed Funds rate remains at 0.25% while the 10-year Treasury Yield finished March at 2.72%
The Citi Pension discount rate fell to 4.54% through March
Bond yields across the globe have mostly declined in 20140.0%
0.5%
1.0%
1.5%
2.0%
2.5%
3.0%
3.5%
4.0%
4.5%
5.0%
0 5 10 15 20 25 30Years to Maturity
U.S. Treasury Yield Curve
Mar‐14
Dec‐13
Dec‐12
Dec‐100%
1%
2%
3%
4%
5%
6%
7%
8%
US UK Euro Japan Australia EM
Global Bond Yields
12/31/13
3/31/14
0%
1%
2%
3%
4%
5%
6%
7%
8%
9%
1993
1994
1995
1996
1997
1998
1999
2000
2001
2002
2003
2004
2005
2006
2007
2008
2009
2010
2011
2012
2013
2014
10 Year Treasury vs. Fed Funds Rate
10 YR Treasury
Fed Funds Rate
New Mexico Educational Retirement Board
3%
4%
5%
6%
7%
8%
9%
1995
1996
1997
1998
1999
2000
2001
2002
2003
2004
2005
2006
2007
2008
2009
2010
2011
2012
2013
2014
Citigroup Pension Liabililty Index
March 31, 2014
69

Fixed Income Performance
Source: Barclays as of 3/31 Source: Barclays, Bloomberg as of 3/31
Source: Barclays as of 3/31 Source: Barclays as of 3/31
0%
1%
2%
3%
4%
5%
6%
7%
8%
9%
1‐3 Yr. Trs. 3‐5 Yr. Trs. 7‐10 Yr.Trs.
25+ Yr.Trs.
Core High Yield GlobalBond
EMD
Fixed Income Returns
3 Month
YTD
0
200
400
600
800
1000
1200
1400
2003 2004 2005 2006 2007 2008 2009 2010 2011 2012 2013 2014
Basis P
oints
Corporate Spreads
Aa
A
Baa
Ba
‐2%
‐1%
0%
1%
2%
3%
4%
5%
6%
WGBI US UK Japan Canada Australia JPM EMBI
Global Bond Returns
3 Month
YTD
0.0%
1.0%
2.0%
3.0%
4.0%
5.0%
6.0%
7.0%
Treasuries Agencies MBS ABS Inv.Gr.Corp.
Inter. Corp. Long Corp.
Investment Grade Sector Returns
3 Month
YTD
New Mexico Educational Retirement Board
March 31, 2014
70

Market Environment – Commodities
Source: Bloomberg as of 3/31
Source: Bloomberg as of 3/31Source: Bloomberg as of 3/31
Source: Bloomberg as of 3/31
Corn prices finished March up at $4.77 per bushelOil prices finished March down at $101.58 per barrel
Gold prices finished March down at $1284.01 per ounceMany commodity futures’ prices are ‘contangoed’, meaning a higher forward price is expected relative to the current spot
$0
$1
$2
$3
$4
$5
$6
$7
$8
$9
2002 2003 2004 2005 2006 2007 2008 2009 2010 2011 2012 2013 2014
Corn Spot Price Per Bushel
$0
$200
$400
$600
$800
$1,000
$1,200
$1,400
$1,600
$1,800
$2,000
2002 2003 2004 2005 2006 2007 2008 2009 2010 2011 2012 2013 2014
Gold Spot Price Per Ounce
$0
$20
$40
$60
$80
$100
$120
$140
$160
2002 2003 2004 2005 2006 2007 2008 2009 2010 2011 2012 2013 2014
Oil Spot Price Per Barrel
New Mexico Educational Retirement Board
March 31, 2014
71
• The client’s custodian bank is NEPC’s preferred data source unless otherwise directed.NEPC reconciles custodian data to manager data. If the custodian cannot provideaccurate data, manager data may be used.
• Trailing time period returns are determined by geometrically linking the holdingperiod returns, from the first full month after inception to the report date. Rates ofReturn are annualized when the time period is longer than a year. Performance ispresented gross and/or net of fees as indicated.
• For managers funded in the middle of a month, the ‘since inception’ return will startwith the first full month, although actual inception dates and cash flows are includedin all respective Composite calculations.
• This report may contain forward-looking statements that are based on NEPC’sestimates, opinions and beliefs, but NEPC cannot guarantee that any plan will achieveits targeted return or meet other goals.
Reporting Methodology
March 31, 2014
New Mexico Educational Retirement Board
72

• Past performance is no guarantee of future results.
• All investments carry some level of risk. Diversification and other asset allocationtechniques are not guaranteed to ensure profit or protect against losses.
• Some index returns displayed in this report or used in calculation of a policy,allocation or custom benchmark may not be available from the source or may bepreliminary and subject to change.
• NEPC’s source for portfolio pricing, calculation of accruals, and transactioninformation is the Plan’s custodian bank. Information on market indices and securitycharacteristics is received from other sources external to NEPC. While NEPC hasexercised reasonable professional care in preparing this report, we cannot guaranteethe accuracy of all source information contained herein.
• This report is provided as a management aid for the client’s internal use only.Performance in this report does not constitute a recommendation by NEPC.
• This report may contain confidential or proprietary information and may not be copiedor redistributed to any party not legally entitled to receive it.
Information Disclaimer
March 31, 2014
New Mexico Educational Retirement Board
73


